
Purification Scale-Up and Technology Transfer for Lonza Biologics 20,000 L cGMP Facility
IBC Bioprocess International Conference & Exhibition 21st September, 2005
David PageLONZA Biologics, Portsmouth, NH

slide 2
Facility Background
20,000 L LSBO manufacturing facilityMulti-product facility3 production bioreactors
Design CapabilityManufacture of antibodies and other recombinant proteinsDesigned to accommodate 2 g/L fermentation titresBatch harvested every 5-6 daysDesigned to process 4 chromatography stepsDesigned to process 3 UF stepsVI hold and VRF Bulk Fill operation

slide 3
20,000 L Schematic
Centrifuge
FinishedGoods
Distributed toCustomers
FinalFiltration
2m column
Media Prep
Viralfiltration
FEEDS FEEDSFEEDS
Inoculum
Depth Filtration
Buffer Prep/Hold
0.22umFiltration
QC/QA
HarvestTank
2m column
1.4m column
1.4m column
1.4m column
TRAIN A TRAIN B TRAIN C
Conc/Diafil
Conc/Diafil
SUITE D SUITE C
SUITE CSUITE BSUITE AConc/Diafil
Conc/Diafil

slide 4
Downstream Facility Photos
Suite B 1.4 & 2.0m columns Suite B UF skids

slide 5
Downstream Overview
Chrom 1
Purification HoldTanks
SUITE A
Chrom 3
UF Concentration/Diafiltration
VRF
SUITE C
Chrom 4
UF Concentration/Diafiltration
Bulk Fill
SUITE D
Chrom 2
UF Concentration/Diafiltration
SUITE B

slide 6
Tech Transfer Overview
• Key activities:1. Gap Analysis2. Pilot evaluation3. Process Design4. Facility Start-Up5. Development Runs/Scale-Up
– Training– Data Comparability
6. cGMP Engineering Runs– Process Description – Batch Records
7. Process Validation8. Commercial Production
slide 7
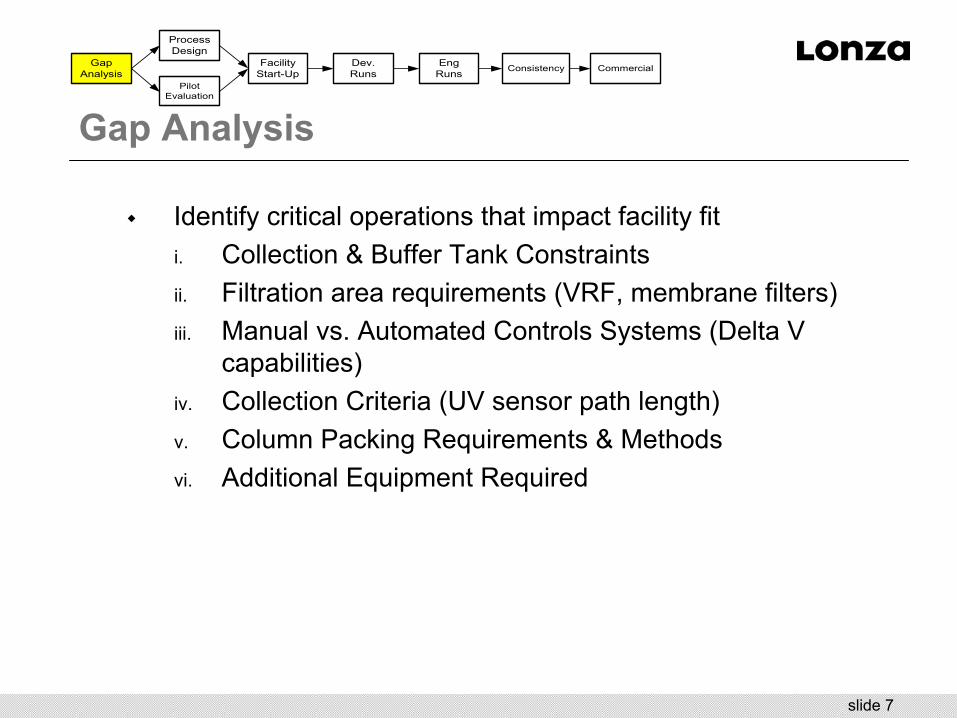
Gap Analysis
Identify critical operations that impact facility fiti. Collection & Buffer Tank Constraintsii. Filtration area requirements (VRF, membrane filters)iii. Manual vs. Automated Controls Systems (Delta V
capabilities)iv. Collection Criteria (UV sensor path length)v. Column Packing Requirements & Methodsvi. Additional Equipment Required
PilotEvaluation
ProcessDesign
GapAnalysis
FacilityStart-Up Consistency CommercialDev.
RunsEng
Runs

slide 8
Pilot Evaluations
• Aims & Objectives– Gain operations experience and product characteristics– Obtain sizing data for filters– Evaluate new/modified unit operations
• Equipment was a direct scale-down of LSBO equipmenti. 40cm Euroflow Resolute columnii. Euroflow packing skid and hydraulics
– Reproducible methods required for large scale– First time success is critical (product changeover)
iii. 0.5m2 flat sheet UF membranes
PilotEvaluation
ProcessDesign
GapAnalysis
FacilityStart-Up Consistency CommercialDev.
RunsEng
Runs

slide 9
Pilot Evaluations (cont.)
• Obtained filter sizing data for key steps• High throughput 0.2µm filters required for scale-up
– Optimization required for facility fit – Filter 1 selected to minimize filtration surface area
Capture Column Guard Filtration
0.0
10.0
20.0
30.0
40.0
50.0
60.0
Filter 1 Filter 2 Filter 3 Filter 4
No.
30"
Ele
men
ts
6 x 30” housing avail.
PilotEvaluation
ProcessDesign
GapAnalysis
FacilityStart-Up Consistency CommercialDev.
RunsEng
Runs

slide 10
Pilot Evaluations (cont.)
• UF optimization– New unit operation for required facility fit– Operate within membrane controlled (linear) region– Confirm flux decay to determine processing time
0.0 0.5 1.0 1.5 2.0 2.50
50
100
150
200
250
300
350
0
50
100
150
200
250
300
350
Per
mea
te F
lux
(L.m
-2.h
-1)
T ransm em brane Pressure (bar)
420 L.m -2.h-1 Crossflow 480 L.m -2.h-1 Crossflow
PilotEvaluation
ProcessDesign
GapAnalysis
FacilityStart-Up Consistency CommercialDev.
RunsEng
Runs
slide 11
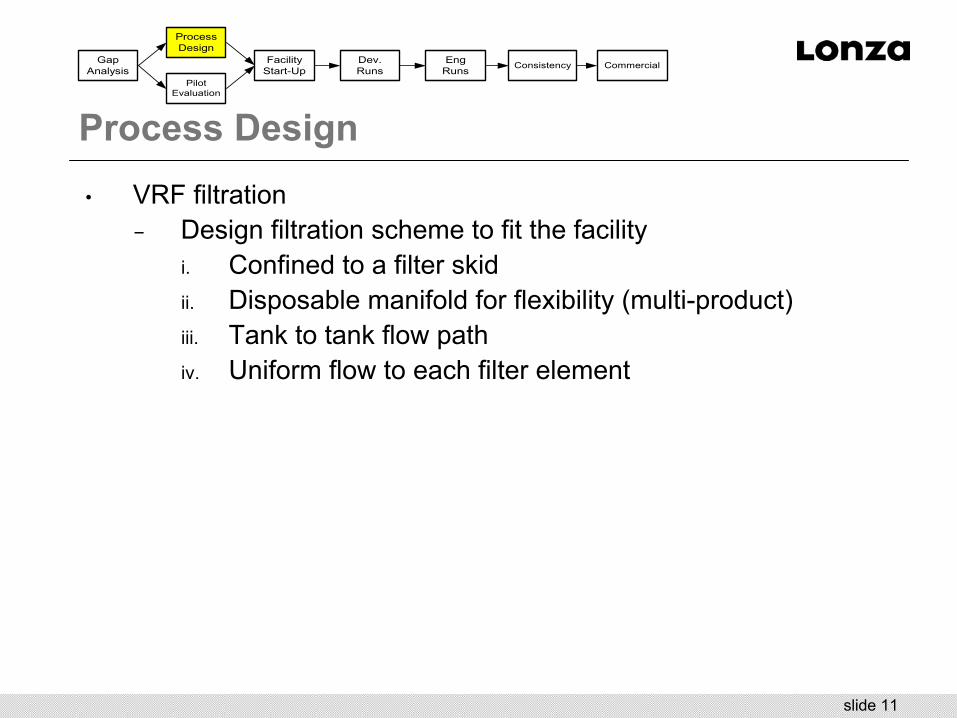
Process Design• VRF filtration
– Design filtration scheme to fit the facilityi. Confined to a filter skidii. Disposable manifold for flexibility (multi-product)iii. Tank to tank flow pathiv. Uniform flow to each filter element
PilotEvaluation
ProcessDesign
GapAnalysis
FacilityStart-Up Consistency CommercialDev.
RunsEng
Runs

slide 12
Process Design (cont.)
• Custom manifold design– Both in-house designs required for contingency– Demonstrated that both are operationally viable– Modular, autoclaved, disposable and SIP’d onto filter skid
PilotEvaluation
ProcessDesign
GapAnalysis
FacilityStart-Up Consistency CommercialDev.
RunsEng
Runs

slide 13
Process Design (cont.)
• Considerations– Request auto-cad drawings– Approve designs 3 months prior to implementation
– Field verify all designs and flow paths– Careful attention to lead times
– Build in safety margin for design and raw materials– Build in contingency for stable hold points
PilotEvaluation
ProcessDesign
GapAnalysis
FacilityStart-Up Consistency CommercialDev.
RunsEng
Runs

slide 14
Start-Up Activities
• Column packing performed at scale 6 months prior– HETP test method optimized– Evaluate range of bed heights for each column
• Wet-test of equipment– Test/modify logic parameters– Performed for untested unit operations
i. VRF step (transfer parameters)ii. UF (new skid, fed-batch operation)
PilotEvaluation
ProcessDesign
GapAnalysis
FacilityStart-Up Consistency CommercialDev.
RunsEng
Runs

slide 15
Manufacturing Campaigns
• OverviewDevelopment runs
Processed with draft batch records (BR)cGMP Engineering runs
Manufacturing operations compliant with cGMPQA approved BR’s
Process Consistency
slide 16
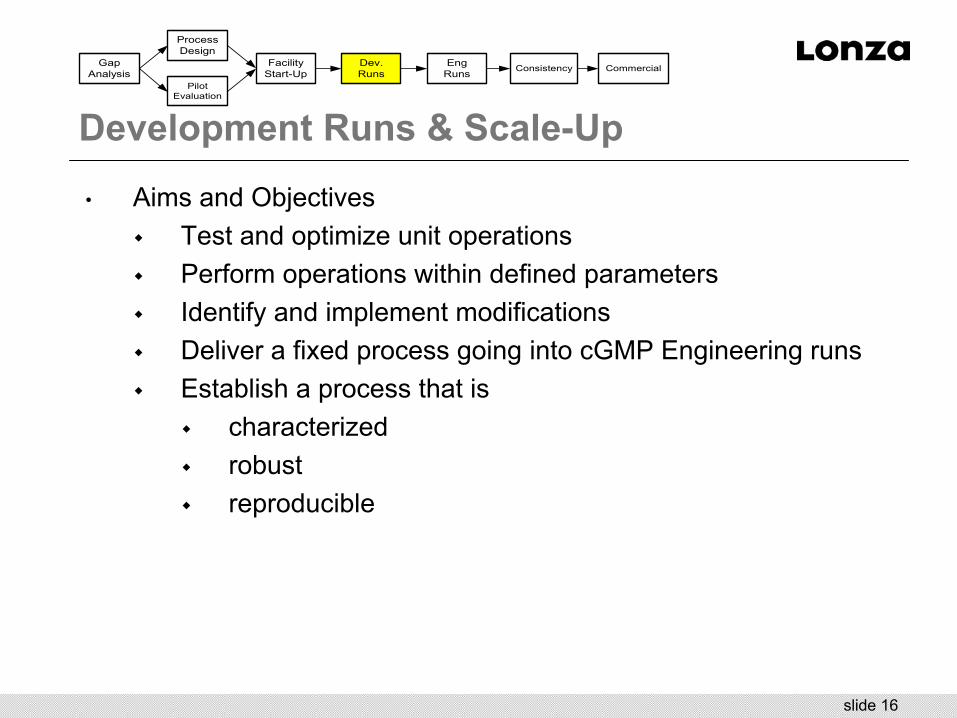
Development Runs & Scale-Up
• Aims and ObjectivesTest and optimize unit operationsPerform operations within defined parametersIdentify and implement modificationsDeliver a fixed process going into cGMP Engineering runsEstablish a process that is
characterizedrobust reproducible
PilotEvaluation
ProcessDesign
GapAnalysis
FacilityStart-Up Consistency CommercialDev.
RunsEng
Runs

slide 17
Development Runs & Scale-Up (cont.)
• Optimize operationsSkid priming (air removal)Determine back-pressure within process lines (fine tune pressure set-points)Maximize recoveries (flush following load/elution)
PilotEvaluation
ProcessDesign
GapAnalysis
FacilityStart-Up Consistency CommercialDev.
RunsEng
Runs

slide 18
Development Runs & Scale-Up (cont.)• Optimize operations (cont.)
Confirm/adjust UF operating parameters– TMP vs. flux measurements at constant cross-flow– Minimize involvement of permeate PCV in TMP control
TMP vs. Permeate Flux
0
20
40
60
80
100120
140
160
180
200
220
2.0 4.0 6.0 8.0 10.0 12.0 14.0 16.0 18.0 20.0 22.0TMP (psi)
Per
mea
te F
lux
(LM
H)
0.0
10.0
20.0
30.0
40.0
50.0
60.0
70.0
80.0
90.0
100.0
Per
mea
te P
CV (%
open
)20kL scale TMP-fluxPermeate PCV
252 LPM
262 LPM
PilotEvaluation
ProcessDesign
GapAnalysis
FacilityStart-Up Consistency CommercialDev.
RunsEng
Runs

slide 19
Development Runs & Scale-Up (cont.)• Identify logic parameters that control operations
– Recognize and resolve code issues (transfers, load cell vs. flow meter)– Determine Delta V operating parameters (pump output %, PCV settings)
• Characterize process– Compare IP and release testing results to acceptance criteria– Perform AKTA “use” test with production buffers/supplies – Sample map for peak profiling and UF characterization
PilotEvaluation
ProcessDesign
GapAnalysis
FacilityStart-Up Consistency CommercialDev.
RunsEng
Runs
Elution Overlays
Collection Volume (CV)
UV
Abs
. (O
D)
2.6cm Cell Sim2.0m DR3 2.0m ENG 4
End of collection

slide 20
Elution Process Parameters
0.0
10.0
20.0
30.0
40.0
50.0
60.0
70.0
80.0
90.0
100.0
0.0 0.2 0.4 0.6 0.8 1.0 1.2 1.4 1.6 1.8 2.0 2.2 2.4 2.6 2.8 3.0 3.2 3.4Column Volumes (CV)
Flow
(L/m
in),
Col
umn
Inle
t (ps
i)
0.0
2.0
4.0
6.0
8.0
10.0
12.0
14.0
16.0
18.0
20.0
UV
Abs
. OD
Pressure Control Valve
Outlet Flow (L/min)
Column Inlet Pressure
Outlet UV Meter 2
Development Runs & Scale-Up (cont.)• Process Modifications
Respond to unexpected process events– Disruption of elution operation at increased bed height – Placed in hold due to large ∆P across column
Elution Process Parameters
0
10
20
30
40
50
60
70
80
90
100
0.0 0.2 0.4 0.6 0.8 1.0 1.2 1.4 1.6 1.8 2.0 2.2 2.4 2.6 2.8 3.0 3.2 3.4Column Volumes (CV)
Flow
(L/m
in),
Col
umn
Inle
t (ps
i)
0.0
2.0
4.0
6.0
8.0
10.0
12.0
14.0
16.0
18.0
20.0
UV
Abs
. (O
D)
Pressure Control Valve
Outlet Flow (L/min)
Column Inlet Pressure
UV Abs. (OD)
Column Inlet Pressure (blue) 59psi
Column Inlet Pressure (blue) 37psi
PilotEvaluation
ProcessDesign
GapAnalysis
FacilityStart-Up Consistency CommercialDev.
RunsEng
Runs
Issue Solution

slide 21
Development Runs & Scale-Up (cont.)
• ConsiderationsDefine process as early as possibleDesign process for variety of fermentation outcomesConservative estimate of buffer usage (skid prime, line hold-up, ILD)Scheduled adequate time for wet-testing, documentation and validationDelta V controls studio on-line to troubleshoot code real-time
PilotEvaluation
ProcessDesign
GapAnalysis
FacilityStart-Up Consistency CommercialDev.
RunsEng
Runs
slide 22
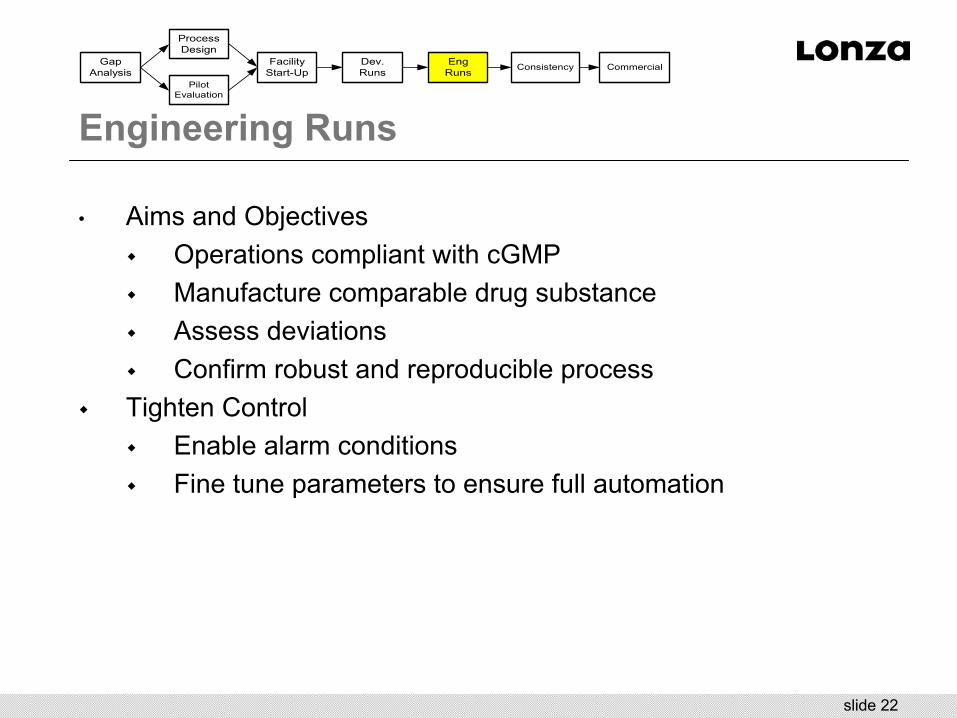
Engineering Runs
• Aims and ObjectivesOperations compliant with cGMPManufacture comparable drug substanceAssess deviationsConfirm robust and reproducible process
Tighten ControlEnable alarm conditionsFine tune parameters to ensure full automation
PilotEvaluation
ProcessDesign
GapAnalysis
FacilityStart-Up Consistency CommercialDev.
RunsEng
Runs

slide 23
Engineering Runs (cont.)
• Demonstrate Reproducibility
PilotEvaluation
ProcessDesign
GapAnalysis
FacilityStart-Up Consistency CommercialDev.
RunsEng
Runs
Eng Runs Elution Overlays
0.0 0.2 0.4 0.6 0.8 1.0 1.2 1.4 1.6 1.8 2.0 2.2 2.4 2.6 2.8 3.0 3.2 3.4 3.6 3.8 4.0 4.2Column Volumes (CV)
UV
Abs
. (O
D)

slide 24
Consistency & Commercialization
• Aims and ObjectivesDemonstrate lot to lot consistencyMeet Critical Process Parameter (CPP) criteriaMeet in-process and DS release specificationsAssess deviations
PilotEvaluation
ProcessDesign
GapAnalysis
FacilityStart-Up Consistency CommercialDev.
RunsEng
Runs

slide 25
Consistency & Commercialization (cont.)
• Deviation AssessmentComplex due to automated facilityRequires knowledge of in code, P&ID’s, operationsCase in point (UF over-concentration)– Goal: concentration target– Verify: calculation in phase logic – Phase end-point: totalized permeate volume removed– Assumption: target accounts for skid hold-up volume– Problem: membrane equilibration did not incorporate retentate
return line (field and P&ID verified)– Result: amount of over-concentration equals void volume– Solution: Include factor in BR to reduce permeate volume
target in logic
PilotEvaluation
ProcessDesign
GapAnalysis
FacilityStart-Up Consistency CommercialDev.
RunsEng
Runs

slide 26
Conclusions
• Rapid facility start-up and validation of multiple products– Start of Engineering Design: October 2000– Broke ground: September 2001– Pilot Run: March 2004– GMP Production: August 2004– First Approval to Manufacture: September 2005
• Success Required:– Careful attention to facility design– Pilot and scale-up models– Clear and decisive communication– Commitment from multi-disciplinary groups
• Important to have full customer interaction and support

slide 27
Acknowledgements
• Jim Davies• Bruce McCafferty• Martin Smith• Ken Green• Carol Knevelman


