
Public Debt Sustainability Analysis for Market Access Countries (MACs):
The IMF’s Framework
September 20151
S. Ali AbbasInternational Monetary Fund

Outline
Risk -‐ Based Approach
Lower Scrutiny DSA (Basic DSA)
Realism of Baseline Assumptions
Motivation for 2013 “MAC DSA” reform
Higher Scrutiny DSA (Additional modules)
Heat Map: Stress Tests and Debt Profile
Fan Charts
DSA Write Up
2

Traditionally, the focus was mainly on debt trajectories….
3

Key Features of the MAC DSA
• More analysis for countries with potentially greater vulnerabilities
Risk -‐ based approach
• Realism of underlying assumptions• Risks to debt level, gross financing needs, and debt profile, macro-‐fiscal nexus, and bank-‐sovereign nexus
Multifaceted analysis
• Standardized charts and tables, fan charts, heat map, write-‐up
Clear and transparent presentation of results
4
Risk assessment based on benchmarks derived from early warning model
Toolkit is flexible and can be tailored to country-‐specific circumstances

Risk-‐Based Approach
Public debt to GDP > 50/60% for EMs/AEs
Public gross financing needs (GFN) to GDP > 10/15% for EMs/AEs
Exceptional access to Fund resources
Lower scrutiny Higher scrutinyJudgment
5

6
Risk-‐Based Outputs
Basic DSA
DSA write-‐up
Basic DSA
Realism of baseline assumptions
Heat map, stress tests, debt profile, fan charts
where relevant Customized and contingent liabilities analysis
Lower scrutiny Higher scrutiny
6

Basic DSA -‐ 1
As of June 15, 20142/ 2012 2013 2014 2015 2016 2017 2018 2019 Sovereign Spreads
Nominal gross public debt 48.9 85.9 94.0 98.7 101.2 102.3 102.3 101.3 99.8 EMBIG (bp) 3/ 160
Public gross financing needs 11.1 22.0 20.8 20.5 20.0 19.4 18.7 18.0 17.4 5Y CDS (bp) 90
Real GDP growth (in percent) 1.6 -‐1.6 -‐1.2 1.2 1.6 1.7 1.8 1.9 2.0 Ratings Foreign LocalInflation (GDP deflator, in percent) 2.5 0.0 0.6 -‐0.1 0.8 1.0 1.1 1.4 1.4 Moody's Baa2 Baa2Nominal GDP growth (in percent) 4.2 -‐1.6 -‐0.6 1.1 2.3 2.7 3.0 3.3 3.4 S&Ps BBB BBBEffective interest rate (in percent) 4/ 4.3 4.3 4.0 3.8 3.7 3.6 3.6 3.6 3.7 Fitch BBB+ BBB+
Debt, Economic and Market Indicators 1/
Projections2003-‐2011
Actual
-‐10
-‐5
0
5
10
15
20
2003 2004 2005 2006 2007 2008 2009 2010 2011 2012 2013 2014 2015 2016 2017 2018 2019
Debt-‐Creating Flows
Primary deficit Real GDP growth Real interest rate Exchange rate depreciation Other debt-‐creating flows ResidualChange in gross public sector debt
projection
(in percent of GDP)
-‐15
-‐10
-‐5
0
5
10
15
20
cumulative
7
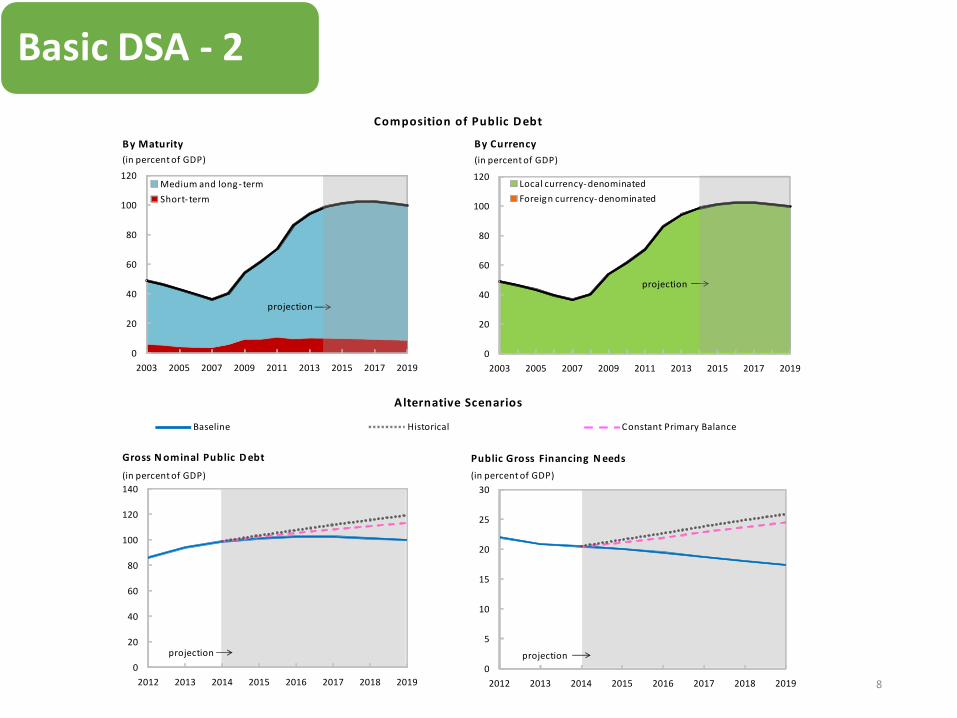
Basic DSA -‐ 2
Alternative Scenarios
Composition of Public Debt
Baseline Historical Constant Primary Balance
0
20
40
60
80
100
120
140
2012 2013 2014 2015 2016 2017 2018 2019
Gross Nominal Public Debt(in percent of GDP)
projection0
5
10
15
20
25
30
2012 2013 2014 2015 2016 2017 2018 2019
Public Gross Financing Needs(in percent of GDP)
projection
0
20
40
60
80
100
120
2003 2005 2007 2009 2011 2013 2015 2017 2019
By Maturity
Medium and long-‐ termShort-‐ term
projection
(in percent of GDP)
0
20
40
60
80
100
120
2003 2005 2007 2009 2011 2013 2015 2017 2019
By Currency
Local currency-‐denominatedForeign currency-‐denominated
projection
(in percent of GDP)
8

Risk-‐Based Outputs
Basic DSA
DSA write-‐up
Basic DSA
Realism of baseline assumptions
Heat map, stress tests, debt profile, fan charts
where relevant Customized and contingent liabilities analysis
Lower scrutiny Higher scrutiny
9
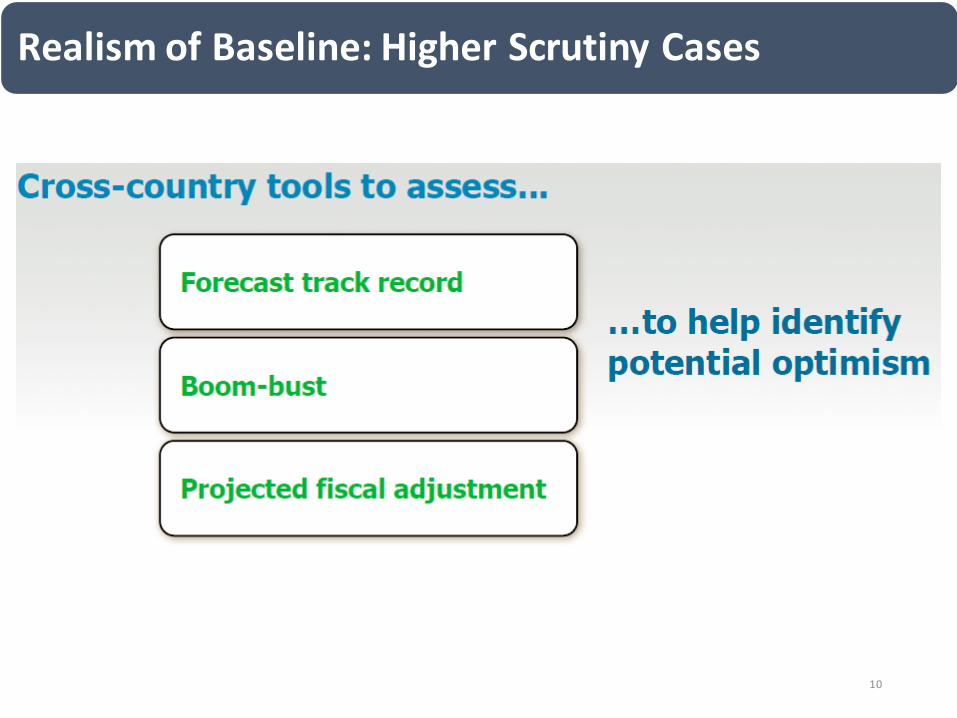
Realism of Baseline: Higher Scrutiny Cases
10

Realism of Baseline
Source : IMF Staff.1/ Plotted distribution includes surveillance countries, percentile rank refers to all countries.2/ Projections made in the spring WEO vintage of the preceding year.3/ Not applicable for Italy.4/ Data cover annual obervations from 1990 to 2011 for advanced and emerg ing economies with debt g reater than 60 percent of GDP. Percent of sample on vertical axis. 5/ For Italy the bulk of the adjustment already occurred in 2012 and the pace of consolidation slows to 1 percent of GDP in 2013.
Italy Public DSA -‐ Realism of Baseline Assumptions
Forecast Track Record, versus surveillance countries
Boom-‐Bust Analysis 3/Assessing the Realism of Projected Fiscal Adjustment
-‐10
-‐8
-‐6
-‐4
-‐2
0
2
4
6
2004 2005 2006 2007 2008 2009 2010 2011 2012Year 2/
Real GDP Growth
Interquartile range (25-‐75)MedianItaly forecast error
-‐ 1.467%Has a percentile rank of:
Italy median forecast error, 2004-‐2012:
Distribution of forecast errors: 1/
(in percent, actual-‐projection)
-‐10
-‐8
-‐6
-‐4
-‐2
0
2
4
2004 2005 2006 2007 2008 2009 2010 2011 2012Year 2/
Primary Balance
Interquartile range (25-‐75)MedianItaly forecast error
0.4968%Has a percentile rank of:
Italy median forecast error, 2004-‐2012:
Distribution of forecast errors: 1/
(in percent of GDP, actual-‐projection)
-‐6
-‐4
-‐2
0
2
4
6
8
10
2004 2005 2006 2007 2008 2009 2010 2011 2012Year 2/
Inf lation (Deflator)
Interquartile range (25-‐75)MedianItaly forecast error
-‐ 0.1713%Has a percentile rank of:
Italy median forecast error, 2004-‐2012:
Distribution of forecast errors: 1/
(in percent, actual-‐projection)
pessim
istic
optim
istic
-‐6
-‐4
-‐2
0
2
4
6
8
t-‐5 t-‐4 t-‐3 t-‐2 t-‐1 t t+ 1 t+ 2 t+ 3 t+ 4 t+ 5
Real GDP g rowth
Italy(in percent)
0
2
4
6
8
10
12
14
Less -‐4 -‐3 -‐2 -‐1 0 1 2 3 4 5 6 7 8
D istribution 4/
Italy
3-‐Year Adjustment in Cyclically-‐Adjusted Primary Balance (CAPB) 5/(Percent of GDP)
More
3-‐year CAPB adjustment g reater than 3 percent of
GDP in approx. top quartilehas a percentile rank of 18%
0
2
4
6
8
10
12
Less -‐4 -‐3 -‐2 -‐1 0 1 2 3 4 5 6 7 8
D istribution 4/
Italy
3-‐Year Averag e Level of Cyclically-‐Adjusted Primary Balance (CAPB)(Percent of GDP)
More
3-‐year average CAPB level g reater than 3.5 percent of GDP in approx. top quartilehas a percentile
rank of 9%
11

Forecast Track Record
-‐10
-‐8
-‐6
-‐4
-‐2
0
2
4
6
2005 2006 2007 2008 2009 2010 2011 2012 2013Year 2/
Real GDP Growth
Interquartile range (25-‐75)MedianExample forecast error
-‐ 1.4910%Has a percentile rank of:
Example median forecast error, 2005-‐2013:
Distribution of forecast errors: 1/
(in percent, actual-‐projection)
-‐10
-‐8
-‐6
-‐4
-‐2
0
2
4
2005 2006 2007 2008 2009 2010 2011 2012 2013Year 2/
Primary Balance
Interquartile range (25-‐75)MedianExample forecast error
0.4975%Has a percentile rank of:
Example median forecast error, 2005-‐2013:
Distribution of forecast errors: 1/
(in percent of GDP, actual-‐projection)
12

Projected Fiscal Adjustment
0
2
4
6
8
10
12
14Less -‐4 -‐3 -‐2 -‐1 0 1 2 3 4 5 6 7 8
D istribution 4/
Example
3-‐Year Adjustment in Cyclically-‐Adjusted Primary Balance (CAPB)(Percent of GDP)
More
13

Risk-‐Based Outputs
Basic DSA
DSA write-‐up
Basic DSA
Realism of baseline assumptions
Heat map, stress tests, debt profile, fan charts
where relevant Customized and contingent liabilities analysis
Lower scrutiny Higher scrutiny
14

Three additional modules: Heat Map, Debt Profile, Fan Charts
15

Heat Map
Heat Map
16

Heat Map
17

Stress Tests
18
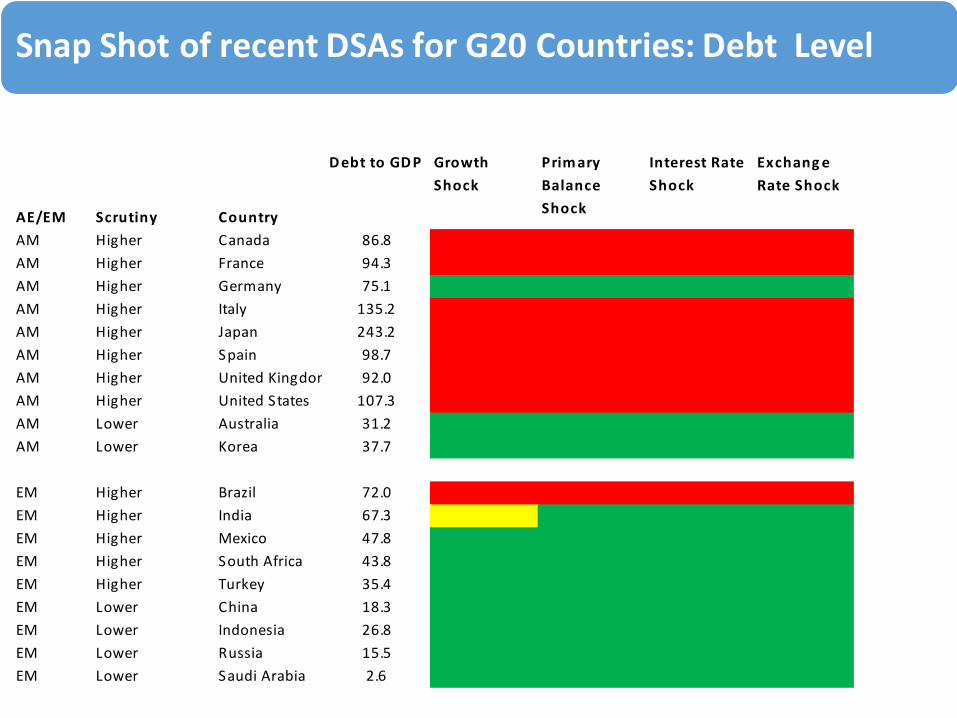
Snap Shot of recent DSAs for G20 Countries: Debt Level
AE/EM Scrutiny Country
Debt to GDP Growth Shock
Primary Balance Shock
Interest Rate Shock
Exchange Rate Shock
Conting ent Liability Shock
AM Higher Canada 86.8 3 3 3 3 0AM Higher France 94.3 3 3 3 3 0AM Higher Germany 75.1 1 1 1 1 0AM Higher Italy 135.2 3 3 3 3 3AM Higher Japan 243.2 3 3 3 3 3AM Higher Spain 98.7 3 3 3 3 3AM Higher United Kingdom 92.0 3 3 3 3 3AM Higher United States 107.3 3 3 3 3 3AM Lower Australia 31.2 1 1 1 1 1AM Lower Korea 37.7 1 1 1 1 0
EM Higher Brazil 72.0 3 3 3 3 3EM Higher India 67.3 2 1 1 1 2EM Higher Mexico 47.8 1 1 1 1 0EM Higher South Africa 43.8 1 1 1 1 0EM Higher Turkey 35.4 1 1 1 1 1EM Lower China 18.3 1 1 1 1 1EM Lower Indonesia 26.8 1 1 1 1 0EM Lower Russia 15.5 1 1 1 1 0EM Lower Saudi Arabia 2.6 1 1 1 1 019
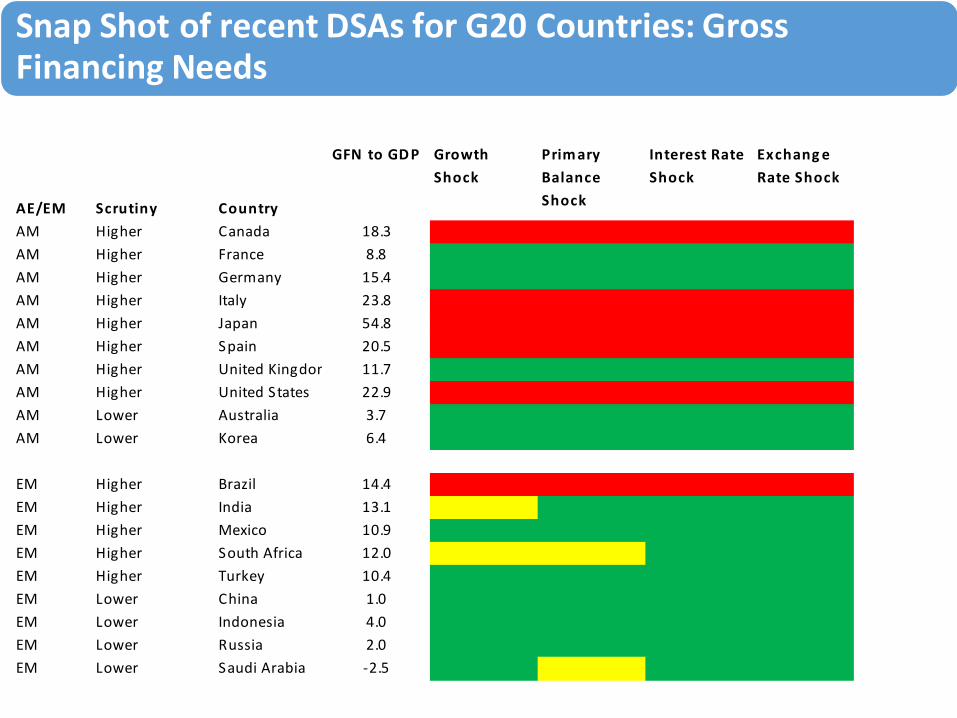
Snap Shot of recent DSAs for G20 Countries: Gross Financing Needs
AE/EM Scrutiny Country
GFN to GDP Growth Shock
Primary Balance Shock
Interest Rate Shock
Exchange Rate Shock
Conting ent Liability Shock
AM Higher Canada 18.3 3.0 3.0 3.0 3.0 0.0AM Higher France 8.8 1.0 1.0 1.0 1.0 0.0AM Higher Germany 15.4 1.0 1.0 1.0 1.0 0.0AM Higher Italy 23.8 3.0 3.0 3.0 3.0 3.0AM Higher Japan 54.8 3.0 3.0 3.0 3.0 3.0AM Higher Spain 20.5 3.0 3.0 3.0 3.0 3.0AM Higher United Kingdom 11.7 1.0 1.0 1.0 1.0 2.0AM Higher United States 22.9 3.0 3.0 3.0 3.0 3.0AM Lower Australia 3.7 1.0 1.0 1.0 1.0 2.0AM Lower Korea 6.4 1.0 1.0 1.0 1.0 0.0
EM Higher Brazil 14.4 3.0 3.0 3.0 3.0 3.0EM Higher India 13.1 2.0 1.0 1.0 1.0 2.0EM Higher Mexico 10.9 1.0 1.0 1.0 1.0 0.0EM Higher South Africa 12.0 2 2 1 1 0EM Higher Turkey 10.4 1 1 1 1 2EM Lower China 1.0 1 1 1 1 2EM Lower Indonesia 4.0 1 1 1 1 0EM Lower Russia 2.0 1 1 1 1 0EM Lower Saudi Arabia -‐2.5 1 2 1 1 0
20

Risk-‐Based Outputs
Basic DSA
DSA write-‐up
Basic DSA
Realism of baseline assumptions
Heat map, stress tests, debt profile, fan charts
where relevant Customized and contingent liabilities analysis
Lower scrutiny Higher scrutiny
21
DSA Write Up
Presents overall assessment of debt sustainability risks
Highlights vulnerabilities and country specific circumstances that mitigate or amplify risks
Discusses background and key assumptions including realism of the baseline
22

Thank you!
23

Additional slides
24

Fan Charts: Stochastic Simulations of Debt Paths
Evolution of Predictive Densities of Gross Nominal Public Debt(in percent of GDP)
0
20
40
60
80
100
120
140
2012 2013 2014 2015 2016 2017 2018 2019
10th-‐25th 25th-‐75th 75th-‐90thPercentiles:Baseline
Symmetric Distribution
0
20
40
60
80
100
120
140
160
2012 2013 2014 2015 2016 2017 2018 2019
Restricted (Asymmetric) Distribution
no restriction on the g rowth rate shockno restriction on the interest rate shock0 is the max positive pb shock (percent GDP)no restriction on the exchange rate shock
Restrictions on upside shocks:
25
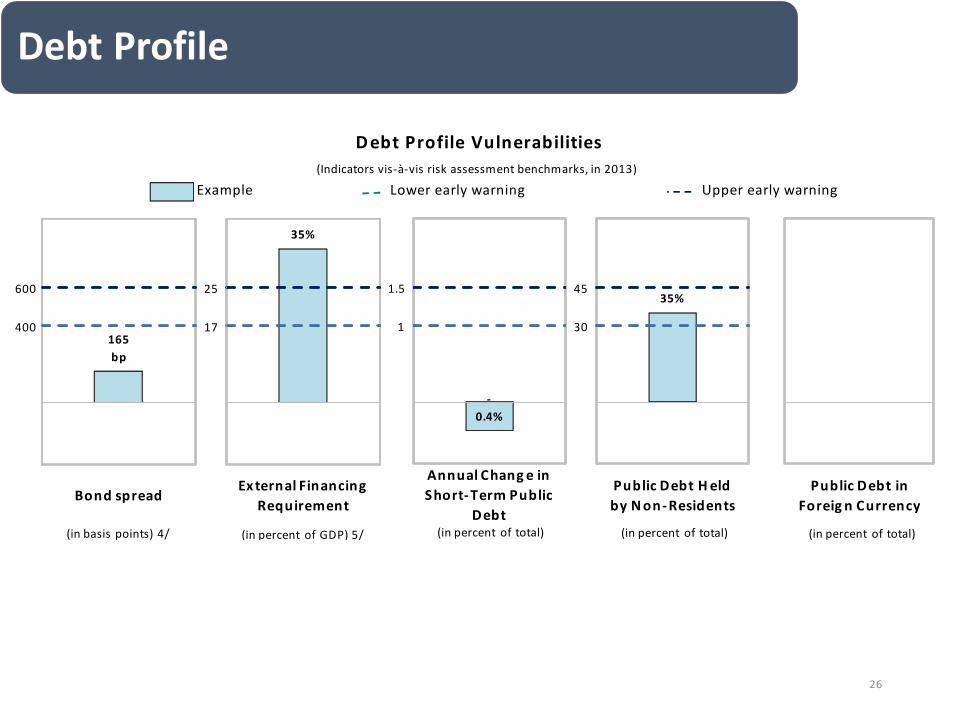
Debt Profile
Example Upper early warningLower early warning(Indicators vis-‐à-‐vis risk assessment benchmarks, in 2013)
Debt Profile Vulnerabilities
1 2
400
600
165 bp
1 2
17
25
35%
1 2
1
1.5
-‐0.4%1 2
Bond spreadExternal Financing
Requirement
Annual Chang e in Short-‐Term Public
Debt
Public Debt in Foreig n Currency
(in basis points) 4/ (in percent of GDP) 5/ (in percent of total) (in percent of total)
30
4535%
1 2
Public Debt H eld by Non-‐Residents
(in percent of total)
26

Snap Shot of recent DSAs for G20 Countries: Debt Profile
AE/EM Scrutiny Country
Market Perception
External Financing Requirement
Change in the Share of ST Debt
Public Debt Held by Non-‐Residents
Foreig n Currency Debt
AM Higher Canada 1 3 1 1 0AM Higher France 1 1 1 3 0AM Higher Germany 1 0 1 3 0AM Higher Italy 1 3 1 1 0AM Higher Japan 1 1 1 1 0AM Higher Spain 1 3 1 2 0AM Higher United Kingdom 1 1 1 1 0AM Higher United States 1 3 1 2 0AM Lower Australia 1 0 1 3 0AM Lower Korea 1 0 1 1 0
EM Higher Brazil 2 2 1 2 1EM Higher India 2 2 1 1 1EM Higher Mexico 1 2 2 3 2EM Higher South Africa 2 2 1 2 1EM Higher Turkey 2 3 2 2 2EM Lower China 1 1 1 1 1EM Lower Indonesia 2 0 2 3 2EM Lower Russia 0 2 1 1 1EM Lower Saudi Arabia 1 0 1 0 1
27


