
PUBLIC TRANSPORTATION INTRODUCTION
Outline Current Status and Recent TrendsCurrent Status and Recent Trends
Significant Influences
A Critical Assessment
Argguments Supporting Public Transpportpp g
Future Influences
IIngredi dientts ffor FFutture SSuccess
Nigel H.M. Wilson 1.258J/11.541J/ESD.226J 1 Lecture 1, Spring 2010

Current Status
• Ridership increasing moderately but remains small • Strong financial support from all levels of
government • Significant growth in number of new rail starts in
past 25 years • Major rebuilding of many older systems over past 20
years • Slow institutional or technologgical innovation, but
growing recognition that fundamental change may be necessary for survival well into 21st century
Nigel H.M. Wilson 1.258J/11.541J/ESD.226J Lecture 1, Spring 2010
2

–
Mode of Transportation 1969 1977 1983 1990 1995 2001
Auto 81.8 83.7 82.0 87.1 86.5 86.4 Transit 3.2 2.6 2.2 2.0 1.8 1.6 Walk n/a 9.3 8.5 7.2 5.4 8.6Walk n/a 9.3 8.5 7.2 5.4 8.6 Bicycle n/a 0.7 0.8 0.7 0.9 0.9 Other 5.0 3.7 6.5 3.0 5.4 2.5
US Urban Transport Today TTrendds in MModdal S l Split for DDaily TTraveli lit f il l
in the United States (1969-2001)
Source: Socioeconomics of Urban Travel: Evidence from the 2001 NHTSby John Pucher and John L Renne Transportation Quarterly Vol 57 No 3 Summer 2003 (49 77).by John Pucher and John L. Renne. Transportation Quarterly, Vol. 57, No. 3, Summer 2003 (49 77)Eno Transportation Foundation, Inc., Washington, DC.
Federal Highway Administration, Nationwide Personal Transportation Surveys 1969, 1977, 1983, 1990, and 1995; and National Household Travel Survey, 2001.
Nigel H.M. Wilson 1.258J/11.541J/ESD.226J 3 Lecture 1, Spring 2010

Transit Share of Commute for Metropolitan Areas Over 2 Million in Population (2000)Over 2 Million in Population (2000)
Sources: U.S. 2000 Census Journeyy to Work ((httpp://www.census.ggov/pprod/2004ppubs/c2kbr-33.ppdf)) and U.S. Department of Transportation Census Transportation Planning Package http://www.fhwa.dot.gov/ctpp/jtw/
Nigel H.M. Wilson 1.258J/11.541J/ESD.226J Lecture 1, Spring 2010
4
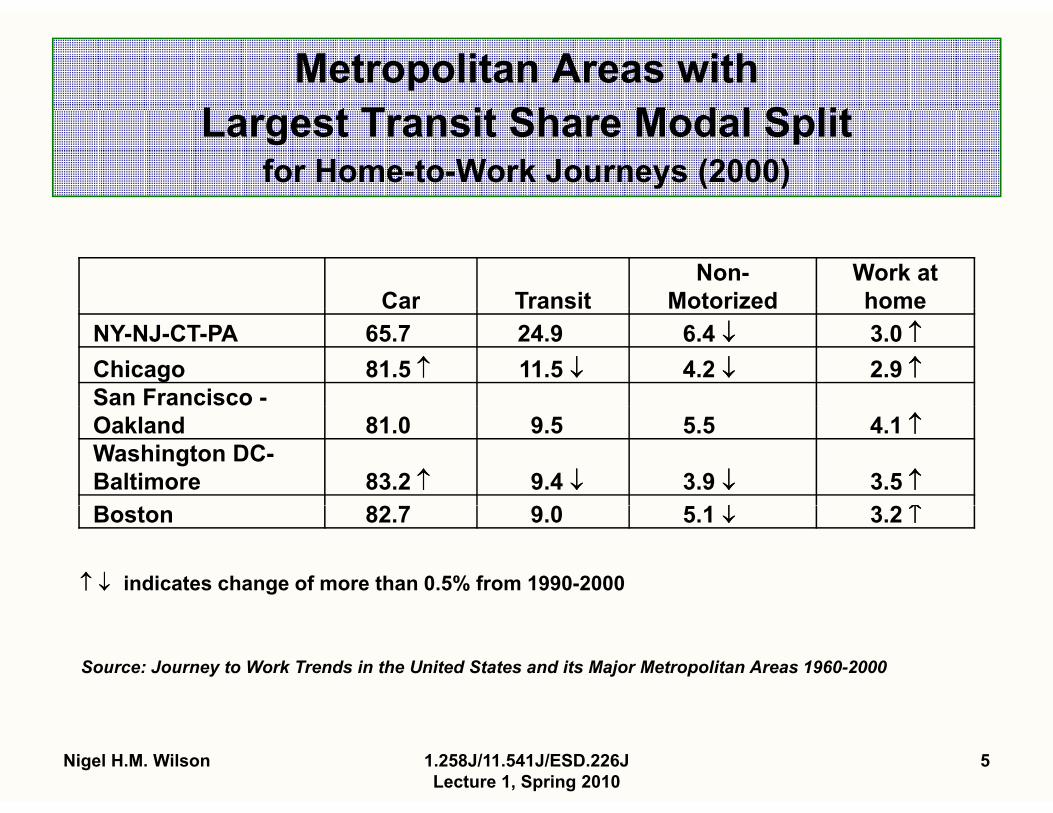
↓↓ ↑↑
Car Transit Non-
Motorized Work at homeCar Transit Motorized home
NY-NJ-CT-PA 65.7 24.9 6.4 ↓↓ 3.0 ↑↑ Chicago 81.5 ↑↑ 11.5 ↓↓ 4.2 ↓↓ 2.9 ↑↑San Francisco -Oakland 81.0 9.5 5.5 4.1 ↑↑Washington DC-Baltimore 83.2 ↑↑ 9.4 ↓↓ 3.9 ↓↓ 3.5 ↑↑Boston 82.7 9.0 5.1 ↓↓ 3.2 ↑↑
Metropolitan Areas with L t T it Sh M d l S litLargest Transit Share Modal Split
for Home-to-Work Journeys (2000)
↑ ↓↑ ↓ indicates change of more than 0.5% from 1990-2000
Source: Journey to Work Trends in the United States and its Major Metropolitan Areas 1960-2000
Nigel H.M. Wilson 1.258J/11.541J/ESD.226J 5 Lecture 1, Spring 2010

Significant Influencesg
• Suburbanization of homes, employment and attractors
• Low costs for car ownership and operation
• Extensive urban road infrastructure
Go ernment policies to ards roads and p blic• Government policies towards roads and public transport
Nigel H.M. Wilson 1.258J/11.541J/ESD.226J Lecture 1, Spring 2010
6

Suburbanization: 2000 Journey to Worky
AA. Total Trips Total Trips (in millions of daily trips) (in millions of daily trips) Jobs in:
Homes in: Central City Suburbs Total Homes
Central City 28.2 (27%) 9.2 (9%) 37.4 (36%) Suburbs 20.8 (20%) 44.6 (43%) 65.4 (64%)
Total Jobs 49.0 (48%) 53.8 (52%)
B. Share of 1990-2000 Increase C. Public Transport Mode Share
Jobs in: Jobs in: Jobs in: Homes in: Central City Suburbs Central City 5% 14% Suburbs 16% 65%Suburbs 16% 65%
Jobs in: Homes in: Central City Suburbs Central City 14% 6% Suburbs 6% 2%Suburbs 6% 2%
Nigel H.M. Wilson 1.258J/11.541J/ESD.226J Lecture 1, Spring 2010
7

The Car-Road System*y
High car ownership levelsHigh car ownership levels • 600 cars per 1000 population
High car usage • 10,000 veh-km per capita annually
Low taxes, fees and user charges for car ownership and use • Sales taxes range from 5-8% • Users pay onlyy 60% of road infrastructure costs in US p y • Fuel taxes are from 10-20% of European levels
* Source: The Urban Transportation Crisis in Europe and North America, by John Pucher and Christian Source: The Urban Transportation Crisis in Europe and North America, by John Pucher and ChristianLeFevre, 1996.
Nigel H.M. Wilson 1.258J/11.541J/ESD.226J Lecture 1, Spring 2010
8

The Car-Road System (cont’d)*y ( )
Urban parking supply is relatively widely available and often free • 380 parking spaces per 1000 central city workers in 10 largest US cities • 95% of car commuters enjoy free parking95% of car commuters enjoy free parking
Highly developed urban road system • 6.6 metres of road per capita in 10 largest US cities; 3 times European levels
* Source: The Urban Transportation Crisis in Europe and North America, by John Pucher and Christian Source: The Urban Transportation Crisis in Europe and North America, by John Pucher and ChristianLeFevre, 1996.
Nigel H.M. Wilson 1.258J/11.541J/ESD.226J Lecture 1, Spring 2010
9

Capital Operating Fares --- 11.1 (31.4%) Other directly generated 4.8 (33.5%) 2.7 (7.6%) Local 2 1 (14 4%) 8 3 (23 4%) Local 2.1 (14.4%) 8.3 (23.4%) State 1.6 (11.2%) 8.4 (23.6%) Federal 5.9 (41%) 2.7 (7.6%) Total 14.3 billion 35.5 billion
Public Transport Funding by Source (2007, in $ billions)
Source: American Public Transportation Association, Transit Facts 2009 (for 2007)
Nigel H.M. Wilson 1.258J/11.541J/ESD.226J 10 Lecture 1, Spring 2010

A Critical Assessment
• Public transport has been stabilized
• Manyy new rail initiatives in o pperation or under construction (Phoenix, Denver)
• Some real success stories: New York City, Houston Houston,• Some real success stories: New York City Seattle
• Institutional change is occurring slowly
• Retention of political supportRetention of political support
Nigel H.M. Wilson 1.258J/11.541J/ESD.226J Lecture 1, Spring 2010
11

Traditional Arguments Supporting Transport
• Equity: access for those who cannot or do not choose to drive
• Congestion: the need for a high-quality alternative
• L dLand use iinfl fluence: publi blic ttransport i t is necessary, but not sufficient to change trends
• Environmental: car technology strategies are more effective
• Energy: car technology strategies are effective
Nigel H.M. Wilson 1.258J/11.541J/ESD.226J 12 Lecture 1, Spring 2010

Other Arguments Supporting Transitg pp g
• Economic: expenditures for private autos may be alternatively used to improve local economies and quality of lifequality of life
• Transit allows agglomeration of economic activity in cities:cities: • New York, Boston, San Francisco, etc. could not have
developped without transit
• The contribution of earlier investments in heavy rail is not valued appropriately
• New investments will have a lasting impact – thus the need for a long view (Economic analysis of CrossRail in London)
Nigel H.M. Wilson 1.258J/11.541J/ESD.226J Lecture 1, Spring 2010
13

Other Arguments Supporting Transitg pp g
• Transit is contributing to decreasing external costs of transport in cities: • accidents
• impacts on human health
• congestion
• noise
• global warming
Nigel H.M. Wilson 1.258J/11.541J/ESD.226J Lecture 1, Spring 2010
14

Other Arguments Supporting Transitg pp g
• The key is the enhancement of the quality of the urban space
• Public Transport can be a catalyst for this process
Nigel H.M. Wilson 1.258J/11.541J/ESD.226J Lecture 1, Spring 2010
15

tt t tt t
Future Influences on Public Transportp
• Urban form • continued growth on periphery is likely
• Demographics • rapid increase in numbers of elderly
• Technological change • telecommunications advances • ITS i ITSimpactts on car//roadd systtem perfformance
• Higher public expectations bbetter serviice quality needded to attract chhoiice rididers• lit d
• greater return for public support
Nigel H.M. Wilson 1.258J/11.541J/ESD.226J Lecture 1, Spring 2010
16

Ingredients for Future Successg
• Maintain supppportive coalition -- expand base benefiting from public transport: rural, suburban, big cities -- demonstrate that real change is occurring in response to changing needs and expectations
• Expand the definition of public transport Expand the definition of public transport -- greater variety of services with more flexibility in use of funds
• Greater private sector involvement -- greater use of partnerships and connections with private sector (e.g., employers and activity providers)(e.g., employers and activity providers) -- more reliance on innovative financing and procurement techniques
-- competition in the provision of servicesNigel H.M. Wilson 1.258J/11.541J/ESD.226J
Lecture 1, Spring 2010 17

Ingredients for Future Successg
• Aggressive implementation of new technology -- better information provision: pre-trip and en route -- more effective real-time operations control -- improved vehicle design
• Organizational change -- ggreater opperatingg staff respponsibilityy and inclusion,, and accountability -- increased customer orientation
Nigel H.M. Wilson 1.258J/11.541J/ESD.226J Lecture 1, Spring 2010
18

MIT OpenCourseWarehttp://ocw.mit.edu
1.258J / 11.541J / ESD.226J Public Transportation Systems Spring 2010
For information about citing these materials or our Terms of Use, visit: http://ocw.mit.edu/terms.


