
July 2018
PT Medikaloka Hermina Tbk1H 2018 Presentation

Hermina – Our Team
Aristo Setiawidjaja15
Years of Experience
MD, Finance and
Strategic
Development
dr. Binsar Parasian
Simorangkir
32
Years of Experience
Co-Founder and MD,
Medical and
Compliance
Yulisar Khiat34
Years of Experience
Co-Founder and MD,
Operational and
General Affairs
dr. Hasmoro34
Years of Experience
President
Director & CEO
#1 Indonesia Original
Brand in Maternity
Hospital (2016)
- SWA
Hospital Group with
the Most Accredited
Hospitals (2015)
- KARS
1

1. Company Overview

Leading National Hospital Chain, with Robust Growth Trajectory
One of the Largest Groups in a Highly Fragmented Indonesian Hospital Market1
Source: Frost & Sullivan.1. As of December 31, 2017.2. Includes Kasih Group (521 beds, 7 hospitals), which Mitra Keluarga acquired in October, 2017.
31 28
19
10 9
3,337 2,780 2,700
889
1,500
# of Hospitals# of Operational Beds
Consistent Growth Year over Year
2
1 4
12
4
14
28
2010 2011 2012 2013 2014 2015 2016 2017 Dec 2017FY2015 FY2016 FY2017
2x Growth - 14 New Hospitals in 7 Years
2
Permata Bunda
Other Selected Top Players, Beyond the Top 5
Name No. of Hospitals No. of BedsType of
Hospital
Permata Group 7 699 Multi-Specialty
Sari Asih 6 858 Multi-Specialty
Ramsey 3 629 Multi-Specialty
Pondok 3 455 Multi-Specialty
Columbia Asia 3 416 Multi-Specialty
Mayapada 2 485 Multi-Specialty
Top 5 Private Operators by Number of Hospitals
3
Total Patient
395K
523K
627K
2.8M
3.6M
4.5M
FY15-FY17 CAGR
Inpatient Days: 26% / Outpatient: 27%

1. As of May 31, 2018.2. Based on Frost & Sullivan’s analysis that within the top private multi-specialty hospital chains, Hermina has the broadest offerings in women & children segment.
Hermina hospitals are a network of general hospitals with a significant strength and wide offering in women and children care
Service Offering Overview
Type B6 hospitals
Type C23 hospitals
Hermina Hospital Facility• 6 Type B general hospitals with fully
advanced center of excellence & sub-specialist care
• 23 Type C full service general hospitals with several sub-specialist care
Pharmacy
Accident &
Emergency
Radiology
Outpatient Clinics
& Homecare
Laboratory
Inpatient
rooms
General X-ray & Ultrasound, Mammography, BMD, MRI, CT Scan, C-Arm, ENT Endoscopy, Pathology-Clinic
Diagnostics / Imaging
Haemodialysis, CAPD,
Gastrointestinal Endoscopy,
Geriatrics Clinic, Oncology -
Chemotherapy
Internal Medicine
Orthopaedics and Traumatology,
Oncology – Chemotherapy,
Neuro surgery, Plastic surgery,
Vascular surgery, Digestive
(Laparoscopy) and Urology
(ESWL & TURP),
Phacoemulsification
Surgical Procedures
A variety of health screening and
treatment such as Cath Lab
Cardiovascular
Service Offerings
Children's health
including tertiary care
such as
Gastroenterology and
Thalassemia
Pediatrics
Specializes in women’s health
including Oncology and
Urogynaecology
Obstetrics & Gynaecology
29hospitals1
Service of ExcellenceGrowth and Development Center which includes Children Bobathto treat Cerebral Palsy and care for Neuromuscular diseases, and Adult Bobath to treat Stroke and Brain Injury
Medical Rehabilitation
Service of Excellence Orthodontics, Conservative Dentistry, Pediatric Dentistry, Prosthodontics, Periodontics and Oral Surgery
Dental Specialists
Ophthalmology Acupuncture PulmonologyNeurology Psychiatry Dermatology & VenereologyPathology-Anatomic Psychology Otorhinolaryngology Anaesthesiology Radiology (ENT)
Other Specialties
Service of Excellence• Perinatology• Neonatal Intensive Care Units (NICU)• Pediatric Intensive Care Units (PICU)
Service of Excellence• Feto-maternal care• Infertility
in Women and Children Care2
Market Leader in Number of Sub-specialty
Service Offerings2
4

Corporate History
# of beds
# of
hospitals29
18 Cities,
10 Provinces
Now
20141997
2002 2008
2016
3
150
6
441
11
786
21
1,611
24
2,115
3,2191
1985
25
1985 1989 1995 1999 2000–02 2003–08 2009–14 2015–16 2017
◼ Established 3 new hospitals and
acquired 2 hospitals
◼ 2005: Pandanaran became the
first Hermina Hospital to receive
general hospital license
◼ 2017: Established 4 new hospitals
◼ Company restructured ownership to
consolidate 28 hospitals under MH
◼ Made the first
acquisition of a
hospital (Podomoro)
◼ Established the first
maternity hospital in
Jatinegara
1997
◼ Changed the non-profit
organization status into a
corporation named
Medikaloka Hermina (MH)
◼ Established 7 new hospitals
and acquired 3 hospitals
◼ 2011: Opened first hospital
outside Java in Palembang
◼ Established
hospitals in Depok,
Daan Mogot, and
Bogor
◼ Jatinegara was
upgraded to
Women & Children
hospital
◼ Established the
third hospital in
Bekasi
◼ Established 2 new hospitals
and acquired 1 hospital
◼ 2016: Hermina Tower was
opened
Company Milestones
Evolution on Number of Hospitals
5
◼ Opened 1 new hospital in
Samarinda in April 2018
2018
2017
28
2,780

Our Nationwide Hospital Network
Type B Hospitals Type C Hospitals
Total Hospitals
29 Hospitals
across 18 Cities in
• Pasteur
• Pandanaran
• Malang
• Sukabumi
• Tangerang
• Grand Wisata
• Arcamanik
• Galaxy
• Palembang
• Ciputat
• Cileungsi
• Serpong
• Banyumanik
• Solo
• Ciruas
• Yogya
• Bitung
• Makassar
• Balikpapan
• Medan
• Podomoro
• Purwokerto
• Samarinda
Jatinegara
Depok
Kemayoran
Daan Mogot
Bekasi
Bogor
Our Nationwide Hospital Network
6

2. Financial Update

267.3 314.7
20.9% 20.8%
0.0%
10.0%
20.0%
30.0%
80.0
280.0
480.0
680.0
1H17 1H18
EBITDA EBITDA Margin
569.9 664.2
44.5% 43.8%
0.0%
10.0%
20.0%
30.0%
40.0%
50.0%
200.0
700.0
1,200.0
1H17 1H18
Gross Profit Gross Margin
1,281.8 1,515.4
1H17 1H18
Robust Growth in Revenue and Stable Margin Profile
Growth: 18.2%
Total Revenue(IDR billions)
EBITDA & EBITDA Margin1
(IDR billions, %)
1. EBITDA is calculated by operating income + depreciation and amortization + adjustment for non-operating items (disposal of fixed asset, impairment of fixed asset, and other income (expense)) and adjustment for non-cash items (allowance for impairment of account receivable and post-employment benefit expense) + professional expenses related to IPO (IDR1.5bn), which is recognized as part of general adminitrative expense.
Gross Profit & Gross Margin(IDR billions, %)
8
PAT & PATMI(IDR billions)
124.7
99.3
70.6 70.0
0.0
50.0
100.0
150.0
1H17 1H18
PAT PATMI
As opposed to PAT in 1H17, PAT in 1H18
was impacted by interest expense related
to purchase of minority interest in 2H17

Key Balance Sheet Items – Working Capital Turnover Days
Trade Receivable Days1
(Days)
Net Working Capital(IDR billions)
Trade Payable Days(Days)
Cash Conversion Cycle Days(Days)
Inventory Days(Days)
91. Trade receivable days in 2016 and 2017 are calculated based on average balance of trade receivables.
11.813.0
11.0 9.7
2015 2016 2017 1H18
76.6
205.4
361.4 355.0
2015 2016 2017 1H18
3.2
11.1
21.7 27.5
2015 2016 2017 1H18
33.7 36.8
53.6 63.1
2015 2016 2017 1H18
42.3 38.8 42.9 45.3
2015 2016 2017 1H18

281K363K
1H17 1H18
Strong Growth in Patient Visits
Inpatient Days Inpatient Admissions by Payor Type
Outpatient VisitOutpatient Visits by Payor Type
1H17 1H18
1H17 1H18
10
Growth: 29.0%
2.1M
2.6M
1H17 1H18
Growth: 24.4%
JKN, 53%
Non-JKN, 47% JKN,
67%
Non-JKN, 33%
JKN, 41%Non-
JKN, 59%
JKN, 49%
Non-JKN, 51%

EBITDA Calculation Methodology
(IDR billions) 1H17 1H18 YoY Growth
Revenue 1,281.8 1,515.4 18.2%
EBIT 196.6 210.3 7.0%
% Margin 15.3% 13.9%
Depreciation and Amortization (D&A) 64.4 93.0
Adjustment for back non-cash items1 13.0 13.2
Post-employment benefits 11.4 12.2
Allowance for impairment losses 1.6 0.9
Adjustment for non-operational income / (expense) (6.7) (1.8)
Net Loss Disposal of fixed asset 0.6 1.4
Other income (expense) 2 (7.3) (5.1)
IPO related expenses - 1.9
EBITDA (EBIT + D&A + Adjustments) 267.3 314.7 17.7%
% Margin 20.9% 20.8%
111. Methodology is consistent with the EBITDA calculation methodology of the peer group of Siloam and Mitra Keluarga2. Other income and expenses include items that are non-operational in nature such as sponsorship income, seminar income, patient overpayment, CSR and charitable donation expenses, and other miscellaneous income and expenses.

Debt and Leverage Ratio
Total Debt / Net Debt / Leverage Ratio(IDR billions, x)
Note: Debt is calculated by short-term bank loans + current portion of long-term liabilities + medium term notes + long-term liabilities net of current portion: bank loans + mandatory convertible notes. 12
<1 yr maturity
15%
1-5 yr maturity
85%
Maturity Profile (June 2018)
354.1
607.7
1,422.0
865.2
235.3
404.5
1,099.6
343.3
0.70.8
1.9
0.5
-1
-0.5
0
0.5
1
1.5
2
0
500
1000
1500
2000
2500
2015 2016 2017 1H18
Total Debt Net Debt Net Debt/EBITDA
IDR
865.2 bn

Cash Flow and Capital Expenditure
Cash Flow(IDR billions)
1. Includes acquisition of fixed assets + acquisition of other assets + advance purchase of fixed assets 13
Cash and Cash Equivalents(IDR billions)
Capital Expenditure1
(IDR billions, %)
118.8
203.2
322.4
521.9
2015 2016 2017 1H18
331.4 393.6 439.7 207.7
176.5 170.2
1,142.4
446.3
(526.7) (485.7)
(1,462.8)
(454.5)
2015 2016 2017 1H18
Cash Flow from Operations Cash Flow from Financing Activities
Cash Flow from Investing Activities
528.9 534.4
716.1
450.3
30.9%
23.9%26.7%
29.7%
0.0%
5.0%
10.0%
15.0%
20.0%
25.0%
30.0%
35.0%
40.0%
150
350
550
750
950
1150
1350
2015 2016 2017 1H18
Capital Expenditure % of Revenue

3. Hospital Development
15
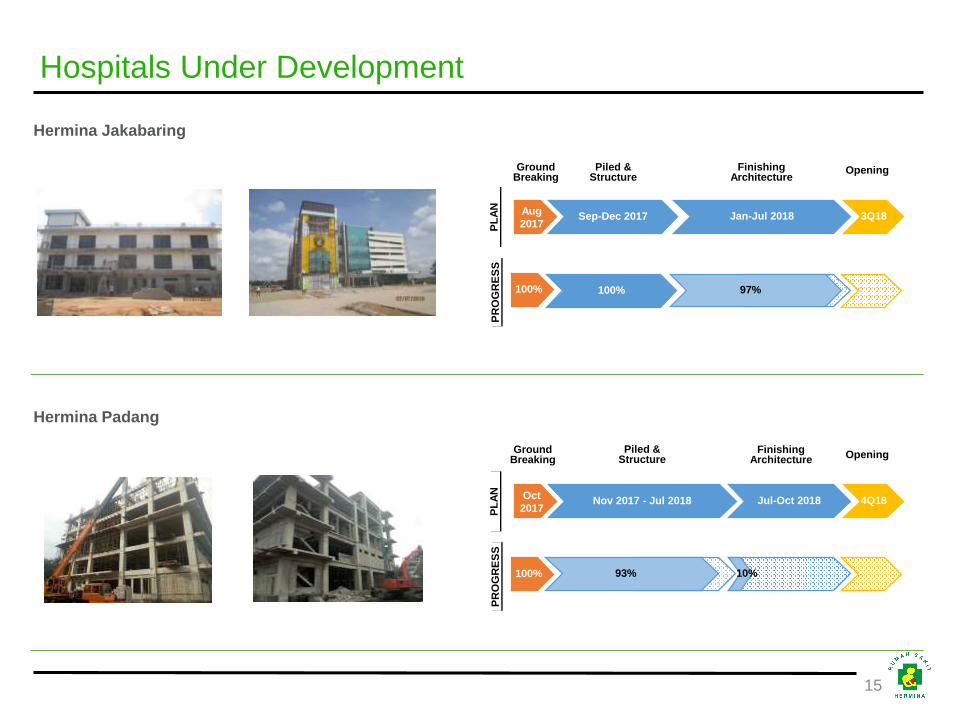
Hospitals Under Development
Hermina Jakabaring
Hermina Padang
Aug
2017Jan-Jul 2018Sep-Dec 2017 3Q18
OpeningGroundBreaking
Piled & Structure
Finishing Architecture
PL
AN
100% 97%
PR
OG
RE
SS
100%
Oct
2017Jul-Oct 2018Nov 2017 - Jul 2018 4Q18
OpeningGround
BreakingPiled &
StructureFinishing
Architecture
PL
AN
100% 93%
PR
OG
RE
SS
10%

PT Medikaloka Hermina Tbkwww.herminahospitals.com


