Journal of Management Information and Decision Sciences Volume 25, Special Issue 2, 2022
1 1532-5806-25-S2-30
Citation Information: Alhammadi, M.S.E. & Tariq, M.U. (2022). Proposed Cancer Disease Prediction Model Using Machine Learning.
Journal of Management Information and Decision Sciences, 25(S2), 1–23.
PROPOSED CANCER DISEASE PREDICTION MODEL
USING MACHINE LEARNING
Muna Salem Eissa Alhammadi, Abu Dhabi School of Management
Muhammad Usman Tariq, Abu Dhabi School of Management
ABSTRACT
The attention to the Artificial Intelligence field has been grown in the last few years. The
ability to connect Artificial Intelligence in medical matters has been an important topic since the
beginning of this century. Searching and working in the Artificial Intelligence field can help
develop the researcher’s critical thinking and refine their analytical skills, problem-solving, and
decision-making skills. Cancer is the third cause of death in Abu Dhabi and accounts for almost
16% of total death. The value of this paper relies on building a prediction model for UAE patients
with cancer. The proposed solution is to create an analytical model that will help us to predict the
common cancer type. We have concluded that the most common cancer type in the years 2011-2015
is breast cancer. The most affected age by cancer is more than 50 years.
Keywords: AI, Machine Learning, MRI, CT, PET, PCA, KDD
INTRODUCTION
Cancer is still a research topic, and several diagnostic methods are applied for it, as it has
many types and even early detection blood tests show some promising, but still there are many
challenges in its detection. Without knowing the contributing factors that lead to cancer, we cannot
prevent it. Many initiatives and research are going on in the field, but data can reveal more info
beyond the scope of research as it gives us even the info or facts we do not expect to find.
(Department of Health, 2020) .This paper aims to predict if the Tumour is Malignant or Benign
according to analysis on clinical data. Also, we will analyze the diagnosis data to see the trends in
diagnosis for each cancer type in UAE.
Cancer is the third cause of death in Abu Dhabi and accounts for almost 16% of total death.
24.1% among nationals and 75.9% among expatriates. 53.3% were females, and 46.7% were males.
There were around 427 deaths caused by cancer in 2015, 35% were nationals, and 65% were
expatriates. There is no early detection for cancer diseases. Early diagnosis is important, but people
do not give importance to it. Survival rates increase up to 98% if early diagnosis is performed. The
earlier is the detection of the disease, the better will be the chances of survival.
At the moment, many people worldwide go through tests in identifying tumors to be
Malignant or Benign. Also, the survival for cancer patients depends on the diagnosis. If any tumor
were falsely identified as Benign, this could reduce the cancer patient's survival rate. So, depending
on data can add confidence for us rather than depending on only clinical tests, which might add
delays as hospitals are crowded and busy most of the time.
In our paper, we aim to answer these two questions:
i. Can we predict the type of breast tumor as cancerous or not, depending on data with high accuracy?
ii. Are all the diagnosis methods successful in identifying cancer in UAE equally or no, or do we need to invest
more in these diagnoses?
Journal of Management Information and Decision Sciences Volume 25, Special Issue 2, 2022
2 1532-5806-25-S2-30
Citation Information: Alhammadi, M.S.E. & Tariq, M.U. (2022). Proposed Cancer Disease Prediction Model Using Machine Learning.
Journal of Management Information and Decision Sciences, 25(S2), 1–23
Furthermore, predicting the type of breast tumour can reduce the stress on tumor patients
and make cancer patients' survival rates higher. Also, diagnosing cancer depending on data can help
us focus on the most important variables that play a role in predicting cancer and save the
healthcare industry a lot of money and effort. We want to highlight that cancer prediction is
possible for researchers to inspire them to understand why the prediction models give an accurate
answer. It might bring to their attention a variable that was not considered critical in clinical
experience but proved to be important as per its importance rate. Furthermore, we want to highlight
for the healthcare industry that records of non-cancerous cases are very important for predicting
cancer and would like to encourage them to build databases with more data and make it available
with consideration of patient right for not revealing their identity to assess on this noble goal of
helping early diagnosis of cancer and save lives. Another thing is that we want to touch on how
successful the current diagnosis methods are here in UAE. Section 2 provides the relevant literature,
section 3 provides the methodology, section 4 with results, and section 5 with the conclusion and
future recommendations.
LITERATURE REVIEW
According to Global Cancer Statistics, the second largest cause of death in the world is
cancer. Fortunately, with developed screening and treatment technologies, survival rates have
improved in many types of cancer. This section discusses cancer and its symptoms, reviews various
research papers and compares them accordingly. It also discusses different types of cancer,
diagnosis methods, various treatments conducted by the medical and health professionals.
Defining Cancer and its Symptoms
According to Professor Gordon, Cancer is a disease of genes that causes cells to grow out of
control (McVie, 2011). Similarly, Marc B. Garnick defines cancer as the abnormal and unregulated
cell proliferation from cells of a specific organ called cancer (Garnick, 2019). In other words,
cancer is known as one of the major diseases that duly happen with the abnormal cell activity in
which the cells start developing uncontrollably; thus, they destroy normal body tissues by
infiltration. Cancer can spread throughout the whole human body. At the cellular level, there is a
stark difference between a healthy cell and a cancerous cell.
Symptoms
The symptoms of cancer may vary and depend upon an affected part of the body. A few
general signs and symptoms but not specific to cancer are mentioned: The thickening of lump or
area which we can feel under the skin, weight loss, obesity, skin modifications, such as yellowing,
darkening, or redness of the skin; Sores that do not heal, or changes to existing moles, irregular
bowel movements, changes in bowel or bladder habits, persistent cough or trouble breathing,
difficulty swallowing, hoarseness, discomfort after eating or ongoing indigestion problem,
unexplained muscle or joint pain, unexplained fevers or night sweats and unexplained bleeding or
bruising (McVie, 2011).
According to Cancer Nursing Institute, doctors, most cancers occur in people who do not
have known risk factors. Therefore, it is advisable to keep regular health check-ups, especially in
old age. Growing age always increases the risk factors of Cancer Creation. It takes decades to
reveal Cancer symptoms. That is the main reason people age 65 or above are usually diagnosed
Journal of Management Information and Decision Sciences Volume 25, Special Issue 2, 2022
3 1532-5806-25-S2-30
Citation Information: Alhammadi, M.S.E. & Tariq, M.U. (2022). Proposed Cancer Disease Prediction Model Using Machine Learning.
Journal of Management Information and Decision Sciences, 25(S2), 1–23
with cancer. Because of the mentioned reason, we cannot claim that cancer is exclusively an adult
disease.
Nevertheless, we can diagnose at any age or stage of life (Institute, National cancer institute,
2015) . Charles F. Baer argues that cancer’s most common symptoms and treatment are pain,
depression, and fatigue. The majority of clinical assessments of pain, depression, and fatigue rely
on self-reports by patients. The patient best assesses symptoms, but the sickest patients may not
complete these assessments. However, some research disputes about whether to consider signs of
pain, depression, and fatigue individually or in combination. That is why it is known that these
symptoms are related to each other (Baer, 2007).
Types of Cancer in General
Marc B. Garnick, in the Introduction to Cancer and Basic Cancer Vocabulary, argues that
there are two types of Cancer/Carcinoma: solid and liquid. Solid tumors generally refer to cancers
that arise from epithelial surfaces and cells that line glands, such as the Thyroid, Kidney, Testis,
Ovary, Adrenals, Liver, Cervix, Skin/Epidermis, Glands, Intestines, Bronchus, Breast, Prostate,
Pancreas. (Garnick, 2019). On the other hand, Liquid tumors are the Tumours of lymph nodes and
blood cells. Such as Hodgkin’s lymphoma, distinguished due to its appearance characteristic,
clinical presentation, cell type, and shape with a specific response to therapy and Non-Hodgkin’s
lymphoma, i.e., Wide variety of pathologic subtypes, Wide range of indications and outcomes,
differing treatments than for Hodgkin’s lymphoma. (Garnick, 2019) According to the National
Cancer Institute, the common cancer types are: “Bladder Cancer, Breast Cancer, Colorectal Cancer,
Kidney (Renal Cell) Cancer, Leukaemia, Liver Cancer, Lung Cancer, Lymphoma, Pancreatic
Cancer, Prostate Cancer, Skin Cancer, Thyroid Cancer, Uterine Cancer.” (Institute, National cancer
institute, 2015)
(Koul, 2019), mentioned types of cancers similar to the above types in his study. His
analysis includes categorical information on cancer type, i.e., cancer of the blood, lungs, colon and
rectum, prostate, skin, breast, uterus, thyroid, lymphatic system, etc. He also touched upon cancer
symptoms, diagnosis, and treatment. He advocates that cancer is not one disease; instead, he
suggested a group of various diseases (Koul, 2019).
Diagnosis Methods for Cancer
According to Mayo Foundation for Medical Education and Research, the imaging tests used
in diagnosing cancer may include a computerized tomography (CT) scan, bone scan, magnetic
resonance imaging (MRI), positron emission tomography (PET) scan, ultrasound, and X-ray,
among others. Biopsy. During a biopsy, the doctor collects a sample of cells for testing in the
laboratory. According to a researcher (Litin, 2018), the critical issue in diagnosis is the early
detection of the disease while treating cancer patients. Usually, cancer is detected in its final stages
when any vital organ’s function is affected and spreading through the whole body. In the current
research, most emphases give to devising methods of early detection of cancer. After the initial
detection of cancerous growth, precise diagnosis and staging of the disease are vital for designing a
treatment plan. This process depends upon clinical testing and the course of action of the
physicians. Cancer patients and their families must understand the results given to take timely steps
and play an active role in planning the treatment protocol to be used. This study includes
information on some of the methods used to detect cancer. Also discussed are some possible tests
that are still under investigation. \The data can also find on the results presented in pathology (path.)
reports and the section describing the process of cancer staging.
Journal of Management Information and Decision Sciences Volume 25, Special Issue 2, 2022
4 1532-5806-25-S2-30
Citation Information: Alhammadi, M.S.E. & Tariq, M.U. (2022). Proposed Cancer Disease Prediction Model Using Machine Learning.
Journal of Management Information and Decision Sciences, 25(S2), 1–23
No one can claim 100% accuracy of the tests; therefore, it is advisable to understand the
medical tests’ limitations. It can describe by its sensitivity and specificity and false positive or false
negative rates. (Litin, 2018) According to a better chance of curing cancer is early diagnosis and
detection. The imaging tests used in diagnosing cancer may include a computerized tomography
(CT) scan, bone scan, magnetic resonance imaging (MRI), positron emission tomography (PET)
scan, ultrasound, and X-ray, among others. During a biopsy, the doctor collects a sample of cells for
testing in the laboratory. (Dermime, 2013)
Similarly, discussing cancer diagnosis, one researcher states that there are multiple early
detection strategies. An asymptomatic type can identify through a Blood test, Biopsy, MRI, PET,
Ultrasound, Screening studies, colonoscopy, and total-body CT scan. He points out that more than
one system for staging and going through such tests helps determine the cancer stage. Upon
physical examination of the patient, the practitioner suggests radiography or surgical biopsy, later to
send the sample to a pathologist to diagnose cancer. (Garnick, 2019)
Treatment for Cancer and its Severity
In this modern era, many new types of cancer treatments are available. Every treatment will
depend on the type of cancer from which a patient suffers. Some patients may receive only one
medicine, but others will have to go through a combination of treatments, for example, surgery with
chemotherapy or radiation therapy.
Some may receive immunotherapy, targeted therapy, or hormone therapy. One option of
Clinical Trials can also be in use. Salazar points out that clinical trials are performable for research
purposes in which those patients are engaging who voluntarily participate. Patients decide how
good this option is for them. He suggests that patients must learn a lot before starting to treat
cancer. A detailed discussion with the doctor helps the patient decide which treatment is better for
him or her. (Ramon Salazar, 2011)
Some new treatments lead to other types of cancers, e.g., targeted therapies in hepatocellular
carcinoma and renal cell carcinoma. In some other cancers, the addition of targeted therapies has
improved survival rates, such as colon cancer, head and neck cancers, and pancreatic
adenocarcinoma. The addition of chemotherapeutic agents has improved survival in some types of
cancer, for example, oxaliplatin in colon cancer treatment and adjuvant chemotherapy in non-small
cell lung cancer. In cancer research, a group of researchers affirm that surgery continues to be the
chief treatment option; nevertheless, irradiation and chemotherapy are essential to improve the cure
rate produced by surgery (Pellegrini, Anna, 2010).
In comparison, Albrecht, another researcher, states that some drugs are targeting Cancer
Cells more than chemotherapy brought a revolution in Cancer Treatment. These are called Smart
Drugs and are less toxic as they discriminate between normal and malignant cells. It is called
Passive Immunotherapy, and it started at the end of the nineteenth century. A better chance for
curing cancer is through early diagnosis, detection, and treatment (Albrecht, 2009).
Bhupendra Koul, in his study of cancer and treatment, mentioned types of cancer, its
symptoms, diagnosis, and treatment. The author has advocated herbal therapy as compared to
chemotherapy. He also narrates that cancer is not one disease; instead, he suggested it is a group of
various diseases. Therefore, treating the underlying conditions through herbal therapy will reduce
the side effects of chemical therapy or other radiation therapy (Koul, 2019).
Severity during Cancer Treatment
Journal of Management Information and Decision Sciences Volume 25, Special Issue 2, 2022
5 1532-5806-25-S2-30
Citation Information: Alhammadi, M.S.E. & Tariq, M.U. (2022). Proposed Cancer Disease Prediction Model Using Machine Learning.
Journal of Management Information and Decision Sciences, 25(S2), 1–23
Cancer and its treatment can cause several complications, including pain, fatigue, breathing
difficulty, nausea, irregular bowel movements, weight loss, chemical changes in the body,
neurological problems and brain functions issues, and immune system weakness. These
complications are as following: a. Pain: Cancer treatment can induce pain in the patient. Medications can effectively treat cancer-related
discomfort.
b. Fatigue: During chemotherapy or radiation therapy, it is common to feel fatigued, but it usually happens for a
short period.
c. Difficulty Breathing: Although treatments may bring relief, cancer or cancer treatment may cause a feeling of
being short of breath during the therapy.
d. Nausea: Certain types of cancer and their related treatments can cause nausea. Medications and other therapies
prevent or help reduce nausea feelings.
e. Irregular Bowel Movements: It can perceive that cancer treatment can induce erratic bowel movements such
as diarrhea or constipation.
f. Weight loss: Weight loss as a result of chemotherapy or radiation therapy is observable in many patients. With
cancer, deficiency of food from normal cells makes it difficult to treat.
g. Chemical Changes in the Body: Cancer can upset the average chemical balance in the patient’s body and
increase serious complications. Excessive thirst, frequent urination, constipation, and confusion are usually
observable.
h. Neurological Problems and Brain Functioning: Cancer can cause neurological-related issues in patients
such as pain, fatigue, and proper body parts. Similarly, cancer treatment can be difficult for many that can
induce severe headaches and stroke-like signs and symptoms in the patients, leading to body weakness and
overall health.
i. Immune System: Unusual immune system reactions to cancer during the treatment may occur. In some cases,
the body’s immune system may react to the presence of cancer by attacking healthy cells; the process is known
as paraneoplastic syndrome. These infrequent reactions can lead to various signs and symptoms, such as
difficulty walking and seizures. Therefore, extra care is required when going through the treatment procedures.
Advances in scientific knowledge and large data processing lead to databases and
repositories growth exponentially in recent years. One of the rich data domains is the biomedical
domain. A vast array of biomedical data is now available, containing a wealth of knowledge
ranging from clinical symptom specifics to different biochemical data and imaging system outputs.
Epidemiological cancer research is an important biomedical research area that receives much
attention around the world. Cancer has been described as a heterogeneous disease with a wide range
of subtypes. Early detection and prognosis of a cancer type have become a priority in cancer
research because it can help with patient clinical management. The enormous amount of secret data
in massive databases related to cancer with all of its complexities has sparked much interest in data
mining. While data mining is a discipline that combines classical statistics with computer science
algorithms, such as machine learning, to extract new and useful information from large amounts of
data, it has proven to be a useful tool in bioinformatics. It can show variation in cancer incidence
and mortality by country, ethnicity, gender, and socioeconomic factors, which can help public
health needs assessment and cancer burden research. Furthermore, data mining tools to analyse the
patient's profile in detail, secret, previously unknown relationships between the patient's profile,
cancer care, and surveillance may be discovered. (Ahmed Maalel, 2021)
Oral lichen planus (OLP) was designated as a premalignant disorder by the World Health
Organization (WHO) in 2005. The characteristics of OLP that are undergoing malignant
transformation and the risk factors that lead to this transformation are largely unknown. A
retrospective review of electronic health records (EHR) of oral medicine patients between 2005 and
2018 was approved by an Institutional Review Board (IRB) using ICD9 and ICD10 diagnosis codes
for OLP and OSCC. Medical observations, histopathology files, laboratory tests, and demographic
data were checked in cases for both diagnoses. Four predictors significantly influenced the length of
Journal of Management Information and Decision Sciences Volume 25, Special Issue 2, 2022
6 1532-5806-25-S2-30
Citation Information: Alhammadi, M.S.E. & Tariq, M.U. (2022). Proposed Cancer Disease Prediction Model Using Machine Learning.
Journal of Management Information and Decision Sciences, 25(S2), 1–23
time between OLP and OSCC diagnoses in this population. The use of topical pharmacological
therapy to treat OLP seems to have slowed the progression of OLP lesions to OSCC.
Furthermore, the findings of this study indicate that candida infection may have a negative
impact on the development of OLP lesions, as patients with candida overgrowth had a shorter
period between OLP and OSCC diagnoses in years. Further prospective studies are required to
understand better the disease pathogenesis and malignant transformation potential of these lesions.
(Bindakhil, 2020).
METHOD
This section focuses on methodology to analyze and predict the cancer type and most
cancers affected age in both men and women. It starts with describing the paper's purpose and
research question. The following part includes the adopted method for predicting cancer type and
affected age in men and women, data mining goals, alternative methods for prediction, data
collection processes, and the specification of a Data Mining approach used for prediction.
Alternative methods for analysis on cancer prediction are as following:
Data Collection
Data collection is the process of gathering information based on paper needs and
requirements in a systematic way that enables us to address the correct hypotheses to reach the
paper goals. There are two different types of data gathering, primary data gathering and secondary
data gathering. Primary data gathering is firstly collected specifically for the paper, while secondary
data gathering is all about accessing already collected data that is produced by others.
Data Collection Processes
Data collection processes include:
Data Gathering
The data used in this paper is secondary data collected by an individual, which includes the
data of both males and females’ cancer patients from the UAE. Data were collected from patient's
reports where the top five leading causes of death among cancers in men are Lung, Colorectal,
Liver, Leukaemia, and Pancreas, and the top five Leading causes of death among cancers in women
are breast, Colorectal, Leukaemia, Ovary, and Lung. Data was stored in an excel file to understand
the main features that may affect cancer diagnostics using data analysis.
Data Pre-processing
Before using the existing data for the paper, all the redundant or unnecessary variables must
be removed from the collected data. The Null values, the columns with no unique values, must be
removed too. This process will improve the model’s prediction and increase the accuracy rate.
Data Description
This paper used databases relating to specific types of cancer, years, age groups, etc., in
males and females. The data is divided into five years from 2011 to 2015 for each age group, and
Journal of Management Information and Decision Sciences Volume 25, Special Issue 2, 2022
7 1532-5806-25-S2-30
Citation Information: Alhammadi, M.S.E. & Tariq, M.U. (2022). Proposed Cancer Disease Prediction Model Using Machine Learning.
Journal of Management Information and Decision Sciences, 25(S2), 1–23
several variables are in use for age groups. The influencing variables include age, gender,
nationality, and years.
Algorithm for Prediction
Built-in algorithm of three libraries, Pandas, Matplotlib, and NumPy, and Python
programming language, was used. For Predictions, we use an exponential smoothing algorithm,
which takes data of the last five years and generates predictions of the next five years according to
the available data. Predictions have been shown through the graph.
Method Reflection
The predefined goal was to tell the importance of gathering data so that the development of
a prediction model will be possible, which will be able to analyze and predict cancer in an
individual. Here, the data a large data from 2011-2015 is visualized by using specific python built-
in algorithms of Pandas, Matplotlib, and NumPy libraries. Our finding depends upon the following
steps:
i. Data Cleaning Process by replacing or eliminating missing values
ii. Changing data formats
iii. Organizing Rows
iv. Adding or Deleting rows and columns
v. Integrating or merging Data Frames
vi. Summarizing data
vii. Generating visualizations using the algorithm in python
In the data analysis process, we focus on data firstly. We collect the data according to our
requirements, and then we convert the data into structured. Structured data is the information that is
available in an ordered format to make it easily readable. (Margriet Groenendijk, 2020).
Data Cleaning Process by Replacing or Eliminating Missing Values
Before using the existing data for the paper, all the redundant or unnecessary variables must
be removed from the collected data. Data cleaning process include replacing wrong given values
with the accurate one. In addition, the Null values, the columns with no unique values, must be
removed too. This process will improve the model’s prediction and increase the accuracy rate.
Changing Data Formats
The data format is a particular arrangement of the fields of data in a specific shape. Data
will be arranged in a clear format so that performing analysis of the data will be accurate.
Organizing Rows
After formatting the data, the data has been organized in rows for performing better analysis
for visualization of data.
Journal of Management Information and Decision Sciences Volume 25, Special Issue 2, 2022
8 1532-5806-25-S2-30
Citation Information: Alhammadi, M.S.E. & Tariq, M.U. (2022). Proposed Cancer Disease Prediction Model Using Machine Learning.
Journal of Management Information and Decision Sciences, 25(S2), 1–23
Adding or Deleting Rows and Columns
After organizing the data in rows, rows and columns have been added according to the data
available for analysis. This process will improve the data’s visualization and increase the accuracy
rate.
Integrating or merging Data Frames
In this step, data frames that relate to each other for analysis have been integrated. This
process will improve the data’s visualization and increase the accuracy rate.
Summarizing Data
Data were summarized according to the requirement of the data fields for analysis. This
process will improve the data’s visualization and increase the accuracy rate. The data from years
2011 to 2015 has been gathered from the reports of cancer patients from the UAE, which has
different attributes like case no, sex (male, female), age, Nationality, ICD-10 code (cancer type),
grade, the base of diagnoses, year of diagnoses, and summary stage. The given data in large files are
used to analyze the most common age group and the most common cancer type in UAE.
RESULTS AND ANALYSIS
This section gives an overview of the results, which have been achieved during the data
analysis. It also provides information about the experiment process to solve the paper question and
analyzes analysis results. It focuses on analysis techniques in use and results from those analyses.
Finally, we measure analysis models’ evaluation according to the analysis results.
After analyzing the requirements of the paper, data has been gathered and cleansed. After
cleansing of data, it has been transformed into filed for better data analysis and predictions. Finally,
transformed data has been used to build analysis and prediction models. The built-in algorithm of
three libraries, Pandas, Matplotlib, and NumPy, has been used to analyze model implementation.
For Predictions, an exponential smoothing algorithm has been implemented.
Description of Findings
There are some methods to know about the cancer rate in UAE like the cancer rate is
increasing or decreasing annually. The data analysis methodology is used to visualize data by
implementing built-in algorithms of three different libraries using Python programming language to
visualize results to know the age range with the highest cancer probability and the most common
type of cancer.
By knowing the importance of data, data should be saved in a structured form so that
creating a prediction model will be possible in the future that will help us to predict cancer using the
accurate data, which will be gathered and transformed into a dataset for the training of the
prediction model.
The methods that will be in use during the implementation of the prediction model in the
future can come up with the necessary help to prevent any cancer type because there will be earlier
diagnoses, and the health sector will explore earlier medication for it. Therefore, the predefined goal
was to tell the importance of gathering data to develop a prediction model in the future that can
analyze and predict the cancer type in an individual.
Journal of Management Information and Decision Sciences Volume 25, Special Issue 2, 2022
9 1532-5806-25-S2-30
Citation Information: Alhammadi, M.S.E. & Tariq, M.U. (2022). Proposed Cancer Disease Prediction Model Using Machine Learning.
Journal of Management Information and Decision Sciences, 25(S2), 1–23
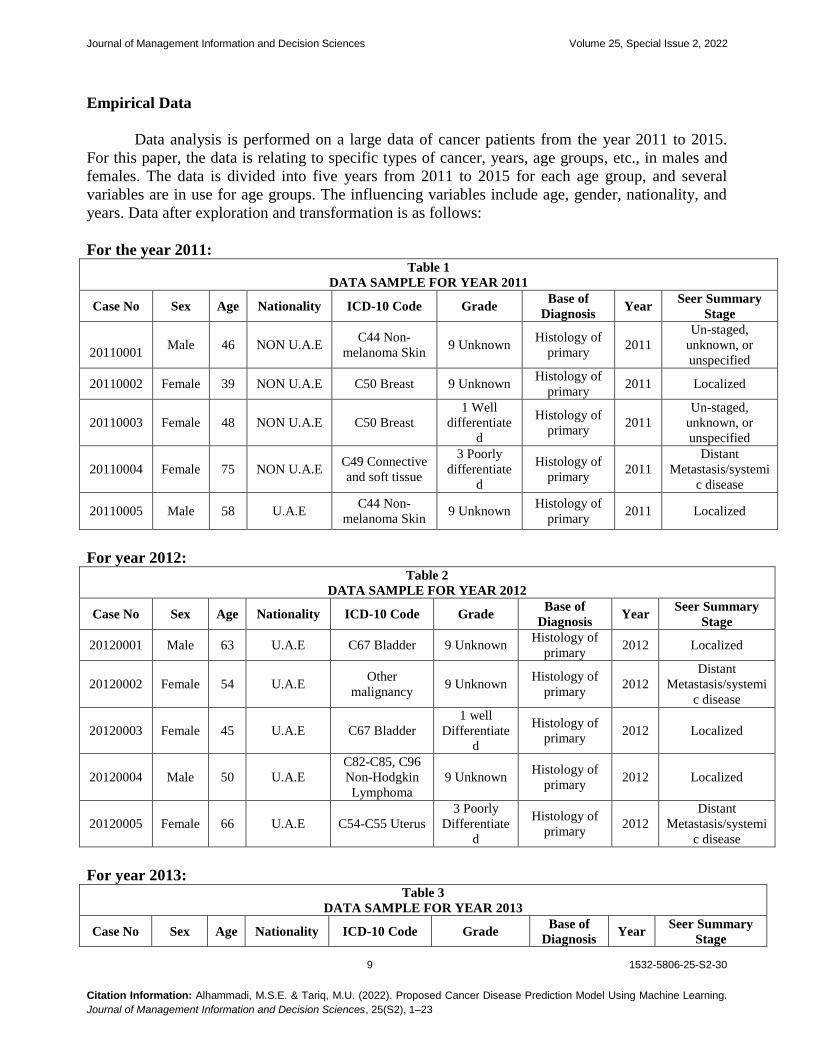
Empirical Data
Data analysis is performed on a large data of cancer patients from the year 2011 to 2015.
For this paper, the data is relating to specific types of cancer, years, age groups, etc., in males and
females. The data is divided into five years from 2011 to 2015 for each age group, and several
variables are in use for age groups. The influencing variables include age, gender, nationality, and
years. Data after exploration and transformation is as follows:
For the year 2011: Table 1
DATA SAMPLE FOR YEAR 2011
Case No Sex Age Nationality ICD-10 Code Grade Base of
Diagnosis Year
Seer Summary
Stage
20110001 Male 46 NON U.A.E
C44 Non-
melanoma Skin 9 Unknown
Histology of
primary 2011
Un-staged,
unknown, or
unspecified
20110002 Female 39 NON U.A.E C50 Breast 9 Unknown Histology of
primary 2011 Localized
20110003 Female 48 NON U.A.E C50 Breast
1 Well
differentiate
d
Histology of
primary 2011
Un-staged,
unknown, or
unspecified
20110004 Female 75 NON U.A.E C49 Connective
and soft tissue
3 Poorly
differentiate
d
Histology of
primary 2011
Distant
Metastasis/systemi
c disease
20110005 Male 58 U.A.E C44 Non-
melanoma Skin 9 Unknown
Histology of
primary 2011 Localized
For year 2012: Table 2
DATA SAMPLE FOR YEAR 2012
Case No Sex Age Nationality ICD-10 Code Grade Base of
Diagnosis Year
Seer Summary
Stage
20120001 Male 63 U.A.E C67 Bladder 9 Unknown Histology of
primary 2012 Localized
20120002 Female 54 U.A.E Other
malignancy 9 Unknown
Histology of
primary 2012
Distant
Metastasis/systemi
c disease
20120003 Female 45 U.A.E C67 Bladder
1 well
Differentiate
d
Histology of
primary 2012 Localized
20120004 Male 50 U.A.E
C82-C85, C96
Non-Hodgkin
Lymphoma
9 Unknown Histology of
primary 2012 Localized
20120005 Female 66 U.A.E C54-C55 Uterus
3 Poorly
Differentiate
d
Histology of
primary 2012
Distant
Metastasis/systemi
c disease
For year 2013: Table 3
DATA SAMPLE FOR YEAR 2013
Case No Sex Age Nationality ICD-10 Code Grade Base of
Diagnosis Year
Seer Summary
Stage
Journal of Management Information and Decision Sciences Volume 25, Special Issue 2, 2022
10 1532-5806-25-S2-30
Citation Information: Alhammadi, M.S.E. & Tariq, M.U. (2022). Proposed Cancer Disease Prediction Model Using Machine Learning.
Journal of Management Information and Decision Sciences, 25(S2), 1–23
20130001
Female 28 NON U.A.E C50 Breast
2 Moderately
differentiated
Histology
of primary 2013
20130002 Male 34 NON U.A.E
C00-C14 Lip,
Oral cavity &
pharynx
4
Undifferentiate
d/ Anaplastic
Histology
of primary 2013
20130003 Female 42 NON U.A.E C50 Breast 2 Moderately
differentiated
Histology
of primary 2013
20130004 Male 50 NON U.A.E
C82-C85, C96
Non-Hodgkin
lymphoma
9 Unknow Histology
of primary 2013
20130005 Female 52 NON U.A.E C53 Cervix
uteri
3 Poorly
differentiated
Histology
of primary 2013
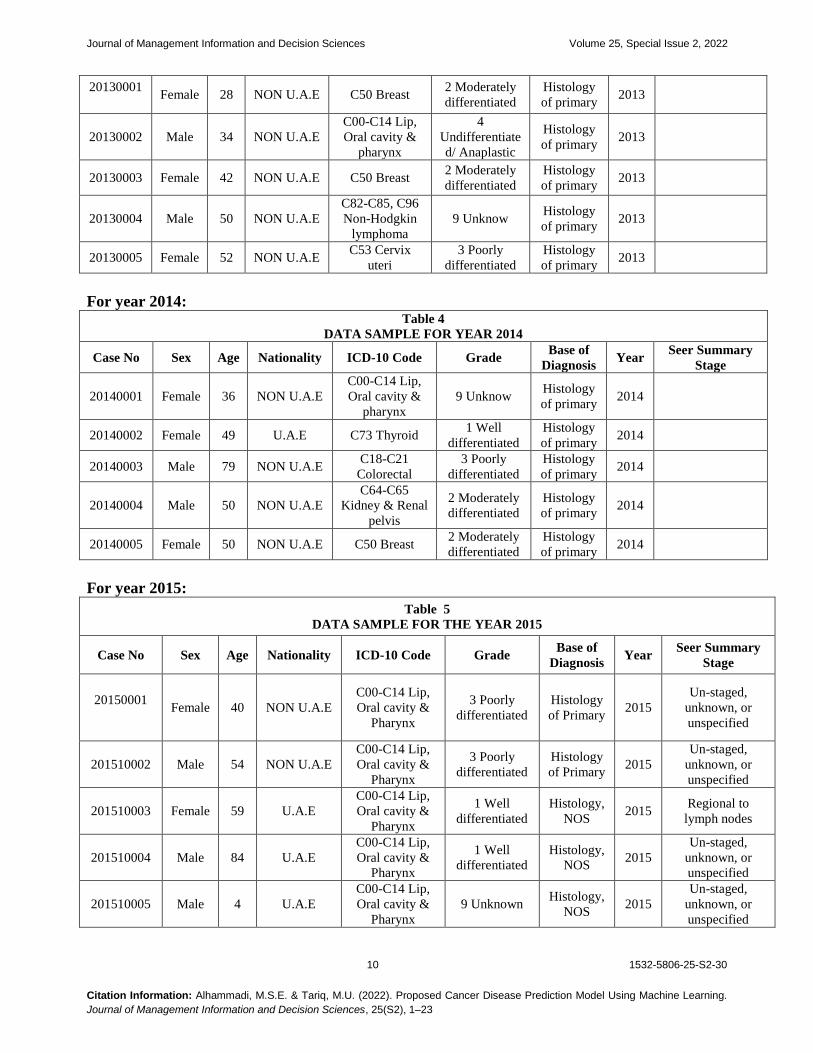
For year 2014: Table 4
DATA SAMPLE FOR YEAR 2014
Case No Sex Age Nationality ICD-10 Code Grade Base of
Diagnosis Year
Seer Summary
Stage
20140001 Female 36 NON U.A.E
C00-C14 Lip,
Oral cavity &
pharynx
9 Unknow Histology
of primary 2014
20140002 Female 49 U.A.E C73 Thyroid 1 Well
differentiated
Histology
of primary 2014
20140003 Male 79 NON U.A.E C18-C21
Colorectal
3 Poorly
differentiated
Histology
of primary 2014
20140004 Male 50 NON U.A.E
C64-C65
Kidney & Renal
pelvis
2 Moderately
differentiated
Histology
of primary 2014
20140005 Female 50 NON U.A.E C50 Breast 2 Moderately
differentiated
Histology
of primary 2014
For year 2015:
Table 5
DATA SAMPLE FOR THE YEAR 2015
Case No Sex Age Nationality ICD-10 Code Grade Base of
Diagnosis Year
Seer Summary
Stage
20150001
Female 40 NON U.A.E
C00-C14 Lip,
Oral cavity &
Pharynx
3 Poorly
differentiated
Histology
of Primary 2015
Un-staged,
unknown, or
unspecified
201510002 Male 54 NON U.A.E
C00-C14 Lip,
Oral cavity &
Pharynx
3 Poorly
differentiated
Histology
of Primary 2015
Un-staged,
unknown, or
unspecified
201510003 Female 59 U.A.E
C00-C14 Lip,
Oral cavity &
Pharynx
1 Well
differentiated
Histology,
NOS 2015
Regional to
lymph nodes
201510004 Male 84 U.A.E
C00-C14 Lip,
Oral cavity &
Pharynx
1 Well
differentiated
Histology,
NOS 2015
Un-staged,
unknown, or
unspecified
201510005 Male 4 U.A.E
C00-C14 Lip,
Oral cavity &
Pharynx
9 Unknown Histology,
NOS 2015
Un-staged,
unknown, or
unspecified

Journal of Management Information and Decision Sciences Volume 25, Special Issue 2, 2022
11 1532-5806-25-S2-30
Citation Information: Alhammadi, M.S.E. & Tariq, M.U. (2022). Proposed Cancer Disease Prediction Model Using Machine Learning.
Journal of Management Information and Decision Sciences, 25(S2), 1–23
The data from years 2011 to 2015 has been gathered from the reports of cancer patients
from the UAE, which has different attributes like case no, sex (male, female), age, Nationality,
ICD-10 code (cancer type), grade, the base of diagnoses, year of diagnoses, and seer summary
stage. The given data in large files is used to perform analysis in visualizing the most common age
group and the most common cancer type in UAE.
Data Visualization
Data visualization deals with the graphical representation of the data. For example, data
visualization for our paper is as follows in the graphical format of columns and pie charts.
Data Visualization of Common Cancer Affected Age
FIGURE 1
OUTPUT FOR COMMON AFFECTED AGE FROM YEARS 2011 TO 2015
Graphical Representation of Most Affected Age
FIGURE 1
VISUALIZATION OF COMMONLY AFFECTED AGE
The above figures show:

Journal of Management Information and Decision Sciences Volume 25, Special Issue 2, 2022
12 1532-5806-25-S2-30
Citation Information: Alhammadi, M.S.E. & Tariq, M.U. (2022). Proposed Cancer Disease Prediction Model Using Machine Learning.
Journal of Management Information and Decision Sciences, 25(S2), 1–23
In year 2011, the most affected from cancer age was 51.
In year 2012, the most affected age was 53.
In year 2013, the most affected age from cancer was 56.
In year 2014, the most affected age from cancer was 56.
In year 2015, the most affected age from cancer was 59.
Hence, the most affected age in years 2011-2015 is between 50 to 60 age group. This means
the people of more age are more affected by cancer in UAE.
Data Visualization of Common Cancer Type
FIGURE 2
VISUALIZATION OF COMMON CANCER TYPE FOR 2011
Different colors in Pie-Chart represent different cancer diseases, as shown in the label with
colors. For example, the green color represents C50 According to analysis results from data for
years 2011-2015, in the year 2011, there were five common types of cancer in the UAE. Which are:
i. C50 Breast
ii. C18-C21 Colorectal
iii. C34 Bronchus and Lung
iv. C91-C95 Leukaemia
v. C73 Thyroid Gland
Moreover, if we talk about the most common cancer type in the year 2011, that is Breast
cancer (C50 Breast).
Common Cancer Type for the Year 2012
Journal of Management Information and Decision Sciences Volume 25, Special Issue 2, 2022
13 1532-5806-25-S2-30
Citation Information: Alhammadi, M.S.E. & Tariq, M.U. (2022). Proposed Cancer Disease Prediction Model Using Machine Learning.
Journal of Management Information and Decision Sciences, 25(S2), 1–23
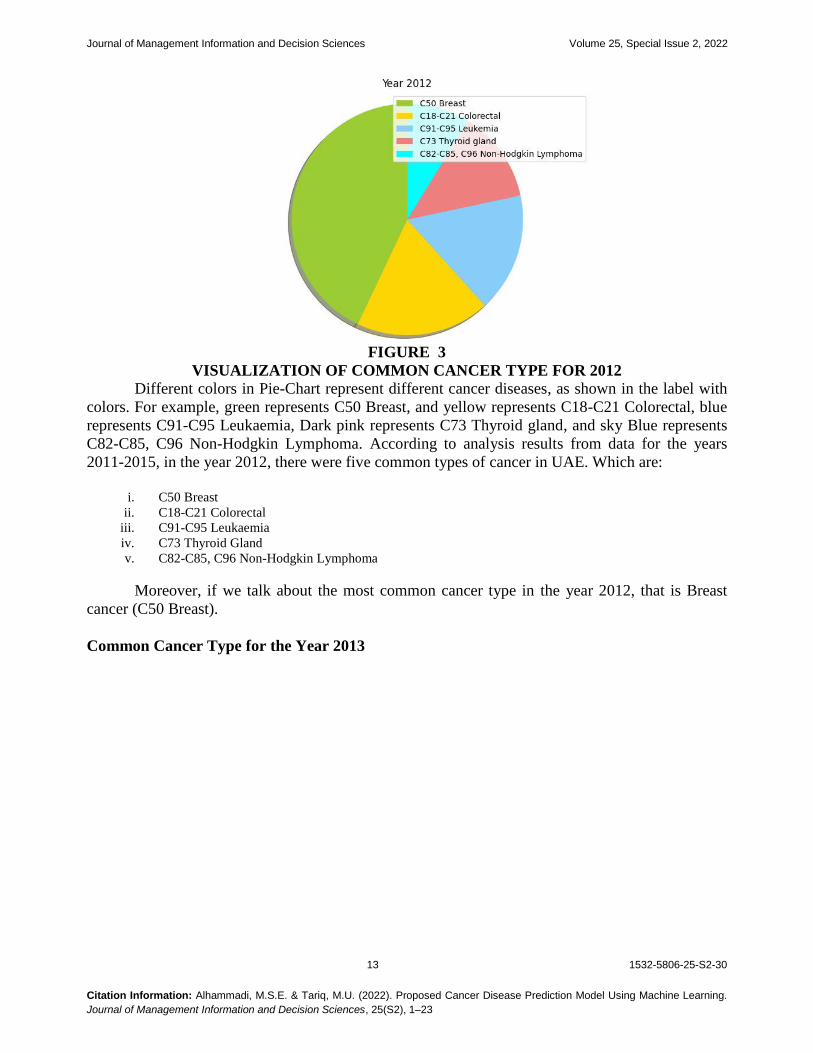
FIGURE 3
VISUALIZATION OF COMMON CANCER TYPE FOR 2012
Different colors in Pie-Chart represent different cancer diseases, as shown in the label with
colors. For example, green represents C50 Breast, and yellow represents C18-C21 Colorectal, blue
represents C91-C95 Leukaemia, Dark pink represents C73 Thyroid gland, and sky Blue represents
C82-C85, C96 Non-Hodgkin Lymphoma. According to analysis results from data for the years
2011-2015, in the year 2012, there were five common types of cancer in UAE. Which are:
i. C50 Breast
ii. C18-C21 Colorectal
iii. C91-C95 Leukaemia
iv. C73 Thyroid Gland
v. C82-C85, C96 Non-Hodgkin Lymphoma
Moreover, if we talk about the most common cancer type in the year 2012, that is Breast
cancer (C50 Breast).
Common Cancer Type for the Year 2013
Journal of Management Information and Decision Sciences Volume 25, Special Issue 2, 2022
14 1532-5806-25-S2-30
Citation Information: Alhammadi, M.S.E. & Tariq, M.U. (2022). Proposed Cancer Disease Prediction Model Using Machine Learning.
Journal of Management Information and Decision Sciences, 25(S2), 1–23
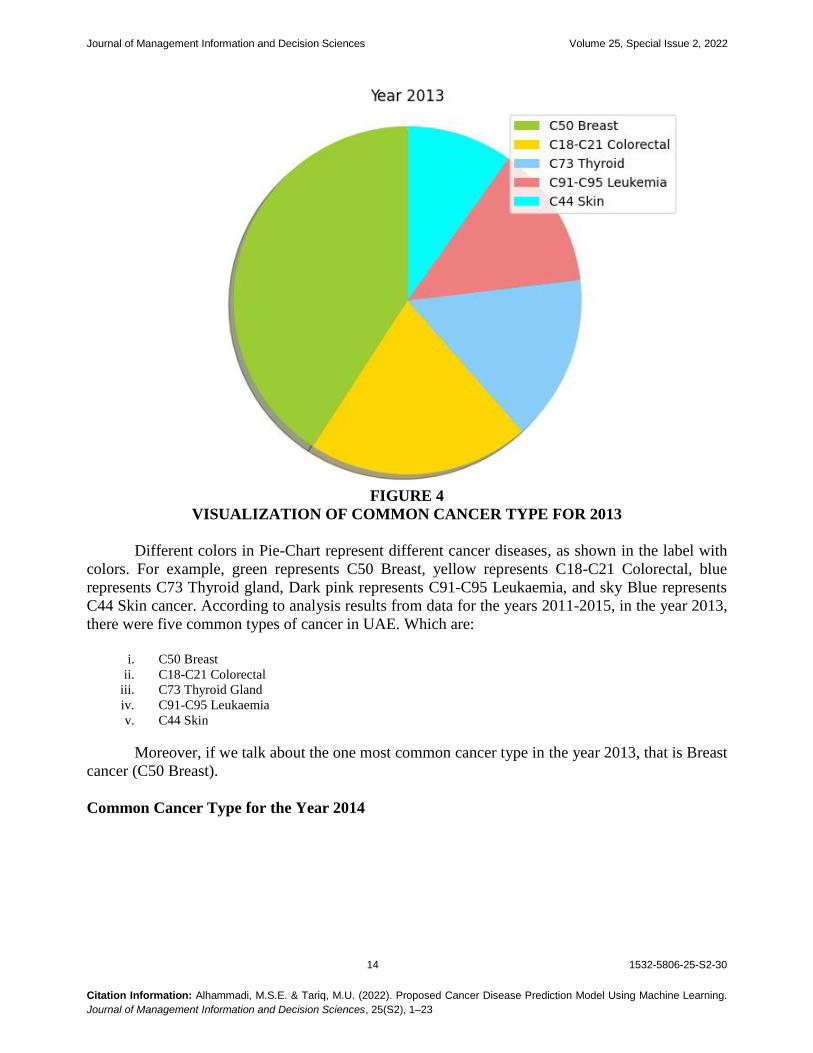
FIGURE 4
VISUALIZATION OF COMMON CANCER TYPE FOR 2013
Different colors in Pie-Chart represent different cancer diseases, as shown in the label with
colors. For example, green represents C50 Breast, yellow represents C18-C21 Colorectal, blue
represents C73 Thyroid gland, Dark pink represents C91-C95 Leukaemia, and sky Blue represents
C44 Skin cancer. According to analysis results from data for the years 2011-2015, in the year 2013,
there were five common types of cancer in UAE. Which are:
i. C50 Breast
ii. C18-C21 Colorectal
iii. C73 Thyroid Gland
iv. C91-C95 Leukaemia
v. C44 Skin
Moreover, if we talk about the one most common cancer type in the year 2013, that is Breast
cancer (C50 Breast).
Common Cancer Type for the Year 2014
Journal of Management Information and Decision Sciences Volume 25, Special Issue 2, 2022
15 1532-5806-25-S2-30
Citation Information: Alhammadi, M.S.E. & Tariq, M.U. (2022). Proposed Cancer Disease Prediction Model Using Machine Learning.
Journal of Management Information and Decision Sciences, 25(S2), 1–23
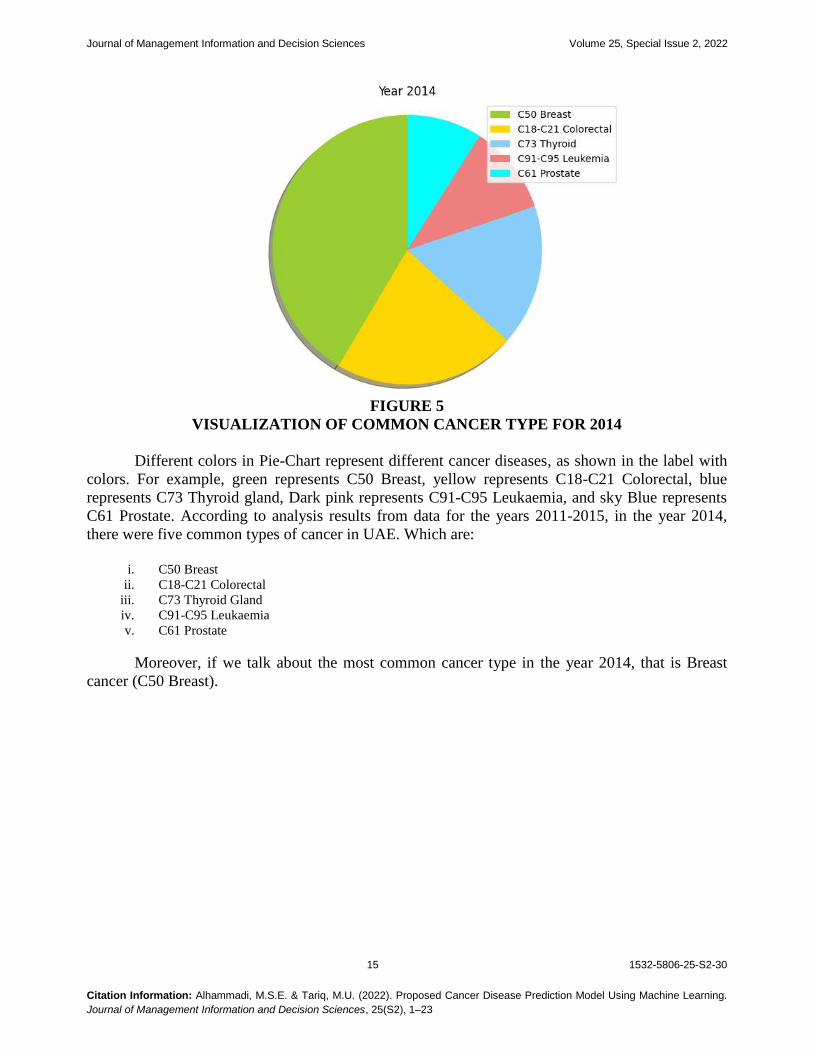
FIGURE 5
VISUALIZATION OF COMMON CANCER TYPE FOR 2014
Different colors in Pie-Chart represent different cancer diseases, as shown in the label with
colors. For example, green represents C50 Breast, yellow represents C18-C21 Colorectal, blue
represents C73 Thyroid gland, Dark pink represents C91-C95 Leukaemia, and sky Blue represents
C61 Prostate. According to analysis results from data for the years 2011-2015, in the year 2014,
there were five common types of cancer in UAE. Which are:
i. C50 Breast
ii. C18-C21 Colorectal
iii. C73 Thyroid Gland
iv. C91-C95 Leukaemia
v. C61 Prostate
Moreover, if we talk about the most common cancer type in the year 2014, that is Breast
cancer (C50 Breast).

Journal of Management Information and Decision Sciences Volume 25, Special Issue 2, 2022
16 1532-5806-25-S2-30
Citation Information: Alhammadi, M.S.E. & Tariq, M.U. (2022). Proposed Cancer Disease Prediction Model Using Machine Learning.
Journal of Management Information and Decision Sciences, 25(S2), 1–23
Common Cancer Type for the Year 2015
FIGURE 6
VISUALIZATION OF COMMON CANCER TYPE FOR 2015
Different colors in Pie-Chart represent different cancer diseases, as shown in the label with
colors. For example, green represents C50 Breast, yellow represents C18-C21 Colorectal, blue
represents C73 Thyroid gland, Dark pink represents C91-C95 Leukaemia, and sky Blue represents
C82-C85, C96 Non-Hodgkin lymphoma. According to analysis results from data for years 2011-
2015, in 2015, there were five common types of cancer in UAE. Which are:
i. C50 Breast
ii. C18-C21 Colorectal
iii. C73 Thyroid Gland
iv. C91-C95 Leukaemia
v. C82-C85, C96 Non-Hodgkin lymphoma
Moreover, if we talk about the one most common cancer type in the year 2015, that is Breast
cancer (C50 Breast). Hence, in the years 2011-2015, the most common cancer type was breast
cancer.
Predictions
For Predictions, an exponential smoothing algorithm is in use, which takes data of the last
five years and generates predictions of the next five years according to the available data.
Predictions have been shown through the graph. We are giving time series to the exponential
smoothing algorithm, and algorithms have learned through the time series like how many cases
were there in those years after that algorithm learns through the data and predicts about coming
years.
Journal of Management Information and Decision Sciences Volume 25, Special Issue 2, 2022
17 1532-5806-25-S2-30
Citation Information: Alhammadi, M.S.E. & Tariq, M.U. (2022). Proposed Cancer Disease Prediction Model Using Machine Learning.
Journal of Management Information and Decision Sciences, 25(S2), 1–23
Predictions on Most Affected Age in Years 2016-2020:
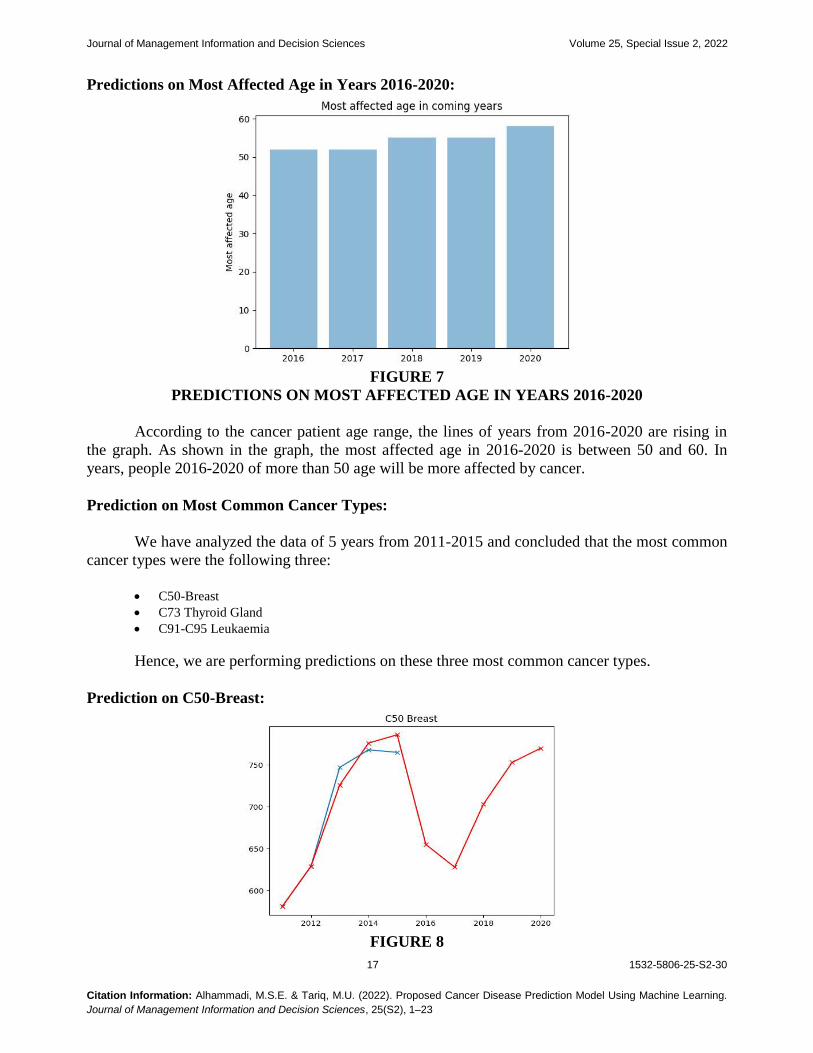
FIGURE 7
PREDICTIONS ON MOST AFFECTED AGE IN YEARS 2016-2020
According to the cancer patient age range, the lines of years from 2016-2020 are rising in
the graph. As shown in the graph, the most affected age in 2016-2020 is between 50 and 60. In
years, people 2016-2020 of more than 50 age will be more affected by cancer.
Prediction on Most Common Cancer Types:
We have analyzed the data of 5 years from 2011-2015 and concluded that the most common
cancer types were the following three:
C50-Breast
C73 Thyroid Gland
C91-C95 Leukaemia
Hence, we are performing predictions on these three most common cancer types.
Prediction on C50-Breast:
FIGURE 8
Journal of Management Information and Decision Sciences Volume 25, Special Issue 2, 2022
18 1532-5806-25-S2-30
Citation Information: Alhammadi, M.S.E. & Tariq, M.U. (2022). Proposed Cancer Disease Prediction Model Using Machine Learning.
Journal of Management Information and Decision Sciences, 25(S2), 1–23
PREDICTION ON C50-BREAST
The above graph shows the predictions on the C50-Breast Cancer from year 2012 to 2020
and blue line shows the actual data available for predicting values for the years 2016-2020. It is
obvious from the graph on prediction that: In 2011, breast cancer patients were less than 600.
In 2012, breast cancer patients were in between 600-650.
In 2013, breast cancer patients were between 700-750.
In 2014, breast cancer patients were more than 750.
In 2015, breast cancer patients were near 800.
In 2016, the prediction was that breast cancer patients would be between 650-700.
In 2017, the prediction was that breast cancer patients would be in between 600-650
In 2018, the prediction was that breast cancer patients would be more than 700.
In 2019, the prediction was that breast cancer patients would be almost 750.
In 2020, the prediction was that breast cancer patients would be more than 750.
Prediction on C73 Thyroid Gland:
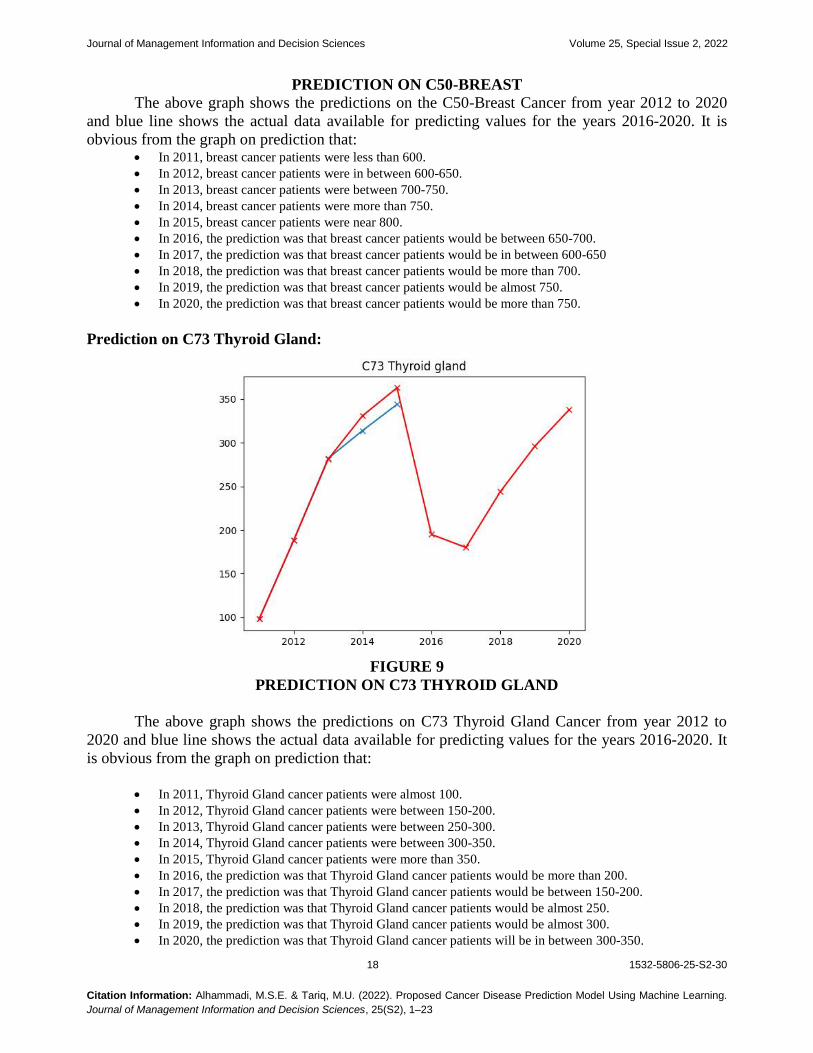
FIGURE 9
PREDICTION ON C73 THYROID GLAND
The above graph shows the predictions on C73 Thyroid Gland Cancer from year 2012 to
2020 and blue line shows the actual data available for predicting values for the years 2016-2020. It
is obvious from the graph on prediction that:
In 2011, Thyroid Gland cancer patients were almost 100.
In 2012, Thyroid Gland cancer patients were between 150-200.
In 2013, Thyroid Gland cancer patients were between 250-300.
In 2014, Thyroid Gland cancer patients were between 300-350.
In 2015, Thyroid Gland cancer patients were more than 350.
In 2016, the prediction was that Thyroid Gland cancer patients would be more than 200.
In 2017, the prediction was that Thyroid Gland cancer patients would be between 150-200.
In 2018, the prediction was that Thyroid Gland cancer patients would be almost 250.
In 2019, the prediction was that Thyroid Gland cancer patients would be almost 300.
In 2020, the prediction was that Thyroid Gland cancer patients will be in between 300-350.

Journal of Management Information and Decision Sciences Volume 25, Special Issue 2, 2022
19 1532-5806-25-S2-30
Citation Information: Alhammadi, M.S.E. & Tariq, M.U. (2022). Proposed Cancer Disease Prediction Model Using Machine Learning.
Journal of Management Information and Decision Sciences, 25(S2), 1–23
Prediction on C91-C95 Leukaemia:
FIGURE 10
PREDICTION ON C91-C95 LEUKAEMIA
The above graph shows the predictions on C91-C95 Leukaemia Cancer from year 2012 to
2020 and blue line shows the actual data available for predicting values for the years 2016-2020. It
is obvious from the graph on prediction that:
In 2011, Leukaemia cancer patients were more than 100.
In 2012, Leukaemia cancer patients were in between 225-250.
In 2013, Leukaemia cancer patients were more than 275.
In 2014, Leukaemia cancer patients were more than 250.
In 2015, Leukaemia cancer patients were more than 250.
In 2016, the prediction was that Leukaemia cancer patients would be between 150-175.
In 2017, the prediction was that Leukaemia cancer patients would be more than 200.
In 2018, the prediction was that Leukaemia cancer patients would be more than 225.
In 2019, the prediction was that Leukaemia cancer patients would be between 200-225.
In 2020, the prediction was that Leukaemia cancer patients would be between 225-250.
Result Interpretation
The predefined goal was to tell the importance of gathering data to develop a prediction
model in the future that can analyze and predict the cancer type in an individual. Here, the data a
large data from 2011-2015 is visualized by using specific python built-in algorithms of Pandas,
Matplotlib, and NumPy libraries. In the data analysis process, the focus is on data firstly. Data
collection will be done according to the requirement, and then data will be organized to convert into
a structured data form. Structured data is the information available in an ordered format to make it
easily readable. (Margriet Groenendijk, 2020).
Results for Common Cancer Affected Age
Journal of Management Information and Decision Sciences Volume 25, Special Issue 2, 2022
20 1532-5806-25-S2-30
Citation Information: Alhammadi, M.S.E. & Tariq, M.U. (2022). Proposed Cancer Disease Prediction Model Using Machine Learning.
Journal of Management Information and Decision Sciences, 25(S2), 1–23
When the age group was analyzed, the following results have been originated for the years
2011-2015:
In the year 2011, the most affected from cancer age was 51.
In the year 2012, the most affected age was 53.
In the year 2013, the most affected age from cancer was 56.
In the year 2014, the most affected age from cancer was 56.
In the year 2015, the most affected age from cancer was 59.
Hence, the most affected age in years 2011-2015 is between 50 to 60 age group. This means
the people of more age are more affected by cancer in UAE.
Results for Common Cancer Type
According to analysis results from data for the years 2011-2015, in the year 2011, there
were five common types of cancer in UAE. Which are:
a. C50 Breast
b. C18-C21 Colorectal
c. C34 Bronchus and Lung
d. C91-C95 Leukaemia
e. C73 Thyroid Gland
So, the most common cancer type in the year 2011 was Breast cancer (C50 Breast),
according to the analysis result, which was performed on the data of the year 2011.
In the year 2012, there were five common types of cancer in the UAE. Which are:
a. C50 Breast
b. C18-C21 Colorectal
c. C91-C95 Leukaemia
d. C73 Thyroid Gland
e. C82-C85, C96 Non-Hodgkin Lymphoma
Similarly, the most common cancer type in 2012 was Breast cancer (C50 Breast), according
to the analysis result, which was performed on the data of the year 2012.
In the year 2013, there were five common types of cancer in the UAE. Which are:
a. C50 Breast
b. C18-C21 Colorectal
c. C73 Thyroid Gland
d. C91-C95 Leukaemia
e. C44 Skin
So, the most common cancer type in the year 2013 was Breast cancer (C50 Breast),
according to the analysis result, which was performed on the data of the year 2013.
In the year 2014, there were five common types of cancer in the UAE. Which are:
a. C50 Breast
b. C18-C21 Colorectal
c. C73 Thyroid Gland
d. C91-C95 Leukaemia
e. C61 Prostate
Journal of Management Information and Decision Sciences Volume 25, Special Issue 2, 2022
21 1532-5806-25-S2-30
Citation Information: Alhammadi, M.S.E. & Tariq, M.U. (2022). Proposed Cancer Disease Prediction Model Using Machine Learning.
Journal of Management Information and Decision Sciences, 25(S2), 1–23
So, the most common cancer type in the year 2014 was Breast cancer (C50 Breast),
according to the analysis result, which was performed on the data of the year 2014.
In the year 2015, there were five common types of cancer in the UAE. Which are:
a. C50 Breast
b. C18-C21 Colorectal
c. C73 Thyroid Gland
d. C91-C95 Leukaemia
e. C82-C85, C96 Non-Hodgkin lymphoma
So, the most common cancer type in the year 2015 was Breast cancer (C50 Breast),
according to the analysis result, which was performed on the data of the year 2015. Hence, in 2011-
2015, the most common cancer type was breast cancer, according to the analysis results. Moreover,
by knowing the importance of data, data should be saved in a structured form so that creating a
prediction model will be possible in the future that will help us to predict cancer using the accurate
data, which will be gathered and transformed into a dataset for the training of the prediction model.
The methods that will be in use during the implementation of the prediction model can come
up with the necessary help to prevent any cancer type because there will be earlier diagnoses, and
the health sector will explore earlier medication for it. There are some methods in use to know
about the cancer rate in UAE, like the cancer rate is increasing or decreasing annually. The data
analysis methodology is used to visualize data by implementing built-in algorithms of three
different libraries using Python programming language to visualize results to know the age range
with the highest cancer probability and the most common type of cancer. Data analysis is performed
on a large data of cancer patients from the year 2011 to 2015.
CONCLUSION
From research, the answer to the first question is showing the importance of data accuracy,
like how data accuracy can affect the cancer prediction model for predicting the breast tumor to be
cancerous or not. On the other hand, for the second research question when research was performed
on the diagnosis methods, we have concluded that there are many successful diagnosis methods for
identifying cancer with chemical side effects, which could be improved with further research. In
this way, we ensured the importance of clinical data, like how beneficial it can be for the
Department of Health. Therefore, the Ministry of Health should gather the data and create datasets
on each cancer type to train cancer prediction models in the future, which will save our effort and
time for cancer detection. For this purpose, data of non-cancerous patients will be helpful too.
Therefore, we want to highlight how cancer prediction is possible for researchers, and we want to
inspire them for future research on building a cancer prediction model.
Further research is needed to create accurate and useful datasets on different cancer types
that will be in use for training and testing the cancer prediction model in the future. Accuracy and
integrity are the main concern in the case of data. More accuracy of datasets will lead to better
prediction results. In the future, we can build a Cancer Prediction Model by using Artificial
Intelligence algorithms, which will be smart enough to predict the tumor is cancerous or non-
cancerous in few minutes. There are different Machine learning algorithms in this world, which can
help in early-stage cancer detection. Many methodologies can work in cancer prediction by
implementing a prediction model in the future. Data mining, Cancer prediction in KDD, Artificial
intelligence algorithms, Neural Networks are present for building a cancer prediction model which
can ensure accuracy.
Journal of Management Information and Decision Sciences Volume 25, Special Issue 2, 2022
22 1532-5806-25-S2-30
Citation Information: Alhammadi, M.S.E. & Tariq, M.U. (2022). Proposed Cancer Disease Prediction Model Using Machine Learning.
Journal of Management Information and Decision Sciences, 25(S2), 1–23
REFERENCES
Abdull Mohamed, A.S. (2011). Sheffield Hallam University. Retrieved from shura:
http://shura.shu.ac.uk/20611/1/10701258.pdf
Ahmed Maalel, M.H. (2021). Literature review: Overview of cancer treatment and prediction approaches based on
machine learning.
Ajiboye, T. (2019). How cancer is diagnosed. Retrieved from https://www.verywellhealth.com/cancer-diagnosis-
4689149
Albrecht. (2009). springer. Retrieved from springer: https://link.springer.com/section/10.1007/978-90-481-3186-0_10
Baer. (2007). pubmed.gov. Retrieved from National Library of Medicine: https://pubmed.ncbi.nlm.nih.gov/17637734/
Bindakhil, M. (2020). Characterization of malignant transforming oral lichen planus, A 13-Year retrospective
clinicopathological study in a tertiary center and review of the literature.
Data mining tutorial by wideskills. (2015). Retrieved from data mining tasks: https://wideskills.com/data-mining-
tutorial/05-data-mining-tasks
Department of health. (2020). Retrieved from haad: https://www.haad.ae/simplycheck/tabid/140/Default.aspx
Dermime. (2013). researchgate. Retrieved from researchgate:
https://www.researchgate.net/publication/243274589_Cancer_Diagnosis_Treatment_and_Therapy
Early detection: a long road ahead. (2018). Retrieved from https://www.nature.com/articles/s41568-018-0021-8
Fumo, D. (2017). Types of Machine learning algorithms you should know. Retrieved from Towards Data Science:
https://towardsdatascience.com/types-of-machine-learning-algorithms-you-should-know-953a08248861
Garnick. (2019). dfhcc. Retrieved from dfhcc: https://www.dfhcc.harvard.edu/insider/member-detail/member/marc-b-
garnick-md/
Institute, C.N. (2015). www.cancer.gov. Retrieved from National cancer institute: https://www.cancer.gov/about-
cancer/understanding/what-is-cancer
Ippolito, P.P. (2019). towards data science. Retrieved from towards data science.com:
https://towardsdatascience.com/understanding-cancer-using-machine-learning-84087258ee18
Venkateswara Rao, K.L.M. (2019). researchgate. Retrieved from researchgate. net:
https://www.researchgate.net/publication/337210316_Research_of_Feature_Selection_Methods_to_Predict_Br
Kathait, S. (2017). Variable Reduction: An art as well as Science. Retrieved from
https://www.datasciencecentral.com/profiles/blogs/variable-reduction-an-art-as-well-as-science
Khalife, C. (2017). Why a better understanding of breast cancer is needed. Retrieved from Gulf Business:
https://gulfbusiness.com/why-a-better-understanding-of-breast-cancer-is-needed-in-the-uae/
Koul. (2019). www.researchgate.net.
Retrieved from researchgate: https://www.researchgate.net/publication/338440875_Types_of_Cancer
Litin, S.C. (2018). Target. Retrieved from target: https://www.target.com/p/mayo-clinic-family-health-book-5th-
edition-5-edition-hardcover/-/A-53254482
Lynne, W., Elmore, S.F. (2020). CA: A cancer journal for clinicians. Blueprint for Cancer Research: Critical Gaps and
Opportunities, 33. Retrieved from https://doi.org/10.3322/caac.21652
Machine Learning What it is and why it matters. (n.d.). Retrieved from
https://www.sas.com/en_ae/insights/analytics/machine-learning.html
Margriet Groenendijk, Y. R. (2020). Data analysis in Python using pandas. Retrieved from IBM Developer:
https://developer.ibm.com/technologies/analytics/tutorials/data-analysis-in-python-using-pandas/
matters, Machine Learning What it is and why it. (2020). Retrieved from sas:
https://www.sas.com/en_ae/insights/analytics/machine-learning.html
McVie. (2011). journals.lww.com. Retrieved from oncology-times: https://journals.lww.com/oncology-
times/Fulltext/2011/07100/GORDON_McVIE__My_Key_Takeaways_from_ASCO11.3.aspx
Deivendran, M.R.A. (2016). A literature review of predicting cancer disease using .
Natansh D.M.M.J. (2020). A literature review of treatment-specific clinical prediction models in patients with breast
cancer.
Nath, A. (2020). A survey on cancer prediction and detection with data analysis. Innovations in Systems and Software
Engineering. doi:10.1007/s11334-019-00350-6
Niall M. Adams, D.J. (2015). Data Mining.
Pellegrini, Anna. (2010, November). researchgate. Retrieved from researchgate:
https://www.researchgate.net/publication/282246065_Classification_of_cancer_stage_using_the_immune_syst
em

Journal of Management Information and Decision Sciences Volume 25, Special Issue 2, 2022
23 1532-5806-25-S2-30
Citation Information: Alhammadi, M.S.E. & Tariq, M.U. (2022). Proposed Cancer Disease Prediction Model Using Machine Learning.
Journal of Management Information and Decision Sciences, 25(S2), 1–23
Ramon, S., Paul, R., Gabriel, C., Victor, M., Iris, S., Christa, D., … & Loes, V.V. (2011). semanticscholar. Retrieved
from semanticscholar: https://pdfs.semanticscholar.org/a0c9/b6f68ec57503868cad8034d63c32102b5129.pdf
Robert, B.M.A. (2013). nature genetics.
Retrieved from nature: https://www.nature.com/articles/ng.2764.pdf?origin=ppub


