Download - PROGINF/FTRACE User's Guide

PROGINF/FTRACE User’s Guide (G2AT03E)
Proprietary Notice
The information disclosed in this document is the property of NEC Corporation (NEC) and/or its
licensors. NEC and/or its licensors, as appropriate, reserve all patent, copyright and other
proprietary rights to this document, including all design, manufacturing, reproduction, use and
sales rights thereto, except to the extent said rights are expressly granted to others. The
information in this document is subject to change at any time, without notice. All product, brand,
or trade names in this publication are the trademarks or registered trademarks of their respective
owners

Introduction
This PROGINF/FTRACE User’s Guide describes the features and usage of the performance
analysis tool “PROGINF” and “FTRACE” for the SX-Aurora TSUBASA system.

Targeted readers in this document
This document is written mainly for general users and programmers and it assumes that the
reader knows Fortran Compiler (nfort), C Compiler (ncc), C++ Compiler (nc++) and NEC MPI.
How to read this document
This document consists of the following chapters. Please refer to the target reader on the right side
of the table and read on.
Chapter Title Contents Targeted Readers
Chapter 1 PROGINF This chapter explains usage of
PROGINF.
general users
programmers
Chapter 2 FTRACE This chapter explains the usage of
FTRACE
general users
programmers

Related Documents
The following documents have additional information related to PROGINF and FTRACE.
• Fortran Compiler (nfort)
Fortran User's Guide
• C Compiler (ncc) and C++ Compiler (nc++)
C/C++ User's Guide
• NEC MPI
NEC MPI User's Guide
Conventions
The following conventions are used throughout this document.
• Bold text that starts with hyphen ( - )
It indicates a command option.
• Dollar sign ( $ ) in an example of executing command
It indicates bash (Bourne-Again Shell) prompt unless otherwise noted.
• ncc/nc++/nfort/mpincc/mpinc++/mpinfort
In this document, these commands to compile and link a program are called "compiler".


i
Contents
Chapter 1 PROGINF .....................................................................................................................1
1.1 Usage ............................................................................................................................................. 1
1.2 Options .......................................................................................................................................... 7
1.2.1 Compiler Option ..................................................................................................................... 7
1.2.2 Environment Variable ........................................................................................................... 7
1.3 Notes.............................................................................................................................................. 9
Chapter 2 FTRACE ..................................................................................................................... 11
2.1 Usage ............................................................................................................................................11
2.2 User Specified Region ................................................................................................................ 20
2.3 Options ........................................................................................................................................ 22
2.3.1 Compiler Option ................................................................................................................... 22
2.3.2 Environment Variable at the runtime of executable file. .................................................. 22
2.3.3 ftrace Command Option ...................................................................................................... 22
2.4 Notes............................................................................................................................................ 23
Appendix A Revision History ...................................................................................................... 25


1
PROGINF provides program execution analysis information throughout the execution of program.
This feature is available by linking the program using NEC Compiler.
1.1 Usage
Link a program against PROGINF library. PROGINF library is linked as default, so you don’t need
to specify any options.
Example When linking C program using ncc.
$ ncc source.c
Example When linking C++ program using nc++.
$ nc++ source.cc
Example When linking Fortran program using nfort.
$ nfort source.f90
Set the environment variable VE_PROGINF to YES or DETAIL and run the executable file.
Example For bash and its variants
$ export VE_PROGINF=DETAIL
$ /opt/nec/ve/bin/ve_exec ./a.out
Example For csh and its variants
$ setenv VE_PROGINF DETAIL
$ /opt/nec/ve/bin/ve_exec ./a.out
2
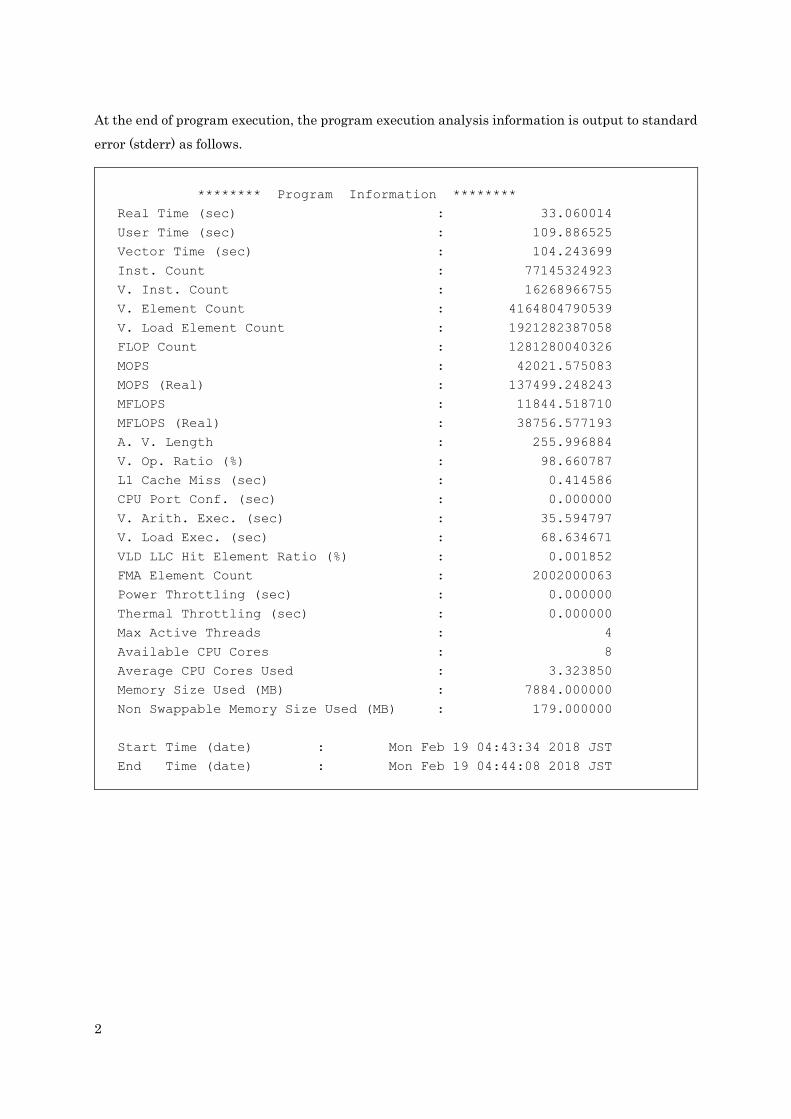
At the end of program execution, the program execution analysis information is output to standard
error (stderr) as follows.
******** Program Information ********
Real Time (sec) : 33.060014
User Time (sec) : 109.886525
Vector Time (sec) : 104.243699
Inst. Count : 77145324923
V. Inst. Count : 16268966755
V. Element Count : 4164804790539
V. Load Element Count : 1921282387058
FLOP Count : 1281280040326
MOPS : 42021.575083
MOPS (Real) : 137499.248243
MFLOPS : 11844.518710
MFLOPS (Real) : 38756.577193
A. V. Length : 255.996884
V. Op. Ratio (%) : 98.660787
L1 Cache Miss (sec) : 0.414586
CPU Port Conf. (sec) : 0.000000
V. Arith. Exec. (sec) : 35.594797
V. Load Exec. (sec) : 68.634671
VLD LLC Hit Element Ratio (%) : 0.001852
FMA Element Count : 2002000063
Power Throttling (sec) : 0.000000
Thermal Throttling (sec) : 0.000000
Max Active Threads : 4
Available CPU Cores : 8
Average CPU Cores Used : 3.323850
Memory Size Used (MB) : 7884.000000
Non Swappable Memory Size Used (MB) : 179.000000
Start Time (date) : Mon Feb 19 04:43:34 2018 JST
End Time (date) : Mon Feb 19 04:44:08 2018 JST

3
The meanings of items are as follows.
(*1) output only when VE_PROGINF is set to DETAIL
(*2) output only when VE_PROGINF is set to DETAIL and multi-thread execution
Item Unit Description
Real Time second Elapsed time
User Time second User time
Vector Time second Vector instruction execution Time
Inst. Count - Number of all instruction executions
V. Inst. Count - Number of vector instruction executions
V. Element Count - Number of vector instruction execution elements
V. Load Element Count - Number of vector instruction load elements
FLOP Count - Number of floating-point data execution elements
MOPS - Number of million operations performed
per “User Time” second
MOPS (Real) - Number of million operations performed
per “Real Time” second
MFLOPS - Number of million floating-point data execution
elements executed per “User Time” second
MFLOPS (Real) - Number of million floating-point data execution
elements executed per “Real Time” second
A. V. Length - Average vector length
V. Op. Ratio percent Vector Operation Ratio:
The ratio of vector operations to all operations
L1 Cache Miss second L1 cache miss time
CPU Port Conf. second CPU port conflict time (*1)
V. Arith Exec. second Vector arithmetic execution time (*1)
V. Load Exec. second Vector load execution time (*1)
VLD LLC Hit Element
Ratio
percent The ratio of the elements loaded from LLC to the
total elements loaded by vector instructions.

4
Item Unit Description
FMA Element Count - Number of FMA execution elements (*1)
Power Throttling second Power throttling time (*1)
Thermal Throttling second Thermal throttling time (*1)
Max Active Threads - Number of maximum active threads (*2)
Available CPU cores - Number of available CPU cores (*2)
Average CPU Cores Used - Average of CPU cores used (*2)
Memory Size Used megabyte Peak usage of memory
Non Swappable Memory
Size Used
megabyte Peak usage of memory that cannot be swapped out by
Partial Process Swapping function
Start Time (date) - The date when the program is started
End Time (date) - The date when the program is terminated

5
PROGINF outputs the program execution analysis information using Aurora HW performance
counter. You can control the use of set of the performance counters by the environment variable
VE_PERF_MODE and PROGINF can output items corresponding the set. Above output is the case
that VE_PERF_MODE is unset or VE_PERF_MODE is set to VECTOR-OP. In this case, PROGINF
outputs items related to vector instructions mainly. The following output is the case that
VE_PERRF_MODE is set to VECTOR-MEM. In this case, PROGINF outputs items related to
vector and memory access mainly.
******** Program Information ********
Real Time (sec) : 41.899895
User Time (sec) : 167.316072
Vector Time (sec) : 92.309990
Inst. Count : 175930159073
V. Inst. Count : 16278237491
V. Element Count : 564896066618
V. Load Element Count : 167991674972
FLOP Count : 432838957109
MOPS : 4956.779900
MOPS (Real) : 19821.081454
MFLOPS : 2583.413548
MFLOPS (Real) : 10330.507186
A. V. Length : 34.702533
V. Op. Ratio (%) : 80.776073
L1 I-Cache Miss (sec) : 0.256811
L1 O-Cache Miss (sec) : 32.683728
L2 Cache Miss (sec) : 32.884266
FMA Element Count : 105937492420
Required B/F : 5.773960
Required Store B/F : 2.195626
Required Load B/F : 3.578334
Actual V. Load B/F : 0.404243
Power Throttling (sec) : 0.000000
Thermal Throttling (sec) : 0.000000
Max Active Threads : 4
Available CPU Cores : 8
Average CPU Cores Used : 3.993234
Memory Size Used (MB) : 1028.000000
Non Swappable Memory Size Used (MB) : 179.000000
Start Time (date) : Sun Dec 15 17:03:50 2019 JST
End Time (date) : Sun Dec 15 17:04:32 2019 JST
6
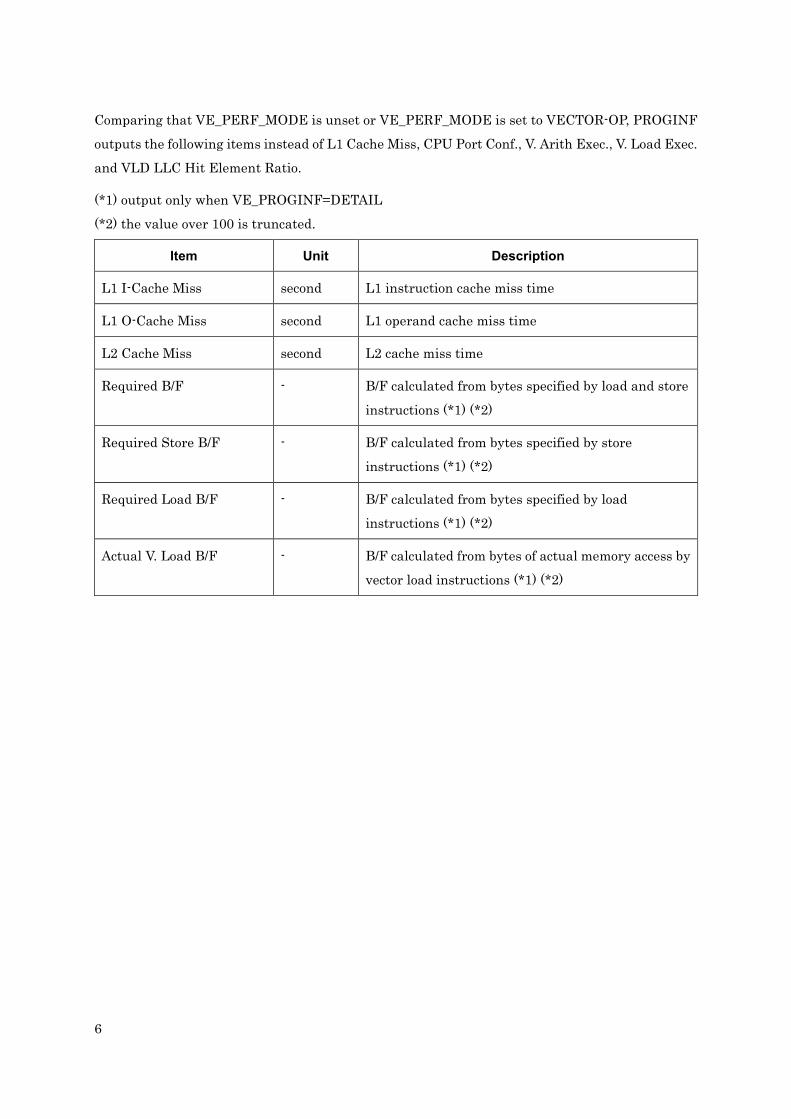
Comparing that VE_PERF_MODE is unset or VE_PERF_MODE is set to VECTOR-OP, PROGINF
outputs the following items instead of L1 Cache Miss, CPU Port Conf., V. Arith Exec., V. Load Exec.
and VLD LLC Hit Element Ratio.
(*1) output only when VE_PROGINF=DETAIL
(*2) the value over 100 is truncated.
Item Unit Description
L1 I-Cache Miss second L1 instruction cache miss time
L1 O-Cache Miss second L1 operand cache miss time
L2 Cache Miss second L2 cache miss time
Required B/F - B/F calculated from bytes specified by load and store
instructions (*1) (*2)
Required Store B/F - B/F calculated from bytes specified by store
instructions (*1) (*2)
Required Load B/F - B/F calculated from bytes specified by load
instructions (*1) (*2)
Actual V. Load B/F - B/F calculated from bytes of actual memory access by
vector load instructions (*1) (*2)

7
1.2 Options
Compiler option and environment variable related to PROGINF are as follows.
1.2.1 Compiler Option
Option Description
-proginf Link a program against PROGINF library (default)
-no-proginf Don’t link a program against PROGINF library
1.2.2 Environment Variable
Environment Variable Description
VE_PROGINF Control whether the program execution analysis information is output
at the end of program execution or not.
NO: Don’t output (default)
YES: Output basic information
DETAIL: Output detailed information
VE_PROGINF_COM
PAT
Control the output format of the program execution analysis
information.
0: Output information in the latest format (default)
1: Output information in the old format
In this format, performance item “Non Swappable Memory Size Used”
is not output.
VE_PROGINF_USE_
SIGNAL
Signal SIGUSR1 is used for collecting performance information of
thread. When you use this environment variables, please refer to the
note of 1.3(1).
NO: Don’t use signal
YES: Use signal (default)

8
Environment Variable Description
VE_PERF_MODE Control the HW performance counter set. PROGINF outputs program
execution analysis information corresponding to the set.
VECTOR-OP: Select the set related to vector operation mainly.(default)
VECTOR-MEM: Select the set related to vector and memory access
mainly.

9
1.3 Notes
(1) PROGINF uses signal SIGUSR1 for collecting performance information of threads as
default. For example, using debugger, you can stop the signal by the environment variable
VE_PROGINF_USE_SIGNAL is set to NO. In this case, PROGINF terminate worker thread
of compiler’s automatic parallelization and OpenMP by collecting performance information
of those threads instead of signal. When PROGINF does not signal, PROGINF cannot collect
performance information of the threads except for the threads of compiler’s automatic
parallelization and OpenMP and the program execution analysis information may not be
displayed correctly.
− Items to be effective during multi thread execution are not shown
− Performance information of the threads which PROGINF cannot collect is ignored in
each item excluding User Time, Real Time, Memory Size Used and Non Swappable
Memory Size Used.
(2) If compilation and linking correspond to the following, you need to use the option -pthread
for the link between program and pthread library. If -lpthread is specified instead of the
option -pthread, the program execution analysis information may not be displayed correctly
as in (1).
(3) When shared libraries created with the compiler option -fopenmp or -mparallel is linked to
an executable file, the program execution analysis information may not be displayed
correctly as in (1).
(4) If you use shared libraries created with the option -pthread, you need to specify the option
-pthread again when you link to an executable file, the program execution analysis
information may not be displayed correctly as in (1).
(5) PROGINF does not support multi-process program except for MPI.


11
FTRACE is used to obtain performance information such as the CPU usage and vectorization
aspect of each function in a program, as well as user regions.
2.1 Usage
Compile and link a program with –ftrace to an executable file for performance measurement.
Example When compiling and linking C program using ncc
$ ncc –ftrace source.c
Example When compiling and linking C++ program using nc++
$ nc++ –ftrace source.cc
Example When compiling and linking Fortran program using nfort
$ nfort –ftrace source.f90
For MPI program, mpincc, mpinc++ and mpinfort are used to compile C, C++ and Fortran program,
respectively.
Example When compiling and linking MPI C program using mpincc
$ mpincc –ftrace source.c
Example When compiling and linking MPI C++ program using mpinc++
$ mpinc++ –ftrace source.cc
12
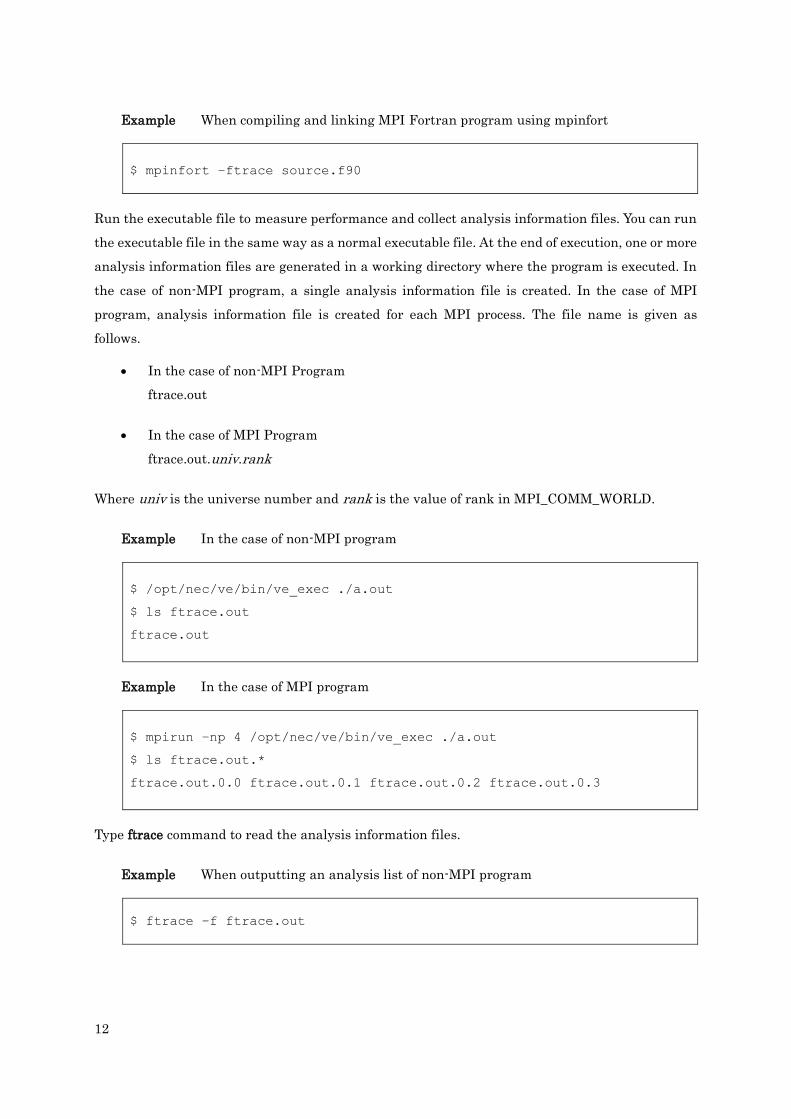
Example When compiling and linking MPI Fortran program using mpinfort
$ mpinfort –ftrace source.f90
Run the executable file to measure performance and collect analysis information files. You can run
the executable file in the same way as a normal executable file. At the end of execution, one or more
analysis information files are generated in a working directory where the program is executed. In
the case of non-MPI program, a single analysis information file is created. In the case of MPI
program, analysis information file is created for each MPI process. The file name is given as
follows.
• In the case of non-MPI Program
ftrace.out
• In the case of MPI Program
ftrace.out.univ.rank
Where univ is the universe number and rank is the value of rank in MPI_COMM_WORLD.
Example In the case of non-MPI program
$ /opt/nec/ve/bin/ve_exec ./a.out
$ ls ftrace.out
ftrace.out
Example In the case of MPI program
$ mpirun –np 4 /opt/nec/ve/bin/ve_exec ./a.out
$ ls ftrace.out.*
ftrace.out.0.0 ftrace.out.0.1 ftrace.out.0.2 ftrace.out.0.3
Type ftrace command to read the analysis information files.
Example When outputting an analysis list of non-MPI program
$ ftrace –f ftrace.out

13
Example When outputting MPI program
$ ftrace –f ftrace.out.*
Example When outputting MPI process of universe 0 and rank 0
$ ftrace –f ftrace.out.0.0
The following analysis list is output to the standard output (stdout).
*----------------------*
FTRACE ANALYSIS LIST
*----------------------*
Execution Date : Sat Feb 17 12:44:49 2018 JST
Total CPU Time : 0:03'24"569 (204.569 sec.)
FREQUENCY EXCLUSIVE AVER.TIME MOPS MFLOPS V.OP AVER. VECTOR L1CACHE CPU PORT VLD LLC PROC.NAME
TIME[sec]( % ) [msec] RATIO V.LEN TIME MISS CONF HIT E.%
1012 49.093( 24.0) 48.511 23317.2 14001.4 96.97 83.2 42.132 5.511 0.000 80.32 funcA
160640 37.475( 18.3) 0.233 17874.6 9985.9 95.22 52.2 34.223 1.973 2.166 96.84 funcB
160640 30.515( 14.9) 0.190 22141.8 12263.7 95.50 52.8 29.272 0.191 2.544 93.23 funcC
160640 23.434( 11.5) 0.146 44919.9 22923.2 97.75 98.5 21.869 0.741 4.590 97.82 funcD
160640 22.462( 11.0) 0.140 42924.5 21989.6 97.73 99.4 20.951 1.212 4.590 96.91 funcE
53562928 15.371( 7.5) 0.000 1819.0 742.2 0.00 0.0 0.000 1.253 0.000 0.00 funcG
8 14.266( 7.0) 1783.201 1077.3 55.7 0.00 0.0 0.000 4.480 0.000 0.00 funcH
642560 5.641( 2.8) 0.009 487.7 0.2 46.45 35.1 1.833 1.609 0.007 91.68 funcF
2032 2.477( 1.2) 1.219 667.1 0.0 89.97 28.5 2.218 0.041 0.015 70.42 funcI
8 1.971( 1.0) 246.398 21586.7 7823.4 96.21 79.6 1.650 0.271 0.000 2.58 funcJ
------------------------------------------------------------------------------------------------------------------
54851346 204.569(100.0) 0.004 22508.5 12210.7 95.64 76.5 154.524 17.740 13.916 90.29 total
The meanings of items are as follows.
Item Unit Description
Execution Date - Date when execution terminated
Total CPU Time - Total CPU time for each function
PROC.NAME - Function/Region Name
FREQUENCY - Calling count of a function
EXCLUSIVE TIME second
(percent)
The exclusive CPU time (second), and the ratio of the
exclusive CPU time required for executing a function to
the CPU time required for executing the whole function

14
Item Unit Description
AVER.TIME millisecond The average CPU time (millisecond) required to execute
one function
MOPS - Number of million operations performed
per “EXCLUSIVE TIME” second
MFLOPS - Number of million floating-point data execution elements
executed per “EXCLUSIVE TIME” second
V.OP RATIO percent The ratio of vector operations to all operations
AVER.V.LEN - Average vector length
VECTOR TIME second Vector instruction execution time
L1CACHE MISS second L1 cache miss time
CPU PORT CONF. second CPU port conflict time
VLD LLC HIT E.% percent The ratio of the elements loaded from LLC to the total
elements loaded by vector load instructions.
15
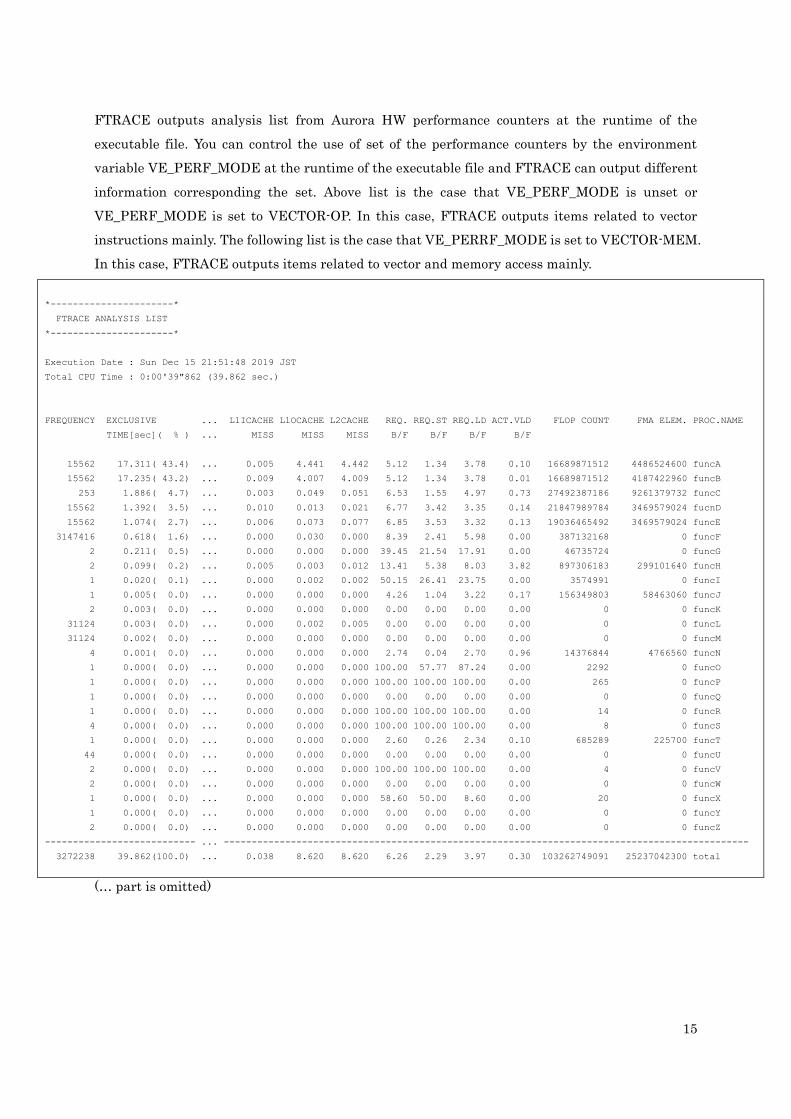
FTRACE outputs analysis list from Aurora HW performance counters at the runtime of the
executable file. You can control the use of set of the performance counters by the environment
variable VE_PERF_MODE at the runtime of the executable file and FTRACE can output different
information corresponding the set. Above list is the case that VE_PERF_MODE is unset or
VE_PERF_MODE is set to VECTOR-OP. In this case, FTRACE outputs items related to vector
instructions mainly. The following list is the case that VE_PERRF_MODE is set to VECTOR-MEM.
In this case, FTRACE outputs items related to vector and memory access mainly.
*----------------------*
FTRACE ANALYSIS LIST
*----------------------*
Execution Date : Sun Dec 15 21:51:48 2019 JST
Total CPU Time : 0:00'39"862 (39.862 sec.)
FREQUENCY EXCLUSIVE ... L1ICACHE L1OCACHE L2CACHE REQ. REQ.ST REQ.LD ACT.VLD FLOP COUNT FMA ELEM. PROC.NAME
TIME[sec]( % ) ... MISS MISS MISS B/F B/F B/F B/F
15562 17.311( 43.4) ... 0.005 4.441 4.442 5.12 1.34 3.78 0.10 16689871512 4486524600 funcA
15562 17.235( 43.2) ... 0.009 4.007 4.009 5.12 1.34 3.78 0.01 16689871512 4187422960 funcB
253 1.886( 4.7) ... 0.003 0.049 0.051 6.53 1.55 4.97 0.73 27492387186 9261379732 funcC
15562 1.392( 3.5) ... 0.010 0.013 0.021 6.77 3.42 3.35 0.14 21847989784 3469579024 fucnD
15562 1.074( 2.7) ... 0.006 0.073 0.077 6.85 3.53 3.32 0.13 19036465492 3469579024 funcE
3147416 0.618( 1.6) ... 0.000 0.030 0.000 8.39 2.41 5.98 0.00 387132168 0 funcF
2 0.211( 0.5) ... 0.000 0.000 0.000 39.45 21.54 17.91 0.00 46735724 0 funcG
2 0.099( 0.2) ... 0.005 0.003 0.012 13.41 5.38 8.03 3.82 897306183 299101640 funcH
1 0.020( 0.1) ... 0.000 0.002 0.002 50.15 26.41 23.75 0.00 3574991 0 funcI
1 0.005( 0.0) ... 0.000 0.000 0.000 4.26 1.04 3.22 0.17 156349803 58463060 funcJ
2 0.003( 0.0) ... 0.000 0.000 0.000 0.00 0.00 0.00 0.00 0 0 funcK
31124 0.003( 0.0) ... 0.000 0.002 0.005 0.00 0.00 0.00 0.00 0 0 funcL
31124 0.002( 0.0) ... 0.000 0.000 0.000 0.00 0.00 0.00 0.00 0 0 funcM
4 0.001( 0.0) ... 0.000 0.000 0.000 2.74 0.04 2.70 0.96 14376844 4766560 funcN
1 0.000( 0.0) ... 0.000 0.000 0.000 100.00 57.77 87.24 0.00 2292 0 funcO
1 0.000( 0.0) ... 0.000 0.000 0.000 100.00 100.00 100.00 0.00 265 0 funcP
1 0.000( 0.0) ... 0.000 0.000 0.000 0.00 0.00 0.00 0.00 0 0 funcQ
1 0.000( 0.0) ... 0.000 0.000 0.000 100.00 100.00 100.00 0.00 14 0 funcR
4 0.000( 0.0) ... 0.000 0.000 0.000 100.00 100.00 100.00 0.00 8 0 funcS
1 0.000( 0.0) ... 0.000 0.000 0.000 2.60 0.26 2.34 0.10 685289 225700 funcT
44 0.000( 0.0) ... 0.000 0.000 0.000 0.00 0.00 0.00 0.00 0 0 funcU
2 0.000( 0.0) ... 0.000 0.000 0.000 100.00 100.00 100.00 0.00 4 0 funcV
2 0.000( 0.0) ... 0.000 0.000 0.000 0.00 0.00 0.00 0.00 0 0 funcW
1 0.000( 0.0) ... 0.000 0.000 0.000 58.60 50.00 8.60 0.00 20 0 funcX
1 0.000( 0.0) ... 0.000 0.000 0.000 0.00 0.00 0.00 0.00 0 0 funcY
2 0.000( 0.0) ... 0.000 0.000 0.000 0.00 0.00 0.00 0.00 0 0 funcZ
--------------------------- ... ----------------------------------------------------------------------------------------------
3272238 39.862(100.0) ... 0.038 8.620 8.620 6.26 2.29 3.97 0.30 103262749091 25237042300 total
(… part is omitted)

16
Comparing that VE_PERF_MODE is unset or VE_PERF_MODE is set to VECTOR-OP, FTRACE
outputs the following items instead of L1CACHE MISS, CPU PORT CONF, VLD LLC HIT E.%.
(*1) the value over 100 is truncated.
Item Unit Description
L1ICACHE MISS second L1 instruction cache miss time
L1OCACHE MISS second L1 operand cache miss time
L2CACHE MISS second L2 cache miss time
REQ. B/F - B/F calculated from bytes specified by load and store
instructions (*1)
REQ. ST B/F - B/F calculated from bytes specified by store instructions
(*1)
REQ. LD B/F - B/F calculated from bytes specified by load instructions
(*1)
ACT. VLD B/F - B/F calculated from bytes of actual memory access by
vector load instructions (*1)
FLOP COUNT - Number of floating-point data execution elements
FMA ELEM. - Number of FMA execution elements

17
In the case of MPI Program, additional list (MPI special item per MPI UNIVERSE.RANK) is
shown as the following format.
ELAPSED COMM.TIME IDLE TIME IDLE TIME AVER.LEN COUNT TOTAL LEN PROC.NAME
TIME[sec] [sec] / ELAPSED [sec] / ELAPSED [byte] [byte]
12.444 0.000 0.000 0.0 0 0.0 funcA
9.420 0.000 0.000 0.0 0 0.0 funcB
7.946 0.000 0.000 0.0 0 0.0 funcG
7.688 0.000 0.000 0.0 0 0.0 funcC
7.372 0.000 0.000 0.0 0 0.0 funcH
5.897 0.000 0.000 0.0 0 0.0 funcD
5.653 0.000 0.000 0.0 0 0.0 funcE
1.699 1.475 0.756 3.1K 642560 1.9G funcF
1.073 1.054 0.987 1.0M 4064 4.0G funcI
0.704 0.045 0.045 80.0 4 320.0 funcK
------------------------------------------------------------------------------------------------------
FREQUENCY EXCLUSIVE AVER.TIME MOPS MFLOPS V.OP AVER. VECTOR L1CACHE CPU PORT VLD LLC PROC.NAME
TIME[sec]( % ) [msec] RATIO V.LEN TIME MISS CONF HIT E.%
1012 49.093( 24.0) 48.511 23317.2 14001.4 96.97 83.2 42.132 5.511 0.000 80.32 funcA
253 12.089 47.784 23666.9 14215.9 97.00 83.2 10.431 1.352 0.000 79.40 0.0
253 12.442 49.177 23009.2 13811.8 96.93 83.2 10.617 1.406 0.000 81.26 0.1
253 12.118 47.899 23607.4 14180.5 97.00 83.2 10.463 1.349 0.000 79.36 0.2
253 12.444 49.185 23002.8 13808.2 96.93 83.2 10.622 1.404 0.000 81.26 0.3
...
----------------------------------------------------------------------------------------------------------------
54851346 204.569(100.0) 0.004 22508.5 12210.7 95.64 76.5 154.524 17.740 13.916 90.29 total
ELAPSED COMM.TIME COMM.TIME IDLE TIME IDLE TIME AVER.LEN COUNT TOTAL LEN PROC.NAME
TIME[sec] [sec] / ELAPSED [sec] / ELAPSED [byte] [byte]
12.444 0.000 0.000 0.0 0 0.0 funcA
12.090 0.000 0.000 0.000 0.000 0.0 0 0.0 0.0
12.442 0.000 0.000 0.000 0.000 0.0 0 0.0 0.1
12.119 0.000 0.000 0.000 0.000 0.0 0 0.0 0.2
12.444 0.000 0.000 0.000 0.000 0.0 0 0.0 0.3
...

18
The meanings of MPI related items are as follows.
Item Unit Description
PROC.NAME - Function Name or MPI Process
(MPIUNIVERSE.MPIRANK)
ELAPSED TIME second Elapsed Time
COMM.TIME second MPI communication time. This also includes
the time of MPI functions
COMM.TIME / ELAPSED - The ratio of COMM.TIME to ELAPSED TIME
in a function
IDLE TIME second Idle time in MPI communication
IDLE TIME / ELAPSED - The ratio of IDLE TIME to ELAPSED TIME in
a function
AVER.LEN byte The average communication amount per MPI
communication (TOTAL LEN / COUNT). The
unit is bytes, kilobytes, megabytes, gigabytes,
terabytes, or petabytes.
COUNT - The MPI communication count
TOTAL LEN byte The total MPI communication amount. The
unit is bytes, kilobytes, megabytes, gigabytes,
terabytes, or petabytes.

19
For parallelized procedures by automatic parallelization or OpenMP, the information of each
thread is also output after the information of the function. The information of each thread is listed
as the -thraed0, -thread1, -thread2 ... lines. In case of MPI programs, one analysis information file
is input to ftrace command to output “each thread” format.
FREQUENCY EXCLUSIVE AVER.TIME MOPS MFLOPS V.OP AVER. VECTOR L1CACHE CPU PORT VLD LLC PROC.NAME
TIME[sec]( % ) [msec] RATIO V.LEN TIME MISS CONF HIT E.%
40160 40.688( 26.8) 1.013 3101.6 0.0 0.00 0.0 0.000 0.262 0.000 0.00 funcE
40160 40.191( 26.4) 1.001 3105.9 0.0 0.00 0.0 0.000 0.264 0.000 0.00 funcD
40160 9.340( 6.1) 0.233 17931.1 10016.3 95.20 52.2 8.572 0.435 0.541 95.92 funcB
40160 8.217( 5.4) 0.205 20558.4 11385.3 95.48 52.8 7.828 0.099 0.636 92.91 funcC
160640 8.090( 5.3) 0.050 257.6 0.0 31.45 6.9 5.275 0.645 0.002 97.92 funcF
13390732 7.926( 5.2) 0.001 1167.1 359.9 0.00 0.0 0.000 2.520 0.000 0.00 funcG
160640 6.176( 4.1) 0.038 42375.0 21745.2 98.02 98.3 5.084 0.603 1.147 98.13 funcD$1
40160 1.558( 1.0) 0.039 41992.4 21549.0 98.02 98.3 1.274 0.158 0.287 98.28 -thread0
40160 1.536( 1.0) 0.038 42609.0 21865.3 98.02 98.3 1.264 0.149 0.287 98.41 -thread1
40160 1.540( 1.0) 0.038 42495.2 21806.8 98.02 98.3 1.268 0.152 0.287 97.92 -thread2
40160 1.543( 1.0) 0.038 42408.7 21762.4 98.02 98.3 1.279 0.144 0.287 97.92 -thread3
1012 5.122( 3.4) 5.061 18482.6 11129.8 96.24 83.5 4.122 0.688 0.000 96.46 funcA$2
253 1.259( 0.8) 4.975 18802.5 11322.4 96.24 83.5 1.021 0.161 0.000 96.46 -thread0
253 1.292( 0.8) 5.106 18320.1 11031.9 96.24 83.5 1.033 0.180 0.000 96.46 -thread1
253 1.294( 0.9) 5.115 18288.9 11013.1 96.24 83.5 1.035 0.181 0.000 96.46 -thread2
253 1.277( 0.8) 5.049 18528.0 11157.1 96.24 83.5 1.032 0.167 0.000 96.46 -thread3
...
-----------------------------------------------------------------------------------------------------------------
14048364 152.037(100.0) 0.011 9379.8 4107.7 74.34 76.3 46.350 8.509 3.477 90.34 total
ELAPSED COMM.TIME COMM.TIME IDLE TIME IDLE TIME AVER.LEN COUNT TOTAL LEN PROC.NAME
TIME[sec] [sec] / ELAPSED [sec] / ELAPSED [byte] [byte]
50.531 0.000 0.000 0.000 0.000 0.0 0 0.0 funcD
50.415 0.000 0.000 0.000 0.000 0.0 0 0.0 funcE
11.919 0.000 0.000 0.000 0.000 0.0 0 0.0 funcG
9.376 0.000 0.000 0.000 0.000 0.0 0 0.0 funcB
8.591 0.000 0.000 0.000 0.000 0.0 0 0.0 funcH
8.254 0.000 0.000 0.000 0.000 0.0 0 0.0 funcC
8.138 7.782 0.956 5.987 0.736 3.1K 160640 490.2M funcF
3.863 2.628 0.680 2.557 0.662 1.0M 1016 1017.1M funcI
2.105 0.000 0.000 0.000 0.000 0.0 0 0.0 funcA
1.570 0.000 0.000 0.000 0.000 0.0 0 0.0 funcD$1
1.570 0.000 0.000 0.000 0.000 0.0 0 0.0 -thread0
1.549 0.000 0.000 0.000 0.000 0.0 0 0.0 -thread1
1.552 0.000 0.000 0.000 0.000 0.0 0 0.0 -thread2
1.557 0.000 0.000 0.000 0.000 0.0 0 0.0 -thread3
...

20
2.2 User Specified Region
FTRACE has feature to analyze use specified region. User can specify beginning and end of region
like below. The performance information of a user-specified region is listed at the end of the
analysis list together with the corresponding ID.
Function Prototype
// Beginning of user-specified region
extern int ftrace_region_begin(const char *id);
// End of user-specified region
extern int ftrace_region_end(const char *id);
Arguments
Any string (ID) can be specified to distinguish a user-specified region. Each user-specified
region should have an identical ID at the beginning and end. The ID is output in the
PROC.NAME column of the analysis list. The ID cannot be omitted.
Return values
Name Description
FTRACE_OK Normal ending
FTRACE_EINVAL The argument is invalid
FTRACE_ENOBEGIN Corresponding beginning of user-specified region does not exist
FTRACE_EMAXNUM The number of user-specified regions has reached the limit of 200

21
Program Example
#include <ftrace.h>
...
(void) ftrace_region_begin("loop#1"); // outside region begin
for (i = 0; i < n; i++) {
...
}
(void) ftrace_region_begin("loop#2"); // inside region begin
for (j = 0; j < n; j++) {
...
}
(void) ftrace_region_end("loop#2"); // inside region end
(void) ftrace_region_end("loop#1"); // outside region end
Output Example
FREQUENCY EXCLUSIVE AVER.TIME MOPS MFLOPS V.OP AVER. VECTOR L1CACHE CPU PORT VLD LLC PROC.NAME
TIME[sec]( % ) [msec] RATIO V.LEN TIME MISS CONF HIT E.%
1012 49.093( 24.0) 48.511 23317.2 14001.4 96.97 83.2 42.132 5.511 0.000 80.32 funcA
160640 37.475( 18.3) 0.233 17874.6 9985.9 95.22 52.2 34.223 1.973 2.166 96.84 funcB
160640 30.515( 14.9) 0.190 22141.8 12263.7 95.50 52.8 29.272 0.191 2.544 93.23 funcC
160640 23.434( 11.5) 0.146 44919.9 22923.2 97.75 98.5 21.869 0.741 4.590 97.82 funcD
160640 22.462( 11.0) 0.140 42924.5 21989.6 97.73 99.4 20.951 1.212 4.590 96.91 funcE
53562928 15.371( 7.5) 0.000 1819.0 742.2 0.00 0.0 0.000 1.253 0.000 0.00 funcG
8 14.266( 7.0) 1783.201 1077.3 55.7 0.00 0.0 0.000 4.480 0.000 0.00 funcH
642560 5.641( 2.8) 0.009 487.7 0.2 46.45 35.1 1.833 1.609 0.007 91.68 funcF
2032 2.477( 1.2) 1.219 667.1 0.0 89.97 28.5 2.218 0.041 0.015 70.42 funcI
8 1.971( 1.0) 246.398 21586.7 7823.4 96.21 79.6 1.650 0.271 0.000 2.58 funcJ
----------------------------------------------------------------------------------------------------------------
54851346 204.569(100.0) 0.004 22508.5 12210.7 95.64 76.5 154.524 17.740 13.916 90.29 total
62248 37.709( 18.4) 0.606 2200.2 1026.4 0.00 0.0 0.000 0.532 0.000 20.00 loop#1
2032 4.834( 2.4) 2.379 415.8 0.0 28.61 6.3 4.098 0.246 0.000 0.00 loop#2

22
2.3 Options
Compiler option related to FTRACE and ftrace command option are as follows.
2.3.1 Compiler Option
Option Description
-ftrace Create an object file and the executable file for ftrace function.
2.3.2 Environment Variable at the runtime of executable file.
Environment Variable Description
VE_PERF_MODE Control the HW performance counter set. FTRACE outputs program
execution analysis information corresponding to the set.
VECTOR-OP: Select the set related to vector operation mainly.(default)
VECTOR-MEM: Select the set related to vector and memory access
mainly.
2.3.3 ftrace Command Option
Option Description
-all Outputs performance analysis information of all functions in the
analysis information files are specified in -f.
-num n Only n high-cost functions are output. When -all and -num options are
specified at the same time, the last option is effective.
-f file-name(s) Outputs the analysis list for the analysis information file specified by -f.
When -f is omitted, outputs the analysis list for the file ftrace.out.
Multiple analysis information files can be specified by blanks. Then, the
list is output in the following rules: Only 10 high-cost functions are
output. You can change the number by -all or -num.

23
2.4 Notes
(1) FTRACE does not support multi-threaded program except automatic parallelization and
OpenMP parallelization of nfort, ncc or nc++ and multi-process program except MPI.
(2) When a parallelized function is compiled without -ftrace, the performance information of the
threads except master thread is not included in the analysis results.
(3) The performance information of the threads except master thread created by the
parallelized functions of NLC (NEC Numeric Library Collection) is not included in the
analysis results.
(4) The measurement program calls the measurement routines at the entrance and exit of
functions or before and after a user-specified region. Therefore, when the measurement
program contains a lot of function calls, its execution time may increase dramatically. In this
case, the source files that include functions whose performance information is required must
be compiled using -ftrace.
(5) Please don’t unload shared libraries compiled with -ftrace. If you unload the shared libraries,
abnormal termination may occur at the end of program execution.


25
Edition Issue Changes
1 February 2018 Original
2 May 2018 Added 1.3 Notes
Updated Program Example in 2.3 User Specified Region
Added 2.4 Notes
3 December 2018 Added 1.3 Options
Updated 1.4 Notes
Added 2.4 Options
Updated 2.5 Notes
4 May 2019 Updated 2.5 Notes
5 January 2020 Updated 1.1 Usage
Updated 1.2 Options
Updated 1.3 Notes
Updated 2.1 Usage
Updated 2.3 Options
Updated 2.4 Notes
6 October 2020 Updated 1.1 Usage
Updated 1.2 Options
Updated 1.3 Notes
7 December 2021 Updated 2.4 Notes

SX-Aurora TSUBASA system software
PROGINF/FTRACE User’s Guide
February 2018 Edition 1
December 2021 Edition 7
NEC Corporation
© NEC Corporation 2018-2021 No part of this document may be reproduced, in any form or by any means,
without permission from NEC Corporation.


