
Gary Hinshaw, NRC-BEPAC, 11/7/06
Probing Inflation with Probing Inflation with CMBPolCMBPol
Gary Hinshaw, NASA/GSFCPresentation to NRC Beyond Einstein Program Assessment Committee
November 7, 2006

Gary Hinshaw, NRC-BEPAC, 11/7/06
The Concept Study TeamThe Concept Study Team
• Chuck Bennett (GFSC)• Mark Devlin (U. Penn)• Dale Fixsen (GSFC)• Gary Hinshaw (GSFC, PI)• Wayne Hu (U. Chicago)• Kent Irwin (NIST/Boulder)• Norm Jarosik (Princeton)• Alan Kogut (GSFC)• Arthur Kosowsky (Rutgers)• Michele Limon (GSFC)• Steve Meyer (U. Chicago)• Amber Miller (Columbia)• Harvey Moseley (GSFC)• Barth Netterfield (U. Toronto)
• Barth Netterfield (U. Toronto)• Angelica Oliviera-Costa (U. Penn)• Lyman Page (Princeton)• John Ruhl (Case Western)• Uros Seljak (Princeton)• David Spergel (Princeton)• Suzanne Staggs (Princeton)• Max Tegmark (U. Penn)• Bruce Winstein (U. Chicago)• Ed Wollack (GSFC)• Ned Wright (UCLA)• Matias Zaldarriaga (Harvard)• Cliff Jackson (GSFC)

Gary Hinshaw, NRC-BEPAC, 11/7/06
1965: Penzias & Wilson Discover the CMB1965: Penzias & Wilson Discover the CMB
Microwave Receiver- Bell LabsNew Jersey 1978 Nobel Prize
in Physics
RobertWilson
Arno PenziasArno Penzias
Full sky image, green represents the CMB
19891989--1993: COBE Unleashes the CMB1993: COBE Unleashes the CMB
2006 Nobel Prizein Physics
GeorgeSmoot
John MatherJohn Mather
COBE-FIRAS spectrumof the CMB
COBE-DMR anisotropy of the CMB
COBE Spacecraft

Gary Hinshaw, NRC-BEPAC, 11/7/06
2006: Precision Measurements of the CMB2006: Precision Measurements of the CMBTremendous progress has been made!
ΔT ~ 0.1 K in 1965
ΔT ~ 0.1 μK in 2005
Advances in space - largely based on experience gained in numerous balloon and ground-based campaigns.

Gary Hinshaw, NRC-BEPAC, 11/7/06
Probing Inflation with the CMBProbing Inflation with the CMB
COBEWMAPPlanckCMBPol
The only thing standing between the CMB and inflation is a thin layer of warm plasma.
Gary Hinshaw, NRC-BEPAC, 11/7/06
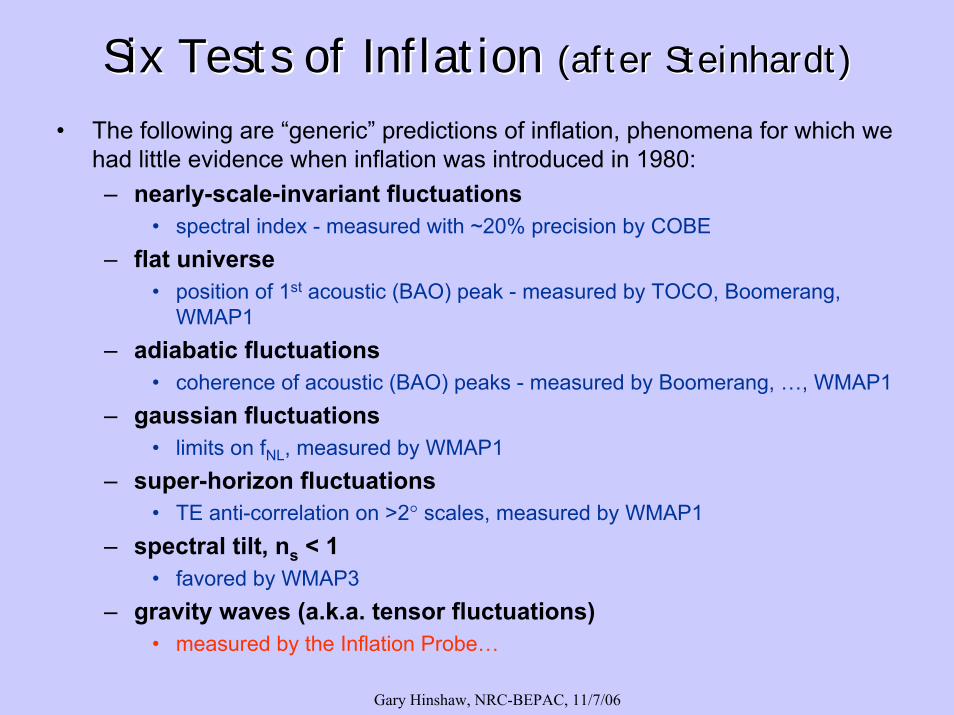
• The following are “generic” predictions of inflation, phenomena for which we had little evidence when inflation was introduced in 1980:– nearly-scale-invariant fluctuations
• spectral index - measured with ~20% precision by COBE– flat universe
• position of 1st acoustic (BAO) peak - measured by TOCO, Boomerang, WMAP1
– adiabatic fluctuations• coherence of acoustic (BAO) peaks - measured by Boomerang, …, WMAP1
– gaussian fluctuations• limits on fNL, measured by WMAP1
– super-horizon fluctuations• TE anti-correlation on >2° scales, measured by WMAP1
– spectral tilt, ns < 1• favored by WMAP3
– gravity waves (a.k.a. tensor fluctuations)• measured by the Inflation Probe…
Six Tests of Inflation Six Tests of Inflation (after Steinhardt)(after Steinhardt)
Gary Hinshaw, NRC-BEPAC, 11/7/06
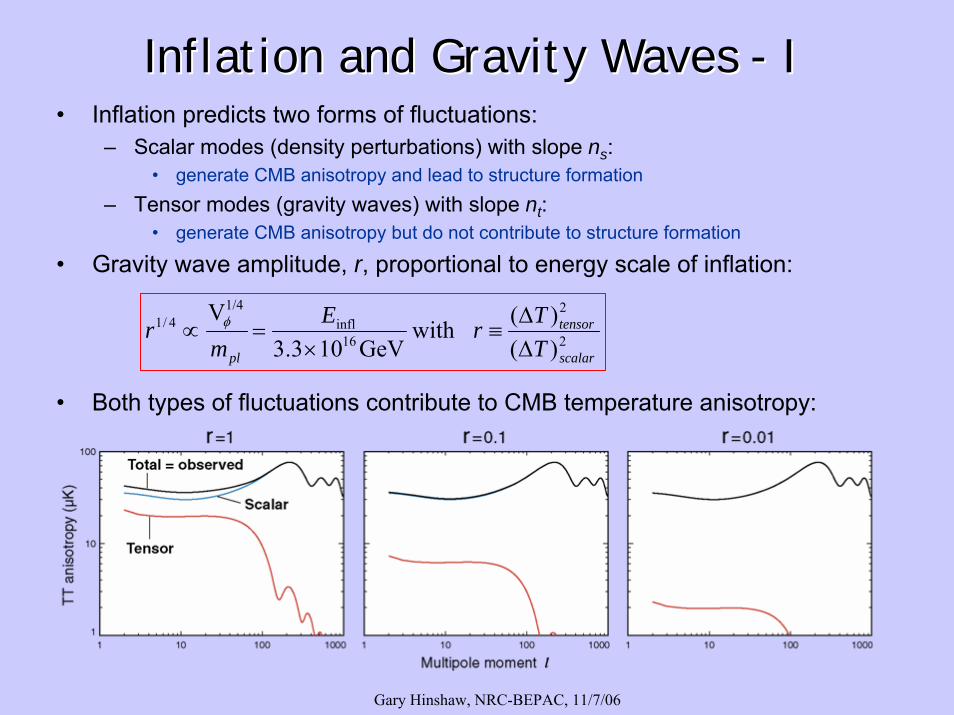
Inflation and Gravity Waves Inflation and Gravity Waves -- II• Inflation predicts two forms of fluctuations:
– Scalar modes (density perturbations) with slope ns: • generate CMB anisotropy and lead to structure formation
– Tensor modes (gravity waves) with slope nt:• generate CMB anisotropy but do not contribute to structure formation
• Gravity wave amplitude, r, proportional to energy scale of inflation:
• Both types of fluctuations contribute to CMB temperature anisotropy:
2
2
16infl
1/44/1
)()( with
GeV103.3
V
scalar
tensor
pl TTrE
mr
ΔΔ
≡×
=∝ φ

Gary Hinshaw, NRC-BEPAC, 11/7/06
Inflation Parameter Measurements c.2006Inflation Parameter Measurements c.2006
• “Generic” HZ model: (ns,r) = (1,0)
disfavored at ~ 95% CL.
• Slow roll inflation models relate ns and r, as shown.
• ns<1 suggests r should be observable.
• Knox et al. estimate r ~ 0.13 is the lowest amplitude detectable with temperature data.
• Further progress requires polarization.
“We find that, except for (inflation models) with numerous unnecessary degrees of fine-tuning, ns < 0.98, measurably different from exact HZ. Furthermore, if ns > ~0.95, in accord with current measurements, the tensor/scalar ratio satisfies r > ~10─2, a range that should be detectable in proposed CMB polarization experiments.”Boyle, Steinhardt, Turok (2005)
GeV 106.2E3.0
016.0960.0
16infl ×<
<±=
rns
Spergel et al., 2006

Gary Hinshaw, NRC-BEPAC, 11/7/06
Inflation and Gravity Waves Inflation and Gravity Waves –– IIII• Both types of fluctuations contribute to CMB polarization anisotropy:
– Scalar modes produce only “E-mode” polarization patterns, by symmetry– Tensor modes produce both “E-mode” and “B-mode” polarization patterns (see below)
• The observation of B-mode polarization uniquely separates scalar and tensor modes from inflation and measures the energy scale of inflation.
• Only known probe of physics at E ~ 1016 GeV… 12 orders of magnitude higher than planned accelerators!
E – scalar+tensor B – tensor only

Gary Hinshaw, NRC-BEPAC, 11/7/06
Task Force on CMB Research (TFCR)Task Force on CMB Research (TFCR)• The value of CMB polarization measurements was emphasized in the last
National Academy of Science Decadal Survey.
• The 2003 National Research Council report, Connecting Quarks with the Cosmos, recommended that NASA, NSF, and DoE:
– “Measure the polarization of the cosmic microwave background with the goal of detecting the signature of inflation” and “undertake research and development to bring the needed experiments to fruition.”
• OSTP response to the CPU report:– "The three agencies (NASA, NSF, DoE) will work together to develop by 2005
a roadmap for decisive measurements of both types of CMB polarization. The road map will address needed technology development and ground-based, balloon-based, and space-based CMB polarization measurements."
• TFCR Report (“The Weiss Report”) was issued Fall 2005– “We recommend that NASA, NSF and DoE carry out a phased program of
ground-, balloon- and space-based measurements of the CMB polarization anisotropy, with a primary emphasis on mapping the B-mode (gravity wave) signal to a sensitivity limited only by our ability to model and subtract the astrophysical foregrounds.”

Gary Hinshaw, NRC-BEPAC, 11/7/06
Task Force MembershipTask Force Membership
• Task Force:– Rainer Weiss (chair), MIT– James Bock, Caltech / JPL– Sarah Church, Stanford University– Mark Devlin, University of Pennsylvania– Gary Hinshaw, NASA / GSFC– Andrew Lange, Caltech– Adrian Lee, U.C. Berkeley / LBNL– Lyman Page, Princeton University– Bruce Partridge, Haverford College– John Ruhl, Case Western Reserve– Max Tegmark, Penn. / MIT– Peter Timbie, University of Wisconsin– Bruce Winstein, University of Chicago– Matias Zaldarriaga, Harvard University
• Agency Observers:– Beverley Berger, NSF– Vladimir Papitashvili, NSF– Michael Salamon, NASA/HQ– Nigel Sharp, NSF– Kathy Turner, DoE

Gary Hinshaw, NRC-BEPAC, 11/7/06
Predicted Polarization Signal, r=1.00Predicted Polarization Signal, r=1.00Temperature spectrum(as before)
E-mode polarization spectrum,scalar (blue) & tensor (red) terms
B-mode polarization spectrum,tensor (red) & gravitational lensing (green) terms
Observed=scalar+tensor
Observed=tensor (+lensing)
Gary Hinshaw, NRC-BEPAC, 11/7/06
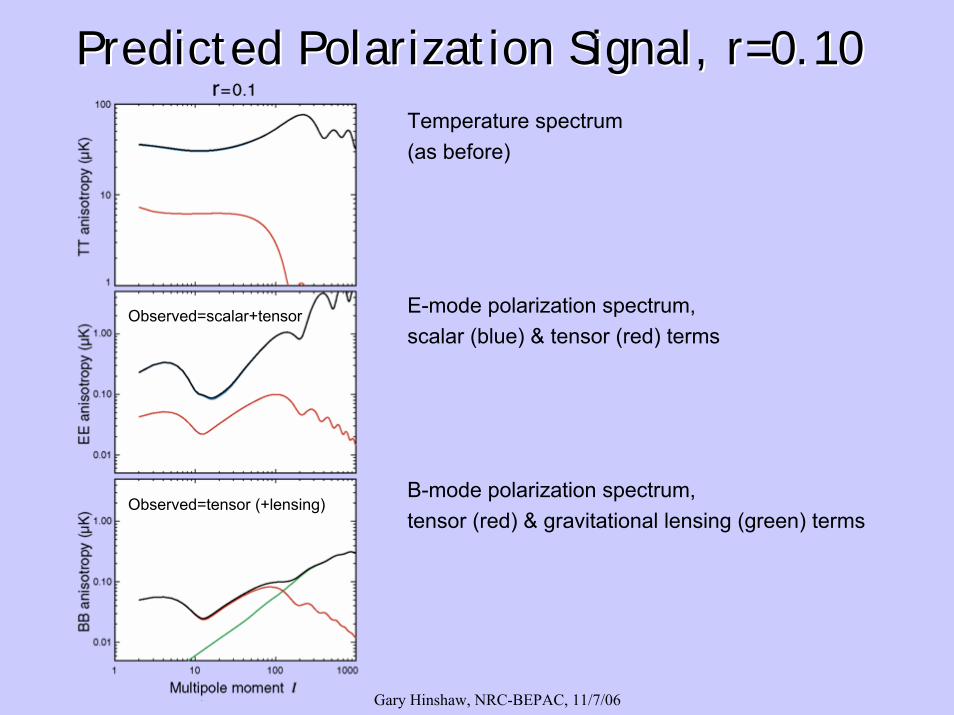
Predicted Polarization Signal, r=0.10Predicted Polarization Signal, r=0.10Temperature spectrum(as before)
E-mode polarization spectrum,scalar (blue) & tensor (red) terms
B-mode polarization spectrum,tensor (red) & gravitational lensing (green) terms
Observed=scalar+tensor
Observed=tensor (+lensing)

Gary Hinshaw, NRC-BEPAC, 11/7/06
Predicted Polarization Signal, r=0.01Predicted Polarization Signal, r=0.01Temperature spectrum(as before)
E-mode polarization spectrum,scalar (blue) & tensor (red) terms
B-mode polarization spectrum,tensor (red) & gravitational lensing (green) terms
Observed=scalar+tensor
Observed=tensor (+lensing)

Gary Hinshaw, NRC-BEPAC, 11/7/06
Current Polarization Data Current Polarization Data –– WMAP3WMAP3
TT – temperature anisotropy
TE – temperature –polarization correlation, (measured in 1st year data)
E-mode polarization, (measured in 3-year data)
B-mode polarization(data upper limit from 3-year data, model upper limit from TT data)
Page et al., 2006

Gary Hinshaw, NRC-BEPAC, 11/7/06
BB CloseBB Close--UpUp
Green -lensing foreground (EE→BB from scalars), frequency independent
Red -gravity wave signal:r=0.3: current upper limitr=0.01: target sensitivity for CMBPol
r=0.01
r=0.3
Gary Hinshaw, NRC-BEPAC, 11/7/06
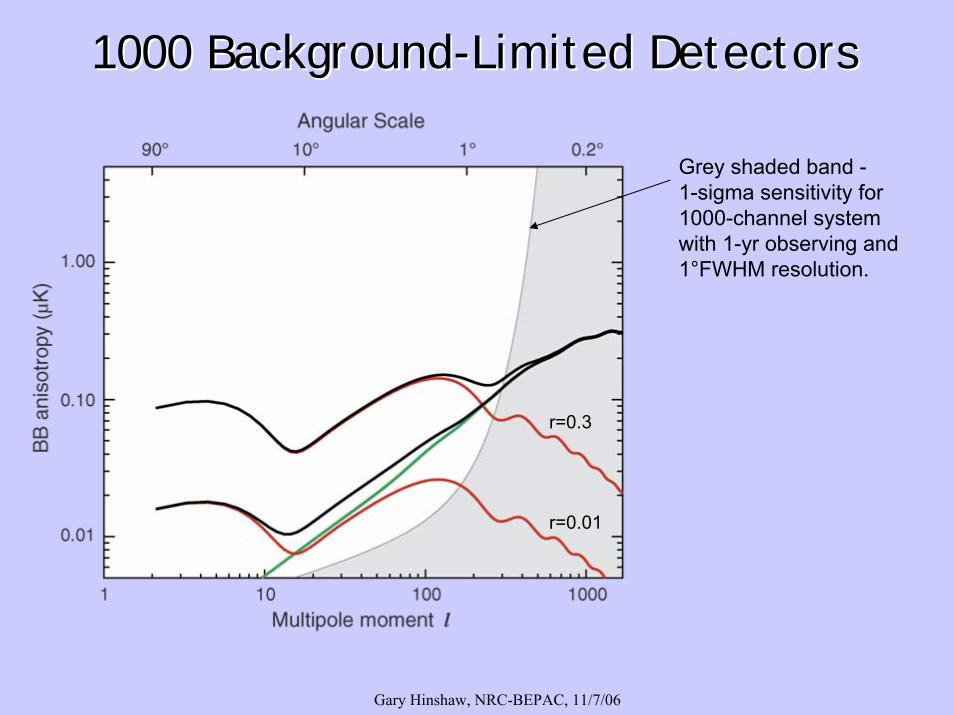
1000 Background1000 Background--Limited DetectorsLimited Detectors
r=0.01
r=0.3
Grey shaded band -1-sigma sensitivity for 1000-channel system with 1-yr observing and 1°FWHM resolution.

Gary Hinshaw, NRC-BEPAC, 11/7/06
Sensitivity & Foreground EstimatesSensitivity & Foreground Estimates
Blue band -Galactic foreground estimate from WMAP3, frequency dependent
Green line -Lensing (EE→BB), frequency independent
Red lines -Gravity wave signal(s)
Grey shaded band -1-sigma sensitivity for 1000-channel system with 1-yr integration, 1°FWHM resolution
r=0.01
r=0.3

Gary Hinshaw, NRC-BEPAC, 11/7/06
The Road to The Road to nanoKelvinnanoKelvin MeasurementsMeasurementsMeasuring CMB polarization at the nanoKelvin level requires:
• Sensitivity:– Employ ~1000 background-limited detectors. – Mostly a fabrication problem, not a fundamental one.
• Removal of foreground signals:– Employ multiple frequencies, roughly 30-300 GHz.– Details of frequency coverage depend on complexity of foreground signals.
• Control of systematic errors:– Modulate polarization signal on multiple time scales
to reject unpolarized light.– Control polarized stray light.
→ hardware design and scan strategy.– Monitor gain fluctuations to a level commensurate with modulation strategy.
→ calibration strategy
VPM(few sec)
Spin(few min)
Orbit(1+ hr)
Annual(1 year)

Gary Hinshaw, NRC-BEPAC, 11/7/06
CMB polarization measurements require:• large arrays of sensitive detectors• control of systematic errors to -80 dB
GSFC research and capabilities:• large superconducting detector arrays• superconducting planar microwave circuits• advanced light coupling schemes• laboratory and balloon flight system tests
Platelet feed horn array & planar OMT for coupling light to planar circuits with highly symmetric beams
Millimeter-wave modeling and test capabilities
QuickTime™ and aVideo decompressor
are needed to see this picture.
Superconducting niobium planar micro-strip microwave circuits with planar antenna coupling
Fabrication and testing of arrays of superconducting transition edge sensors
Superconducting SQUID-multiplexed TES detector readout, and large cryogenic test facilities for detector systems
Needs and CapabilitiesNeeds and Capabilities

Gary Hinshaw, NRC-BEPAC, 11/7/06
Galactic Foreground EmissionGalactic Foreground Emission
• Current estimates of polarized foregrounds have large uncertainties. Frequency of minimum foreground emission is between ~60 – 90 GHz.
• Likely range of required frequency coverage is within 30 – 300 GHz, based on simple linear analyses.
• Key questions:
– Assess the variation of the foreground emission across the sky in both intensity and frequency spectrum.
– Assess how non-Gaussian the polarized Galactic emission is, and to what extent we can take advantage of this to detect and remove these contaminants.

Gary Hinshaw, NRC-BEPAC, 11/7/06
Simple Foreground RemovalSimple Foreground Removal
A simple approach to foreground removal is to form linear combinations of multi-frequency data that cancel signals with known (or specified) foreground spectra.
Examples:
1) logarithmic frequencies from 30-300 GHzFrequencies 30.0 50.0 80.0 125.0 200.0 300.0# channels: 166 166 166 166 166 166Coefficient -0.088 0.241 0.312 0.321 0.275 -0.061
Foreground degradation factor*: 1.44Percentage error in synchrotron & dust removal, assuming Δβ=0.1: 6% 59%
2) logarithmic frequencies from 40-125 GHzFrequencies 40.0 50.0 65.0 80.0 100.0 125.0# channels: 166 166 166 166 166 166Coefficient -0.463 0.344 0.691 0.654 0.305 -0.531
Foreground degradation factor*: 3.11Percentage error in synchrotron & dust removal, assuming Δβ=0.1: 8% 13%
*Foreground Degradation Factor – noise penalty incurred for combining data with sub-optimal weight.
Gary Hinshaw, NRC-BEPAC, 11/7/06
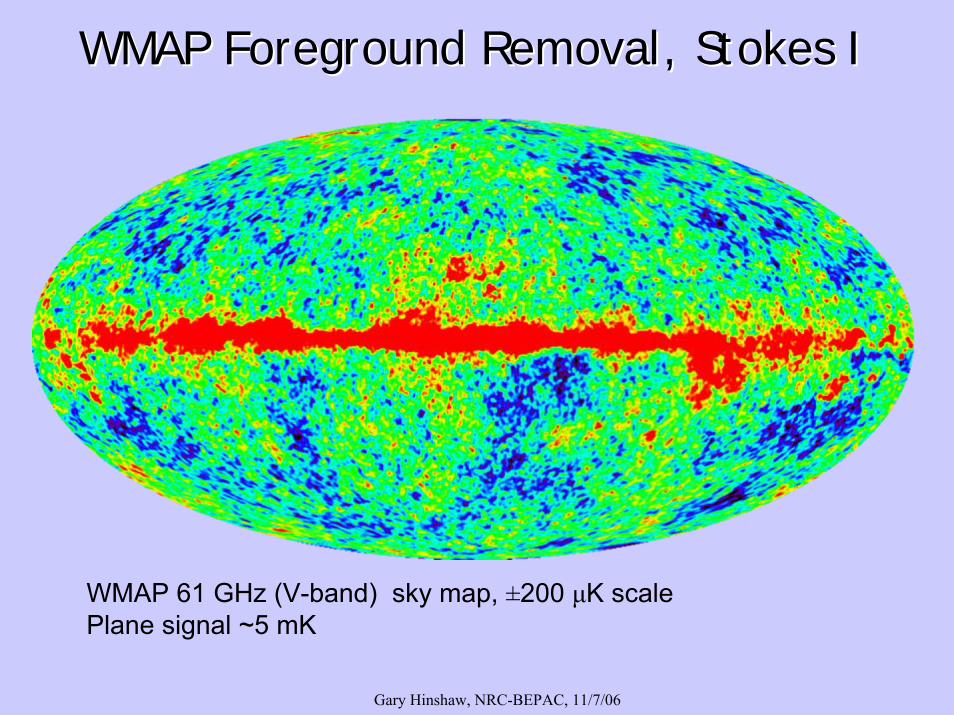
WMAP Foreground Removal, Stokes IWMAP Foreground Removal, Stokes I
WMAP 61 GHz (V-band) sky map, ±200 μK scalePlane signal ~5 mK

Gary Hinshaw, NRC-BEPAC, 11/7/06
WMAP Foreground Removal, Stokes IWMAP Foreground Removal, Stokes I
WMAP Internal Linear Combination (ILC) sky map, ±200 μK scaleResidual plane emission < 100 μK ~2% of 61 GHz signal

Gary Hinshaw, NRC-BEPAC, 11/7/06
WMAP Foreground Removal, Stokes QWMAP Foreground Removal, Stokes QSynchrotron templatefrom WMAP 22 GHz polarization channel
Dust templatefrom model intensity
and starlight obs.
Procedure: fit and subtract best-fitsynchrotron and dust templatesfrom each of the 4 frequency bands
before after33 GHz
41 GHz
61 GHz
94 GHz
Gary Hinshaw, NRC-BEPAC, 11/7/06
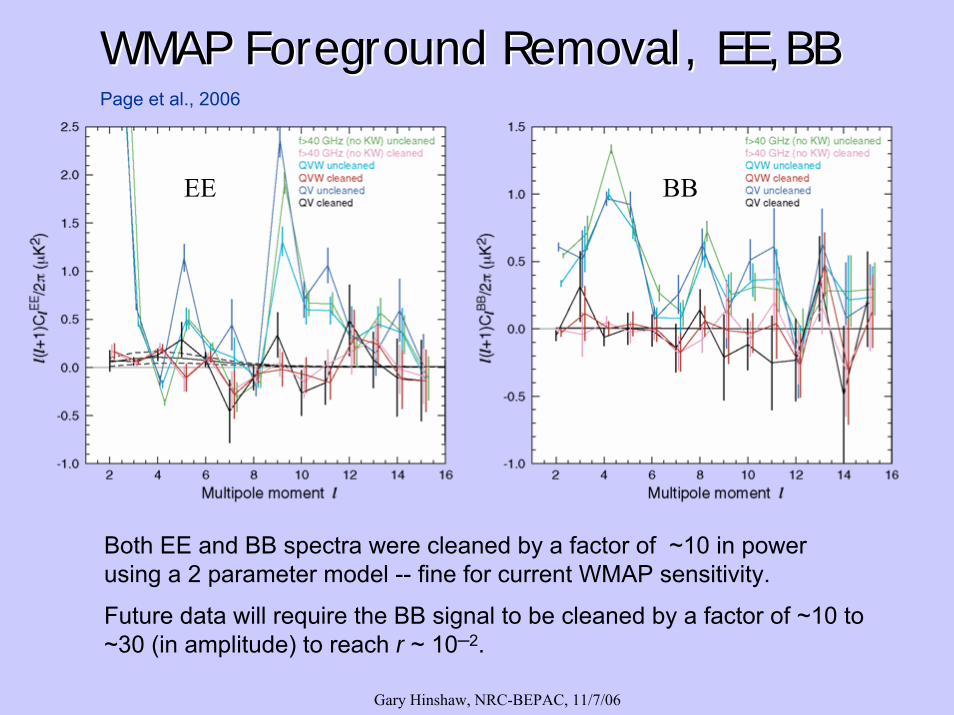
WMAP Foreground Removal, EE,BBWMAP Foreground Removal, EE,BB
Both EE and BB spectra were cleaned by a factor of ~10 in powerusing a 2 parameter model -- fine for current WMAP sensitivity.
Future data will require the BB signal to be cleaned by a factor of ~10 to ~30 (in amplitude) to reach r ~ 10─2.
EE BB
Page et al., 2006
Gary Hinshaw, NRC-BEPAC, 11/7/06
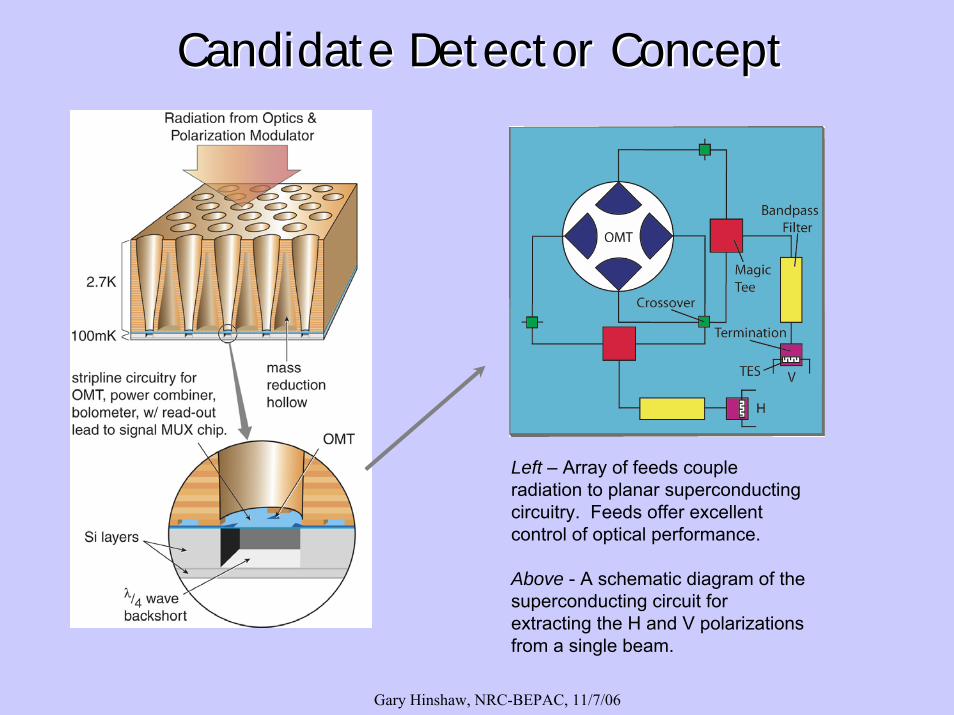
Candidate Detector ConceptCandidate Detector Concept
Left – Array of feeds couple radiation to planar superconducting circuitry. Feeds offer excellent control of optical performance.
Above - A schematic diagram of the superconducting circuit for extracting the H and V polarizations from a single beam.

Gary Hinshaw, NRC-BEPAC, 11/7/06
Candidate Modulation ConceptCandidate Modulation Concept“The closer a modulator is to the sky in the signal path, the more potential systematic
effects it can modulate and thus stabilize.” – TFCR Report
Right - the general layout for a single optical path. The primary optical element is a variable-delay polarization modulator (VPM). A single mirror focuses the radiation into a cryostat where it couples to the focal plane.
Left - a Hertz/HHT VPM module.
Philosophy –
• Null response to unpolarized radiation
• Strict control of polarized stray light.

Gary Hinshaw, NRC-BEPAC, 11/7/06
Candidate Observatory ConceptCandidate Observatory Concept
Multiple copies of basic polarimeter module, scaled in frequency, packaged in focal plane, co-aligned along s/csymmetry axis.
Gary Hinshaw, NRC-BEPAC, 11/7/06
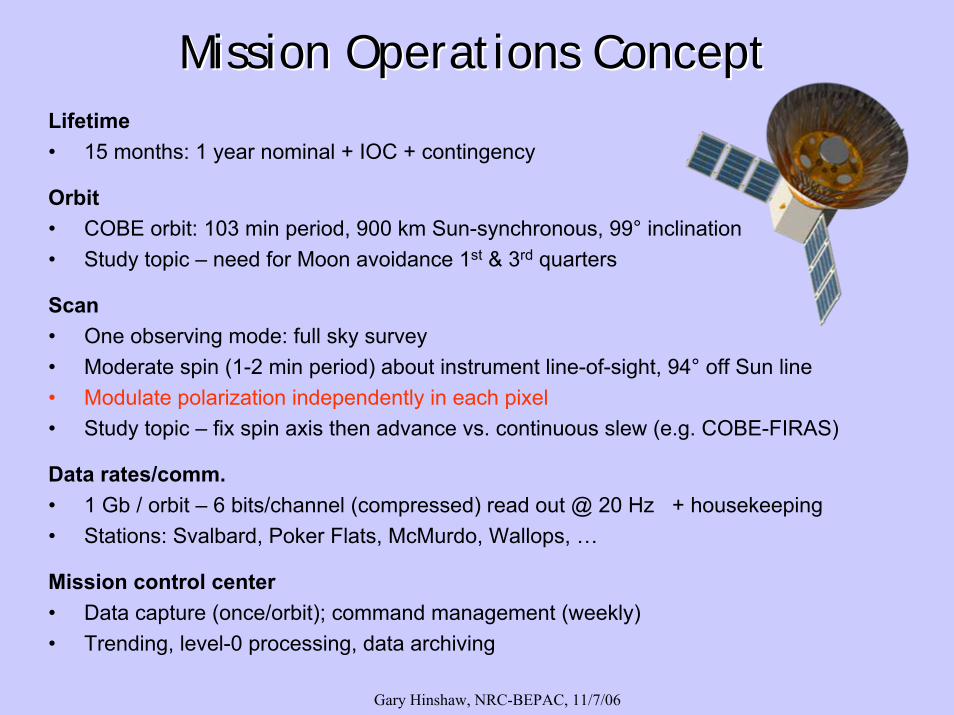
Mission Operations ConceptMission Operations ConceptLifetime• 15 months: 1 year nominal + IOC + contingency
Orbit• COBE orbit: 103 min period, 900 km Sun-synchronous, 99° inclination• Study topic – need for Moon avoidance 1st & 3rd quarters
Scan• One observing mode: full sky survey• Moderate spin (1-2 min period) about instrument line-of-sight, 94° off Sun line• Modulate polarization independently in each pixel• Study topic – fix spin axis then advance vs. continuous slew (e.g. COBE-FIRAS)
Data rates/comm.• 1 Gb / orbit – 6 bits/channel (compressed) read out @ 20 Hz + housekeeping• Stations: Svalbard, Poker Flats, McMurdo, Wallops, …
Mission control center• Data capture (once/orbit); command management (weekly)• Trending, level-0 processing, data archiving

Gary Hinshaw, NRC-BEPAC, 11/7/06
New Techniques for New Techniques for CMBPolCMBPolDetectors• Large format TES detectors now in development at GSFC for ACT, GBT.• Need to develop polarization sensitive optical coupling techniques.• Many synergies with X-ray detector technologies.
Polarization modulation• Sub-mm variable-delay polarization modulator (VPM) fielded at HHT.• Need to develop for GHz CMB application. No fundamental issues.
Focal plane• Packaging and thermal control of 1000-channel focal plane.• Engineering challenge, not a fundamental one.
Mission concept development• Need more sophisticated development for reliable cost estimates.

Gary Hinshaw, NRC-BEPAC, 11/7/06
TFCR Program SummaryTFCR Program Summary• CMB polarization provides the only currently-known probe of
physics at the Grand Unified Theory (GUT) scale.• Concepts for a capable CMB polarization mission -- within the scope
of an Einstein Probe -- already exist. • The program leading to an actual mission requires:
– Systems development• Produce and field-test viable instrument components.
– Field experience• Hands-on experience with new receivers and observing strategies. • Parallels successful lead-up to COBE, WMAP, & Planck.
– Foreground and E-mode data• To aid in defining the performance requirements of a space mission.
– Mission concept development• Paper studies that integrate mission design with field experience and computer
simulations.

Gary Hinshaw, NRC-BEPAC, 11/7/06
BackupBackup

Gary Hinshaw, NRC-BEPAC, 11/7/06
Inflation Parameters: Measurements c.2006Inflation Parameters: Measurements c.20061.0
0.8
0.6
0.4
0.2
0.0
r 0.0
02
HZ
0.90 0.95 1.00 1.05
ns
1.0
0.8
0.6
0.4
0.2
0.0
r 0.0
02
0.90 0.95 1.00 1.05
ns
WMAP WMAP + SDSS
WMAP + 2dF WMAP + CBI + VSA6050N=
HZ
6050N=
HZ
6050N=
HZ
6050N=
Gary Hinshaw, NRC-BEPAC, 11/7/06
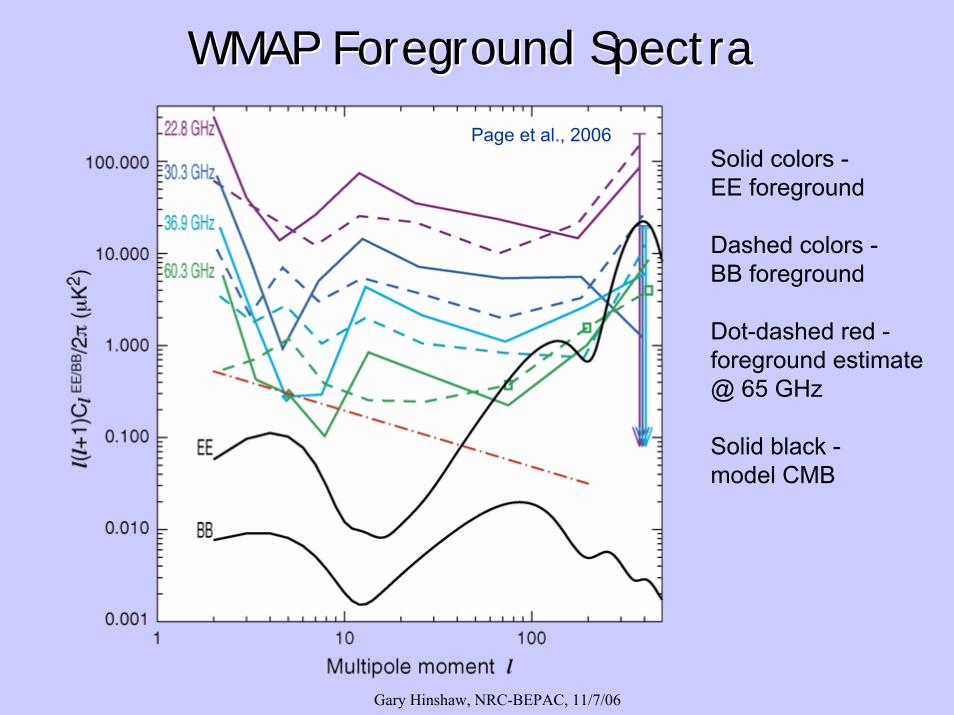
WMAP Foreground SpectraWMAP Foreground Spectra
Solid colors -EE foreground
Dashed colors -BB foreground
Dot-dashed red -foreground estimate@ 65 GHz
Solid black -model CMB
Page et al., 2006

Gary Hinshaw, NRC-BEPAC, 11/7/06
SystematicsSystematics in WMAP 94 GHz Polarizationin WMAP 94 GHz Polarization
Examine cleaned data vs. frequency to look for residual effects.
94 GHz channel exhibits significant residuals that cannot be explained by cleaning errors.
We continue to investigate this with more data.
Underscores risk of not sufficiently modulating the polarization signal.
So…
Page et al., 2006

Gary Hinshaw, NRC-BEPAC, 11/7/06
CMBPolCMBPol StatisticsStatistics
Frequency range 30-300 GHz in 6 bandsNumber of channels 1024 allocated to 6 bandsResolution (FWHM) 1°Sensitivity Background limitedDetection Feed/OMT-fed TESModulation VPM, 50 cm clear apertureOptics Parabaloid primaryOrbit 900 km sun-sync polarObserving Spin about line-of-sightPower (instrument) 600 WData rate 1 Gb / orbit (103 min)

Gary Hinshaw, NRC-BEPAC, 11/7/06

Gary Hinshaw, NRC-BEPAC, 11/7/06
System Concept
• System has these functions:– Coupling of radiation from telescope to
microstrip circuit– Appropriate phase combination of signals– Filtering– Detection

Gary Hinshaw, NRC-BEPAC, 11/7/06
CMBPol Detector Design Process
Microstrip Coupled Detectors
Advantages: • can insert other components between antenna and detector• microstrip transmission lines and planar components are more compact than 3D versions
Gary Hinshaw, NRC-BEPAC, 11/7/06
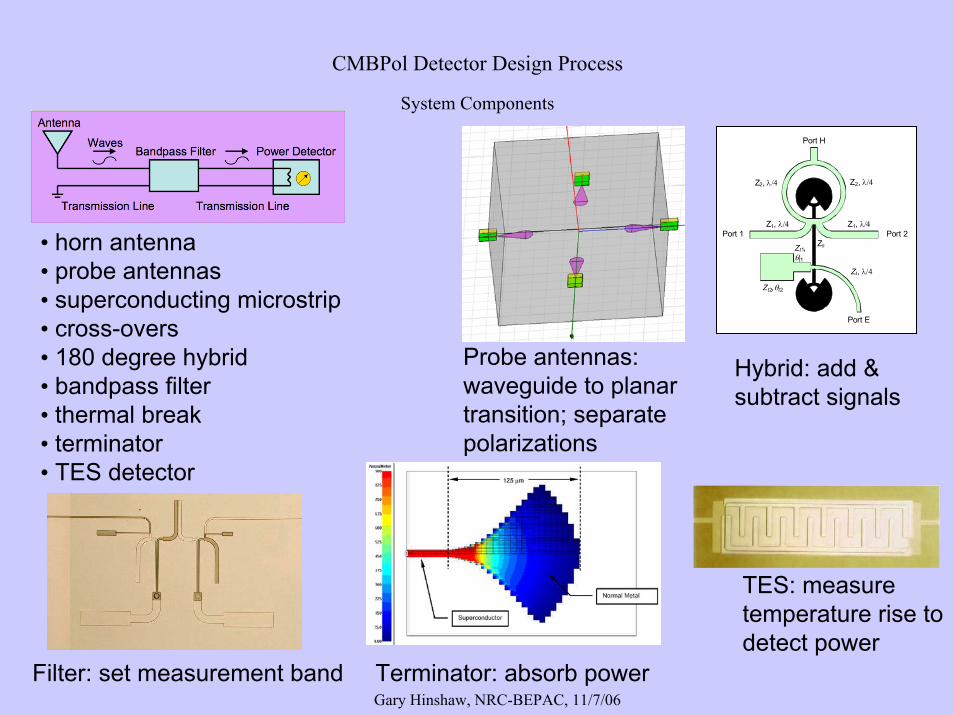
CMBPol Detector Design Process
System Components
• horn antenna• probe antennas• superconducting microstrip• cross-overs• 180 degree hybrid• bandpass filter• thermal break• terminator• TES detector
Probe antennas: waveguide to planar transition; separate polarizations
Port H
Port 1 Port 2
Port E
Z1, λ/4
Z2, λ/4
Zs
Zt, λ/4
Z1, λ/4
Zt1, θt1
Zt2,θt2
Z2, λ/4
Hybrid: add & subtract signals
Filter: set measurement band Terminator: absorb power
TES: measure temperature rise to detect power

Gary Hinshaw, NRC-BEPAC, 11/7/06
CMBPol Detector Design Process
Modeling and Test of Individual Components
bi = ΣSij aj
a1
a2
b1
b2
a3
b3
a4
b4
Scattering Matrix = reflection and transmission coefficients Filter Response Function
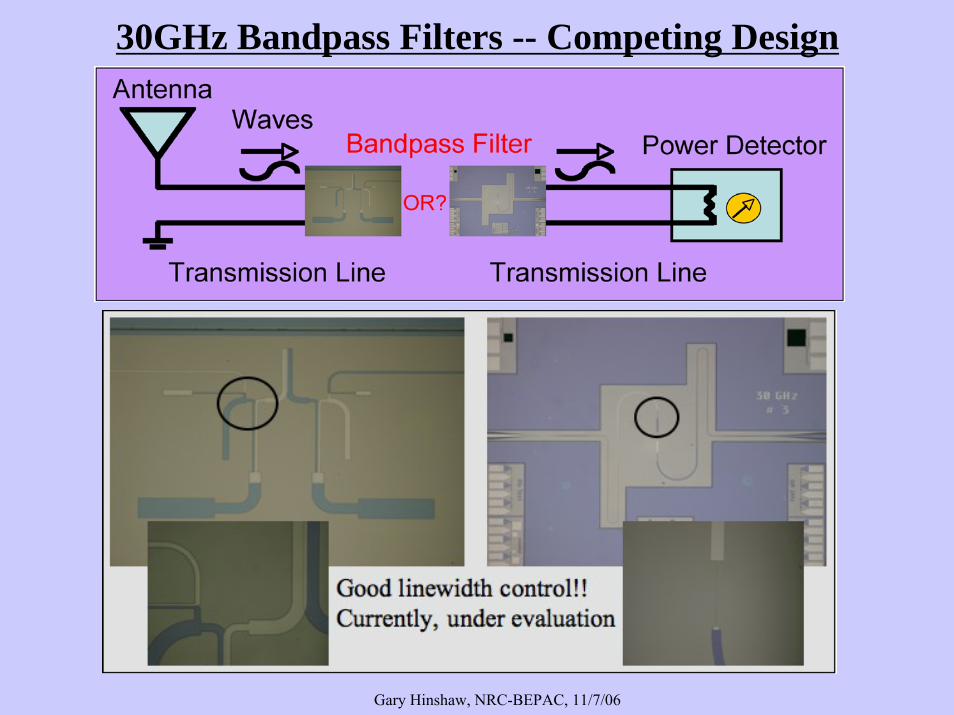
• modular set of design tasks (many completed with this funding!)• simulation & optimization of one component takes ≈ 1-2 weeks• most designs involve significant innovations• simulation input: materials properties and geometry• competing designs can be evaluated
Gary Hinshaw, NRC-BEPAC, 11/7/06
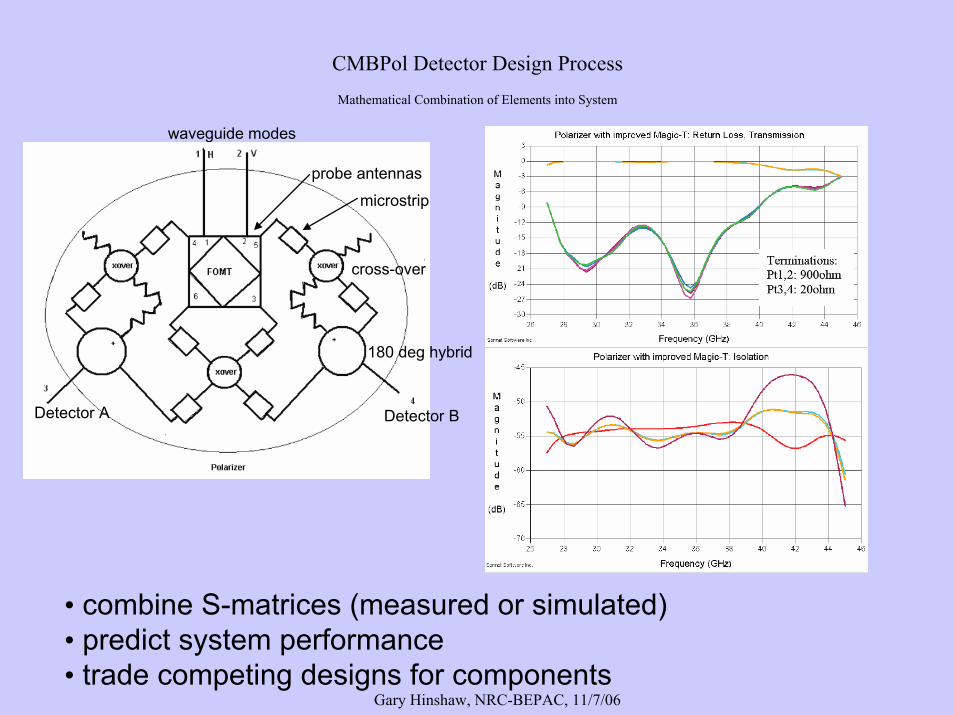
CMBPol Detector Design ProcessMathematical Combination of Elements into System
• combine S-matrices (measured or simulated)• predict system performance• trade competing designs for components
waveguide modes
Detector A Detector B
probe antennas
cross-over
180 deg hybrid
microstrip
Gary Hinshaw, NRC-BEPAC, 11/7/06
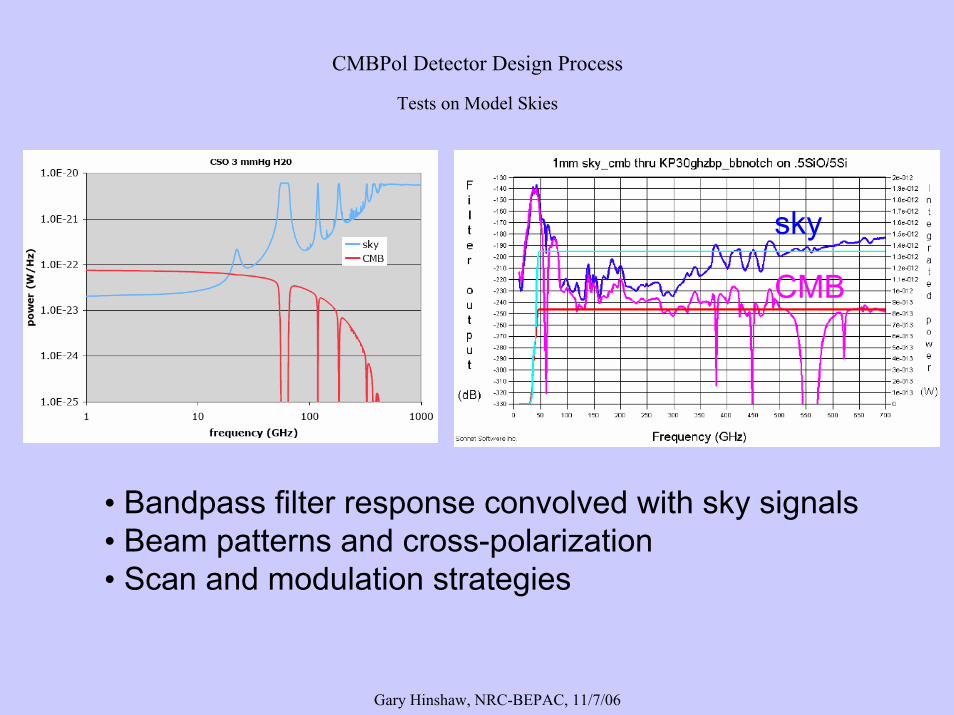
CMBPol Detector Design Process
Tests on Model Skies
• Bandpass filter response convolved with sky signals• Beam patterns and cross-polarization• Scan and modulation strategies
sky
CMB
Gary Hinshaw, NRC-BEPAC, 11/7/06
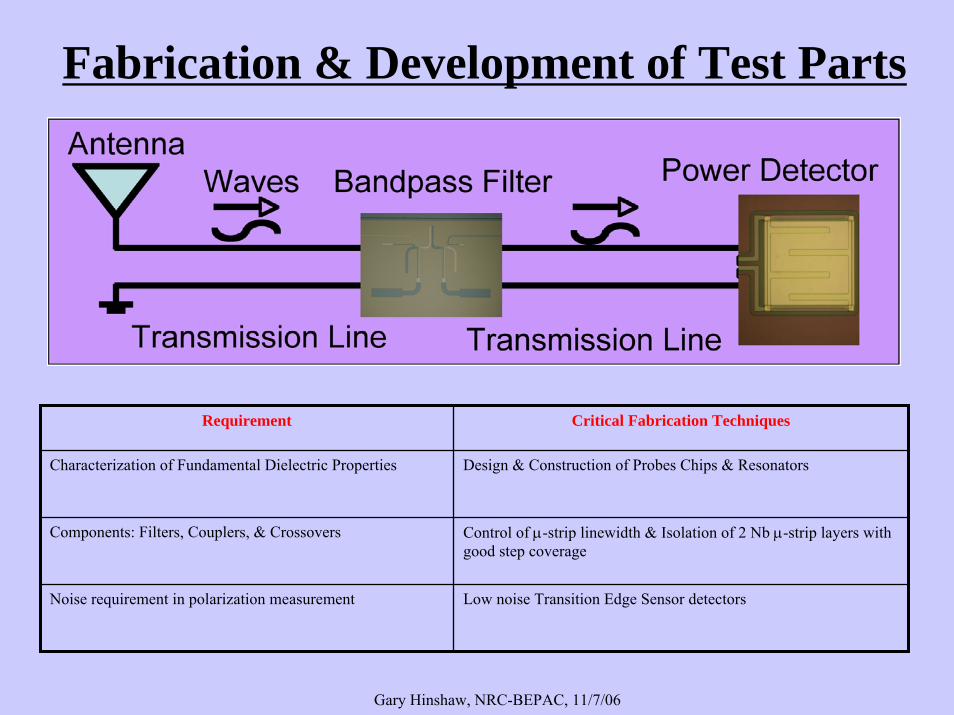
Fabrication & Development of Test Parts
Requirement Critical Fabrication Techniques
Characterization of Fundamental Dielectric Properties Design & Construction of Probes Chips & Resonators
Components: Filters, Couplers, & Crossovers Control of μ-strip linewidth & Isolation of 2 Nb μ-strip layers with good step coverage
Noise requirement in polarization measurement Low noise Transition Edge Sensor detectors

Gary Hinshaw, NRC-BEPAC, 11/7/06
• Waveguide Probe Chips: Funded by PAPPA
Characterization of Dielectric Properties of Al2O3
100 μm thick Si cantilever
• Devices design basic structure - superconducting Nb μ-strip, lossless up to 700 GHz

Gary Hinshaw, NRC-BEPAC, 11/7/06
• Ring Resonators on Si (funded under previous DDF) and Al2O3 Dielectric layers -- resonator Q, coupling strength, and dielectric loss measurement
Predicted Ring Resonator Performance
Characterization of Al2O3 & Si Dielectric Properties
Different coupling geometries between μ-strip & resonators
Gary Hinshaw, NRC-BEPAC, 11/7/06
30GHz Bandpass Filters -- Competing Design
Gary Hinshaw, NRC-BEPAC, 11/7/06
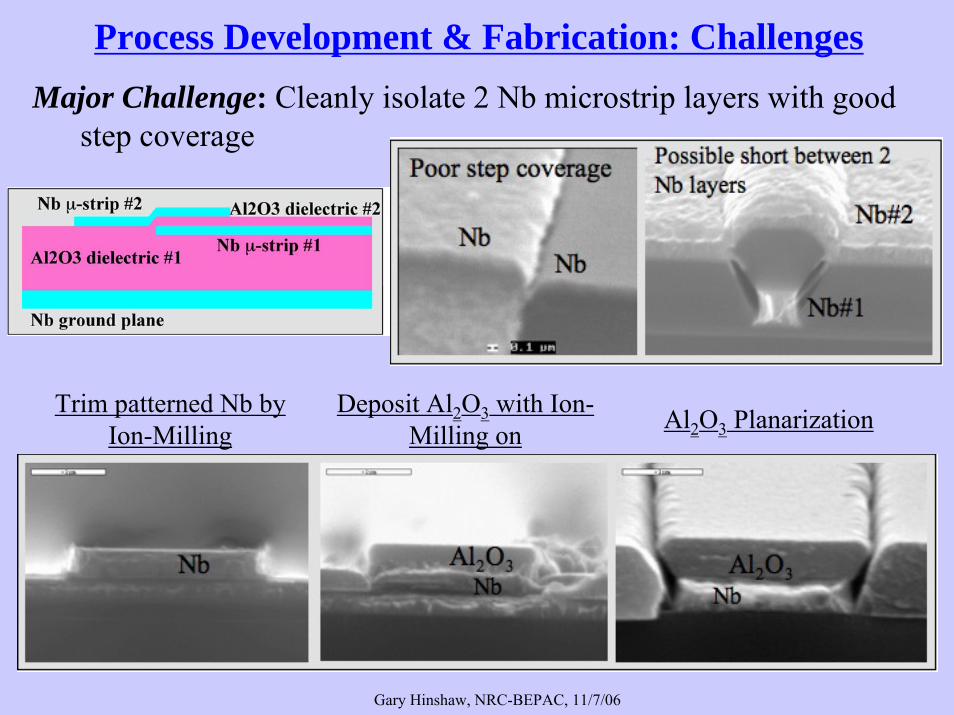
Major Challenge: Cleanly isolate 2 Nb microstrip layers with good step coverage
Trim patterned Nb by Ion-Milling
Deposit Al2O3 with Ion-Milling on Al2O3 Planarization
Process Development & Fabrication: Challenges

Gary Hinshaw, NRC-BEPAC, 11/7/06
Our Approach to Nb isolation:1. Modify Nb Deposition Method: RF bias &
DC deposition separately2. Increase ratio between dielectric layer
thickness and step height
Fabrication/Process Development Challenge
Gary Hinshaw, NRC-BEPAC, 11/7/06
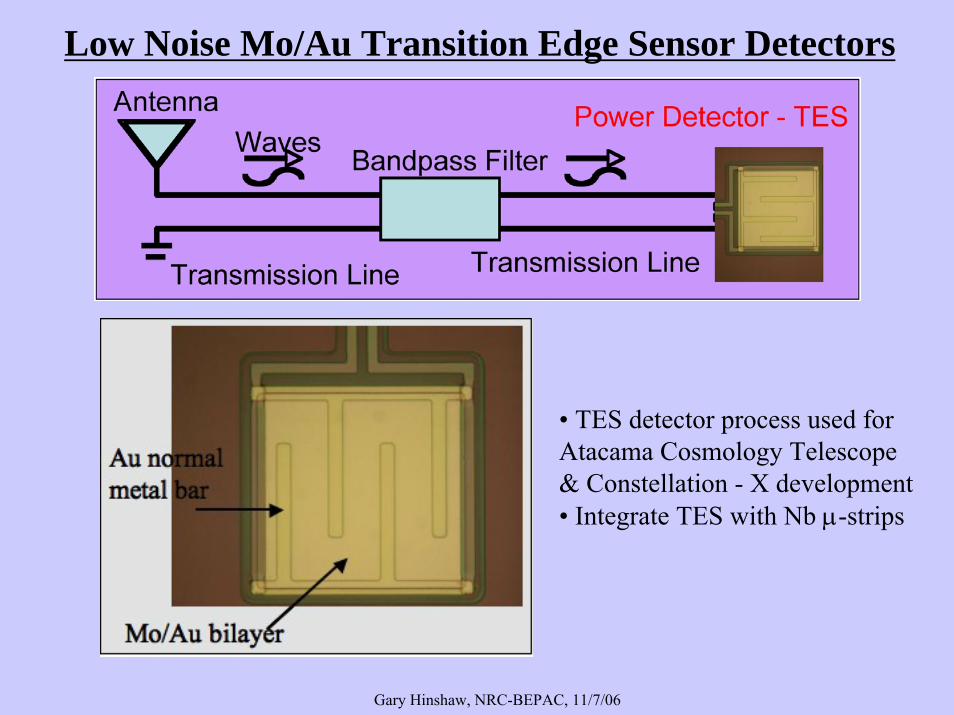
Low Noise Mo/Au Transition Edge Sensor Detectors
• TES detector process used for Atacama Cosmology Telescope & Constellation - X development• Integrate TES with Nb μ-strips
Gary Hinshaw, NRC-BEPAC, 11/7/06
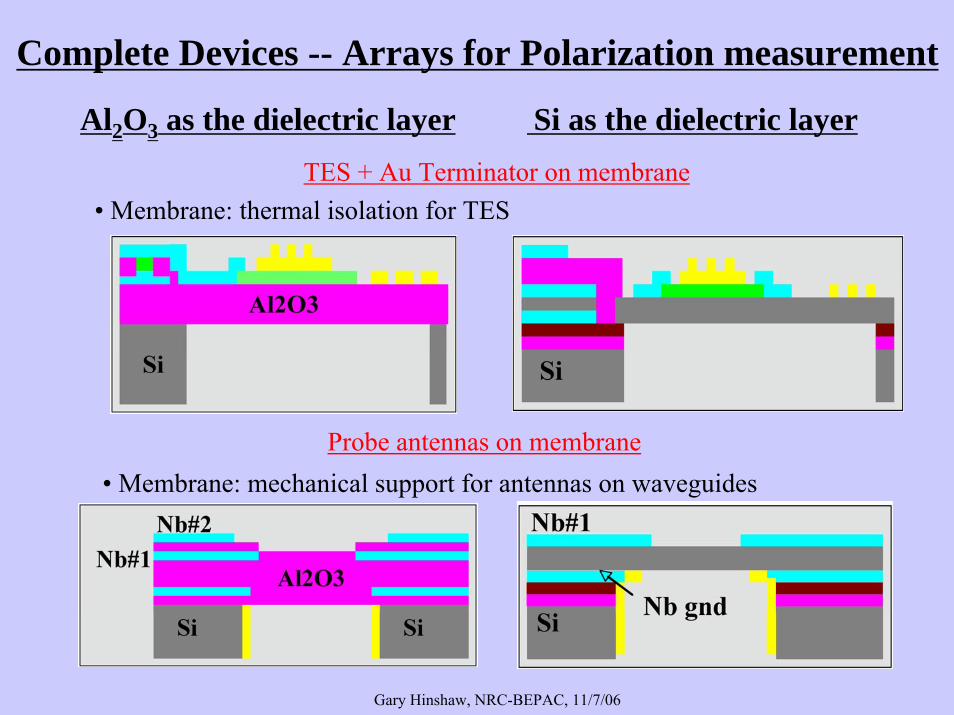
Complete Devices -- Arrays for Polarization measurement
Al2O3 as the dielectric layer
Probe antennas on membrane
TES + Au Terminator on membrane
Si as the dielectric layer
• Membrane: thermal isolation for TES
• Membrane: mechanical support for antennas on waveguides

Gary Hinshaw, NRC-BEPAC, 11/7/06
Galactic Foreground EstimateGalactic Foreground Estimate
Blue band -galactic foreground estimate from WMAP3 @ 65 GHz,frequency dependent
r=0.01
r=0.3


