
Elasticity of Demand for Water SupplyStatus Update to the Executive Water Finance BoardState of Utah | Governor’s Office of Management and Budget
August 19, 2019
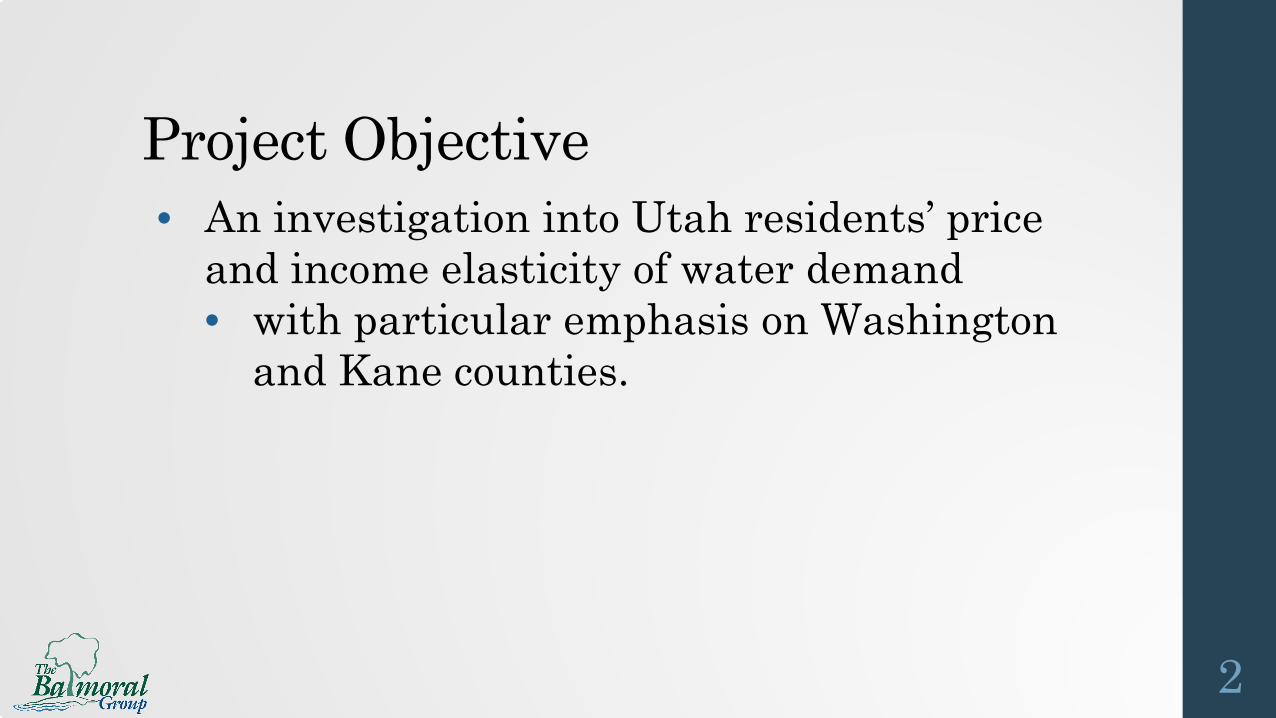
Project Objective
2
• An investigation into Utah residents’ price and income elasticity of water demand• with particular emphasis on Washington
and Kane counties.
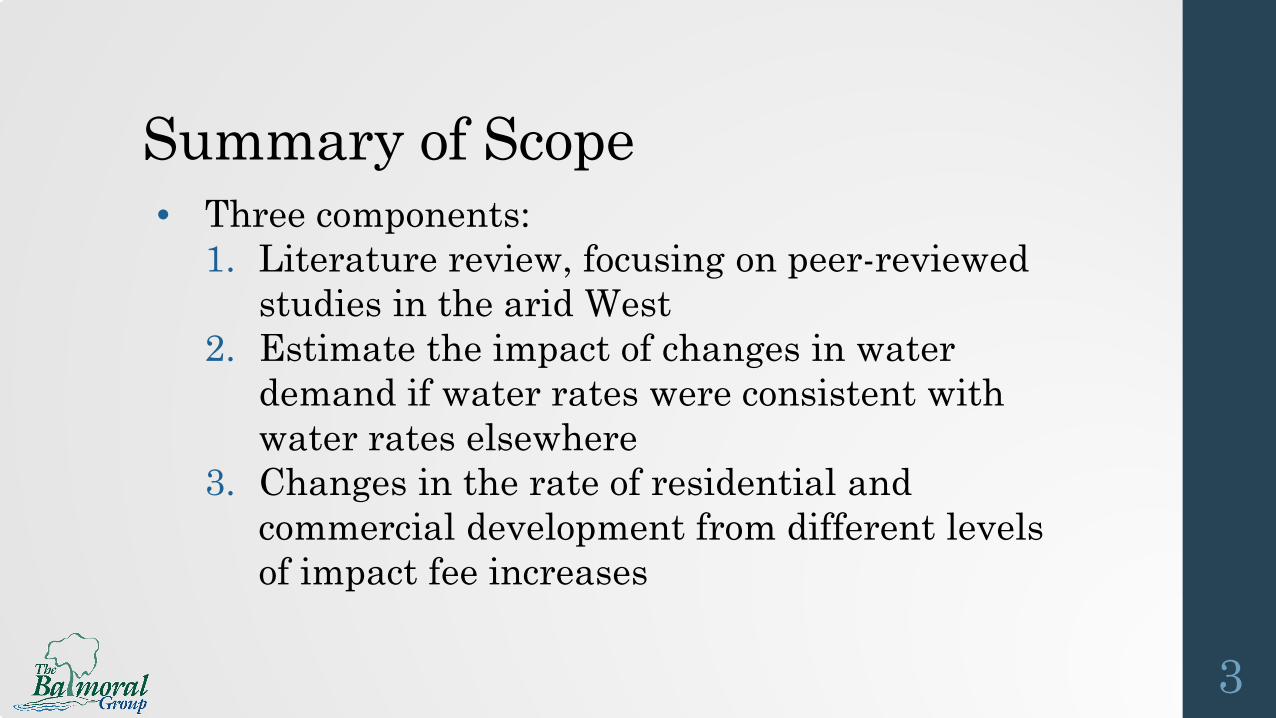
Summary of Scope
3
• Three components:1. Literature review, focusing on peer-reviewed
studies in the arid West2. Estimate the impact of changes in water
demand if water rates were consistent with water rates elsewhere
3. Changes in the rate of residential and commercial development from different levels of impact fee increases
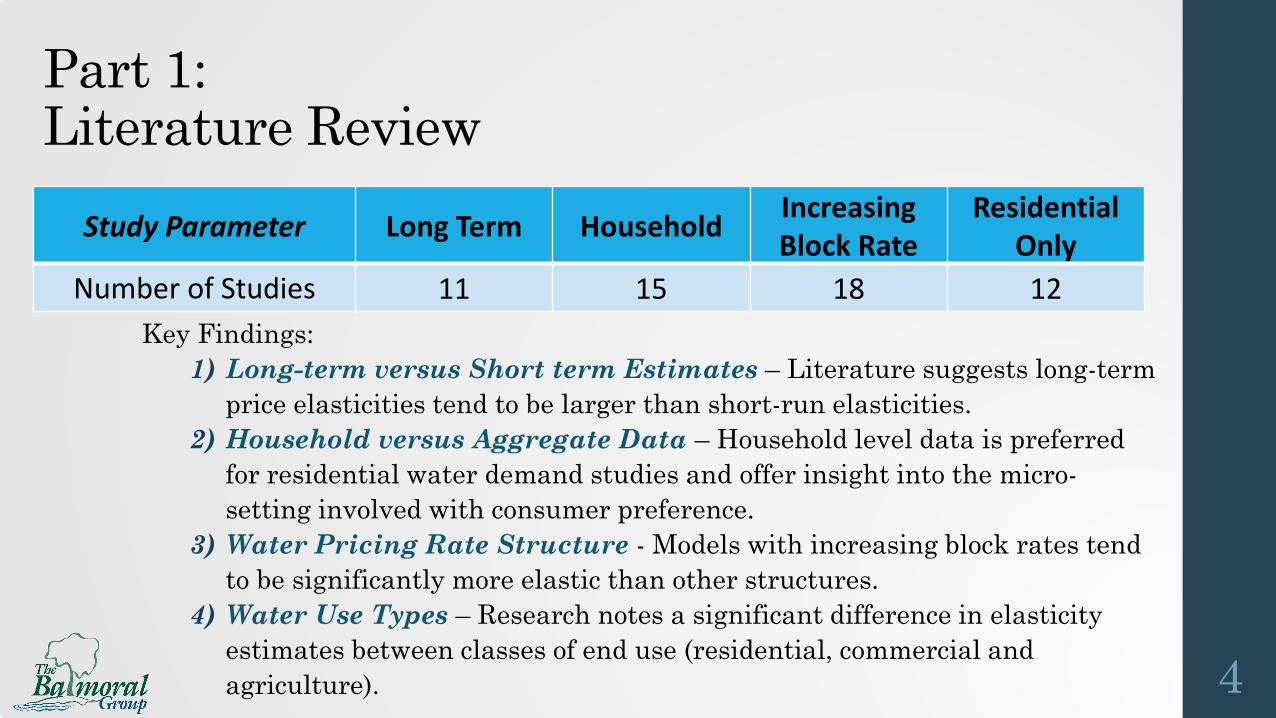
Key Findings:1) Long-term versus Short term Estimates – Literature suggests long-term
price elasticities tend to be larger than short-run elasticities.2) Household versus Aggregate Data – Household level data is preferred
for residential water demand studies and offer insight into the micro-setting involved with consumer preference.
3) Water Pricing Rate Structure - Models with increasing block rates tend to be significantly more elastic than other structures.
4) Water Use Types – Research notes a significant difference in elasticity estimates between classes of end use (residential, commercial and agriculture).
Part 1: Literature Review
4
Study Parameter Long Term Household Increasing Block Rate
Residential Only
Number of Studies 11 15 18 12
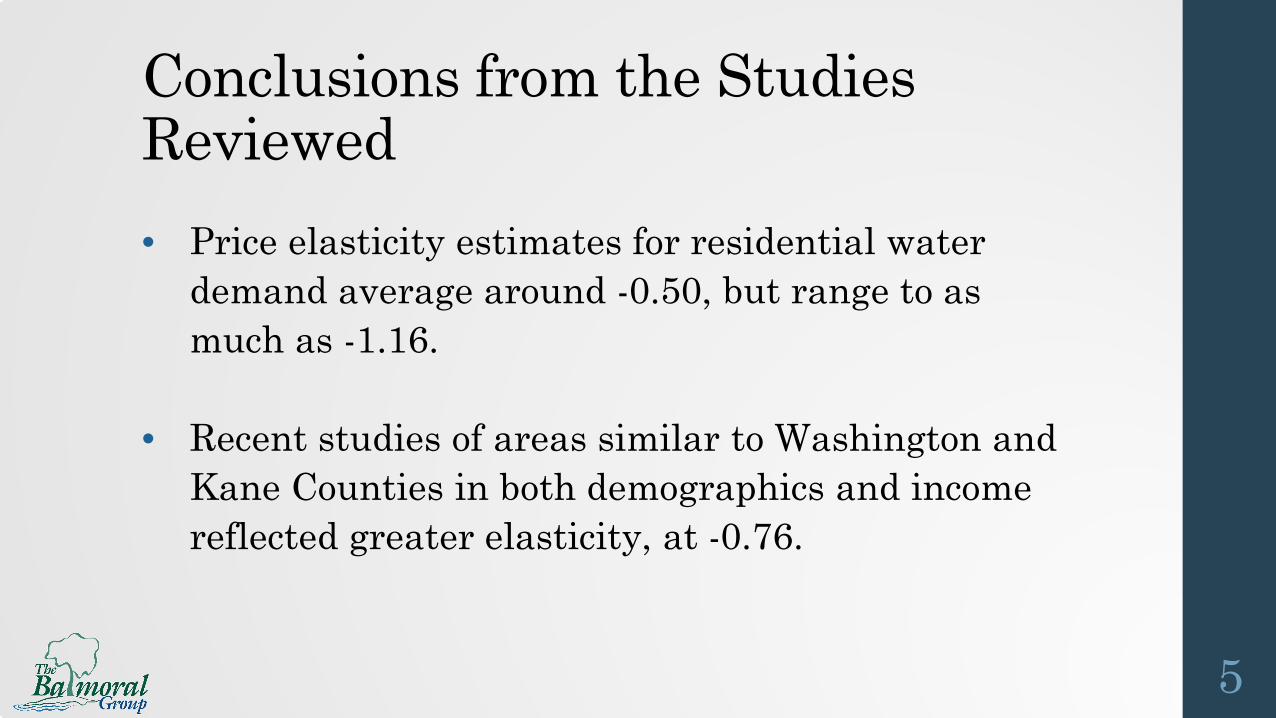
• Price elasticity estimates for residential water demand average around -0.50, but range to as much as -1.16.
• Recent studies of areas similar to Washington and Kane Counties in both demographics and income reflected greater elasticity, at -0.76.
Conclusions from the Studies Reviewed
5
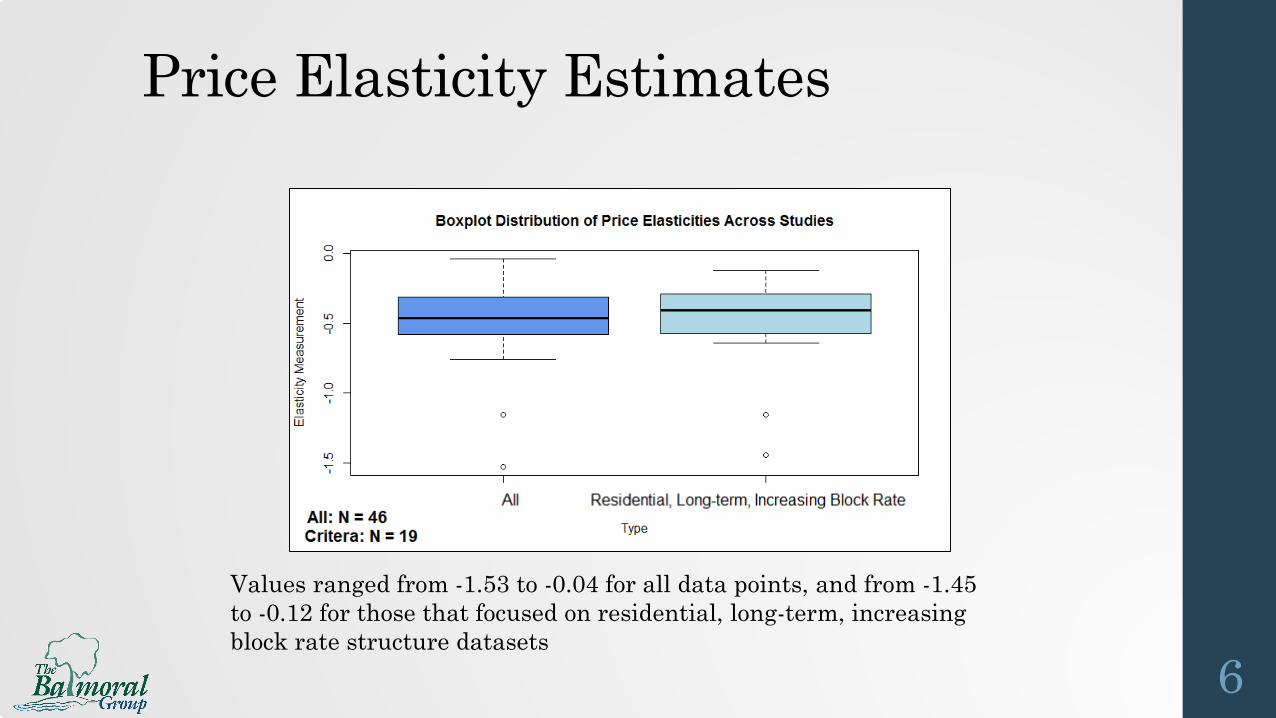
Values ranged from -1.53 to -0.04 for all data points, and from -1.45 to -0.12 for those that focused on residential, long-term, increasing block rate structure datasets
Price Elasticity Estimates
6
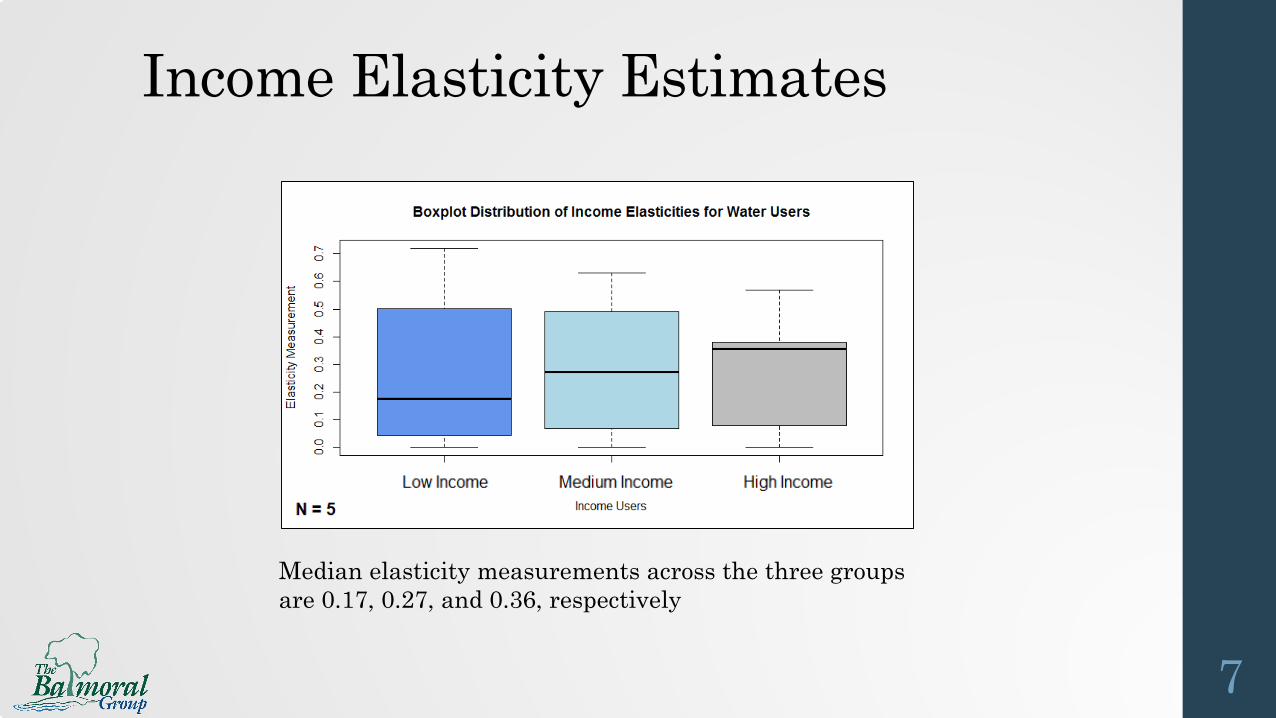
Median elasticity measurements across the three groups are 0.17, 0.27, and 0.36, respectively
Income Elasticity Estimates
7
Part 2: Estimate price and income elasticity • Multiple steps for this task:1. Data collection from utilities across UtahRequested water usage data from 24 utilitiesReceived data from 12 utilities; 10 are usable
2. Run descriptive statistics to validate data3. Test models from literature4. Interpret inferences and prepare report
8
1)10 datasets totaling over 92,000 households have been validated - Provides household level data, which is preferred for modeling residential water demand studies. Totals about 3 million records (36 months for each)
2)Water Pricing Rate Structure – All datasets include increasing block rates, however some are structured with little difference between tiers (may reflect insignificant differences in consumption behavior).
3)Water Use Types – Datasets include different classes of end use (residential, commercial and industrial) but are predominantly single family residential.
Data Status
9
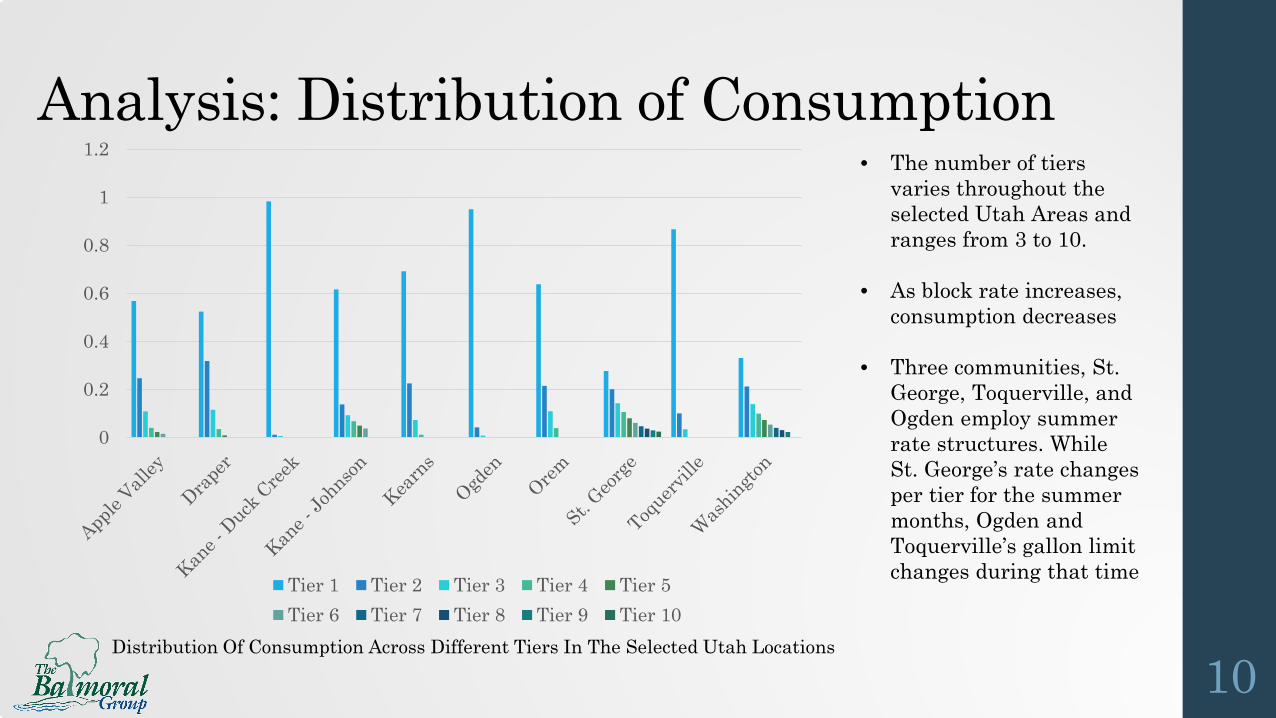
Analysis: Distribution of Consumption
10Distribution Of Consumption Across Different Tiers In The Selected Utah Locations
• The number of tiers varies throughout the selected Utah Areas and ranges from 3 to 10.
• As block rate increases, consumption decreases
• Three communities, St. George, Toquerville, and Ogden employ summer rate structures. While St. George’s rate changes per tier for the summer months, Ogden and Toquerville’s gallon limit changes during that time
0
0.2
0.4
0.6
0.8
1
1.2
Tier 1 Tier 2 Tier 3 Tier 4 Tier 5Tier 6 Tier 7 Tier 8 Tier 9 Tier 10
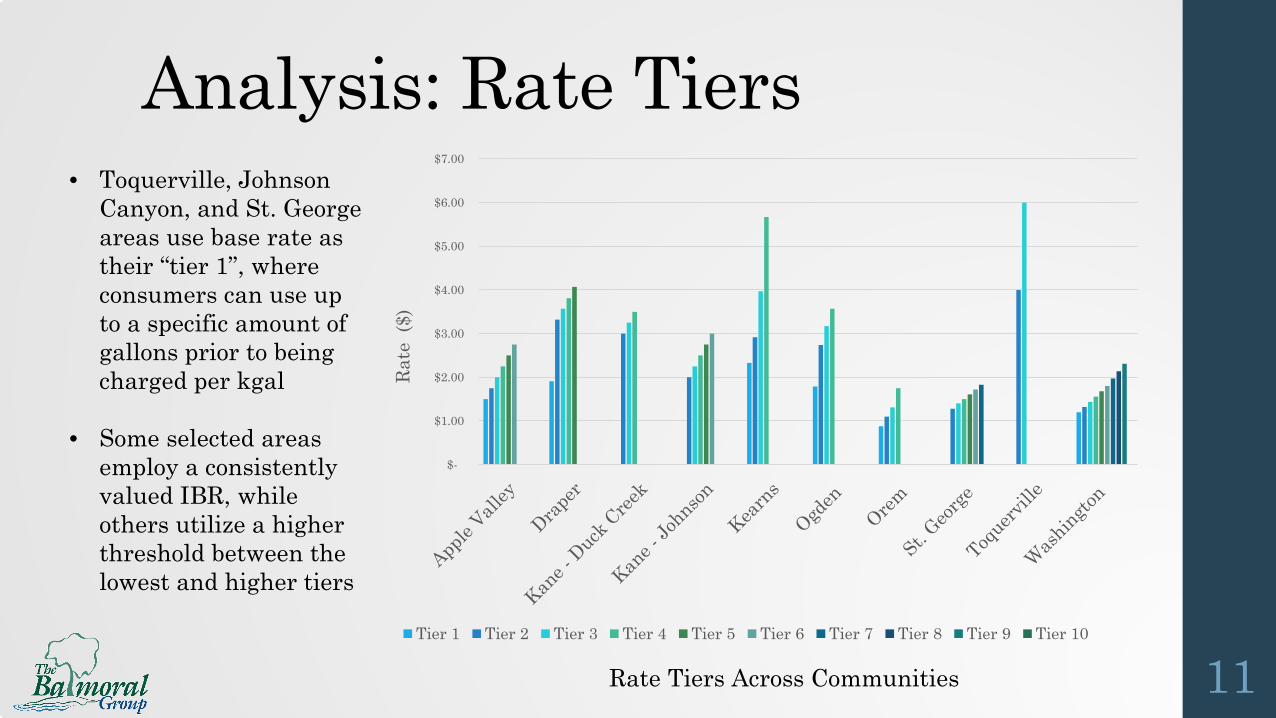
Analysis: Rate Tiers
11Rate Tiers Across Communities
• Toquerville, Johnson Canyon, and St. George areas use base rate as their “tier 1”, where consumers can use up to a specific amount of gallons prior to being charged per kgal
• Some selected areas employ a consistently valued IBR, while others utilize a higher threshold between the lowest and higher tiers
$-
$1.00
$2.00
$3.00
$4.00
$5.00
$6.00
$7.00
Rate
($)
Tier 1 Tier 2 Tier 3 Tier 4 Tier 5 Tier 6 Tier 7 Tier 8 Tier 9 Tier 10
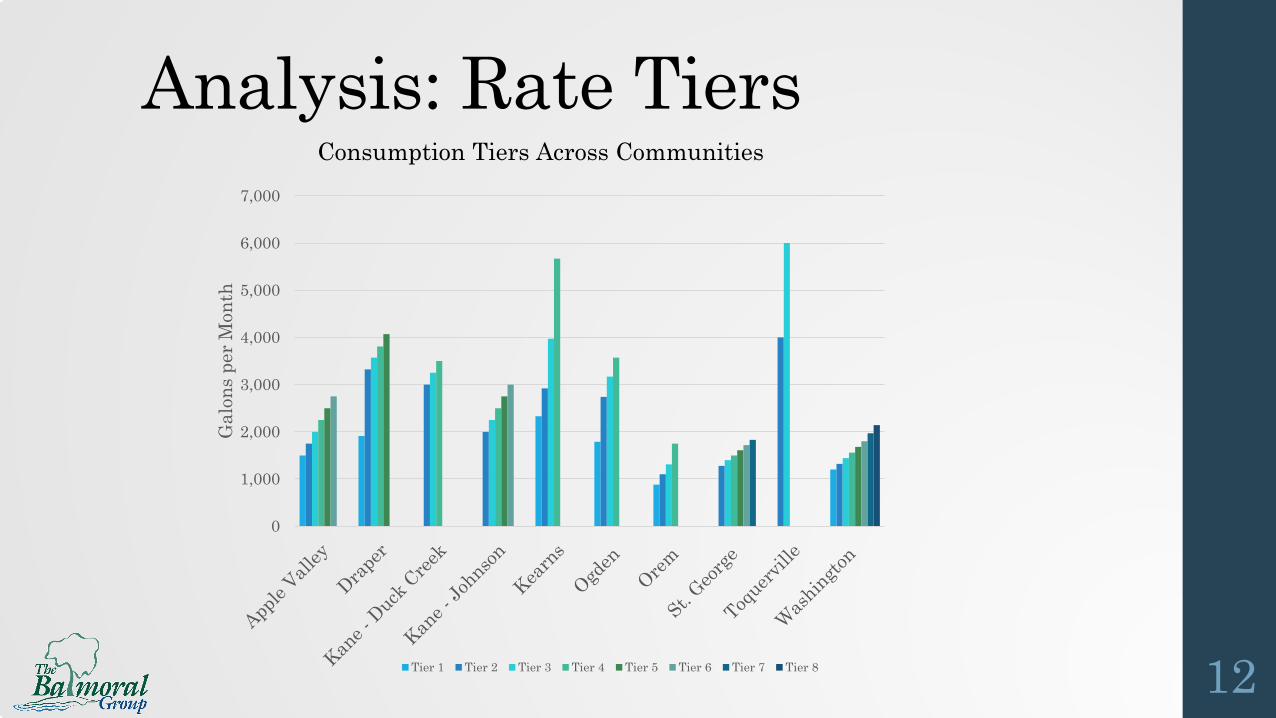
Analysis: Rate Tiers
12
Consumption Tiers Across Communities
0
1,000
2,000
3,000
4,000
5,000
6,000
7,000
Gal
ons
per M
onth
Tier 1 Tier 2 Tier 3 Tier 4 Tier 5 Tier 6 Tier 7 Tier 8
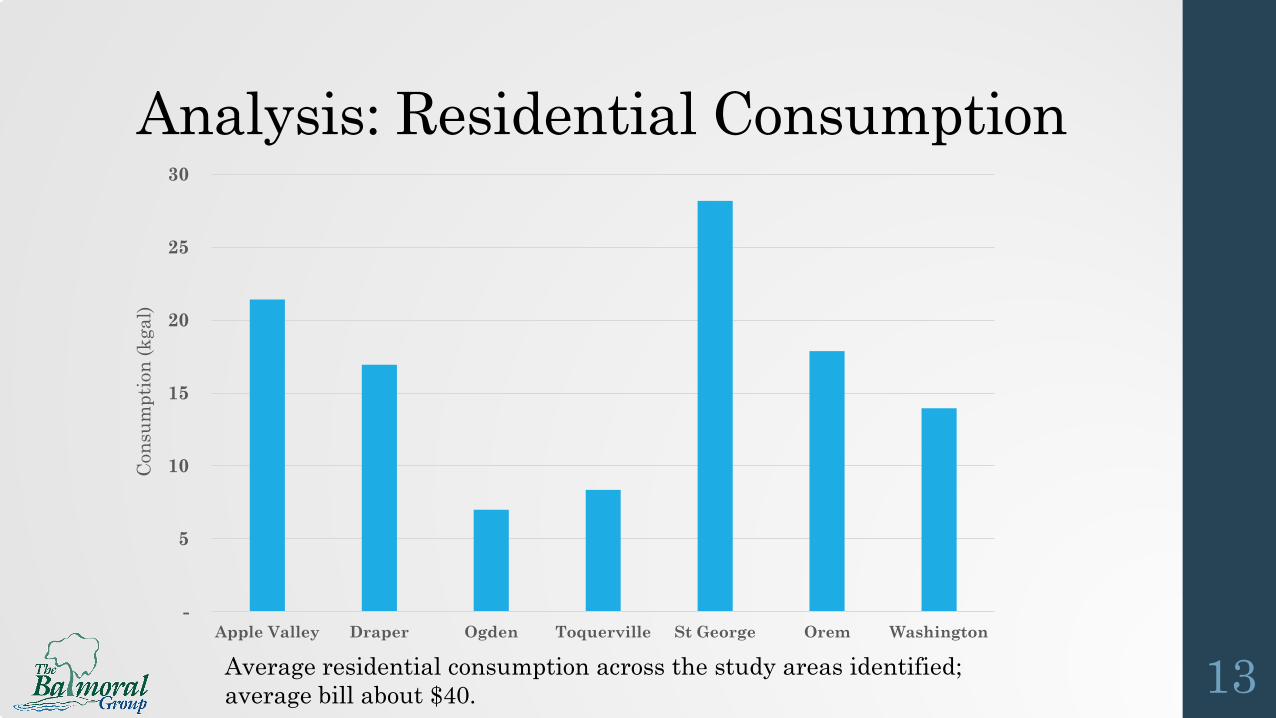
Analysis: Residential Consumption
13Average residential consumption across the study areas identified; average bill about $40.
-
5
10
15
20
25
30
Apple Valley Draper Ogden Toquerville St George Orem Washington
Cons
umpt
ion
(kga
l)
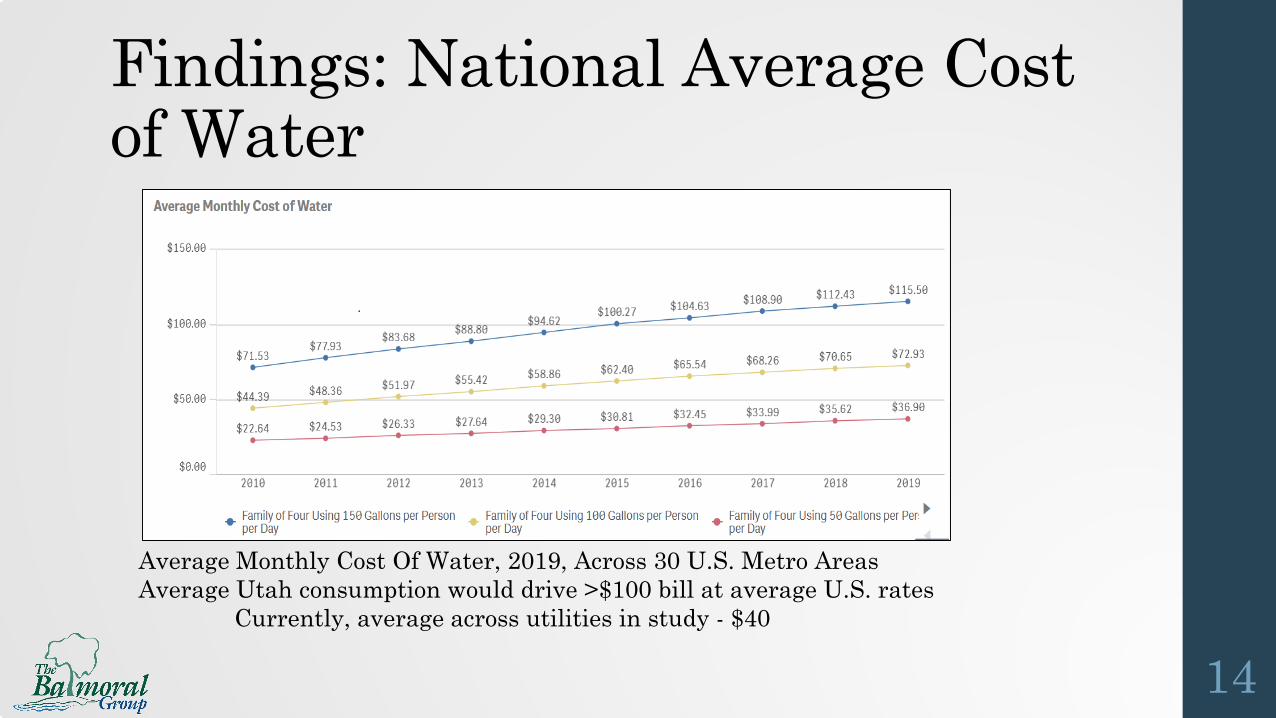
Average Monthly Cost Of Water, 2019, Across 30 U.S. Metro AreasAverage Utah consumption would drive >$100 bill at average U.S. rates
Currently, average across utilities in study - $40
Findings: National Average Cost of Water
14
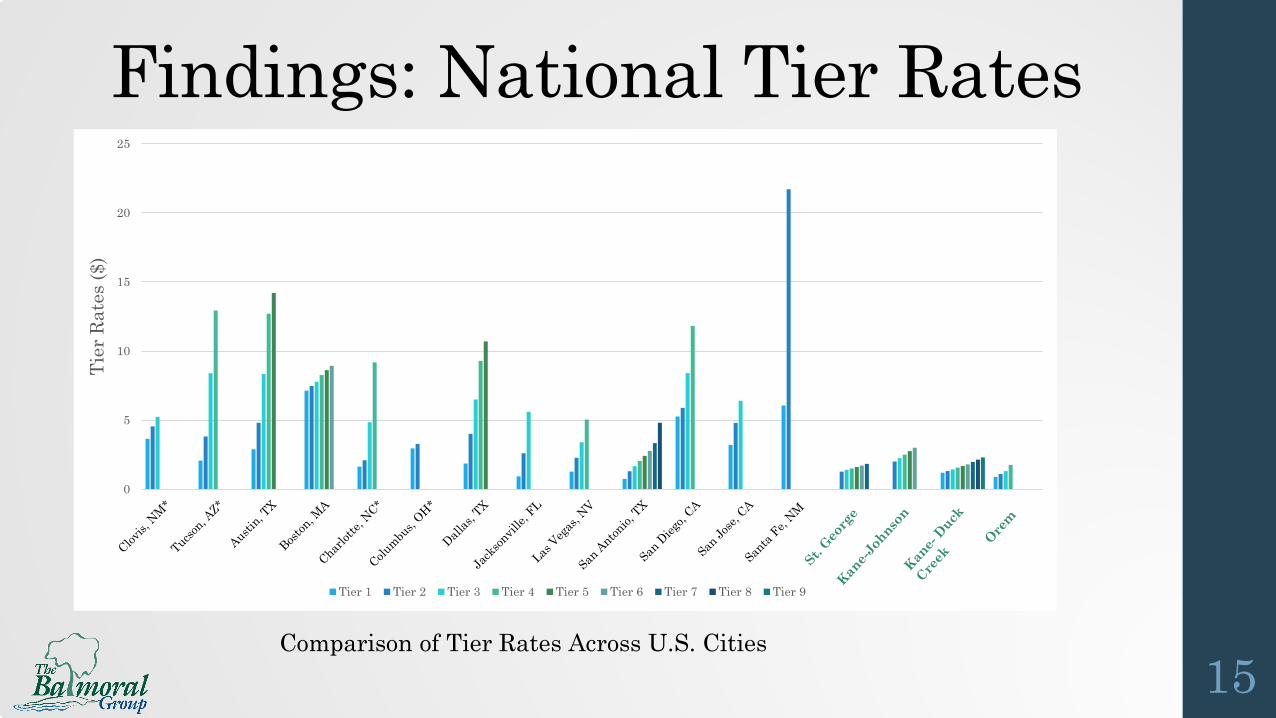
Findings: National Tier Rates
15Comparison of Tier Rates Across U.S. Cities
0
5
10
15
20
25
Tier
Rat
es ($
)
Tier 1 Tier 2 Tier 3 Tier 4 Tier 5 Tier 6 Tier 7 Tier 8 Tier 9
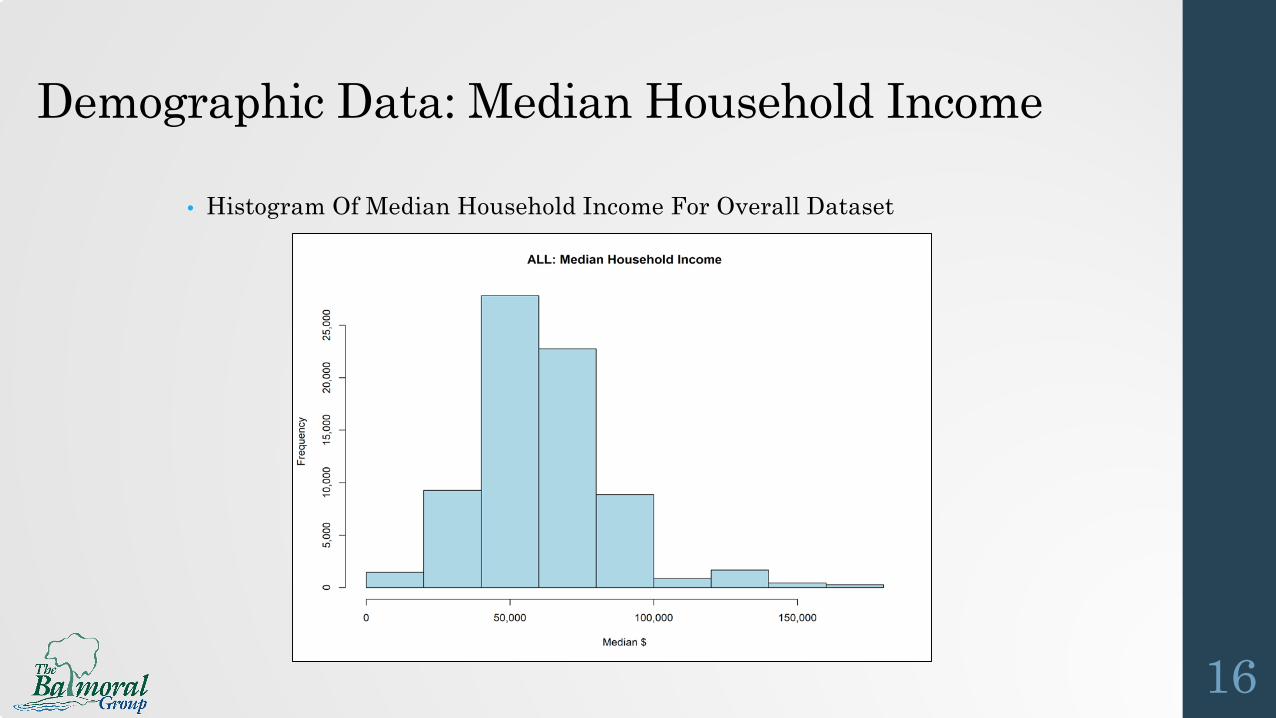
Demographic Data: Median Household Income
16
• Histogram Of Median Household Income For Overall Dataset
• Data requested from 24 utilities; received from 11• Key Points:
1)Rates – Impact Fee Schedules have changed increased only slightly, if at all, in the last 6-7 years at the utility level(St. George reduced its rates in 2012)
2)Counts – Community impact fee receipts are driven by existing population (and intrinsic rates of growth). St. George exhibited the greatest fees collections by count.
3)Receipts – Because of higher fee schedules, Park City and Orem compete with St. George in terms of total impact fee receipts
Part 2: Impact Fee Data Analysis
17
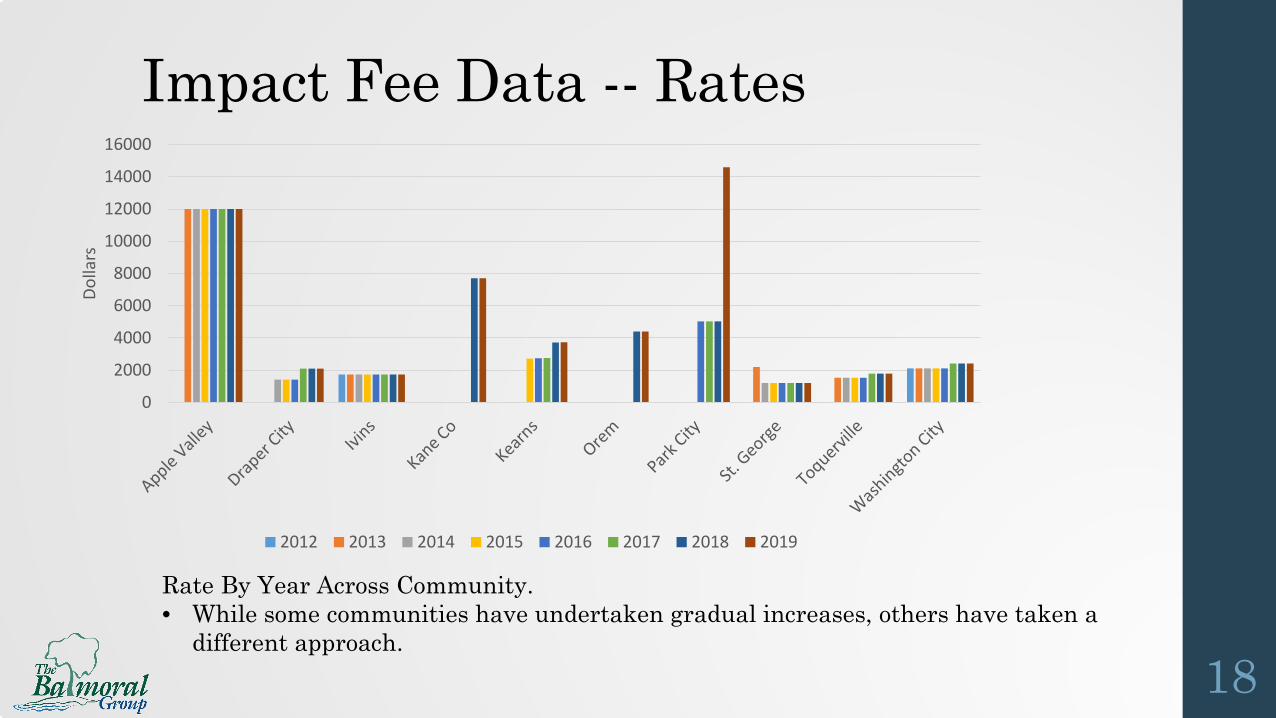
Rate By Year Across Community. • While some communities have undertaken gradual increases, others have taken a
different approach. 18
Impact Fee Data -- Rates
0
2000
4000
6000
8000
10000
12000
14000
16000
Dolla
rs
2012 2013 2014 2015 2016 2017 2018 2019
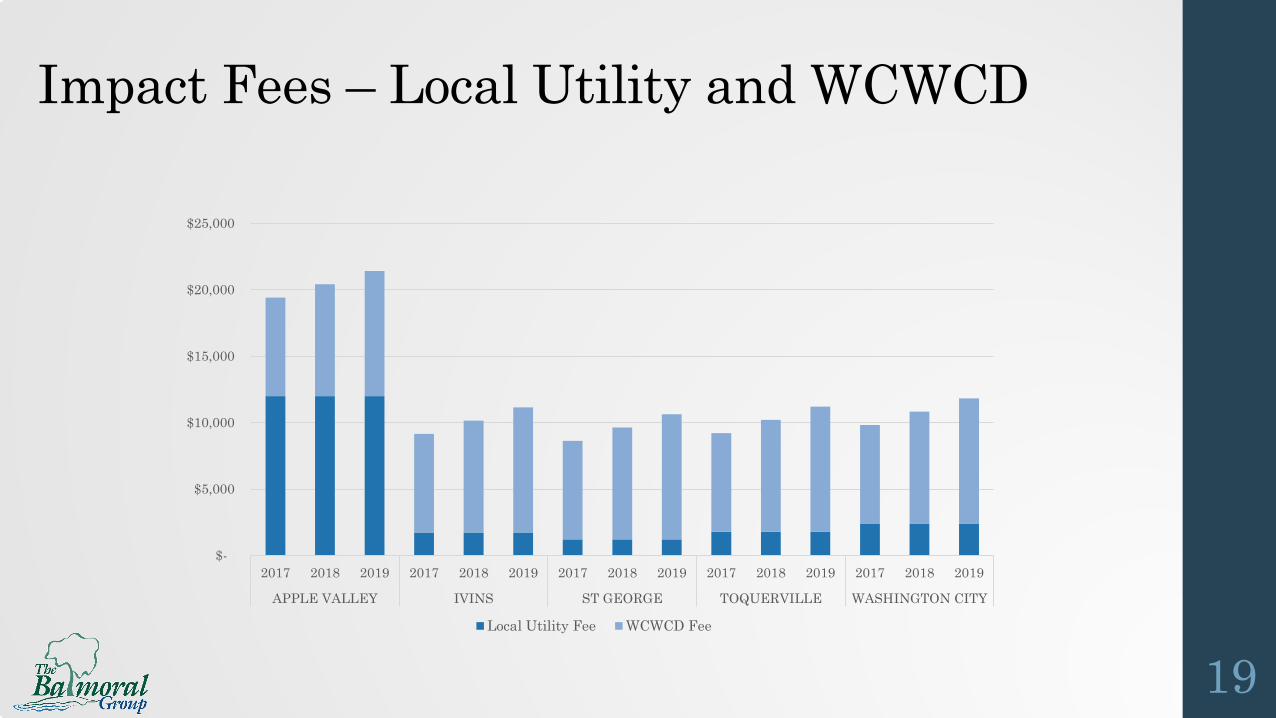
Impact Fees – Local Utility and WCWCD
19
$-
$5,000
$10,000
$15,000
$20,000
$25,000
2017 2018 2019 2017 2018 2019 2017 2018 2019 2017 2018 2019 2017 2018 2019
APPLE VALLEY IVINS ST GEORGE TOQUERVILLE WASHINGTON CITY
Local Utility Fee WCWCD Fee
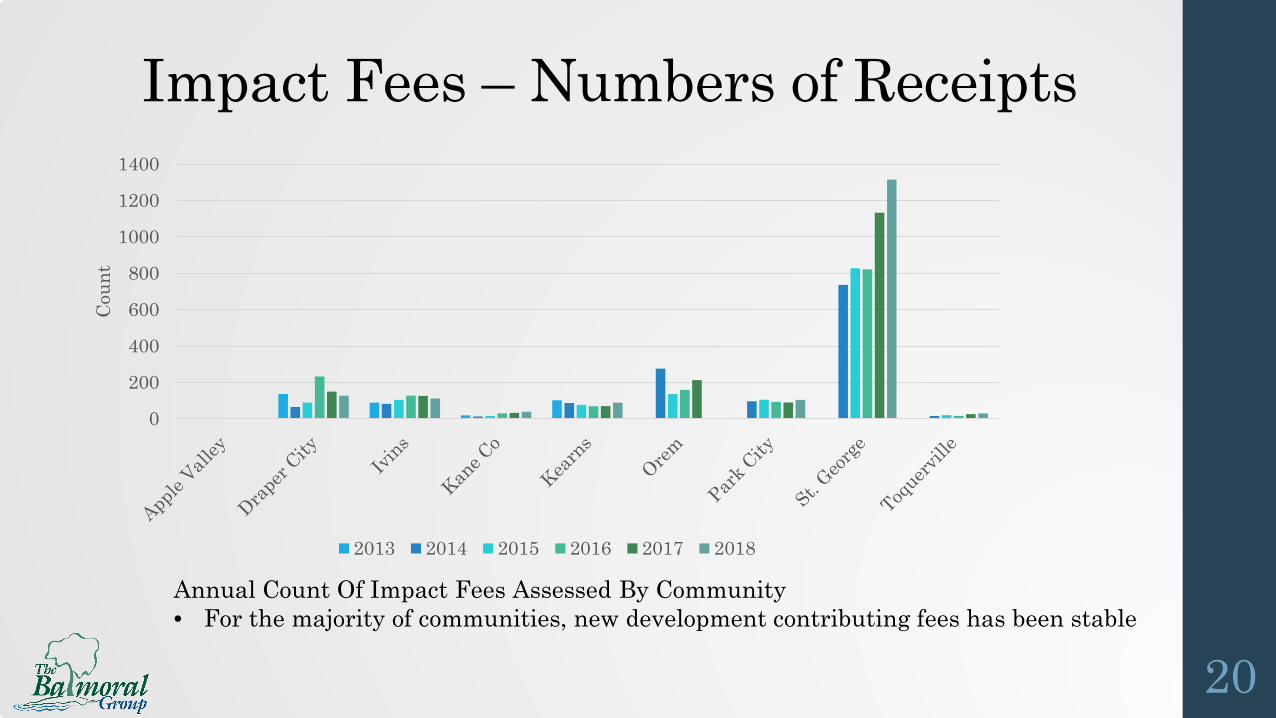
Annual Count Of Impact Fees Assessed By Community• For the majority of communities, new development contributing fees has been stable
20
Impact Fees – Numbers of Receipts
0
200
400
600
800
1000
1200
1400
Coun
t
2013 2014 2015 2016 2017 2018
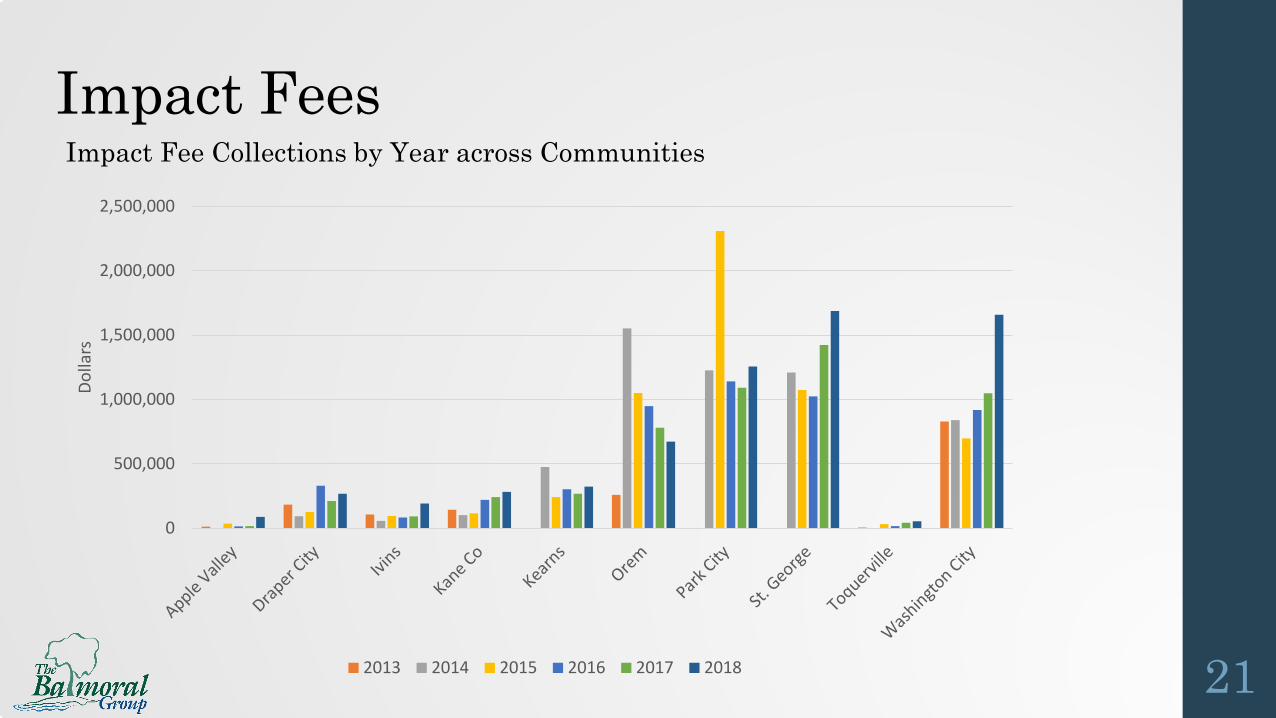
Impact Fee Collections by Year across CommunitiesImpact Fees
21
0
500,000
1,000,000
1,500,000
2,000,000
2,500,000
Dolla
rs
2013 2014 2015 2016 2017 2018
Part 3: Preliminary Model and Results• Price & Income Elasticity
• Early model runs appear to support regression modeling at household level with existing data Ordinary Least Squares (OLS) model appears feasible as
starting point to estimate price and income elasticity1
More sophisticated models also being tested to isolate effects of pricing tiers Instrumental Variables (IV) Model to address endogeneity of
price under block rate structure
22
1 C
hang
et a
l., 2
017;
Rot
hfed
er, 2
014;
Yoo
et a
l., 2
014;
H
anse
n &
Nar
ayan
an, 1
981;
Cen
tral
Uta
h W
ater
C
onse
rvan
cy D
istr
ict,
1995
; Dal
huis
en e
t al.,
200
3
Early Results: Elasticity of Water Demand• Early overall results indicate that, on average, the average rate of
the tiers observed by household per month appears to have a significant, negative relationship with consumption As rates increases, consumption decreases, consistent with literature
• Early regression results show that, as median household income increases, consumption decreases at a decreasing rate. This finding is generally accepted due to a higher level of income being associated
with higher living standards, and therefore, higher water demand
• Overall results show inverse relationship between education and consumption, but results across utilities show differences in this effect. Mixed results, also consistent with literature
23
Early Results: Effects of Impact fees on rate of development
• Preliminary model (OLS) results suggest a statistically significant and negative relationship between the Percent change in impact fees and the number of collections (i.e. newly approved development) the following year.
Somewhat counter to expectations, but early results
• Additional testing is underway to assess whether there are significant differences among the 11 communities with respect to the numbers of impact fees collected and the rates themselves.
24
Next Steps
• Price & Income Elasticity of Water Demand Finalize model selection and analysis
Milestone date: September 20 for draft results
• Effect of Impact Fees on Rates of Development Finalize model, analysis and inference
Milestone date: September 20
25

Questions…
26
Thank you!
Valerie SeidelPresidentThe Balmoral Group165 Lincoln AvenueWinter Park, FL 32789
Phone: 407-629-2185 x104Email: [email protected]
www.balmoralgroup.us


