
Content Includes:
Importance of Co-Investments
The majority of GPs believe offering co-investments is important for fundraising success.
Offering Co-Investments
More than two-thirds of GPs surveyed currently offer co-investment rights.
Current Activity
Over half of LPs that currently have open co-investment positions have more than five.
Performance of Co-Investments
Co-investments have largely outperformed fund commitments for LPs.
Co-Investment Discounts
Most GPs offer reduced management fees and carried interest on co-investments.
Future Plans
Both GPs and LPs expect co-investment activity to remain strong.
Preqin Special Report: Private Equity Co-Investment Outlook
November 2015
alternative assets. intelligent data.
2 © 2015 Preqin Ltd. / www.preqin.com
Preqin Special Report: Private Equity Co-Investment Outlook
Download the data pack:www.preqin.com/CoInv15
All rights reserved. The entire contents of Preqin Special Report: Co-Investment Outlook, November 2015 are the Copyright of Preqin Ltd. No part of this publication or any information contained in it may be copied, transmitted by any electronic means, or stored in any electronic or other data storage medium, or printed or published in any document, report or publication, without the express prior written approval of Preqin Ltd. The information presented in Preqin Special Report: Co-Investment Outlook, November 2015 is for information purposes only and does not constitute and should not be construed as a solicitation or other offer, or recommendation to acquire or dispose of any investment or to engage in any other transac-tion, or as advice of any nature whatsoever. If the reader seeks advice rather than information then he should seek an independent fi nancial advisor and hereby agrees that he will not hold Preqin Ltd. responsible in law or equity for any decisions of whatever nature the reader makes or refrains from making following its use of Preqin Special Report: Co-Investment Outlook, November 2015. While reasonable efforts have been made to obtain information from sources that are believed to be accurate, and to confi rm the accuracy of such information wherever possible, Preqin Ltd. does not make any representation or warranty that the information or opinions contained in Preqin Special Report: Co-Investment Outlook, November 2015 are accurate, reliable, up-to-date or complete. Although every reasonable effort has been made to ensure the accuracy of this publication Preqin Ltd. does not accept any responsibility for any errors or omissions within Preqin Special Report: Co-Investment Outlook, November 2015 or for any expense or other loss alleged to have arisen in any way with a reader’s use of this publication.
As private equity continues to grow as an asset class, investment structures and relationships between fund managers and investors have had to evolve and adapt. LPs’ approaches to private equity are becoming more sophisticated as their knowledge of the asset class increases, and many now frequently seek out alternative opportunities to fund investing in order to both diversify their portfolios and maximize returns. As a result, growing numbers of LPs consider co-investments an important part of their overall private equity portfolios. Direct investments, whereby LPs are co-investing alongside GPs, have increasingly become part of private equity discourse, with signifi cant interest arising from both sides. In the last year or so, Preqin has noted an increase in appetite for information relating to co-investments with a high number of incoming enquiries requesting greater insight on the subject.
In order to fi nd out more about this growing area of the asset class, we have surveyed 320 active GPs and 222 active LPs about co-investments and have examined the results to better understand the changing levels of co-investment participation among fund managers and investors, and to fi nd out their views on the perceived risks and attractions.
Half of the 222 LPs that we surveyed are either actively or opportunistically co-investing at present. Furthermore, most LPs are looking to either increase or maintain their exposure to co-investments in the future, with a number of LPs aiming to make more co-investments and to commit more capital to these types of opportunities. Similarly, GPs are recognizing how important co-investment rights are becoming to LPs; our GP survey found that most managers feel offering co-investment rights is important during fundraising (page 4). In fact, 30% of GP respondents also stated that 81-100% of LPs in their latest funds have co-investment rights included in their LPAs.
The main motivation for LPs to seek out co-investments is the prospect of greater returns and lower fees. Most LPs actively co-investing reported that their co-investments have delivered superior returns to their private equity fund commitments, with 46% stating that their past co-investments have outperformed fund investments by more than 5%, in contrast to just 3% of LPs witnessing any underperformance. The majority of GPs also reported that they charge lower management fees and carried interest on co-investment arrangements, or charge no fees at all.
Our survey suggests more and more LPs are set to seek out opportunities to make co-investments. With the fundraising environment becoming increasingly competitive and record numbers of funds in market, it is also likely that GPs will be looking to more readily offer benefi ts such as co-investment rights in order to improve their chance of a successful fundraise.
To fi nd out more about Preqin’s suite of private equity products, or for more information on co-investments, please do not hesitate to contact us at [email protected] or at our New York, London, Singapore, San Francisco or Hong Kong offi ces.
Contents
Breakdown of Survey Respondents 3
GP Perception of Co-Investments 4
GP Co-Investment Activity 5
LP Relationship 7
LP Co-Investment Activity 9
Performance of Co-Investments 11
LP Co-Investment Preferences 12
GP Relationship 14
GP and LP Co-Investment Future Plans 15
Foreword
Preqin Special Report: Private Equity Co-Investment Outlook
Download the data pack:www.preqin.com/CoInv15
3 © 2015 Preqin Ltd. / www.preqin.com
Breakdown of Survey Respondents
18%
11%
7%
27%
12%
24%Less than $250mn
$250-499mn
$500-999mn
$1-4.9bn
$5-9.9bn
More than $10bn
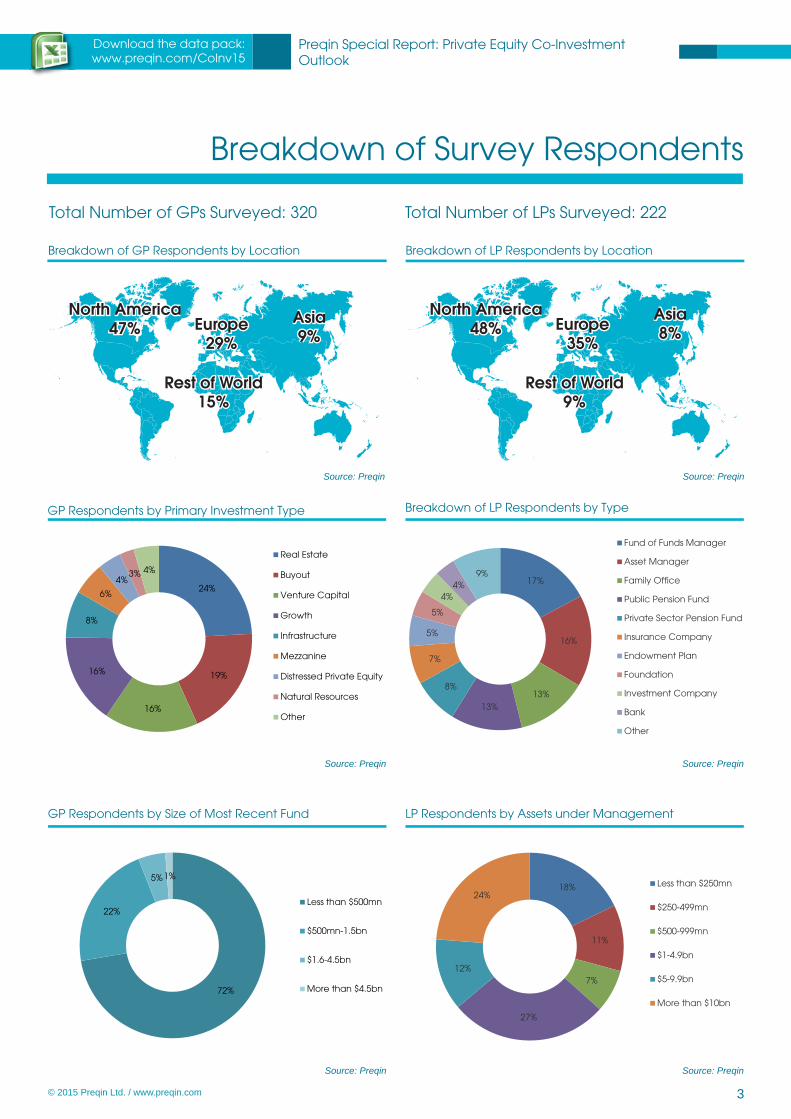
LP Respondents by Assets under Management
Source: Preqin
72%
22%
5%1%
Less than $500mn
$500mn-1.5bn
$1.6-4.5bn
More than $4.5bn
GP Respondents by Size of Most Recent Fund
Source: Preqin
17%
16%
13%13%
8%
7%
5%
5%
4%4%
9%
Fund of Funds Manager
Asset Manager
Family Office
Public Pension Fund
Private Sector Pension Fund
Insurance Company
Endowment Plan
Foundation
Investment Company
Bank
Other
Breakdown of LP Respondents by Type
Source: Preqin
24%
19%
16%
16%
8%
6%
4%3% 4%
Real Estate
Buyout
Venture Capital
Growth
Infrastructure
Mezzanine
Distressed Private Equity
Natural Resources
Other
GP Respondents by Primary Investment Type
Source: Preqin
Breakdown of GP Respondents by Location
Source: Preqin
Breakdown of LP Respondents by Location
Source: Preqin
North AmericaNorth America47%47%
Rest of WorldRest of World15%15%
EuropeEurope29%29%
AsiaAsia9%9%
North AmericaNorth America48%48%
Rest of WorldRest of World9%9%
EuropeEurope35%35%
AsiaAsia8%8%
Total Number of GPs Surveyed: 320 Total Number of LPs Surveyed: 222
4 © 2015 Preqin Ltd. / www.preqin.com
Preqin Special Report: Private Equity Co-Investment Outlook
Download the data pack:www.preqin.com/CoInv15
GP Perception of Co-Investments
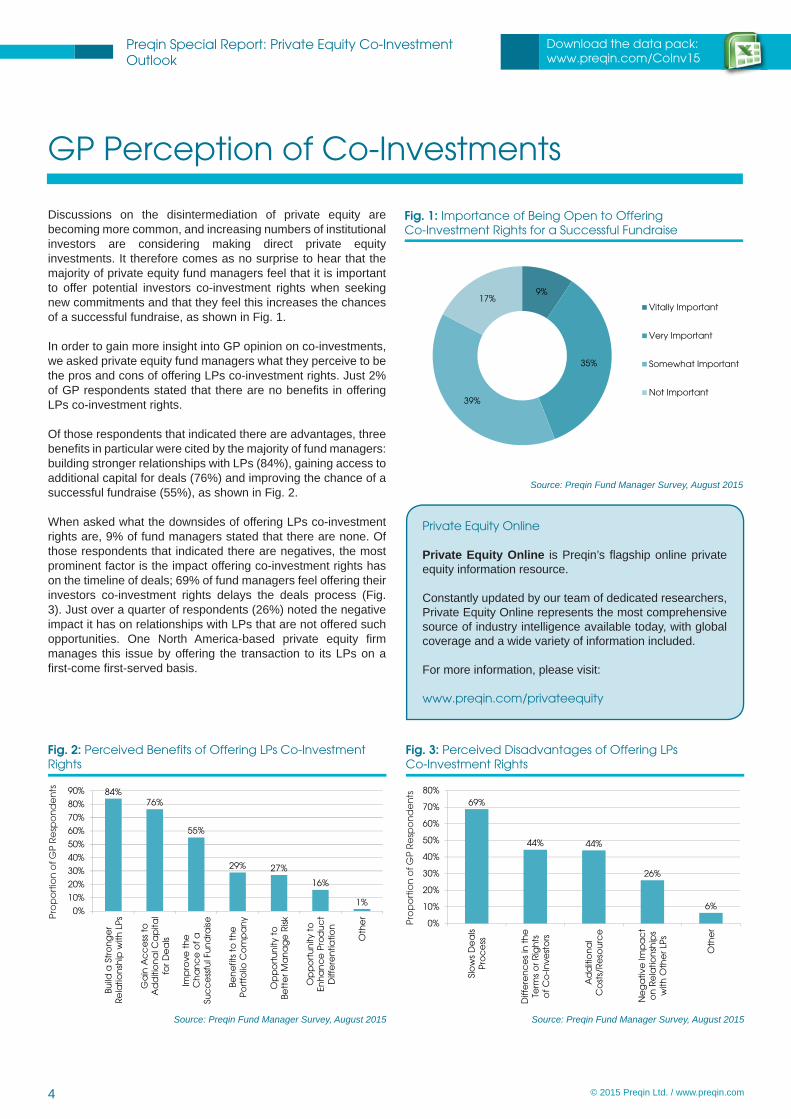
Discussions on the disintermediation of private equity are becoming more common, and increasing numbers of institutional investors are considering making direct private equity investments. It therefore comes as no surprise to hear that the majority of private equity fund managers feel that it is important to offer potential investors co-investment rights when seeking new commitments and that they feel this increases the chances of a successful fundraise, as shown in Fig. 1.
In order to gain more insight into GP opinion on co-investments, we asked private equity fund managers what they perceive to be the pros and cons of offering LPs co-investment rights. Just 2% of GP respondents stated that there are no benefi ts in offering LPs co-investment rights.
Of those respondents that indicated there are advantages, three benefi ts in particular were cited by the majority of fund managers: building stronger relationships with LPs (84%), gaining access to additional capital for deals (76%) and improving the chance of a successful fundraise (55%), as shown in Fig. 2.
When asked what the downsides of offering LPs co-investment rights are, 9% of fund managers stated that there are none. Of those respondents that indicated there are negatives, the most prominent factor is the impact offering co-investment rights has on the timeline of deals; 69% of fund managers feel offering their investors co-investment rights delays the deals process (Fig. 3). Just over a quarter of respondents (26%) noted the negative impact it has on relationships with LPs that are not offered such opportunities. One North America-based private equity fi rm manages this issue by offering the transaction to its LPs on a fi rst-come fi rst-served basis.
9%
35%
39%
17%Vitally Important
Very Important
Somewhat Important
Not Important
Fig. 1: Importance of Being Open to Offering Co-Investment Rights for a Successful Fundraise
Source: Preqin Fund Manager Survey, August 2015
69%
44% 44%
26%
6%
0%
10%
20%
30%
40%
50%
60%
70%
80%
Slo
ws
De
als
Pro
ce
ss
Diff
ere
nc
es
in t
he
Term
s o
r Rig
hts
of
Co
-Inve
sto
rs
Ad
diti
on
al
Co
sts/
Re
sou
rce
Ne
ga
tive
Imp
ac
to
n R
ela
tion
ship
sw
ith O
the
r LP
s
Oth
er
Fig. 3: Perceived Disadvantages of Offering LPs Co-Investment Rights
Source: Preqin Fund Manager Survey, August 2015
Pro
po
rtio
n o
f GP
Re
spo
nd
en
ts84%76%
55%
29% 27%
16%
1%0%
10%
20%
30%
40%
50%
60%
70%
80%
90%
Build
a S
tro
ng
er
Re
latio
nsh
ip w
ith L
Ps
Ga
in A
cc
ess
to
Ad
diti
on
al C
ap
ital
for
De
als
Imp
rove
th
eC
ha
nc
e o
f a
Suc
ce
ssfu
l Fu
nd
rais
e
Ben
efit
s to
th
eP
ort
folio
Co
mp
an
y
Op
po
rtu
nity
to
Bett
er M
an
ag
e R
isk
Op
po
rtu
nity
to
Enh
an
ce
Pro
du
ct
Diff
ere
ntia
tion
Oth
er
Fig. 2: Perceived Benefits of Offering LPs Co-Investment Rights
Source: Preqin Fund Manager Survey, August 2015
Pro
po
rtio
n o
f GP
Re
spo
nd
en
ts
Private Equity Online
Private Equity Online is Preqin’s fl agship online private equity information resource.
Constantly updated by our team of dedicated researchers, Private Equity Online represents the most comprehensive source of industry intelligence available today, with global coverage and a wide variety of information included.
For more information, please visit:
www.preqin.com/privateequity
Preqin Special Report: Private Equity Co-Investment Outlook
Download the data pack:www.preqin.com/CoInv15
5 © 2015 Preqin Ltd. / www.preqin.com
GP Co-Investment Activity
GP Offerings
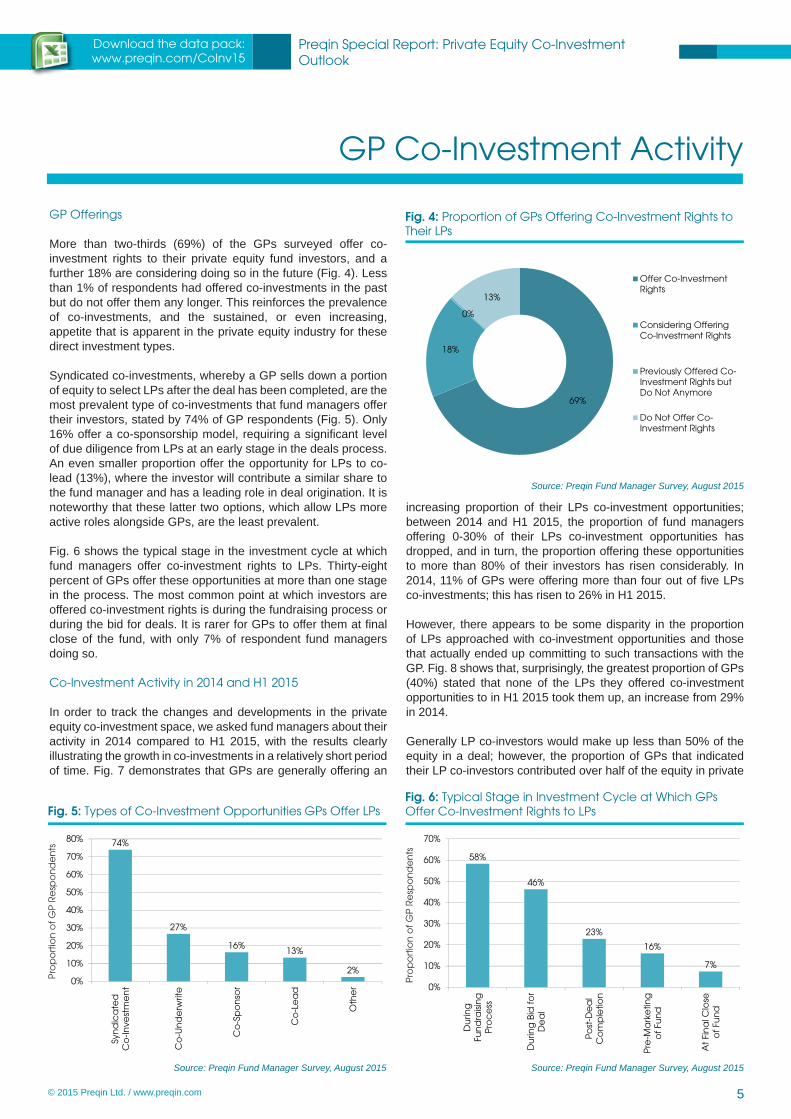
More than two-thirds (69%) of the GPs surveyed offer co-investment rights to their private equity fund investors, and a further 18% are considering doing so in the future (Fig. 4). Less than 1% of respondents had offered co-investments in the past but do not offer them any longer. This reinforces the prevalence of co-investments, and the sustained, or even increasing, appetite that is apparent in the private equity industry for these direct investment types.
Syndicated co-investments, whereby a GP sells down a portion of equity to select LPs after the deal has been completed, are the most prevalent type of co-investments that fund managers offer their investors, stated by 74% of GP respondents (Fig. 5). Only 16% offer a co-sponsorship model, requiring a signifi cant level of due diligence from LPs at an early stage in the deals process. An even smaller proportion offer the opportunity for LPs to co-lead (13%), where the investor will contribute a similar share to the fund manager and has a leading role in deal origination. It is noteworthy that these latter two options, which allow LPs more active roles alongside GPs, are the least prevalent.
Fig. 6 shows the typical stage in the investment cycle at which fund managers offer co-investment rights to LPs. Thirty-eight percent of GPs offer these opportunities at more than one stage in the process. The most common point at which investors are offered co-investment rights is during the fundraising process or during the bid for deals. It is rarer for GPs to offer them at fi nal close of the fund, with only 7% of respondent fund managers doing so.
Co-Investment Activity in 2014 and H1 2015
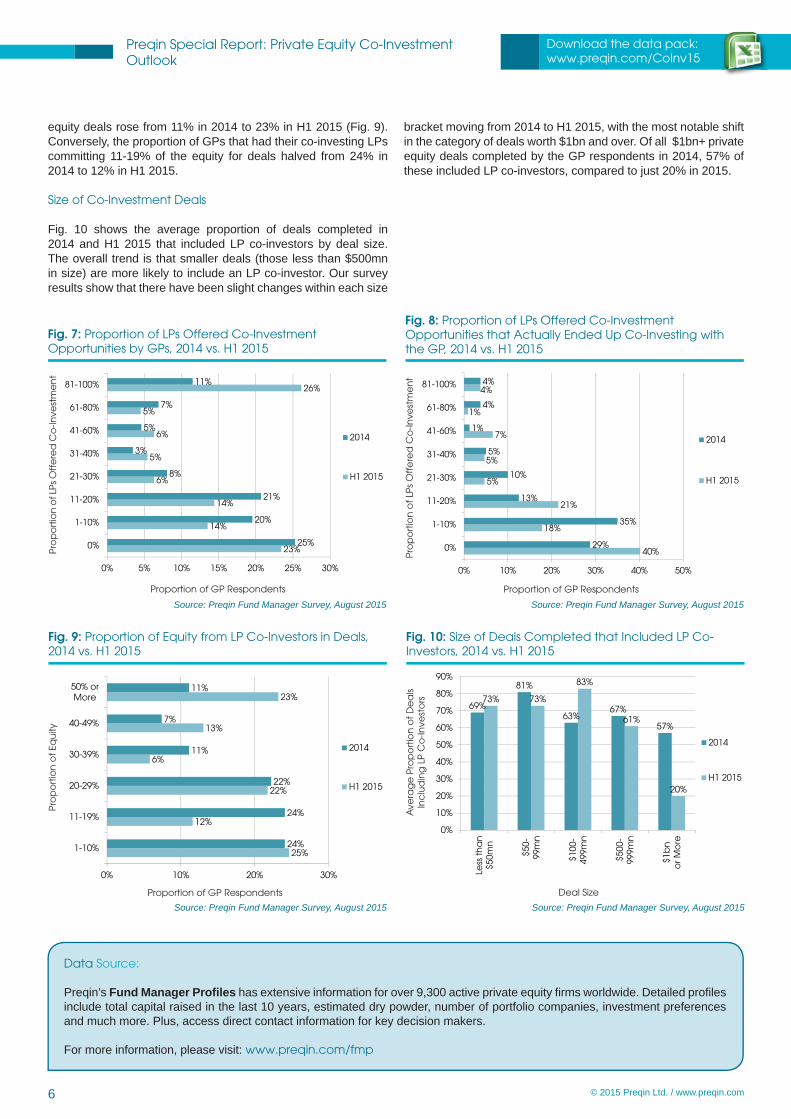
In order to track the changes and developments in the private equity co-investment space, we asked fund managers about their activity in 2014 compared to H1 2015, with the results clearly illustrating the growth in co-investments in a relatively short period of time. Fig. 7 demonstrates that GPs are generally offering an
increasing proportion of their LPs co-investment opportunities; between 2014 and H1 2015, the proportion of fund managers offering 0-30% of their LPs co-investment opportunities has dropped, and in turn, the proportion offering these opportunities to more than 80% of their investors has risen considerably. In 2014, 11% of GPs were offering more than four out of fi ve LPs co-investments; this has risen to 26% in H1 2015.
However, there appears to be some disparity in the proportion of LPs approached with co-investment opportunities and those that actually ended up committing to such transactions with the GP. Fig. 8 shows that, surprisingly, the greatest proportion of GPs (40%) stated that none of the LPs they offered co-investment opportunities to in H1 2015 took them up, an increase from 29% in 2014.
Generally LP co-investors would make up less than 50% of the equity in a deal; however, the proportion of GPs that indicated their LP co-investors contributed over half of the equity in private
69%
18%
0%
13%
Offer Co-InvestmentRights
Considering OfferingCo-Investment Rights
Previously Offered Co-Investment Rights butDo Not Anymore
Do Not Offer Co-Investment Rights
Fig. 4: Proportion of GPs Offering Co-Investment Rights to Their LPs
Source: Preqin Fund Manager Survey, August 2015
58%
46%
23%
16%
7%
0%
10%
20%
30%
40%
50%
60%
70%
Du
ring
Fun
dra
isin
gP
roc
ess
Du
ring
Bid
fo
rD
ea
l
Po
st-D
ea
lC
om
ple
tion
Pre
-Ma
rke
ting
of
Fun
d
At
Fin
al C
lose
of
Fun
d
Fig. 6: Typical Stage in Investment Cycle at Which GPs Offer Co-Investment Rights to LPs
Source: Preqin Fund Manager Survey, August 2015
Pro
po
rtio
n o
f G
P R
esp
on
de
nts
74%
27%
16%13%
2%0%
10%
20%
30%
40%
50%
60%
70%
80%
Syn
dic
ate
dC
o-In
vest
me
nt
Co
-Un
de
rwrit
e
Co
-Sp
on
sor
Co
-Le
ad
Oth
er
Fig. 5: Types of Co-Investment Opportunities GPs Offer LPs
Source: Preqin Fund Manager Survey, August 2015
Pro
po
rtio
n o
f G
P R
esp
on
de
nts
6 © 2015 Preqin Ltd. / www.preqin.com
Preqin Special Report: Private Equity Co-Investment Outlook
Download the data pack:www.preqin.com/CoInv15
40%
18%
21%
5%
5%
7%
1%
4%
29%
35%
13%
10%
5%
1%
4%
4%
0% 10% 20% 30% 40% 50%
0%
1-10%
11-20%
21-30%
31-40%
41-60%
61-80%
81-100%
2014
H1 2015
Fig. 8: Proportion of LPs Offered Co-Investment Opportunities that Actually Ended Up Co-Investing with the GP, 2014 vs. H1 2015
Source: Preqin Fund Manager Survey, August 2015Proportion of GP Respondents
Pro
po
rtio
n o
f LP
s O
ffe
red
Co
-Inve
stm
en
t
25%
12%
22%
6%
13%
23%
24%
24%
22%
11%
7%
11%
0% 10% 20% 30%
1-10%
11-19%
20-29%
30-39%
40-49%
50% orMore
2014
H1 2015
Fig. 9: Proportion of Equity from LP Co-Investors in Deals, 2014 vs. H1 2015
Source: Preqin Fund Manager Survey, August 2015Proportion of GP Respondents
Pro
po
rtio
n o
f Eq
uity
69%
81%
63%67%
57%
73% 73%
83%
61%
20%
0%
10%
20%
30%
40%
50%
60%
70%
80%
90%
Less
th
an
$50m
n
$50-
99m
n
$100
-49
9mn
$500
-99
9mn
$1b
no
r Mo
re
2014
H1 2015
Fig. 10: Size of Deals Completed that Included LP Co-Investors, 2014 vs. H1 2015
Source: Preqin Fund Manager Survey, August 2015Deal Size
Ave
rag
e P
rop
ort
ion
of
De
als
Inc
lud
ing
LP
Co
-Inve
sto
rs
23%
14%
14%
6%
5%
6%
5%
26%
25%
20%
21%
8%
3%
5%
7%
11%
0% 5% 10% 15% 20% 25% 30%
0%
1-10%
11-20%
21-30%
31-40%
41-60%
61-80%
81-100%
2014
H1 2015
Fig. 7: Proportion of LPs Offered Co-Investment Opportunities by GPs, 2014 vs. H1 2015
Source: Preqin Fund Manager Survey, August 2015
Proportion of GP Respondents
Pro
po
rtio
n o
f LP
s O
ffe
red
Co
-Inve
stm
en
t
equity deals rose from 11% in 2014 to 23% in H1 2015 (Fig. 9). Conversely, the proportion of GPs that had their co-investing LPs committing 11-19% of the equity for deals halved from 24% in 2014 to 12% in H1 2015.
Size of Co-Investment Deals
Fig. 10 shows the average proportion of deals completed in 2014 and H1 2015 that included LP co-investors by deal size. The overall trend is that smaller deals (those less than $500mn in size) are more likely to include an LP co-investor. Our survey results show that there have been slight changes within each size
bracket moving from 2014 to H1 2015, with the most notable shift in the category of deals worth $1bn and over. Of all $1bn+ private equity deals completed by the GP respondents in 2014, 57% of these included LP co-investors, compared to just 20% in 2015.
Data Source:
Preqin’s Fund Manager Profi les has extensive information for over 9,300 active private equity fi rms worldwide. Detailed profi les include total capital raised in the last 10 years, estimated dry powder, number of portfolio companies, investment preferences and much more. Plus, access direct contact information for key decision makers.
For more information, please visit: www.preqin.com/fmp

Preqin Special Report: Private Equity Co-Investment Outlook
Download the data pack:www.preqin.com/CoInv15
7 © 2015 Preqin Ltd. / www.preqin.com
LP Relationship
Preqin’s survey results highlighted the differing experiences GPs have when co-investing with LPs. For example, the largest proportion (45%) of fund managers stated that the additional capital co-invested by their LPs typically equates to 1-20% of the LP’s original fund commitment (Fig. 11). However, for 9% of GP respondents, the additional capital equated to 100% or more of their LPs’ original fund commitments.
There can be a number of prerequisites for investors when qualifying for co-investment rights. Over half (53%) of fund managers indicated that the speed at which the LP can evaluate and agree to co-investment is of high importance (Fig. 12). The competitive bidding process and the fact that several co-investors may be waiting on one another’s decisions means that there is some pressure on timing, with GPs often looking for a verbal commitment from LPs within as little as two to three weeks.
The size of fund commitments is of relative signifi cance, highlighted by two in fi ve GPs, while 35% of fund managers have
requirements relating to LP reliability and 33% call for previous expression of interest in order to qualify for co-investment rights. Twenty-six percent of fund managers have no requirements at all and will offer co-investment opportunities to all LPs.
Despite the widely reported appetite for co-investment in today’s private equity industry, GPs are fi nding that only a certain proportion of their LPs are actually requesting rights to invest alongside them. The largest share of respondents (41%) stated that only up to 20% of LPs in their most recent fund requested co-investment rights (Fig. 13). On the other hand, 11% of GPs surveyed had over 80% of their most recent LPs do so.
The LPA outlines a number of key provisions in a private equity fund and it is not uncommon for these legal documents to contain clauses on co-investment rights. The largest proportion of fund managers (30%) stated that 81-100% of LPs in their most recent fund had co-investment rights included in their LPA, as shown in Fig. 14.
53%
40%35% 33%
29%26%
3%
0%
10%
20%
30%
40%
50%
60%
Spe
ed
at
Wh
ich
LP C
an
De
cid
eo
n C
o-In
vest
me
nt
Size
of
Fun
dC
om
mitm
en
t
LP R
elia
bili
ty
Pre
vio
us
Exp
ress
ion
of
Inte
rest
inC
o-In
vest
me
nts
LP B
ite-S
ize
Re
qu
irem
en
ts
No
Re
qu
irem
en
ts,
Off
ere
d t
o A
ll LP
s
Oth
er
Fig. 12: Requirements for Investors to Qualify for Co-Investment Rights
Source: Preqin Fund Manager Survey, August 2015
Pro
po
rtio
n o
f GP
Re
spo
nd
en
ts
21%
14%
15%8%
2%
9%
1%
30%
0%
1-10%
11-20%
21-30%
31-40%
41-60%
61-80%
81-100%
Fig. 14: Proportion of LPs in Most Recent Fund to Have Co-Investment Rights Included in LPAs
Source: Preqin Fund Manager Survey, August 2015
41%
24%
20%
3%
11%0-20%
21-40%
41-60%
61-80%
More than 80%
Fig. 13: Proportion of LPs in Most Recent Fund to Request Co-Investment Rights
Source: Preqin Fund Manager Survey, August 2015
45%
20%
15%
4%
6%
9%
1-20% of FundCommitment
21-40% of FundCommitment
41-60% of FundCommitment
61-80% of FundCommitment
81-100% of FundCommitment
More than 100% ofFund Commitment
Fig. 11: GPs’ Observations of Additional Capital Typically Co-Invested Alongside Fund Commitments by Their LPs
Source: Preqin Fund Manager Survey, August 2015

The 2015 Preqin Private Equity Fund Terms Advisor is the ultimate guide to private equity fund terms and conditions, featuring analysis based on over 4,500 funds – more than ever before!
• Identify typical terms and benchmark funds to see how terms compare to the market• View actual terms and conditions data for over 2,500 funds• Download data to conduct your own analysis• Model the real economic impact of various terms• Review data and analysis on the actual fees and costs incurred by LPs
Every purchase of the 2015 Preqin Private Equity Fund Terms Advisor includes a free 12-month subscription to Preqin’s Fund Terms Advisor online service.
For more information, please visit:
www.preqin.com/fta
2015 PREQIN PRIVATE EQUITY FUND TERMS ADVISOR
alternative assets. intelligent data.
Preqin Special Report: Private Equity Co-Investment Outlook
Download the data pack:www.preqin.com/CoInv15
9 © 2015 Preqin Ltd. / www.preqin.com
LP Co-Investment Activity
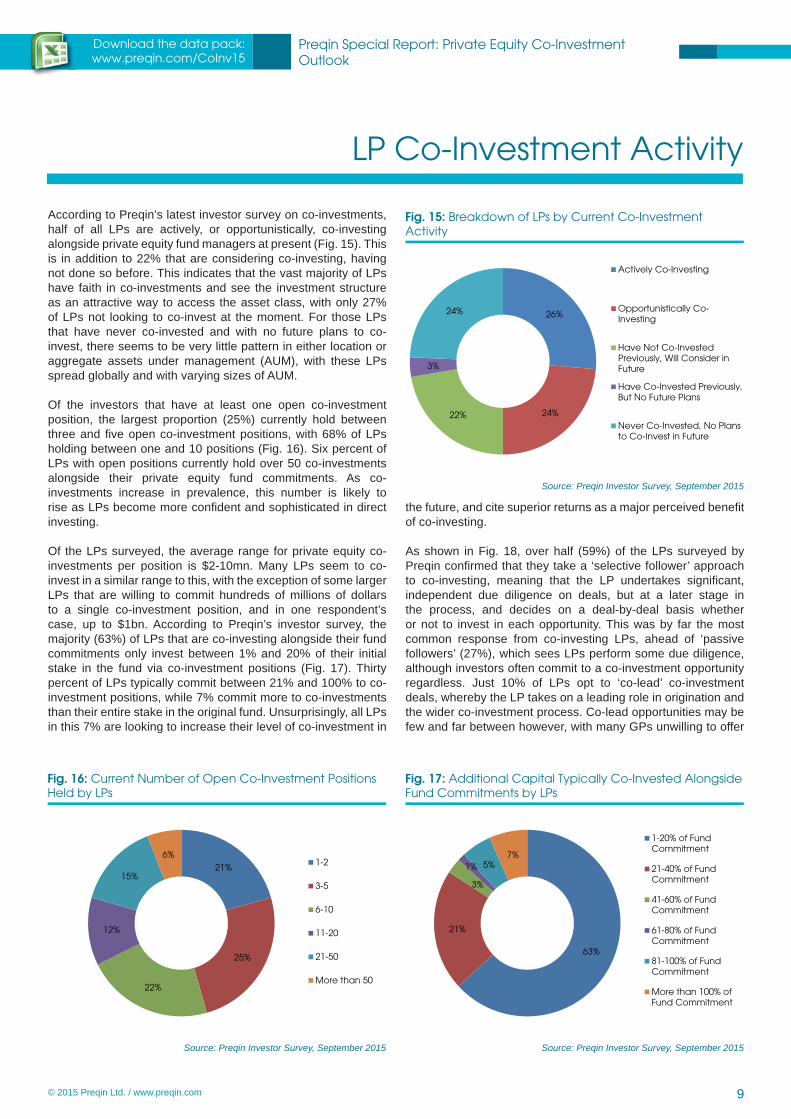
According to Preqin’s latest investor survey on co-investments, half of all LPs are actively, or opportunistically, co-investing alongside private equity fund managers at present (Fig. 15). This is in addition to 22% that are considering co-investing, having not done so before. This indicates that the vast majority of LPs have faith in co-investments and see the investment structure as an attractive way to access the asset class, with only 27% of LPs not looking to co-invest at the moment. For those LPs that have never co-invested and with no future plans to co-invest, there seems to be very little pattern in either location or aggregate assets under management (AUM), with these LPs spread globally and with varying sizes of AUM.
Of the investors that have at least one open co-investment position, the largest proportion (25%) currently hold between three and fi ve open co-investment positions, with 68% of LPs holding between one and 10 positions (Fig. 16). Six percent of LPs with open positions currently hold over 50 co-investments alongside their private equity fund commitments. As co-investments increase in prevalence, this number is likely to rise as LPs become more confi dent and sophisticated in direct investing.
Of the LPs surveyed, the average range for private equity co-investments per position is $2-10mn. Many LPs seem to co-invest in a similar range to this, with the exception of some larger LPs that are willing to commit hundreds of millions of dollars to a single co-investment position, and in one respondent’s case, up to $1bn. According to Preqin’s investor survey, the majority (63%) of LPs that are co-investing alongside their fund commitments only invest between 1% and 20% of their initial stake in the fund via co-investment positions (Fig. 17). Thirty percent of LPs typically commit between 21% and 100% to co-investment positions, while 7% commit more to co-investments than their entire stake in the original fund. Unsurprisingly, all LPs in this 7% are looking to increase their level of co-investment in
the future, and cite superior returns as a major perceived benefi t of co-investing.
As shown in Fig. 18, over half (59%) of the LPs surveyed by Preqin confi rmed that they take a ‘selective follower’ approach to co-investing, meaning that the LP undertakes signifi cant, independent due diligence on deals, but at a later stage in the process, and decides on a deal-by-deal basis whether or not to invest in each opportunity. This was by far the most common response from co-investing LPs, ahead of ‘passive followers’ (27%), which sees LPs perform some due diligence, although investors often commit to a co-investment opportunity regardless. Just 10% of LPs opt to ‘co-lead’ co-investment deals, whereby the LP takes on a leading role in origination and the wider co-investment process. Co-lead opportunities may be few and far between however, with many GPs unwilling to offer
26%
24%22%
3%
24%
Actively Co-Investing
Opportunistically Co-Investing
Have Not Co-InvestedPreviously, Will Consider inFuture
Have Co-Invested Previously,But No Future Plans
Never Co-Invested, No Plansto Co-Invest in Future
Fig. 15: Breakdown of LPs by Current Co-Investment Activity
Source: Preqin Investor Survey, September 2015
21%
25%
22%
12%
15%
6%1-2
3-5
6-10
11-20
21-50
More than 50
Fig. 16: Current Number of Open Co-Investment Positions Held by LPs
Source: Preqin Investor Survey, September 2015
63%
21%
3%
1% 5%7%
1-20% of FundCommitment
21-40% of FundCommitment
41-60% of FundCommitment
61-80% of FundCommitment
81-100% of FundCommitment
More than 100% ofFund Commitment
Fig. 17: Additional Capital Typically Co-Invested Alongside Fund Commitments by LPs
Source: Preqin Investor Survey, September 2015

10 © 2015 Preqin Ltd. / www.preqin.com
Preqin Special Report: Private Equity Co-Investment Outlook
Download the data pack:www.preqin.com/CoInv15
such a level of control to LPs. Furthermore, such a demanding role may not be a viable option for those investors lacking in experience or resources.
The potential for better returns and the attraction of lower fees seem to be the driving forces behind the majority of surveyed LPs deciding to opt for co-investments. As seen in Fig. 19, 67% of LPs believe that co-investing can lead to greater returns than those delivered by standard private equity fund arrangements. Additionally, 61% of investors are attracted to the prospect of lower fees charged on co-investment commitments, as detailed further on page 14. Interestingly, a third of LPs believe that co-investing provides them with more control over investments and 31% of LPs stated a desire to invest in a particular portfolio company, highlighting that institutional investors increasingly want to become more involved at a portfolio company level.
In contrast, LPs that do not co-invest, and have no plans to co-invest, seem to suggest that a lack of resources available to them is the prime reason for not committing to co-investment opportunities (Fig. 20). Surprisingly, these responses are not solely from smaller sized LPs, with a number of such respondents managing assets in excess of $10bn. Furthermore, almost a fi fth of respondents stated that they do not look to co-invest as it would reduce their level of diversifi cation, leaving them overexposed to certain deals by committing additional
capital to the same portfolio company. A very small 3% of LPs actually cited returns being too low as a reason for not currently co-investing, which is in contrast to the results shown in Fig. 19 and Fig. 22 that LPs at large reap the benefi ts of outperforming co-investments.
59%
27%
20%16%
10%
2%0%
10%
20%
30%
40%
50%
60%
70%
Sele
ctiv
eFo
llow
er
Pa
ssiv
eFo
llow
er
Co
-Un
de
rwrit
e
Co
-Sp
on
sor
Co
-Le
ad
Oth
er
Fig. 18: LP Approaches to Co-Investments
Source: Preqin Investor Survey, September 2015
Pro
po
rtio
n o
f LP
Re
spo
nd
en
ts
67%61%
40%34%
31%23%
6%
0%
10%
20%
30%
40%
50%
60%
70%
80%
Bett
er R
etu
rns
Low
er F
ee
s
Stre
ng
the
n G
PR
ela
tion
ship
s
Mo
re C
on
tro
lo
ver I
nve
stm
en
ts
Ga
in A
cc
ess
to
Spe
cifc
Po
rtfo
lioC
om
pa
nie
s
Ga
in K
no
wle
dg
eo
f In
du
stry
Se
cto
r
Oth
er
Fig. 19: LPs’ Perceived Benefits of Co-Investing
Source: Preqin Investor Survey, September 2015
Pro
po
rtio
n o
f LP
Re
spo
nd
en
ts
35%
19% 19%
8%5%
3% 3%
8%
0%
5%
10%
15%
20%
25%
30%
35%
40%
Lac
k o
fR
eso
urc
es
Re
du
ce
sD
ive
rsifi
ca
tion
No
t In
tere
ste
d
No
t P
art
of
Inve
stm
en
t P
lan
Leg
al
Re
stric
tion
s
Re
turn
sTo
o L
ow
Allo
ca
tion
Too
Sm
all
Oth
er
Fig. 20: LPs’ Reasons for Not Co-Investing
Source: Preqin Investor Survey, September 2015
Pro
po
rtio
n o
f LP
Re
spo
nd
en
ts
No
t C
o-In
vest
ing
Data Source:
Preqin’s Investor Intelligence is the leading source of information on institutional investors in private equity funds worldwide, with more than 6,000 limited partners of all types profi led and regularly updated following direct communication with our dedicated team of multilingual analysts.
Our online database of private equity investors lists all institutions actively investing in the asset class and includes detailed and up-to-date information about their plans for future investments.
For more information, please visit:
www.preqin.com/ii
Preqin Special Report: Co-InvestmentsDownload the data pack:www.preqin.com/CoInv15
Performance of Co-Investments
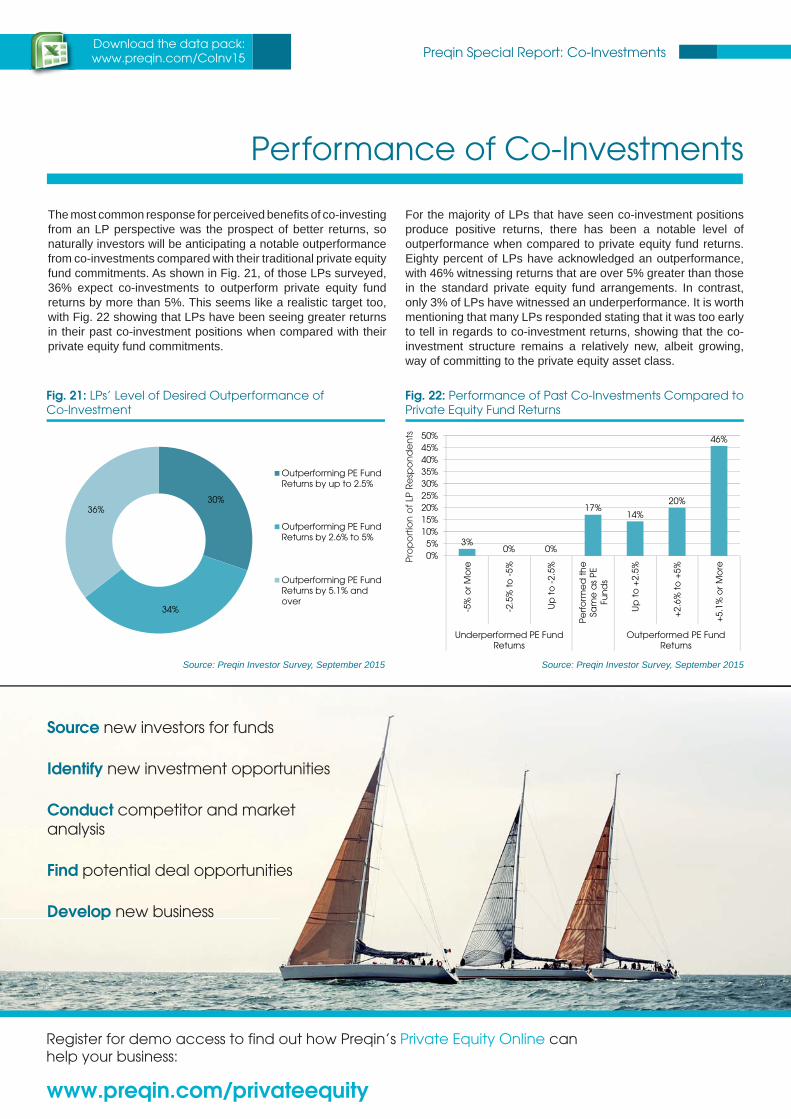
The most common response for perceived benefi ts of co-investing from an LP perspective was the prospect of better returns, so naturally investors will be anticipating a notable outperformance from co-investments compared with their traditional private equity fund commitments. As shown in Fig. 21, of those LPs surveyed, 36% expect co-investments to outperform private equity fund returns by more than 5%. This seems like a realistic target too, with Fig. 22 showing that LPs have been seeing greater returns in their past co-investment positions when compared with their private equity fund commitments.
For the majority of LPs that have seen co-investment positions produce positive returns, there has been a notable level of outperformance when compared to private equity fund returns. Eighty percent of LPs have acknowledged an outperformance, with 46% witnessing returns that are over 5% greater than those in the standard private equity fund arrangements. In contrast, only 3% of LPs have witnessed an underperformance. It is worth mentioning that many LPs responded stating that it was too early to tell in regards to co-investment returns, showing that the co-investment structure remains a relatively new, albeit growing, way of committing to the private equity asset class.
3%0% 0%
17%14%
20%
46%
0%5%
10%15%20%25%30%35%40%45%50%
-5%
or M
ore
-2.5
% t
o -
5%
Up
to
-2.
5%
Pe
rfo
rme
d t
he
Sam
e a
s P
EFu
nd
s
Up
to
+2.
5%
+2.
6% t
o +
5%
+5.
1% o
r M
ore
Underperformed PE FundReturns
Outperformed PE FundReturns
Fig. 22: Performance of Past Co-Investments Compared to Private Equity Fund Returns
Source: Preqin Investor Survey, September 2015
Pro
po
rtio
n o
f LP
Re
spo
nd
en
ts
30%
34%
36%
Outperforming PE FundReturns by up to 2.5%
Outperforming PE FundReturns by 2.6% to 5%
Outperforming PE FundReturns by 5.1% andover
Fig. 21: LPs’ Level of Desired Outperformance of Co-Investment
Source: Preqin Investor Survey, September 2015
Register for demo access to find out how Preqin’s Private Equity Online canhelp your business:
www.preqin.com/privateequity
Source new investors for funds
Identify new investment opportunities
Conduct competitor and market analysis
Find potential deal opportunities
Develop new business
12 © 2015 Preqin Ltd. / www.preqin.com
Preqin Special Report: Private Equity Co-Investment Outlook
Download the data pack:www.preqin.com/CoInv15
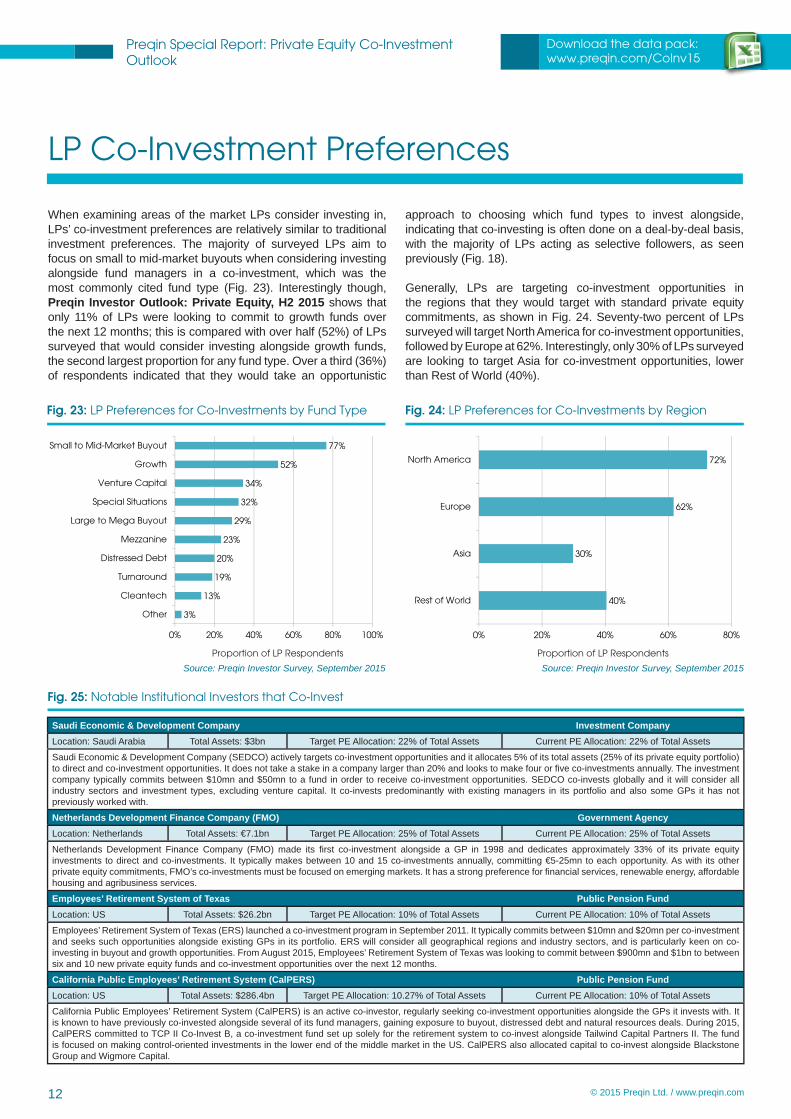
LP Co-Investment Preferences
When examining areas of the market LPs consider investing in, LPs’ co-investment preferences are relatively similar to traditional investment preferences. The majority of surveyed LPs aim to focus on small to mid-market buyouts when considering investing alongside fund managers in a co-investment, which was the most commonly cited fund type (Fig. 23). Interestingly though, Preqin Investor Outlook: Private Equity, H2 2015 shows that only 11% of LPs were looking to commit to growth funds over the next 12 months; this is compared with over half (52%) of LPs surveyed that would consider investing alongside growth funds, the second largest proportion for any fund type. Over a third (36%) of respondents indicated that they would take an opportunistic
approach to choosing which fund types to invest alongside, indicating that co-investing is often done on a deal-by-deal basis, with the majority of LPs acting as selective followers, as seen previously (Fig. 18).
Generally, LPs are targeting co-investment opportunities in the regions that they would target with standard private equity commitments, as shown in Fig. 24. Seventy-two percent of LPs surveyed will target North America for co-investment opportunities, followed by Europe at 62%. Interestingly, only 30% of LPs surveyed are looking to target Asia for co-investment opportunities, lower than Rest of World (40%).
40%
30%
62%
72%
0% 20% 40% 60% 80%
Rest of World
Asia
Europe
North America
Fig. 24: LP Preferences for Co-Investments by Region
Source: Preqin Investor Survey, September 2015Proportion of LP Respondents
3%
13%
19%
20%
23%
29%
32%
34%
52%
77%
0% 20% 40% 60% 80% 100%
Other
Cleantech
Turnaround
Distressed Debt
Mezzanine
Large to Mega Buyout
Special Situations
Venture Capital
Growth
Small to Mid-Market Buyout
Fig. 23: LP Preferences for Co-Investments by Fund Type
Source: Preqin Investor Survey, September 2015Proportion of LP Respondents
Fig. 25: Notable Institutional Investors that Co-Invest
Saudi Economic & Development Company Investment CompanyLocation: Saudi Arabia Total Assets: $3bn Target PE Allocation: 22% of Total Assets Current PE Allocation: 22% of Total Assets
Saudi Economic & Development Company (SEDCO) actively targets co-investment opportunities and it allocates 5% of its total assets (25% of its private equity portfolio) to direct and co-investment opportunities. It does not take a stake in a company larger than 20% and looks to make four or fi ve co-investments annually. The investment company typically commits between $10mn and $50mn to a fund in order to receive co-investment opportunities. SEDCO co-invests globally and it will consider all industry sectors and investment types, excluding venture capital. It co-invests predominantly with existing managers in its portfolio and also some GPs it has not previously worked with.
Netherlands Development Finance Company (FMO) Government AgencyLocation: Netherlands Total Assets: €7.1bn Target PE Allocation: 25% of Total Assets Current PE Allocation: 25% of Total Assets
Netherlands Development Finance Company (FMO) made its fi rst co-investment alongside a GP in 1998 and dedicates approximately 33% of its private equity investments to direct and co-investments. It typically makes between 10 and 15 co-investments annually, committing €5-25mn to each opportunity. As with its other private equity commitments, FMO’s co-investments must be focused on emerging markets. It has a strong preference for fi nancial services, renewable energy, affordable housing and agribusiness services.
Employees’ Retirement System of Texas Public Pension FundLocation: US Total Assets: $26.2bn Target PE Allocation: 10% of Total Assets Current PE Allocation: 10% of Total Assets
Employees’ Retirement System of Texas (ERS) launched a co-investment program in September 2011. It typically commits between $10mn and $20mn per co-investment and seeks such opportunities alongside existing GPs in its portfolio. ERS will consider all geographical regions and industry sectors, and is particularly keen on co-investing in buyout and growth opportunities. From August 2015, Employees’ Retirement System of Texas was looking to commit between $900mn and $1bn to between six and 10 new private equity funds and co-investment opportunities over the next 12 months.
California Public Employees’ Retirement System (CalPERS) Public Pension FundLocation: US Total Assets: $286.4bn Target PE Allocation: 10.27% of Total Assets Current PE Allocation: 10% of Total Assets
California Public Employees’ Retirement System (CalPERS) is an active co-investor, regularly seeking co-investment opportunities alongside the GPs it invests with. It is known to have previously co-invested alongside several of its fund managers, gaining exposure to buyout, distressed debt and natural resources deals. During 2015, CalPERS committed to TCP II Co-Invest B, a co-investment fund set up solely for the retirement system to co-invest alongside Tailwind Capital Partners II. The fund is focused on making control-oriented investments in the lower end of the middle market in the US. CalPERS also allocated capital to co-invest alongside Blackstone Group and Wigmore Capital.

A comprehensive guide to the performance of alternative assets
The 2015 Preqin Alternative Assets Performance Monitor provides unrivalled insight into the performance of alternative assets funds, analyzing performance data for over 20,500 funds.
This year’s new and expanded edition includes:
• Top performing funds, most consistent managers and ‘funds to watch’• Examination of risk vs. return for different asset classes and strategies• Analysis of funds across different strategies and geographies by vintage year• Public Market Equivalents (PME) – compare private equity performance relative to public markets• NEW FOR 2015! Analysis covering all alternatives, including private equity & venture capital, real estate,
infrastructure, private debt, natural resources and hedge funds.
For more information, please visit:
www.preqin.com/pm
alternative assets. intelligent data.
14 © 2015 Preqin Ltd. / www.preqin.com
Preqin Special Report: Private Equity Co-Investment Outlook
Download the data pack:www.preqin.com/CoInv15
GP Relationship
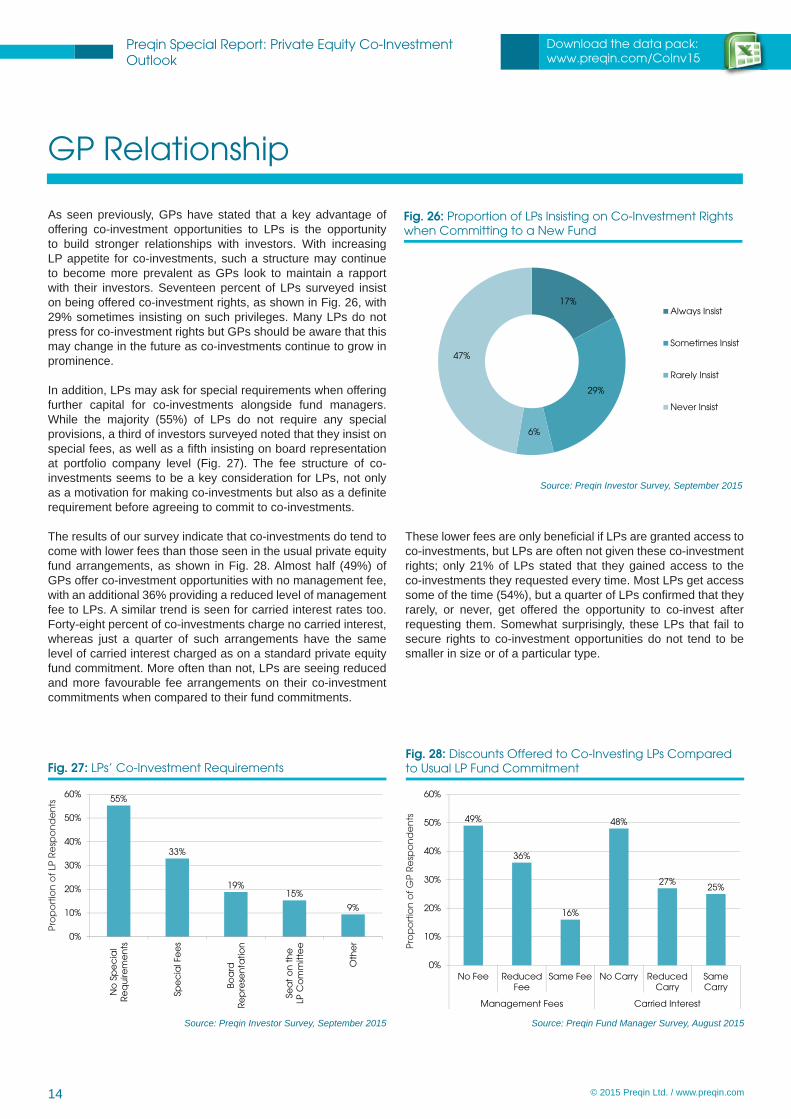
As seen previously, GPs have stated that a key advantage of offering co-investment opportunities to LPs is the opportunity to build stronger relationships with investors. With increasing LP appetite for co-investments, such a structure may continue to become more prevalent as GPs look to maintain a rapport with their investors. Seventeen percent of LPs surveyed insist on being offered co-investment rights, as shown in Fig. 26, with 29% sometimes insisting on such privileges. Many LPs do not press for co-investment rights but GPs should be aware that this may change in the future as co-investments continue to grow in prominence.
In addition, LPs may ask for special requirements when offering further capital for co-investments alongside fund managers. While the majority (55%) of LPs do not require any special provisions, a third of investors surveyed noted that they insist on special fees, as well as a fi fth insisting on board representation at portfolio company level (Fig. 27). The fee structure of co-investments seems to be a key consideration for LPs, not only as a motivation for making co-investments but also as a defi nite requirement before agreeing to commit to co-investments.
The results of our survey indicate that co-investments do tend to come with lower fees than those seen in the usual private equity fund arrangements, as shown in Fig. 28. Almost half (49%) of GPs offer co-investment opportunities with no management fee, with an additional 36% providing a reduced level of management fee to LPs. A similar trend is seen for carried interest rates too. Forty-eight percent of co-investments charge no carried interest, whereas just a quarter of such arrangements have the same level of carried interest charged as on a standard private equity fund commitment. More often than not, LPs are seeing reduced and more favourable fee arrangements on their co-investment commitments when compared to their fund commitments.
These lower fees are only benefi cial if LPs are granted access to co-investments, but LPs are often not given these co-investment rights; only 21% of LPs stated that they gained access to the co-investments they requested every time. Most LPs get access some of the time (54%), but a quarter of LPs confi rmed that they rarely, or never, get offered the opportunity to co-invest after requesting them. Somewhat surprisingly, these LPs that fail to secure rights to co-investment opportunities do not tend to be smaller in size or of a particular type.
17%
29%
6%
47%
Always Insist
Sometimes Insist
Rarely Insist
Never Insist
Fig. 26: Proportion of LPs Insisting on Co-Investment Rights when Committing to a New Fund
Source: Preqin Investor Survey, September 2015
55%
33%
19%15%
9%
0%
10%
20%
30%
40%
50%
60%
No
Sp
ec
ial
Re
qu
irem
en
ts
Spe
cia
l Fe
es
Boa
rdR
ep
rese
nta
tion
Sea
t o
n t
he
LP C
om
mitt
ee
Oth
er
Fig. 27: LPs’ Co-Investment Requirements
Source: Preqin Investor Survey, September 2015
Pro
po
rtio
n o
f LP
Re
spo
nd
en
ts
49%
36%
16%
48%
27%25%
0%
10%
20%
30%
40%
50%
60%
No Fee ReducedFee
Same Fee No Carry ReducedCarry
SameCarry
Management Fees Carried Interest
Fig. 28: Discounts Offered to Co-Investing LPs Compared to Usual LP Fund Commitment
Source: Preqin Fund Manager Survey, August 2015
Pro
po
rtio
n o
f G
P R
esp
on
de
nts
Preqin Special Report: Private Equity Co-Investment Outlook
Download the data pack:www.preqin.com/CoInv15
15 © 2015 Preqin Ltd. / www.preqin.com
GP and LP Future Co-Investment Plans
GP Future Plans
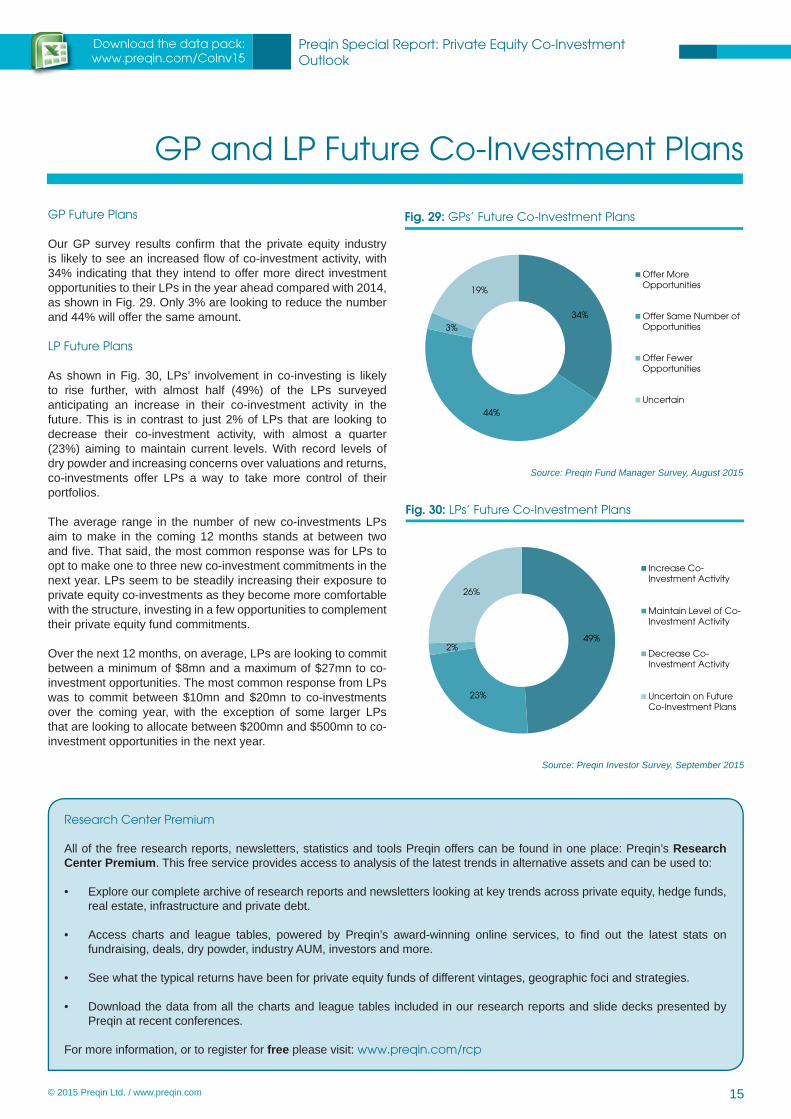
Our GP survey results confi rm that the private equity industry is likely to see an increased fl ow of co-investment activity, with 34% indicating that they intend to offer more direct investment opportunities to their LPs in the year ahead compared with 2014, as shown in Fig. 29. Only 3% are looking to reduce the number and 44% will offer the same amount.
LP Future Plans
As shown in Fig. 30, LPs’ involvement in co-investing is likely to rise further, with almost half (49%) of the LPs surveyed anticipating an increase in their co-investment activity in the future. This is in contrast to just 2% of LPs that are looking to decrease their co-investment activity, with almost a quarter (23%) aiming to maintain current levels. With record levels of dry powder and increasing concerns over valuations and returns, co-investments offer LPs a way to take more control of their portfolios.
The average range in the number of new co-investments LPs aim to make in the coming 12 months stands at between two and fi ve. That said, the most common response was for LPs to opt to make one to three new co-investment commitments in the next year. LPs seem to be steadily increasing their exposure to private equity co-investments as they become more comfortable with the structure, investing in a few opportunities to complement their private equity fund commitments.
Over the next 12 months, on average, LPs are looking to commit between a minimum of $8mn and a maximum of $27mn to co-investment opportunities. The most common response from LPs was to commit between $10mn and $20mn to co-investments over the coming year, with the exception of some larger LPs that are looking to allocate between $200mn and $500mn to co-investment opportunities in the next year.
49%
23%
2%
26%
Increase Co-Investment Activity
Maintain Level of Co-Investment Activity
Decrease Co-Investment Activity
Uncertain on FutureCo-Investment Plans
Fig. 30: LPs’ Future Co-Investment Plans
Source: Preqin Investor Survey, September 2015
34%
44%
3%
19%
Offer MoreOpportunities
Offer Same Number ofOpportunities
Offer FewerOpportunities
Uncertain
Fig. 29: GPs’ Future Co-Investment Plans
Source: Preqin Fund Manager Survey, August 2015
Research Center Premium
All of the free research reports, newsletters, statistics and tools Preqin offers can be found in one place: Preqin’s Research Center Premium. This free service provides access to analysis of the latest trends in alternative assets and can be used to:
• Explore our complete archive of research reports and newsletters looking at key trends across private equity, hedge funds, real estate, infrastructure and private debt.
• Access charts and league tables, powered by Preqin’s award-winning online services, to fi nd out the latest stats on fundraising, deals, dry powder, industry AUM, investors and more.
• See what the typical returns have been for private equity funds of different vintages, geographic foci and strategies.
• Download the data from all the charts and league tables included in our research reports and slide decks presented by Preqin at recent conferences.
For more information, or to register for free please visit: www.preqin.com/rcp

© 2015 Preqin Ltd. / www.preqin.com
If you want any further information, or would like a demo of our
products, please contact us:
New York:
One Grand Central Place60 E 42nd Street
Suite 630, New YorkNY 10165
Tel: +1 212 350 0100Fax: +1 440 445 9595
London:
3rd FloorVintners’ Place
68 Upper Thames StreetLondon
EC4V 3BJTel: +44 (0)20 3207 0200
Fax: +44 (0)87 0330 5892
Singapore:
One Finlayson Green, #11-02 Singapore 049246Tel: +65 6305 2200
Fax: +65 6491 5365
San Francisco:
One Embarcadero CenterSuite 2850
San FranciscoCA 94111
Tel: +1 415 316 0580Fax: +1 440 445 9595
Hong Kong:
Level 9, Central Building1-3 Pedder Street
Central, Hong KongTel: +852 3958 2819
Fax: +852 3975 2800
Email: [email protected]: www.preqin.com
Preqin Special Report: Private Equity
Co-Investment Outlook
November 2015
Preqin: Global Data and Intelligence
With global coverage and detailed information on all aspects of the private equity asset class, Preqin’s industry-leading Private Equity Online services keep you up-to-date on all the latest developments in the private equity universe.
Source new investors for funds and co-investments
Find the most relevant investors, with access to detailed profi les for over 6,000 institutional investors actively investing in private equity, including future fund searches and mandates, direct contact information and sample investments.
Identify potential investment opportunities
View in-depth profi les for over 2,400 unlisted private equity funds currently in market, including information on investment strategy, geographic focus, key fundraising data, service providers used and sample investors.
Find active fund managers in private equity
Search for fi rms actively targeting private equity investments. View information on key contacts, fi rm fundraising and performance history, and applied strategies of the fi rm when investing in portfolio companies and assets.
Analyze the latest private equity fundraising activity
See which fi rms are currently on the road raising a private equity fund and which will be coming to market soon. Analyze fundraising over time by fund strategy and location.
See the latest buyout and venture capital deals and exits
View details of more than 133,400 buyout and venture capital deals, including deal value, buyers, sellers, debt fi nancing providers, fi nancial and legal advisors, exit details and more. Identify forthcoming exits and expected IPOs.
Benchmark performance
Identify which fund managers have the best track records, with performance benchmarks for private equity funds and performance details for over 7,700 individual named funds.
Examine fund terms
See the typical terms offered by funds of particular types, strategies and geographical foci, and assess the implications of making changes to different fees.
Find out how Preqin’s infrastructure products and services canhelp you:
www.preqin.com/privateequity


