October 28, 2008 Model qualification and assumption checking [email protected]
Model qualification and assumption checking
To Validate or not to Validate?
If all models are wrong but some are useful, why bother?
To Qualify or not to Qualify?
To Check or not to Check?
To Evaluate or not to Evaluate?
Pravin Jadhav, Pharmacometrics
October 28, 2008 [email protected] qualification and assumption checking
Model Qualification or Checking
• Qualification/Checking can be used to provide the following– feedback on how to improve the current model
(learn), and/or– some reassurance that the model can at the least
regenerate the data that were used to build the model (confirm).

October 28, 2008 [email protected] qualification and assumption checking
Model Qualification or Checking
• Before you go to quantitative qualification methods, (Qualitative)-– Use prior knowledge (nothing better than this)
• Properties of the drug• Parameter estimates from previous studies or analyses
(e.g. NonCompartmental analysis)• Drugs in the same class• In vitro data, etc.
– Quality of the experimental design and data used in building the model
– Specify model qualification objectives

October 28, 2008 [email protected] qualification and assumption checking
Precision of parameter estimates
• Log-likelihood profiling
• Bootstrap– Parametric– Nonparametric
October 28, 2008 [email protected] qualification and assumption checking
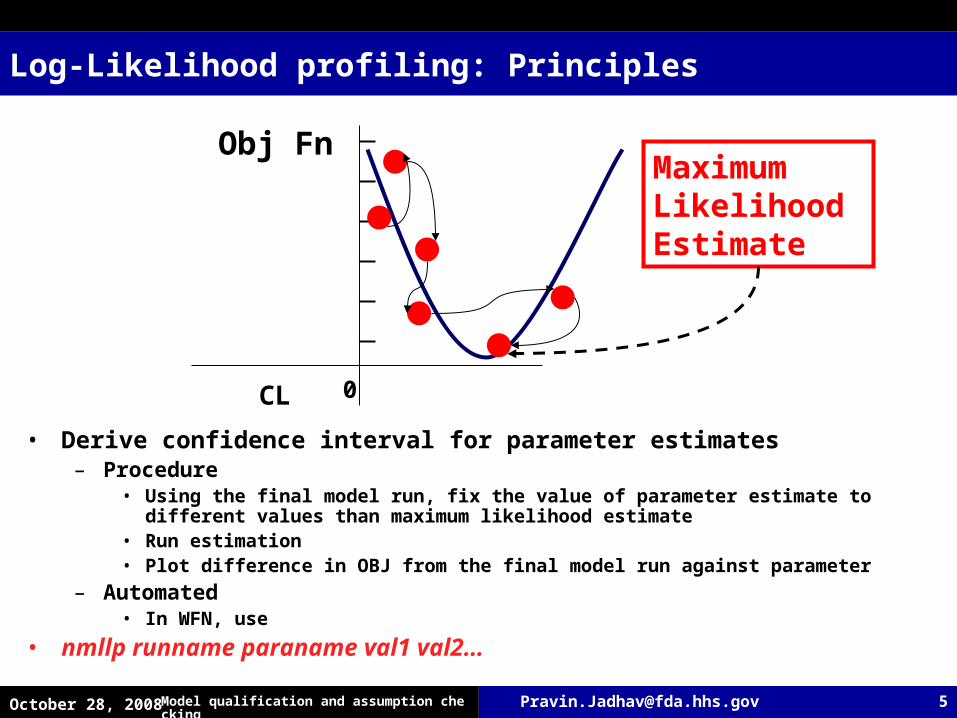
Log-Likelihood profiling: Principles
Obj Fn
CL 0
Maximum Likelihood Estimate
• Derive confidence interval for parameter estimates– Procedure
• Using the final model run, fix the value of parameter estimate to different values than maximum likelihood estimate
• Run estimation• Plot difference in OBJ from the final model run against parameter
– Automated• In WFN, use
• nmllp runname paraname val1 val2…

October 28, 2008 [email protected] qualification and assumption checking
Log-Likelihood profiling
Clearance estimate LLP.R

October 28, 2008 [email protected] qualification and assumption checking
Log-Likelihood profiling
• This method is dependent on– -2*log-likelihood is chi-square distributed with 1 degree of
freedom (one reduced parameter compared to full model)• For some estimation methods (for example, FO) the assumption
might not be accurate– Gobburu and Lawrence Pharm Res. 2002 Jan;19(1):92-8 – Wahlby et. al. J Pharmacokinet Pharmacodyn. 2001 Jun;28(3):231-52
What does this mean to you?
How do you derive this?

October 28, 2008 [email protected] qualification and assumption checking
What does this mean?
• For most examples, if you use FO method- change of 3.84 in objective function value for the reduced model versus full model is probably not accurate for 95% significance level?
• If the exact p-value is needed
– Do you need higher or lower change based on the previous graph?• ????
• How do you derive conditional distribution? If the exact p-value is needed, one will need to generate conditional distribution of the log-lileklihood and not rely on theoretical distribution (using randomization test, which will be not covered today)
• Generally speaking, the conditional distribution will be different for each combination of full model, reduced model and dataset (dense/sparse etc.) based on the approximations used-- But we don’t do it for every run- why?
October 28, 2008 [email protected] qualification and assumption checking
Bootstrap
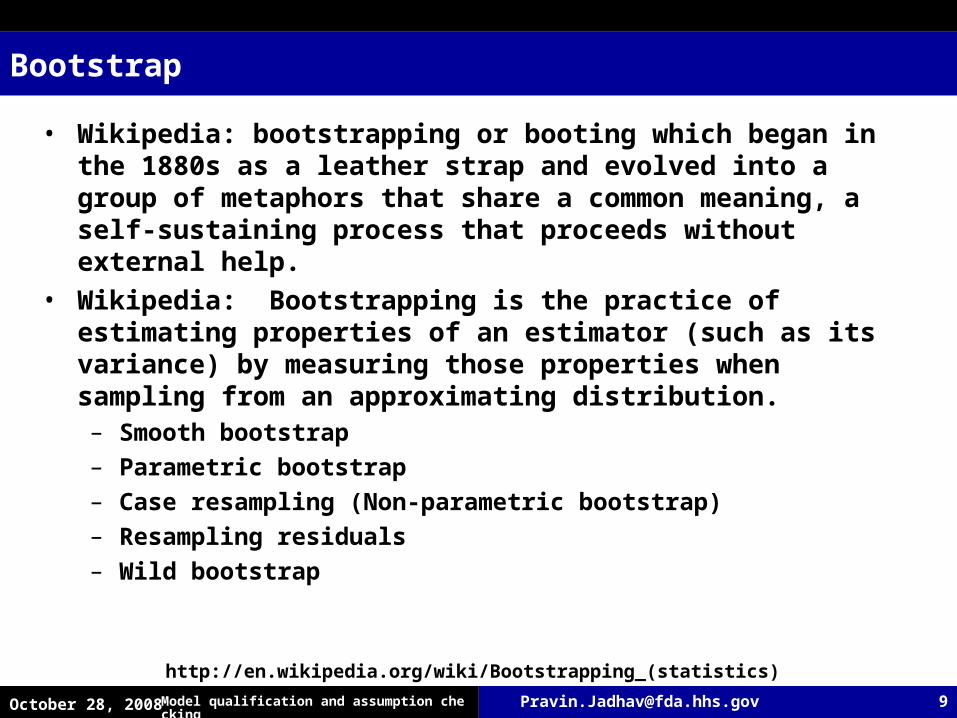
• Wikipedia: bootstrapping or booting which began in the 1880s as a leather strap and evolved into a group of metaphors that share a common meaning, a self-sustaining process that proceeds without external help.
• Wikipedia: Bootstrapping is the practice of estimating properties of an estimator (such as its variance) by measuring those properties when sampling from an approximating distribution. – Smooth bootstrap
– Parametric bootstrap
– Case resampling (Non-parametric bootstrap)
– Resampling residuals
– Wild bootstrap
http://en.wikipedia.org/wiki/Bootstrapping_(statistics)

October 28, 2008 [email protected] qualification and assumption checking
Bootstrap
Dataset 1000:
Sample 100 subjects
Dataset 1:
Sample 100 subjects
• Non-parametric– Sample individuals to create several datasets from the
original data• Example from homework #3
RunESTIMATION
1000
Population estimates
OriginalData
ID=9
ID=5
ID=45
ID=67
WFN use:nmbs runname 100 will call nmgo with 100 bootstrap sampled data sets taken from dataset supplied in runname

October 28, 2008 [email protected] qualification and assumption checking
Dataset 1000:
using 100 CLi, Vi, ERRij and original data structure
Dataset 1:
using 100 CLi, Vi, ERRij and original data structure
Bootstrap
• Parametric– Monte Carlo Simulations to create several datasets from the
final model and model parameters• One compartment example from homework #2
CL
V
Final model
ESTI
MATE
1000
Population estimates
Error
Run8.ctl

October 28, 2008 [email protected] qualification and assumption checking
Bootstrap
• Parametric or Non-Parametric method will yield N (one for each successfully converged boostrap samples) sets of parameters– For example, N=1000 sets of CL, V, 2
CL, 2V and 2
Clearance
Fre
qu
en
cy
1.7 1.8 1.9 2.0 2.1 2.2
05
01
00
15
02
00
25
0
2.5th percentile 97.5th percentile
SessionII_HowToMakeAHistogramIn.R

October 28, 2008 [email protected] qualification and assumption checking
Model Qualification or Checking
• Diagnostic plots (Slide 7 From Dr. Tornoe’s slides)– Observed and predicted concentration vs. time– Observed vs. predicted concentration– Residuals vs. time– Residuals vs. predictions
• Did you do this ever? – Homework #1, #2, #3

October 28, 2008 [email protected] qualification and assumption checking
Model Qualification or Checking: Observed vs. predicted concentration
• Homework #3
• Student 1: There is no systemic bias (over-prediction or under-prediction) in individual predictions from the model; however, population predictions appear to be slightly under-predicted (biased).
• Student 2:The model was able to describe the data very well with no systematic bias.
• Student 3: Individual Predictions: The observed and predicted concentrations appear to be closely distributed around the line of identity suggesting minimal residual error and hence, the validity of the one-compartment model with first order absorption.

October 28, 2008 [email protected] qualification and assumption checking
Model Qualification or Checking: Residuals vs. time or predictions
• Homework #3
• Student 1: Weighted residual are homogenously and randomly distributed around the line with zero mean without any trend, suggesting……………………….
• Student 2: Observation of the weighted residuals vs. time and vs. population predicted shows no heteroscedasticity.

October 28, 2008 [email protected] qualification and assumption checking
Model Qualification or Checking: Observed and predicted concentration vs. time Individual plots (Run 4)
Time
Ob
se
rva
tio
ns / P
red
ictio
ns
500
1000
1500
2000
ID:1
0 5 10 15 20 25
ID:2
0 5 10 15 20 25
ID:3
500
1000
1500
2000
ID:4
CONC IPRE PRED
page 1 of 25
• Student 1: From a visual point of view, observed concentrations are well described by a one-cmpt body model with oral absorption.
October 28, 2008 [email protected] qualification and assumption checking
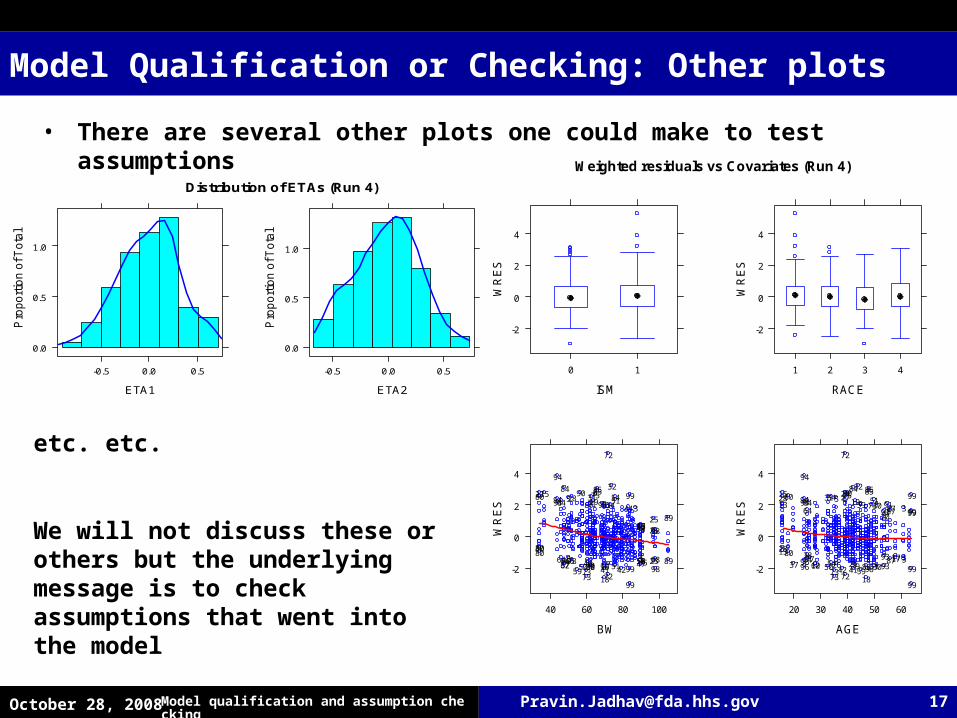
Model Qualification or Checking: Other plots
• There are several other plots one could make to test assumptions
ISM
WR
ES
-2
0
2
4
0 1
RACE
WR
ES
-2
0
2
4
1 2 3 4
BW
WR
ES
-2
0
2
4
40 60 80 100
62378480
646658080
80946494
27155
84
94
735973
5030883078 40
31 9128 193190 758585
99187241 4296 9910 51
4474 346 5154 9932
72
9847955658 25984 89
58 98254756564725 89
AGE
WR
ES
-2
0
2
4
20 30 40 50 60
37 9696
1364
8077
2838
1364
28 9480
6415
94
94
73 727342506210 2654
153154 27752790
72
1841599879 308821 51
7459 3019 518584 8532
99
999338717 31793
20 99999387 3879199
Weighted residuals vs Covariates (Run 4)
etc. etc.
We will not discuss these or others but the underlying message is to check assumptions that went into the model
ETA1
Pro
po
rtio
n o
f To
tal
0.0
0.5
1.0
-0.5 0.0 0.5
ETA2
Pro
po
rtio
n o
f To
tal
0.0
0.5
1.0
-0.5 0.0 0.5
Distribution of ETAs (Run 4)
ETA1
Pro
po
rtio
n o
f To
tal
0.0
0.5
1.0
-0.5 0.0 0.5
ETA2
Pro
po
rtio
n o
f To
tal
0.0
0.5
1.0
-0.5 0.0 0.5
Distribution of ETAs (Run 4)

October 28, 2008 [email protected] qualification and assumption checking
Model Qualification or Checking: Predictive check
• (Posterior) Predictive check is proposed to check whether the posited model should be excluded, because the model fails to provide a reasonable summary of the data used for modeling.
• Originally developed for checking fully Bayesian models.– The posterior distribution, a reflection of the uncertainty of a
parameter, is influenced by the strength of the prior knowledge.• Recollect Session 1 and today’s Q&A
– Major question: How close the posterior distribution was to the current data?
• a summary feature, called a statistic (for example, SSE), calculated from the current data, are compared with the same statistic calculated under the posterior distribution.
• If this comparison failed to meet a prespecified criterion, the model might be rejected.
• Makes a lot of sense in Bayesian framework.

October 28, 2008 [email protected] qualification and assumption checking
Model Qualification or Checking: Predictive check
• Why (posterior) in parentheses– ML methods do not use priors– The ML approach yields only the point estimates of the
parameters (called the ML estimates) and the asymptotic standard errors, and not a posterior distribution
•Yano Y, Beal SL, Sheiner LB. J Pharmacokinet Pharmacodyn. 2001;28:171-192•Jadhav, P. R.; Gobburu, J.V.S.; AAPS Journal, Vol. 7 No. 3 (2005)
October 28, 2008 [email protected] qualification and assumption checking
Model Qualification or Checking: Predictive check
• Three steps in PC or PPC– Estimation step
• yOD : Original data (For example, Drug Concentration) : Estimated population parameters
– What about 1 compartment model for IV administration
– Simulation step• y1
rep ….. Ynrep are generated using
– Evaluation step• Compare
– test statistics T(yOD) to T(yirep): mean concentration at time t and
area under the curve (determined empirically)
– Discrepancy variable T(yOD,) to T(yirep ,): sum of squared
errors (SSE), determined using the observed and model-predicted variables (eg, concentrations), mean prediction and mean absolute prediction errors

October 28, 2008 [email protected] qualification and assumption checking
• Evaluation step– graphical assessment of the 95% prediction interval (visual PC)
– considerable scatter beyond the 95% prediction interval could indicate a poor model, but the converse may not be valid.
Model Qualification or Checking: Predictive check

October 28, 2008 [email protected] qualification and assumption checking
Model Qualification or Checking: Predictive check
– predictive p-value (Pp)
• What does Pp =0, 0.5 and 1 mean?
– probability of equivalence (peqv),

October 28, 2008 [email protected] qualification and assumption checking
Predictive check: References
• Gelman A, Carlin JB, Stern HS, Rubin DB. Model checking and sensitivity analysis. In: Gelman A, ed. Bayesian Data Analysis. London: Chapman & Hall; 1995:161-189

October 28, 2008 [email protected] qualification and assumption checking
Other approaches
• Internal validation• External validation• Sensitivity analysis


