Download - Populism and Party- Society

Populism and Party- Society
Developmental Regimes in Tamil Nadu and West Bengal
Kalaiyarasan A.
Introduction
It is increasingly recognised that the nature of political mobilization of classes and castes
produces specific political regimes; and these regimes, in turn, set the path of policy regimes and
developmental outcomes (Kohli 1987).Owing to specific regional histories and politics, there are
variations in such political regimes. According to John Harriss (1999), Kerala, Tamil Nadu, and
West Bengal are states with political regimes dominated by lower castes and classes – albeit in
different ways.1 Pranab Bardhan contrasts “welfare regimes” in West Bengal and Tamil Nadu
and attributes the differences between the two to the divergent nature of regional social
movements. He argues that regional capital in Tamil Nadu is more indigenised and the state has
a ‘culture of wealth creation as opposed to redistribution’ (cited in Tillin 2013).
Both Tamil Nadu and West Bengal have distinct political regimes. For instance, Tamil
Nadu is home to anti-caste movements and political mobilisation of OBCs and SCs for over a
century (Arooran 1980; Chandrababu 1993; Pandian 2006). The DMK that came to power in
1967, with a broad social base of lower castes and classes, had a huge influence on the policy
regime in the state. West Bengal, since 1977, has been ruled by the Left Front Government
headed by the Communist Party of India – Marxist (CPM). The left coalition had an
uninterrupted electoral triumph for more than three decades. The state has been credited to have 1 Kerala is often stated as a state ruled by the left and its economic performance in the social sector is is attributed to
the left. However, if the left held power for seven times in Kerala since 1956 (when the state was formed), the
Congress did so for six times. The history of social development in Kerala goes beyond the left regime. The social
reform movements, including the role of Christianity and specific nature of colonial intervention, have to be
accounted for the better social indicators. Rammohan (2000) rightly argues, “The modernity project in Kerala, it
may be remembered, was realised, among others, through robust caste-based social movements, especially the
movements of the ‘lower’ castes and ‘out’castes. The part played by such democratisation in Kerala’s social
development was unique, as evidenced by West Bengal, also marked by a project of modernity and strong left
movement, but failing to attain similar social development (Ibid, p. 1234).”

a distinguished record of implementing agrarian reforms in rural Bengal (Mishra 2007;
Bandyapadhyay 2008).
This paper uses two distinct categories to understand the political milieu and policy
regimes Tamil Nadu and West Bengal -- populism and party-society respectively. Contrary to
common understanding, populism need not be negative but can have positive connotation for the
socially and economically disadvantaged sections. Andrew Wyatt (2013), in the specific context
of Tamil Nadu, defines populism as ‘an ideological construct that celebrates the importance of
the ordinary people, asserts these people should not be divided by social hierarchy and justifies
improvements in their welfare.’ Bardhan argues that populism has indeed produced positive
results in Tamil Nadu by taking economic growth and social welfare together (Bardhan 2014).
In the case of West Bengal, Dwajpayan Bhattacharya (2010), using Partha Chatterjee’s
(2004) conception of political society, argues that party-society is a specific form of political
society operating in rural Bengal. Political society is defined as a society made up of those who
are historically disadvantaged and excluded from civil society due to lack of education, wealth
and other forms of capital. It provides the scope for the emergence of competing political parties
and civil organisations which then articulate their concerns with state and civil society. In a
party-society political parties monopolise the social space and stifle the emergence of civil
associations. Even if they emerge for historically contingent reasons, they are constrained to play
a subsidiary role. Thus, Bhattacharya argues that party-society, by either suppressing these
organisations or curbing their relevance to government and polity, weakens the negotiating
power of disadvantaged groups. Whereas populist political regimes must respond to recurrent
political mobilization by different social groups, party-society does not allow space for such
mobilization.
The paper is organised in two parts. Part I provides details of economic growth,
development outcomes and social distribution of enterprises in Tamil Nadu and West Bengal.
The evidence shows considerable divergence in outcomes between the states. Part II offers
possible explanations for the differential outcomes between the two states. The explanations are
broadly located in the nature of political regimes in and specific histories of the states.

I
1. Dynamics of Economic Growth
Since the 1980s, Tamil Nadu has witnessed a consistently high economic growth rate.
This has been attributed to the economic reforms initiated in the early 1990s. The state decisively
embraced neo-liberal policies and has, since, heavily subsidised the corporate sector through
various tax exemptions (Vijayabaskar 2010). While West Bengal has also witnessed sustained
economic growth since the 1990s, the growth rate has been lower than that of Tamil Nadu.
Whether the sustained higher economic growth is due to the policies initiated in the 1990 or not
is beyond the purview of this paper. The paper is concerned with explaining the difference in
economic growth and developmental outcomes between the two states.
Table1: GSDP Growth Rate By Sectors and Their Contribution to Growth
Sector
Tamil Nadu Bengal
1980-
1990
1990-
2000
2000-
2010
1980-
2010
1980-
1990
1990-
2000
2000-
2010
1980-
2010
Agriculture 4.4 (19) 3.5 (11) 2.1 (3) 3.3 (7) 3.8 (28) 4.5 (21) 2.5 (9) 3.6 (15)
Manufacturing 4.7 (21) 4.6 (16) 8.4 (21) 5.9 (20) 2.9 (8) 6.0 (10) 7.0 (12) 5.3 (11)
Construction 7.6 (7) 7.7 (8) 11.2 11) 8.8 (10) 5.6 (7) 6.0 (6) 7.3 (7) 6.3 (6)
Industry 5.6 (33) 5.5 (27 8.0 (30) 6.4 (30) 3.8 (19) 5.8 (19) 6.6 (20) 5.4 (20)
Services 6.3 (48) 8.2 (62) 9.4 (67) 7.9 (63) 4.9 (53) 7.3 (60) 7.9 (71) 6.7 (65)
GSDP
5.6
(100)
6.4
(100)
8.0
(100)
6.7
(100)
4.3
(100)
6.2
(100)
6.5
(100)
5.7
(100)
Per Capita Income 4.1 5.3 6.4 5.3 2.0 4.5 5.1 3.9 Note: GSDP at 1999-00 constant prices. Figures in parenthesis show contribution to GSDP Growth.
Source: Central Statistical Organization.
Table 1 gives the sector-wise growth rate and the contribution of each sector to the aggregate
growth in both states for the last three decades. The overall GDP growth of Tamil Nadu for this
period has been 6.7 percent per annum and that of West Bengal has been 5.7 percent per annum.
Despite an increase in growth rate in West Bengal in the 1990s, the gap persists.
When disaggregated, the data shows that in both Tamil Nadu and West Bengal the growth
rates of the construction and service sectors have been the highest. For instance, the construction

and service sectors in Tamil Nadu have grown at 8.8 and 7.9 percent per annum respectively.
The corresponding figures for West Bengal are 6.3 and 6.7 percent per annum.
Manufacturing has grown at 5.9 percent per annum in Tamil Nadu, while the corresponding
growth rate for West Bengal is just 5.3 percent. The industrial sectors as a whole has witnessed a
growth rate of 6.4 percent per annum in Tamil Nadu, while the corresponding figure for West
Bengal is just 5.4 per annum. Tamil Nadu has consistently outperformed West Bengal in all
sectors but agriculture. Agriculture has grown at 3.3 percent per annum in Tamil Nadu, while
the corresponding growth rate for West Bengal is 3.8 percent per annum.
There is a significant difference between the two states with respect to drivers (contribution
of sub-sectors to aggregate growth) of economic growth. The key drivers of economic growth in
Tamil Nadu are the service and manufacturing sectors. In West Bengal, the service sector alone
has contributed the largest share. The service sector has contributed approximately 63 percent of
the overall economic growth in Tamil Nadu in the last three decades. The corresponding figure
for West Bengal is 65 percent. Unlike West Bengal, industry continues to be a significant driver
of economic growth in Tamil. Industry has contributed about 30 percent of the overall economic
growth in Tamil Nadu while the corresponding figure for West Bengal is only 20 percent. Within
industry, manufacturing has contributed approximately 20 percent to the overall economic
growth in Tamil Nadu, while the sector has contributed just 11 percent to growth in West
Bengal. However, what is significant between the two states is the contribution of agriculture to
the overall economic growth. While agriculture sector accounts for 15 percent of growth in
West Bengal in the last three decades, Tamil Nadu (7 percent) has steadily witnessed a decline in
the contribution of agriculture to the overall growth.

2. Distribution of Enterprises
Table 2 gives the figures of distribution of enterprises based on Economic Census (2005) and
Ministry of Micro Small and Medium Enterprises (MSME) census (2007-08) for Tamil Nadu
and West Bengal. The Economic Census shows that the number of enterprises in Tamil Nadu is
three time that in West Bengal. This is confirmed by the MSME census as well. As per the
MSME census, the number of enterprises in Tamil Nadu in 2007-2008 was about twenty four
thousand as compared to six thousand in West Bengal. The data also shows that the social base
of entrepreneurship in Tamil Nadu is more diverse than in West Bengal. Certain traditional non-
business castes have an appreciable share in entrepreneurships in Tamil Nadu.
Table 2: Distribution of Enterprises ( More than 10 workers) Owned by Socio-
Religious Groups
Economic Census (2005) MSME Census (2007-08)
Tamil Nadu West Bengal Tamil Nadu West Bengal
SC/ST 1174 (4.1) 968 (9.4) 1240 (5.0) 287 (4.7)
OBC 22980 (77.5) 622 (6.0) 16151 (65.6) 162 (2.6)
General* 5490 (18.5) 8705 (84.6) 4347 (17.7) 4665 (76.0)
Muslim .... 1193 (4.8) 695 (11.3)
Other Minorities ...... 1622 (6.6) 333 (5.4)
Total 29644 (100) 10295 (100) 24627 (100) 6142 (100)
* General category in Economic Census refers upper castes while they are Hindu upper castes in MSME
census
Source: Unit Level Records from Economic Census (2005) and MSME Census (2007-08)
According to the MSME census SC/ST, OBC and Muslims– who constitute about 65 percent of
West Bengal’s population2 – own just 19 percent of the enterprises. The corresponding figures
for Tamil Nadu are 95 and 75 percents respectively. The General population (upper castes) –
while they constitute only 35 percent of population – own as much as 76 percent of total
enterprises in West Bengal. In Tamil Nadu, they form 5 percent of the population and own 18
percent of total enterprises. The Economic census of 2005 also provides similar evidence.
2 As per population census 2001, the percentage of SCs, STs and Muslims in West Bengal are 24, 6 and 25
respectively. The corresponding figures for Tamil Nadu are 19, 1 and 6 percent respectively. As per NSS0 2011-
12, the OBCs in Tamil Nadu are 75 percent and 9 percent in West Bengal. The Hindu upper castes are 4 percent in
Tamil Nadu and about 36 percent in West Bengal.
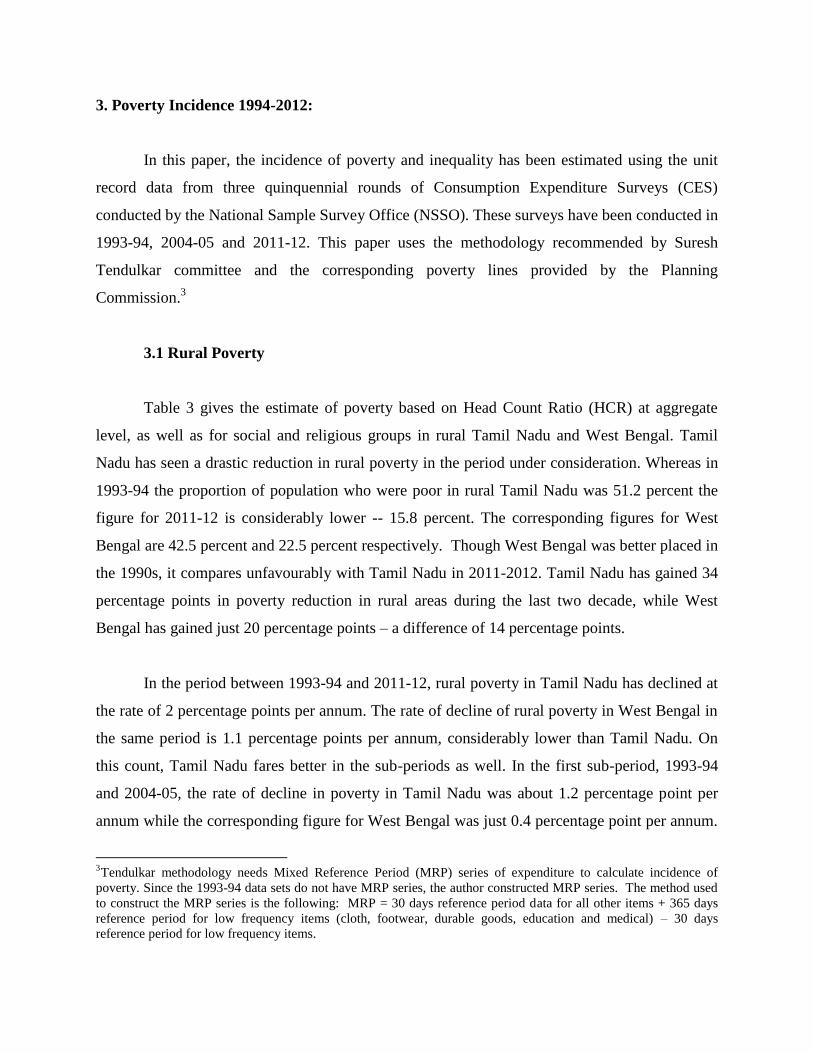
3. Poverty Incidence 1994-2012:
In this paper, the incidence of poverty and inequality has been estimated using the unit
record data from three quinquennial rounds of Consumption Expenditure Surveys (CES)
conducted by the National Sample Survey Office (NSSO). These surveys have been conducted in
1993-94, 2004-05 and 2011-12. This paper uses the methodology recommended by Suresh
Tendulkar committee and the corresponding poverty lines provided by the Planning
Commission.3
3.1 Rural Poverty
Table 3 gives the estimate of poverty based on Head Count Ratio (HCR) at aggregate
level, as well as for social and religious groups in rural Tamil Nadu and West Bengal. Tamil
Nadu has seen a drastic reduction in rural poverty in the period under consideration. Whereas in
1993-94 the proportion of population who were poor in rural Tamil Nadu was 51.2 percent the
figure for 2011-12 is considerably lower -- 15.8 percent. The corresponding figures for West
Bengal are 42.5 percent and 22.5 percent respectively. Though West Bengal was better placed in
the 1990s, it compares unfavourably with Tamil Nadu in 2011-2012. Tamil Nadu has gained 34
percentage points in poverty reduction in rural areas during the last two decade, while West
Bengal has gained just 20 percentage points – a difference of 14 percentage points.
In the period between 1993-94 and 2011-12, rural poverty in Tamil Nadu has declined at
the rate of 2 percentage points per annum. The rate of decline of rural poverty in West Bengal in
the same period is 1.1 percentage points per annum, considerably lower than Tamil Nadu. On
this count, Tamil Nadu fares better in the sub-periods as well. In the first sub-period, 1993-94
and 2004-05, the rate of decline in poverty in Tamil Nadu was about 1.2 percentage point per
annum while the corresponding figure for West Bengal was just 0.4 percentage point per annum.
3Tendulkar methodology needs Mixed Reference Period (MRP) series of expenditure to calculate incidence of
poverty. Since the 1993-94 data sets do not have MRP series, the author constructed MRP series. The method used
to construct the MRP series is the following: MRP = 30 days reference period data for all other items + 365 days
reference period for low frequency items (cloth, footwear, durable goods, education and medical) – 30 days
reference period for low frequency items.

In the second sub-period between 2004-05 and 2011-12 too Tamil Nadu has outperformed West
Bengal in poverty reduction. The rate of decline in rural poverty for Tamil Nadu is 3.1
percentage points per annum, while the decline in West Bengal is just 2.2 percentage points
Figure 1: Rural Poverty (HCR) for Tamil Nadu and West Bengal (in Percentage)
3.1.1. Poverty Reduction across Social and Religious Groups in the Countryside:
In respect of poverty reduction across social and religious groups in rural areas Tamil
Nadu has done better than West Bengal. The incidence of poverty among SC/STs in rural Tamil
Nadu has come down from 66 percent in 1993-94 to 24 percent in 2011-12 (see Table 3). The
corresponding figures for SC/STs in West Bengal are 51.6 and 27.2 percent respectively. The
SC/STs gained about 42 percentage points in poverty reduction in Tamil Nadu during this
period. The corresponding gain for SC/STs in terms of poverty reduction in West Bengal is just
24.4 percentage points. This is only about half of what Tamil Nadu has achieved. If we look at
the rate of decline in poverty among SC/STs in rural areas between 1993-94 and 2011-12, it is
about 2.3 percentage points per annum in Tamil Nadu. This is higher than Tamil Nadu’s state
average of 2 percentage points per annum for the same period. The comparative figure for West

Bengal is just 1.4 percentage points per annum. Clearly, poverty reduction among SC/STs in
rural Tamil Nadu has been greater than in West Bengal.
Table 3: The Incidence of Poverty (HCR) and Rate of Poverty Reduction (Per Annum) for Socio-Religious
Groups. (Rural)
Social
Group
1993-94 2004-05 2011-12 1993-94 to
2004-05
2004-05 to
2011-12
1993-94 to
2011-12
Tamil
Nadu
West
Bengal
Tamil
Nadu
West
Bengal
Tamil
Nadu
West
Bengal
Tamil
Nadu
West
Bengal
Tamil
Nadu
West
Bengal
Tamil
Nadu
West
Bengal
SC/ST 65.8 51.6 51.2 40.9 24 27.2 1.3 1 3.9 2 2.3 1.4
OBC -- -- 32.6 28.1 13 17.1 -- -- 2.8 1.6 ---
General* 45.6 25.8 22.2 24.3 1.0 15.8 2.1 0.1 3 1.2 2.5 0.6
Hindu 51.3 39.6 38 33.2 16.2 21.9 1.2 0.6 3.1 1.6 1.9 1.0
Muslim 37.3 50.5 18 49.1 1.6 23.9 1.8 0.1 2.3 3.6 2.0 1.5
Other
Minorities 57.0 65.3 36.1 50.0 13.9 19.0 1.9 1.4 3.2 4.4 2.4 2.6
All 51.2 42.5 37.5 38.2 15.8 22.5 1.2 0.4 3.1 2.2 2.0 1.1
Source: Calculated by the author’s using NSS CES unit record data for the respective years.
*General includes OBC population in 1993-94 as the OBC was not counted then, thus can’t be compared across
time
In the sub-periods too, SC/STs have been better off in rural Tamil Nadu than in rural
West Bengal. The rate of decline in poverty among them in Tamil Nadu between 1993-94 and
2004-05 was 1.3 percentage points per annum; and the rate increased to 3.9 percentage points
between 2004-05 and 2011-12. In rural West Bengal, the rate of decline in poverty was 1.0
percentage point per annum among SC/STs in the first period, while the second period witnessed
a decline at the rate of 2.0 percentage points per annum. This is much lower than that of Tamil
Nadu. Though we do not have comparable figures over time for the OBCs, the incidence of
poverty among the OBCs in 2011-12 is 13 percent in Tamil Nadu and the corresponding figure
for the OBCs in West Bengal is 17.1 percent.
Poverty reduction among religious minorities such as Muslims has also been higher in
rural Tamil Nadu than in rural West Bengal. The incidence of poverty among Muslims in rural

Tamil Nadu decreased from 37.3 percent in 1993-94 to 1.6 percent in 2011-12. The
corresponding figures for Muslims in rural West Bengal are 50.5 and 23.9 respectively. The gain
that Muslims have made in poverty reduction in this period is about 35 percentage points in rural
Tamil Nadu and only 26.6 percentage points in rural West Bengal. The rate of decline in poverty
among Muslims in rural Tamil Nadu was 2 percentage points per annum between 1993-94 and
2011-12, while the corresponding figure for Muslims in West Bengal was 1.5 percentage points
per annum. In the first sub-period between 1993-94 to 2004-05, the rate of decline of poverty
among Muslims was 1.8 percentage points per annum in rural Tamil Nadu and the corresponding
rate in West Bengal was a mere 0.1 percentage point. In the second period of 2004-05 to 2011-
12, however, Muslims in West Bengal have fared better. The rate of decline of poverty among
Muslims in West Bengal is 3.6 percentage points per annum; and the corresponding figure for in
Tamil Nadu is about 2.3 percentage points per annum.
Overall, poverty reduction among the historically disadvantaged and marginalised in
rural areas is much higher in Tamil Nadu than in West Bengal.
3.2. Incidence of Urban Poverty, 1994-2012:
The data on incidence of urban poverty and its rate of decline is given in Table 4. Tamil
Nadu has done better than West Bengal on both counts. In the period 1993-94 and 2011-12, the
incidence of urban poverty has come down from 33.8 percent to 6.6 percent in Tamil Nadu. The
corresponding figures for West Bengal are 31.2 percent and 14.7 percent respectively. The gain
that Tamil Nadu made in poverty reduction in urban areas during the period of 1993-94 to 2011-
12 was about 27 percentage points, while West Bengal gained just about 16.5 percentage points.
While West Bengal was in a better position at the beginning of the period mentioned, it has
clearly lost to Tamil Nadu.
The rate of decline of urban poverty has been higher in Tamil Nadu than in West Bengal.
The rate of decline in urban poverty in Tamil Nadu during 1993-94 to 2011-12 is about 1.5
percentage points per annum and the corresponding rate for West Bengal is just 0.9 percentage
point per annum. In the sub-periods too, Tamil Nadu has consistently performed better than West
Bengal. In the first sub-period of 1993-94 to 2004-10, the rate of decline in urban poverty in
Tamil Nadu was 1.3 percentage points per annum. During the sub-period 2004-05 to 2011-12,

this increased to 1.9 percentage points per annum. The corresponding figures for West Bengal
are 0.6 and 1.4 percentage point per annum respectively.
Figure 2: Urban Poverty (HCR) for Tamil Nadu and West Bengal (in Percentage)
3.2.1. Poverty Reduction across Urban Social and Religious Groups:
Tamil Nadu has outperformed West Bengal in reducing urban poverty among the
marginalised and disadvantaged social groups. The incidence of poverty among SC/STs in urban
Tamil Nadu has come down from 54 percent in 1993-94 to 9 percent in 2011-12 (see Table 4).
The corresponding figures for West Bengal are 48.5 and 18.9 percent respectively. In the period
from 1993-94 to 2011-12, SC/STs in urban Tamil Nadu have gained about 45 percentage points
in terms of poverty reduction, while their counterparts in West Bengal gained just 29.6
percentage points. The rate of decline of urban poverty among SC/STs for this period is about
2.5 percentage point per annum in Tamil Nadu and just 1.6 percentage point per annum in West
Bengal.
In the first sub-period (1993-94 to 2004-05), SC/STs did better in Tamil Nadu than in
West Bengal. The rate of poverty decline among SC/ST in urban Tamil Nadu was 1.2 percentage

points per annum while the corresponding figure for urban West Bengal was just 0.6 percentage
points. In the second sub-period (2004-05 to 2011-12) too SC/STs did better in Tamil Nadu than
in West Bengal. The rate of decline of poverty among SC/STs between 2004-05 and 2011-12 in
urban Tamil Nadu was about 4.5 percentage points per annum and that in urban West Bengal
was 3.3 percentage points.
Table 4: The Incidence of Poverty (HCR) and Rate of Poverty Reduction (Per Annum) for Social-Religious
Groups. (Urban)
Social
Group
1993-94 2004-05 2011-12 1993-94 to
2004-05
2004-05 to
2011-12
1993-94 to
2011-12
Tamil
Nadu
West
Bengal
Tamil
Nadu
West
Bengal
Tamil
Nadu
West
Bengal
Tamil
Nadu
West
Bengal
Tamil
Nadu
West
Bengal
Tamil
Nadu
West
Bengal
SC/ST 54 48.5 40.5 41.7 9 18.9 1.2 0.6 4.5 3.3 2.5 1.6
OBC - ..... 17.3 23.6 6.4 17.1 - 1.6 0.9 -
General* 30 22 6.5 13.2 1.8 7.2 2.1 0.8 0.7 0.9 1.6 0.8
Hindu 33.6 27.5 20.1 20.9 7.0 10.9 1.2 0.6 1.9 1.4 1.5 0.9
Muslim 35.4 56.4 19.1 45.7 3.7 35.5 1.5 1 2.2 1.5 1.8 1.2
Other
Minorities 32.9 29.5 16.0 21.4 5.9 1.2 1.5 0.7 1.4 2.9 1.5 1.6
All 33.8 31.2 19.7 24.4 6.6 14.7 1.3 0.6 1.9 1.4 1.5 0.9
As in Table 3
The incidence of poverty among Muslims in urban Tamil Nadu has reduced dramatically
from 35.3 percent in 1993-94 to 3.7 percent in 2011-12. The corresponding figures for Muslims
in Urban West Bengal are 56.4 and 35.5 percent respectively. Poverty reduction among Muslims
between 1993-94 and 2011-12 amounts to 31 percentage points in urban Tamil Nadu while the
corresponding figure for urban West Bengal is 20.9 percentage points. The rate of poverty
decline among Muslims in urban areas in this period was 1.8 percentage points per annum in
Tamil Nadu 1.2 percentage points per annum in West Bengal. By both measures, Muslims in
Tamil Nadu are far better off than their counter parts in West Bengal.
Muslims have fared better in Tamil Nadu in sub-periods as well. The rate of decline in
poverty among Muslims in Tamil Nadu in the period between 1993-94 and 2004-05, was 1.5
percentage points per annum. The rate increased to 2.2 percentage points in the period between

2004-05 and 2011-12. The corresponding figures for West Bengal are 1.0 and 1.5 percentage
points per annum respectively. Muslim in Tamil Nadu outperformed Muslims in West Bengal in
both the measures of poverty However, it needs to be noted that population of Muslims is
substantial in West Bengal as compared to Tamil Nadu.
4. Education and Health Indicators
4.1. Literacy Rate:
Literacy rate (measured for those in the age of 6 years and above) is a key indicator of
educational outcomes. As is clear from Table 5, Tamil Nadu has performed better than West
Bengal on this count. The literacy rate in Tamil Nadu is 81 percent for 2011-12 and 76 percent in
West Bengal. Literacy rate of Male in Tamil Nadu is 87.5 percent and about 82 percent in West
Bengal. Female literacy is also higher in Tamil Nadu than in West Bengal. Female literacy is
about 75 percent in Tamil Nadu and about 70 percent in West Bengal.
Table 5: Literacy Rate by Caste
and Gender ( 6 Years and above)
Caste/ Gender
2011-12
Tamil
Nadu
West
Bengal
Male 87.5 81.9
Female 74.8 70.4
SC/ST 74.8 74.3
OBC 82.4 82.1
GEN 94.2 94.1
Hindu 80.3 79.4
Muslim 86.7 67.0
Other Minorities 86.8 87.3
All 81.1 76.3 Source: Calculated by the author’s using NSS Employment and Unemployment unit record data
The literacy rate among SC/STs and OBCs is about the same in both states. In Tamil
Nadu the literacy rate is 74.8 percent among SC/STs and 82.4 percent among OBCs. The
corresponding figures for West Bengal are 74.3 and 82.1 percent respectively. On this count,

Muslims in Tamil Nadu are better off than in West Bengal. The literacy rate among Muslims in
Tamil Nadu for 2011-12 is about 87 percent as compared to 67 percent in West Bengal. Tamil
Nadu is better placed in literacy rate as compared to West Bengal.
Table 6: Percentage Distribution of Usual Status Workers (Principle + Subsidiary) by Level of
Education across Social Groups (15 to 59 age )
Socio-
Religious
Group
Tamil Nadu West Bengal
Illiterate Upto
Primary
Secondary
& Higher
Secondary
Graduate
and Above Illiterate
Upto
Primary
Secondary
& Higher
Secondary
Graduate
and Above
SC/ST 29.5 29.6 33.6 7.3 33.1 38.6 24.5 3.8
OBC 18.2 27.4 39.0 15.4 15.0 37.2 39.6 8.3
General 3.2 12.2 34.4 50.3 11.0 27.0 42.2 19.8
Hindu 21.3 27.5 37.7 13.4 21.7 33.4 33.6 11.3
Muslim 12.3 32.9 38.3 16.6 39 39.7 18.3 2.9
Other
Minorities 13.4 23.4 36.2 27.0 12.6 27.0 46.8 13.5
All 20.5 27.6 37.7 14.3 26.2 35 29.7 9.1 Source: As in Table 5
4.2. Educational Status of the Workforce:
An educated workforce is a key factor for productivity in any economy. In this respect,
Tamil Nadu has performed better than West Bengal. The percentage of workforce which is
illiterate in Tamil Nadu is about 20 percent for 2011-12 (see Table 6). The corresponding figure
for West Bengal is 26 percent. Percentage of the workforce who is graduates or above in Tamil
Nadu is about 14 percent. The corresponding figure for West Bengal is 9 percent. The percentage
of the workforcewith secondary and higher secondary education is also comparatively higher in
Tamil Nadu. The figure for Tamil Nadu is about 38 percent, as compared to about 30 percent in
West Bengal. Clearly, the workforce in Tamil Nadu is more educated than in West Bengal.
Table 5 provides the distribution of workforce by education across caste groups. The
gains of deprived castes in education have been greater than in Tamil Nadu than in West Bengal.
In 2011-12 about 29 percent of SC/ST workers in Tamil Nadu were illiterates, as compared to 33
percent in West Bengal. The percentage of the SC/ST workforce being graduates and above is
7.3 percent in Tamil Nadu and only 3.8 percent in West Bengal. The percentage of workers

among SC/STs with a secondary and higher secondary education is also higher in Tamil Nadu as
compared to West Bengal.
The level of education of the workforce among the OBCs is also much higher in Tamil
Nadu than in West Bengal. The percentage of workforce in the category of graduates and above
among OBCs in Tamil Nadu in 2011-12 is 15.4 percent as compared to 8.3 percent in West
Bengal. Religious minorities too performed better in Tamil Nadu than in West Bengal. The
percentage of workforce who is illiterate among Muslims in Tamil Nadu is 12.3 percent as
compared to 39 percent in West Bengal.4 The percentage of workforce in the category graduate
and above among Muslims is about 17 percent. This is about five times higher than the
percentage of graduates among Muslims in West Bengal. Overall, the level of education of
workforce among the deprived castes and religious minority groups is much higher in Tamil
Nadu than in West Bengal.
4.3 Health Indicators
Table 7 provides details of basic health indicators including health infrastructure for
Tamil Nadu and West Bengal for 2005-06. Tamil Nadu has outperformed West Bengal in respect
of key health indicators. Infant Mortality Ratio (IMR) for Tamil Nadu stands at 22 as against 32
for West Bengal. The Maternal Mortality Ratio (MMR) and under 5 mortality ratios (U5MR) for
Tamil Nadu are comparatively more favourable. The MMR in Tamil Nadu stands at 97 as
compared to 145 in West Bengal. The U5MR is 25 in Tamil Nadu against 38 of West Bengal.
Life Expectancy Rates are comparable for both states - 67 for male and 71 for female in 2005-06.
Tamil Nadu has performed better in reducing the percentage of children who are
undernourished. Thirty one percent of children were undernourished in Tamil Nadu in 2005-06
as compared to about 45 percent in West Bengal. In terms of key Reproductive and Child health
(RCH) Indicators as well Tamil Nadu has performed better. The following are considered that
topmost priorities of a reproductive and child health programme in India: (i) ensuring safe
4 The Sachar Committee (2006) report too has shown the precarious condition of Muslims in West Bengal. The
report places the state in the worst performing category of states in the country in terms of representation of Muslims
in employment and education. An another report, Status of the Muslims in Bengal 2014, prepared by Social
Network for Assistance to People (SNAP) and Guidance Guild too shows that Muslims have seen no improvement
in the state despite the Sachar committee recommendations and they are still caught in petty, low-income and
livelihoods options in West Bengal.

motherhood and improved child health and (ii) raising contraceptive prevalence rates. Studies
(Sen and Dreze 2013) show that Tamil Nadu has performed better on both counts. Table 7
provides some details on the status of RCH indicators for Tamil Nadu and West Bengal. In
Tamil Nadu, antenatal check up is done in 99 percent cases as compared to 91 percent in West
Bengal. The rate of safe delivery in Tamil Nadu is about 89 percent, while the corresponding
figure for West Bengal stands at a lowly 54 percent. The rate of institutional delivery in Tamil
Nadu is 88 percent; much higher than the 42 percent in West Bengal. The child immunisation
coverage for Tamil Nadu stands at 80.9 percent whereas it is a meagrely 64.3 percent for West
Bengal.
Table 7: Basic Health Indicators (2005-06)
Indicators TN WB All India
IMR (2011) 22 32 44
U5MR (2011) 25 38 55
MMR (2011) 97 145 212
Life Expectancy-Male 67 67 64
Life Expectancy-Female 71 71 67
TFR (2011) 1.7 1.7 2.4
Weight for Age 29.8 38.7 42.5
Height for Age 30.9 44.6 48
Full Immunisation of Child 80.9 64.3 43.5
Safe Delivery 89 54 47.6
Institutional Delivery 88 42 38
Proportioned of births assisted by
Skilled Health personnel 90.6 47.6 46.6
ANC Visits 98.6 91.7 76.4
Post- Natal Check-up 91.3 44.3 41.2
Health Infrastructure
Population for PHC (000) 32.1 37.9 49
PHC with Medical Officer 85.3 80.3 75.8
PHC with Pharmacist 93.9 76.9 69.2
PHC with Functional OT 90.1 25.2 61.3
PHC with Essential Drugs 97.9 43.1 69.6
% of villages with any health facility 61.8 40.1 46.2
Source: Select Socio Indicators, NFHS-3, (2005-06), IIPS and Sample Registration System (SRS), Population
Census.

In the provision of health infrastructure too, Tamil Nadu stands much better than West
Bengal. Population per Primary Health Centre (PHC) is 32,000 in Tamil Nadu as compared to
38,000 in West Bengal. The facilities in PHCs are also better in Tamil Nadu than in West
Bengal. For instance, the percentages of PHCs with medical officer and pharmacist in Tamil
Nadu are 85 and 95 respectively. The corresponding figures for West Bengal are 80 and 77.
Similarly, the PHCs with functional operational theatre (OT) in Tamil Nadu are 90 percent as
compared to an abysmal 25 percent in West Bengal. The PHCs with the provision of essential
drugs in Tamil Nadu is 99 percent as compared to just 43 percent in West Bengal.5
II
5 Possible Explanations
As shown in the earlier sections, there are significant differences in economic growth and
developmental outcomes between Tamil Nadu and West Bengal. Tamil Nadu has outperformed
Bengal. This section tries to locate the difference in the historical setting of the respective states.
To begin with, let me take up the history of land tenurial system and its impact on the political
regime and economic development in each of these states..
5.1 History of Land Tenure and Incentive Structure
As well-known, there were broadly two set of land tenurial system that the British
administration introduced in India. One that had intermediaries between the tenant and the state
was known as the Zamindari system, and the second one that had no such intermediaries was the
Ryotwari system. The colonial Government took less interest in investing in Zamindari areas as
the land revenue was fixed and did not depend directly on the prosperity of the cultivator. The
Zamindars too took little interest in the productivity of land or the condition of cultivators. Banerjee
and Iyer (2005) demonstrate that areas in which property rights to land were given to Zamindars
systematically exhibit lower agricultural investment and productivity as compared to Ryotwari
areas where individual cultivators owned the land. According to the authors, the differential
5The better health outcome in the state is attributed to such provision of free essential drugs in the PHCs. In order to
ensure the availability of essential drugs, Tamil Nadu Medical Services Corporation Ltd., (TNMSC) was set up
adopting a streamlined procedure for their procurement, storage and distribution.

effects of land tenurial system continue to persist even in the post-independence period. They
further argue that infrastructural provisions too have differed based on the land tenurial patterns.
The areas that were under Ryotwari have better infrastructures as compared to Zamindari areas.
While Tamil Nadu was historically under the Ryotwari system, West Bengal was under the
Zamindari system.6
It is argued that the history of land tenure in West Bengal had a negative impact on the
incentive structure for economic activities (Gupta 2012; Banerjee and Iyer 2005). Thus the poor
economic performance of the region is generally attributed to the colonial land tenure policy.
However, what is usually not stated is that the beneficiaries of the system were not only the
British, but the Bengali Badraloks too. As Zamindars, they formed a rentier class and a large
section of them were absentee landlords, living far away from the site of production.
Given their rentier status, they hardly partook in productivist ethos. As Saibal
Gupta argues, “instead of occupying themselves with the question of production, [they] trekked
to Ramkrishna Paramahansa, a spiritual head, who seemed to represent the very opposite...”
(Gupta 2012, p.9). Significantly, the Bengali Badraloks were drawn from upper castes and
continue to dominate the social and political life of the state. Prabhat Patnaik, a known
sympathiser of the parliamentary left, notes, “One reality in Bengal, one of great importance,
scarcely ever gets talked about. This relates to the domination of the Brahmin ‘Boddi’, Kayastha
castes in the intellectual, social, political and cultural life of the state” (Patnaik 2013). He
laments that such domination of castes elite continues to persist even “after 65 years after the
country’s independence” and “three decades of the left rule in the state” (Ibid).7
6 The study by Banerjee and Iyer (2005) shows that of the 11 districts in Tamil Nadu, 9 were under Ryotwari
system, whereas in Bengal all the 11 districts were under the Zamindari system. What is not said is fact that there is
substantial difference in trajectory of development within areas which were under Ryotwari. Therefore, the
differencse in economic outcome cannot merely be attributed to the history of land tenurial system.
7 Arild Ruud (1994) who studied rural West Bengal in detail notes that the left rule in the state did not lead to any
deeper changes in perceptions of power and influence. The caste-based inequality, hierarchy and separateness
continue to persist in rural West Bengal.

As Partha Chatterjee sums it up,
.....the continued and unchallenged dominance of upper-caste hindus in virtually every
public institution, whether political or cultural. In fact, the two features are connected.
That is to say, caste appears to be insignificant in West Bengal’s politics precisely
because public political life is thoroughly dominated by the upper castes (Chatterjee
2012, p.69).
In short, the ruling elite in Bengal neither entertained productivist ethos nor sensitive to caste-
based discrimination. For instance, as Sekhar Bandyopadhyay notes, “In 1980s when the
Mandal Commission first recommended the extension of affirmative action policies to the OBCs,
CPI (M) strongly asserted that there were no OBCs in West Bengal and in their province
‘backwardness’ should be defined in terms of class rather caste, because caste did not matter in
Bengal” (Bandyopadhyay 2014, p. 34). This leaves us with the question of why the left took up
the question of land reform, despite lacking in productivist ethos.
Land reform in West Bengal is generally attributed to the CPI (M) (Mishra2007).
However, it could be argued that given the history of peasant movement in the region
independent of the left, the land question assumed centrality in political and policy regimes. The
political elite in the state had no option but to respond to the land question. As Bardhan and
Mookherjee (2003) suggests, the electoral competitiveness is the main driver of land reform in
the state. They further point out, as the CPI (M) assumed complete electoral control, there was
slack in implementation of the programme.8
8 Contrary to the popular perception that Tamil Nadu has large holdings and land reform had little effect in the state,
the state has seen the disappearance of large land holdings in the last four decades. For instance, in 1971-72, large
land holdings account for 10 per cent of the total area and it has come down to nil in 2003. However, what is
persisting in Tamil Nadu is medium size holding which accounted for 23 percent of the area in 1971-72 and
continue to be 20 percent in 2003. In West Bengal, since 1971-72, the land ownership has gradually shifted from
medium size holdings to marginal holdings. For instance, the medium size holdings accounted for about 19 percent
of area in 1971-72 and it has come down to 4 percent in 2003. The corresponding figures for marginal holdings are
27 and 58 percents respectively. For further details see the NSSO (2003) report no. 491.

Gupta (2005) argues that in Ryotwari regions, the social movements were occupied in
addressing the operational aspect of development and production since the incentive structure of
production has been embedded in their cognitive world. He further argues that anti-caste and
anti-Brahmin moments have focussed on development and industrialization. In the process,
they also developed a sense of collectivity and sub-national identity. According to him, the sub-
national identity and incentive structure for production together contributed to the development
of these regions..
The Justice Party which emerged in the early twentieth century and countered the
Brahmin domination in the socio-economic life of the Tamil region, was informed, for instance,
by productivist ethos. For instance, Thegaraya Chetti, a founding member of the Justice Party,
wrote,
We all know that Bombay is the premier of city of India! What was the cause of this
greatness? It is not the Sanskrit literature, it is not the world-admired Shankara’s
philosophy, and it is not the political greatness that we are hankering after, which has
Bombay so great. It is enterprise---the enterprise of a small community of settlers, the
Parsees (cited in Pandian 2006, p.163).
The party also gave importance of industry oriented education. For instance, Thegaraya Chetti
argued that the colonial education system was only fitted to make “automatic quill-drivers,
indifferent school-masters and petti-fogging lawyers... there is no such thing as education
suitable to the development of industries" (Ibid, pp.163-164).
In addition, Tamil Nadu aligned its lower caste politics with a sub-national identity
based on developmentalism. For instance, C.N. Annadurai, a founding member of the DMK,
speaking in the Rajya Sabha in 1962, invoked the Southern Question in Italy to seek economic
advancement of the Tamil region:
For the information of the house I may say, that the very same problem arose in Italy.
Southern Italy was industrially very backward compared to Northern Italy and then the
Italian Government took very intelligent, very bold and very radical steps formulating a
special scheme for Southern Italy. They offered tax concessions for new industries to be
started in Southern Italy. They gave loans and other aids for this purpose in order to
improve this part of Italy (Ramachandran 1975, pp. 103-104).
Further, unlike in West Bengal where the village and rural development has been romanticised,
in Tamil Nadu, the village was ideologically seen as the site of oppression and the urban as
liberative. E.V Ramasamy a.k.a Periyar, the founder of the non-Brahmin Self-Respect
Movement and Dravidar Kazhagam, saw the village reconstruction of Gandhi as a political
strategy to arrest the masses within traditional, caste-bound geographical spaces (Aloysius 2013,
p .6). As Aloysius sums up,
Periyar sees the village as a sort of geographical lower caste destined to serve the ‘upper
caste towns’. The call for the renewal of traditional occupation, Periyar pointed out, is
closely linked to Gandhi’s articulated bias towards Varnasramic, that is non-egalitarian
social order (Aloysius 2013, p. 7).
This understanding continues to inform lower caste aspirations in Tamil Nadu.
5.2 Political Regimes
5.2.1 Populism in Tamil Nadu:
As Narendra Subramanian argues, populism took two forms in Tamil Nadu from the
1960s onwards, i.e. with the Dravidian parties gaining political power in the state. The first one
is called ‘assertive populism’, and it is defined as:
Assertive populism urges supporters towards militant action to open up hitherto
restricted spheres; and creates entitlements to education, jobs, loans, subsidized
producer goods and sometimes small pieces of property. Due to the scarcity of such
goods, they are usually rationed (perhaps through preferential policies) but not
granted freely to all. Groups with some social power, albeit modest, are best able to
compete for these entitlements… (Subramanian 1999, p. 376).
Primarily, assertive populism was practiced by the DMK and it took the form of a)
extending admission to higher education and government jobs to the OBCs and SCs, and b)

expanding the number of castes eligible for the same. In short, it took the form of expanding the
scope of affirmative action. This has socio-economic consequences for the lower castes.
The second form that populism took in Tamil Nadu is characterized as ‘paternalistic
populism’, and it is defined as follows:
Paternalist populism promises that a benevolent leader, party or state will provide
the poor and powerless with subsidized wage goods and protection from repressive
elites. The lower strata and women, often unable to assert themselves independently
or compete for the more substantial benefits assertive populism provides, are its
main supporters (Ibid).
Such populism was primarily practiced by the political rival of the DMK, i.e., the
AIADMK under the leadership of the charismatic M.G. Ramachandran. A good example of
paternalist populism was the Noon Meal Scheme introduced by the AIADMK in 1982.
According to Andrew Wyatt, ‘The noon meals enhanced MGR’s image as the protector of
children, women and the poor.’ In addition, the AIADMK government also expanded food
subsidies and increased the number of ration shops so that the rural poor got better access to this
benefits' (Wyatt, 2013, p. 6).
While paternalist populism is primarily part of the politics and policies of the AIADMK,
the DMK too did not fully avoid such populism in formulating and implementing policies.
Giving an account of the DMK’s policy regime in the late 1960s, Wyatt writes: ‘Slum clearance
was accelerated, subsidised rice was provided in selected urban areas’, and not only this‘ college
fees were waived for poorer students and prohibition' were‘ introduced to protect women from
the consequences of over-consumption of alcohol by male members of the household' (Ibid, p.
5). Competing with the AIADMK, the DMK shifted over time its emphasis from assertive
populism to paternalist populism.
The significance of such persistence of paternalist populism (even in the context of neo-
liberalism) points to the fact that when state paternalism becomes the dominant expectation of
the electorate, it becomes difficult for competing political regimes to deviate from such policies.
In other words, paternalistic policies acquire path dependency over time.

The competitive populism between the two rival parties has yielded a space for
independent social movements to make specific demands. Different socially disadvantaged
groups could ask for their share of resources from the state. The parties in the power have to
respond to such demands. For example, the Pattali Makka Katchi (PMK), a party of Vanniars, an
intermediate backward caste faced with socio-economic stagnancy, hit the streets in September
1987 seeking 20 per cent exclusive reservation in Government jobs and education (Pandian
1994). The DMK, which was in power then, had to yield to the demands of the PMK. It
introduced the compartmental reservation by setting apart a substantial 20 per cent for the most
backwards and de-notified communities out of the overall BC reservation of 50 per cent.
To give another example, in 1997, based on the recommendation of the central
Government, the Government of Tamil introduced the policy of targeted PDS and made it
available only to those families identified as living below the poverty line. The policy was
withdrawn within a week due to wide spread protest across the state and the Government had to
reintroduce the policy of universal coverage PDS ( Srinivasan 2010).
5.2.2 Party-Society of West Bengal:
The possibility of such mobilisation from below by multiple social groups was more or
less absent in West Bengal. As stated earlier, Dwajpayan Bhattacharya (2010) argues that party-
society is a specific form of political society operating in rural Bengal. Party-society has its roots
in the peasant movements of rural West Bengal. Historically, the peasants in the region, given
the Zamindari system, offered militant struggles against landlords. Given the specific historical
and socio-economic condition in the state, the left parties offered the leadership to such
struggles. The peasants were also in need of a strong and coherent “vanguard” party to counter
the brutality of landlords. In this context, the left led by CPI (M) gained ascendancy in rural
West Bengal and was elected to power in 1977. In addition to the land question, the party
intervened in local issues faced by the poor and underprivileged. In the process, the party started
playing an active role in every aspect of social life ranging from the panchayat to the school,
from the sports clubs to the family. In essence, the party monopolised the social space of rural
West Bengal.
However, the party did not attempt to end the extant exploitative social and cultural
practices but accommodated them carefully in its structure. Rather than attempting to address

different identities such as casteand religion, the party rendered them invisible in the organised
domain of politics.
However, Dwajpayan Bhattacharya argues that the party-society as a category is not
applicable to urban West Bengal. He argues that unlike in rural areas, where political parties
monopolise the social space and other competing channels of public transaction are virtually
non-existent, the urban West Bengal has the wide presence of competing civil society
organisations. This claim may not be true. For instance, Raka Ray (2000) through intensive field
work convincingly shows that independent of civil society organisations occupy a marginal
space in Kolkata and are in great difficulties to function without the political party’s patronage.
Her work compares two metropolitan cities, namely, Kolkata and Mumbai, and compares the
functioning of women’s organisations there. Ray characterises Kolkata city as a 'hegemonic
political field' with long and strong hold of CPI (M) where power is concentrated and culturally
hegemonic. Mumbai is seen as a 'fragmented political field' where power is fragmented and
culture is pluralistic. She attributes that the absence of independent women’s movement in
Kolkata to the hegemonic political field of CPI (M). On the other hand, she finds vibrant
independent women’s movement in Mumbai where the political field is fragmented and
pluralistic. She also argues that the political field sets the limits to the demands that an
independent movement can make in Kolkata. In other words, the demands of independent
women’s movements have to be in congruent with that the politics of political field.
To understand how populism in Tamil Nadu and party-society in West Bengal works on
the ground, I provide the case study of public distribution system (PDS). The PDS is seen as an
important achievement of populism in Tamil Nadu. On the contrary, in West Bengal, the
functioning PDS is said to have unravelled the fault lines in party-society.
5.2.3 A Case study of PDS:
The PDS is considered to be a source of income support and social protection in India.
The functioning of the PDS in Tamil Nadu has been acknowledged for its efficiency and
inclusiveness (Dreze and Sen 2011).The state has been maintaining universal PDS while most
other states including West Bengal have gone for targeted PDS since 1997. A recent study by
Khera (2011b) shows that the PDS in Tamil Nadu, as compared to other states, has performed

better or even topped in terms of degree of inclusiveness, integrity of the system, quality of PDS
grain, physical access (distance and time), predictability, reliability, record-keeping and
institutional arrangements. The PDS in Tamil Nadu provides 35 kg rice per month for Antyodaya
Anna Yojana card holders and 20 kg rice per month for other call holders free of cost since 2011
(Alamu 2011).
In contrast to Tamil Nadu, PDS in West Bengal is exclusionary and functionally
inefficient (Khera 2011a). According to Reetika Khera, West Bengal falls under the category of
languishing states which does not meet average per capita purchase of even 1 kg a month. The
per capita purchase of PDS grain in West Bengal is low. Tamil Nadu, on the other hand, has a
higher per capita PDS consumption and highest per capita rice purchase from PDS by
consumers. For instance, in 2007-08, the per capita rich purchased per month from the PDS in
West Bengal is 0.4 kg in rural and 0.14 kg in urban areas. The corresponding figures for Tamil
Nadu are 4.84 kg and 3.19 kg (Khera 2011a).
Figure 3 - Estimated Diversion of Food Grain
Source: Khera, Reetika (2011)

Further, Tamil Nadu has a diversion rate (the proportion of grain that does not reach beneficiary
households) of 4.4 percent; one of the lowest among the states compared. The diversion rate in
West Bengal is as high as 75 percent, a sign of the party-society at work (see figure 3). The study
further shows that large percentage of the poorest in West Bengal do not get any subsidised grain
due to poor coverage and the exclusionary nature of targeted PDS.
The political commitment nurtured through paternalist populism coupled with public
pressure from below ensures effective and transparent functioning of PDS without much leakage
or corruption in Tamil Nadu (Srinivasan 2010). In contrast to the populism of Tamil Nadu, the
party-society provides little scope for challenging the corruption and ensuring the effective
functioning of PDS in rural West Bengal.
In congruence with macro data, the field studies too show wide spread prevalence of
corruption and ineffective delivery of PDS in West Bengal (Bhattcharya and Rana 2008). It is
argued that the protest against the mal-functioning of PDS was the precursor to the massive
violence that took place across rural West Bengal in 2007. Bhattarcharya and Rana (2008)
provide detailed field-based evidence as to how the ration dealers allegedly misbehave with the
poor; cheat them in weight and quality of food grains. Unlike Tamil Nadu, the fair price shops
are run by private dealers in West Bengal. The dealers work in close nexus with the local
panchayat bodies, most often controlled by the left. For instance, when villagers in Bhankura, a
district dominated by CPI (M), mobilised themselves against corruption in the PDS, the protest
became violent; villagers assaulted the dealers and ransacked their property and houses.
Similarly, in 2007, in a village in Swarupnagar block, North 24-Paraganas district,
villagers gathered front of the fair price shop confronting the dealer for missing ration stocks. A
filed report sums up the incident thus,
The villagers' anger and resentment at perceived manipulation by the dealers spills out as
they talk about how they have often been overcharged for ration cards and food grains,
had irregular access to PDS provisions, and been bullied by dealers who, once poor like
them, are now living in big concrete houses and driving around in cars (Mitra, 2007).

The party-society in West Bengal thus stifled the possibilities of mobilisation from below which
could guarantee efficiency, a necessary condition to reach developmental goals.
Conclusion
This paper shows that Tamil Nadu has outperformed West Bengal in terms of both
economic growth and distributive measures. Growth in Tamil Nadu has been more socially
inclusive than growth in West Bengal. The legacy of land tenurial systems introduced by the
colonial Government has been a factor in setting the path for development in these regions. As
the infrastructural provisions and incentive structure in production differed on the basis of
tenurial system, the paths for political regime also differed. The political regime that came into
being in Tamil Nadu was distinctly influenced by productivist ethos and lower caste/class
leadership. Its populism installed a complementary policy structure, such as public provision of
certain basic services, which in turn facilitated the process of industrialisation in Tamil Nadu.
West Bengal, on the other hand, could not break the path set by the history, though under
the left rule for three decades. The regional elite, despite being left of some kind, lacked
productivist ethos needed for industrialisation and redistribution. Half hearted land reform is the
best that Bengal’s predominantly upper-caste political elite could do. Disconnected from
production and organised in a strong vanguard structure, Bengal’s political elite erected a ‘party-
society’ which hardly allowed space for independent mobilization of direct producers.
Thus, history and political regimes together produced a specific policy structures that set
the paths of differential development of these two states.
(The ideas for the paper emerged from my conversations with M.S.S. Pandian. The
discussions with Vijaya Baskar, Shantanu Chakravarty, Vanessa Chishti, Santosh Mehrotra, and,
Atul Sood were useful in formulating arguments. Manjoj Jatav took time off in helping to
produce maps. I am thankful to all of them).

Reference
Alamu (2011), ‘It Just Works in TN’, The Hindu, 24 September.
Aloysius,G (2013): Village Reconstruction (New Delhi: Critical Quest)
Arooran, Nambi K. (1980), Tamil Renaissance and Dravidian Nationalism, 1905-1944 (Madurai:
Koodal Publishers)
Bandyopadhyay, Sekhar (2014): Does Caste Matter in Bengal? Examining the Myth of Bengali
Externalism in Mridula Nath Chakraborty (2014): Being Bengali: At Home and in the
World (New York: Routledge)
Banerjee, Abhijit and Iyer, Lakshmi (2005), History, Institutions, and Economic Performance:
The Legacy of Colonial Land Tenure Systems in India, The American Economic
Review, Vol. 95, No. 4, pp. 1190-1213.
Bardhan, Pranab and Mookherjee, Dilip (2005) Political Economy of Land Reforms in West
Bengal 1978-98, Institute for Economic Development, Boston University.
Bhattacharyya, Dwaipayan and Rana, Kumar (2008): “Politics of PDS Anger in West Bengal”,
Economic & Political Weekly, 2 February, pp. 63-69.
Bhattacharyya, Dwaipayan (2010): “Left in the Lurch: The Demise of the World’s Longest
Elected Regime?” Economic & Political Weekly, 28 January, Vol. XLV, No. 3, pp. 51-
59.
Chandrababu, B.S. (1993), Social Protest and Its Impact in Tamil Nadu (Madras: Emerald
Publishers.
Chatterjee, Partha (2004): The Politics of the Governed: Reflections on Popular Politics in Most
of the World (Delhi: Permanent Black).

- (2012): Historicising Caste in Bengal Politics, Economic & Political Weekly, 15
December, Vol. XLVII, No. 50, pp. 69-70.
Dreze and Sen (2011): Putting Growth in Its Place, Outlook, and November 14.
Dreze, Jean and Sen, Amartya (2013): “Uncertain Glory: India and Its Contradictions”
(Princeton N.J.: Princeton University Press).
Gupta, Shaibal (2013): “Economic History of Bengal Presidency”, Asian Development Research
Institute (ADRI), Patna.
Harriss, John (1999): Comparing Political Regimes across Indian States, Economic & Political
Weekly, 27 November, pp. 3367-3377.
Khera, Reetika (2011a): “Trends in Diversion of Grain from the Public Distribution System”
Economic & Political Weekly, 21 May, Vol. XLVI, No. 21, pp. 106-114.
- (2011b): "Revival of the Public Distribution System: Evidence and Explanations”,
Economic & Political Weekly, 5 November, Vol. XLVI, No. 45, pp. 36-50.
Kohli, Atul (1987): The State and Poverty in India: The Politics of Reform, (India: Cambridge
University Press).
Mishra K.Surjya (2007): On Agrarian Transition in West Bengal, The Marxist, Vol.XXIII, NO.2.
Mitra Nandini, Maureen (2011): “PDS protests in West Bengal”, Down To Earth, 30 November.
Patnaik, Prabhat (2013): “In the long Run- the Social Divide in Bengal”, The Telegraph, 30 July.

Planning Commission (2009): “Report of the Expert Group to Review the Methodology for
Estimation of Poverty”, (New Delhi: Planning Commission, Government of India).
- (2013): “Poverty Estimates for 2011-12”, (New Delhi: Planning Commission,
Government of India).
Ramachandran, S. (1975), Anna Speaks: At the Rajya Sabha 1962-66 (New Delhi: Orient
Longman).
Ray, Raka (2000): Fields of protest: Women's movements in India (New Delhi: Kali for Women)
Ruud, Arild E (2003): Poetics of Village Politics: The Making of West Bengal’s Rural
Communism (New Delhi: Oxford University Press).
Srinivasan, Vivek (2010), ‘Understanding Public Services in Tamil Nadu: An Institutional
Perspective’, Ph.D dissertation, University of Syracuse, New York.
Subramanian, Narendra (1999): Ethnicity and Populist Mobilization: Political Parties, Citizens
and Democracy in South India, (New Delhi: Oxford University Press).
Tillin, Louise (2013): “Varieties of State-Capital Relations in India”, Economic & Political
Weekly, 28, September, Vol. XLVIII, No.39, pp. 19-22.
Vijayabaskar, M (2010):” Saving Agricultural Labour from Agriculture: SEZs and Politics of
Silence in Tamil Nadu”, Economic & Political Weekly, Vol. XLV, No.6, pp. 36-43.
Wyatt, Andrew (2013): “Combining Clientelist and Programmatic Politics in Tamil Nadu, South
India”, Commonwealth and Comparative Politics, No.51/1, pp.27-55.

Annexure I


