
1
Polymorphism of poly(nonamethyleneoxamide)
crystal
Tomoyuki Nakagawa a,b *
, Koji Nozaki b, Shuichi Maeda
a, Takashi Yamamoto
b
a Organic Specialty Materials Research Laboratory, Ube Industries, Ltd., Ube, Yamaguchi 755-
8633, Japan
b Department of Physics, Graduate School of Science and Engineering, Yamaguchi University,
Yamaguchi 753-8512, Japan
*Corresponding author. Organic Specialty Materials Research Laboratory, Ube Industries, Ltd.,
Ube, Yamaguchi 755-8633, Japan
Tel.: +81-836-31-1746
E-mail address: [email protected] (T. Nakagawa).

2
Abstract
The crystal structures of poly(nonamethyleneoxamide) (nylon-9,2) were investigated by
wide-angle X-ray diffraction (WAXD) and differential scanning calorimetry. Nylon-9,2 shows a
polymorphism with two different structures depending on the conditions of sample preparation.
Monoclinic form I is the dominant crystalline phase for the solution-crystallized sample. For
melt-crystallized samples, form I and new monoclinic form I′ coexist. Variable-temperature
WAXD measurements were used to investigate the stability of each crystal form and the phase
transition. Form I does not undergo any phase transitions prior to melting, although the
orthorhombic molecular chain packing in form I at low temperature comes close to the quasi-
hexagonal one during the heating process. Form I′ shows no phase transition on heating until its
melting, too. The crystal lattice simply expands due to the thermal expansion. Form I is believed
to be more stable, because the melting temperature of form I is higher than that of form I′.
Keywords: polyoxamide, polymorphism, crystal structure, wide-angle X-ray diffraction
1. Introduction
Polyoxamides (-NH-R-NH-CO-CO-) have excellent properties such as high melting
points, high modulus, and low solubility in engineering plastics. In their molecules, oxamide
groups consist of two amide bonds, therefore polyoxamides are classified as nylon-x,2 materials.
The crystal structures of even and odd polyoxamides have been compared with even-even nylons
and odd-even nylons, respectively.
The crystal structures for aliphatic nylons have been widely investigated [1-5]. Generally,
the form appears in the crystals of even-even nylons [1,6]. The crystal structure of the form
3
constructed by the stacking of the molecular sheets composed of hydrogen-bonded molecular
chains in the fully extended planar zig-zag conformation. X-ray diffraction pattern of the -form
is characterized by two strong Bragg reflections that appear at d-spacings close to 4.4 and 3.8 Å.
These d-spacings correspond to the inter-chain distances within and between the molecular
sheets, respectively. For the odd-even and even-odd nylons, on the other hand, only the amide
groups can partially establish hydrogen bonds within the molecular sheets. It was reported by
Kinoshita [7] that these nylons seems to primarily crystallize into the -form, in which amide
groups tilt with respect to the chain axis and form complete hydrogen bonds in the molecular
sheets. While, the existence of the crystalline phase similar to the -form have been reported for
various aliphatic nylons containing methylene segments with odd numbers, such as nylon-5,6
[8,9], nylon-5,10 [10], nylon-9,2 [11], nylon-6,5 [12], nylon-12,5 [13], and even-odd nylons
derived from undecanedioic acid [14]. The wide-angle X-ray diffraction (WAXD) patterns of
these nylon crystals give two strong Bragg reflections at d-spacings ca. 4.4 and 3.7 Å, which are
similar to those of the -form of even-even nylons [1,2].
In the case of even polyoxamides, the crystal structures of nylon-4,2 [15], nylon-6,2
[16,17] nylon-8,2 [16], nylon-10,2 [16], and nylon-12,2 [16,18] were studied by means of wide-
angle X-ray diffraction (WAXD). The WAXD patterns of the crystals of these polyoxamides
show two characteristic Bragg reflections at d-spacings of 4.5 and 3.7 Å, similar to the -form of
even-even nylons. While for odd polyoxamides, only the crystal structure of nylon-9,2 has been
determined by using the X-ray fiber diffraction pattern [11]. The typical d-spacings of the α-form
are found in the WAXD pattern of nylon-9,2 crystal despite of odd-even nylon. We call here this
crystalline phase of nylon-9,2 “form I”. Figure 1 shows the crystal structure of form I of nylon-
9,2 reported by Franco, et al [11]. In form I of nylon-9,2, the chains are in all-trans conformation,

4
and the torsion angle C(O)-N(H)-C(H2)-C(H2) is about 155°, which allows hydrogen bonds
between neighboring chains to be formed. Consecutive oxamide planes (-NH-CO-CO-NH-) tilt
out of the plane in opposite senses and form two types of hydrogen bonds in different directions.
As a result, nylon-9,2 shows an orthorhombic molecular chain packing in form I (Fig. 1(a)).
(a)
(b) (c)
Figure 1. Crystal structure of form I of nylon-9,2
reported by Franco, et al [11]. (a) Projection along the
c-direction, (b) Projection along the b-direction. (c)
Projection along the a-direction. Solids pink lines
indicate the unit cell and hydrogen bonds are indicated
by dashed lines. Color code: nitrogen: blue; oxygen:
red; carbon: black; and hydrogen: gray. Orthorhombic
molecular chain packing in the ab-plane can be found
in (a).

5
As noted above, it have been reported that nylon-9,2 crystallizes into the -like form
(which we call form I) in spite of odd-even nylon [11]. Generally, other odd-even nylons have
another crystalline form, the -form. The existence of neither the -form or other polymorphs
have been reported for nylon-9,2. The aim of this study is to investigate the polymorphism of
nylon-9,2. In this study, we prepared the oriented fiber, solution-crystallized, and melt-
crystallized samples. The crystal structures of the nylon-9,2 samples are investigated by WAXD
and differential scanning calorimetry (DSC). Firstly, we will confirm that only form I exists in
the oriented fiber sample as previously reported [11]. Then, we will show that nylon-9,2 crystal
have a new crystalline phase which is different from form I (-like form) for both solution-
crystallized and melt-crystallized samples. The crystal structures of the polymorphs of nylon-9,2
and their temperature dependence will be discussed.
2. Experimental
2.1. Synthesis and preparation
Nylon-9,2 was synthesized by polycondensation of 1,9-nonamethylenediamine and
dibutyl oxalate according to the two-step synthesis method previously reported [11,16]. 1,9-
nonamethylenediamine and dibutyl oxalate were supplied from Ube Industries, Ltd (Ube, Japan)
and Kuraray Co. Ltd (Tokyo, Japan), respectively. The intrinsic viscosity of the polymer was
determined using an Ubbelohde viscometer in sulfuric acid (96% wt/wt) at 25 ± 0.1 °C, and was
determined as 1.23 dL/g. The synthesized polymer was dried at 110 °C for 12 h in a vacuum and
used for sample preparation or measurements.
A sheet with 1 mm thickness was prepared by compressing the molten polymer at 280 °C
and then immediately quenching it in an ice-water bath. The sheet was elongated to 200% of its
6
initial length at 200 °C and annealed at the same temperature for an hour in order to give the
oriented fiber sample. The solution-crystallized sample (SCS) was obtained from dilute solution
(0.05% (w/v)) in 1,4-butanediol. The polymers were dissolved in the solvent at 200 °C and
crystallized at 150ºC for 2 h. The melt-crystallized sample (MCS) was prepared at 235 °C for 24
h in a glass tube with a diameter of 5 mm.
2.2. WAXD measurement
WAXD patterns of a fiber sample were recorded on cylindrical films for 12 h at room
temperature. Ni-filtered Cu-K radiation (wavelength = 1.542 Å) from an X-ray generator
(Rigaku RAD IA) operating at 35 kV and 20 mA was used. The camera diameter (R = 35.01
mm) was calibrated from the Bragg peaks of Si standard powder.
WAXD patterns of the SCS and MCS were recorded for 5 min using Bruker AXS
DIP220 with monochromatic Cu-K radiation (40 kV, 250 mA). A two-dimensional detector
(imaging plate system) was used. The sample was held in the sample holder of a copper-block
furnace and covered with polyimide films. The temperature of the sample was controlled with a
PID controller within ±0.1 °C. WAXD patterns were recorded on the imaging plate with an
exposure time of 5 min at different temperatures. The intensity-2 profiles were obtained from
the two-dimensional WAXD profiles.
2.3 Differential Scanning Calorimetry
The thermal behavior of MCS was investigated by differential scanning calorimetry
(DSC) with Rigaku DSC8320 apparatus at a scanning rate of 10 °C/min in nitrogen atmosphere.

7
A small amount of sample (1.5–2 mg) was used for the DSC measurements. The temperature of
the calorimeter was calibrated using the melting temperature of an indium standard.
3. Results and Discussion
3.1. WAXD pattern of the oriented fiber sample
The WAXD pattern of the oriented fiber sample was measured to investigate the
crystalline form. Figure 2 shows the observed WAXD pattern of the oriented fiber of nylon-9,2.
Two intense Bragg reflections are found at d-spacings of 4.21 Å and 3.63 Å (reflection peaks 3
and 6, respectively) on the equatorial line. These d-spacings are typical for -form of even-even
nylon. Furthermore, a strong Bragg spot appears at a d-spacing of 11.46 Å. These three
reflections were also confirmed by previous WAXD measurement of the oriented fiber sample of
nylon-9,2 [11]. Therefore, it is concluded that the fiber sample prepared in this study is also in
form I similar to that prepared by Franco, et al. The observed d-spacings (dobss) of the Bragg
reflections are listed in Table 1. The reflections are initially indexed by using the monoclinic unit
cell parameters determined in previous work [11] as listed in Table 1. The lattice constant is
determined using the dobss as a = 5.29 Å, b = 8.56 Å, c = 29.54 Å, = 50 .9°; these values are
approximately the same as those reported in previous work by Franco, et al [11]. The dobs values
nearly agree with the calculated d-spacings (dcals) using the determined lattice constants listed in
Table 1. Extinction condition for space group C2/c determined by Franco, et al. is also
conformed. Therefore, it is concluded that only form I exist in the oriented fiber sample.

8
No. dobs / Å dcal / Å Index
1 11.46 s 11.46 0 0 2
2 5.76 m 5.73 0 0 4
3 4.21 s 4.28 0 2 0
4 4.05 m 4.05 1 1 6
5 3.85 m 3.73 0 2 3
6 3.63 s 3.70 1 1 0
7 3.30 m 3.38 1 1 8
8 3.14 m 3.13 0 2 5
Figure 2. WAXD pattern of the oriented fiber of
nylon-9,2. Eight major Bragg reflections numbered 1-8
are observed and listed in Table 1.
Table 1 Observed and calculated d-spacings of the
nylon-9,2 oriented fiber. Abbreviations denote
intensities: s: strong and m: medium.

9
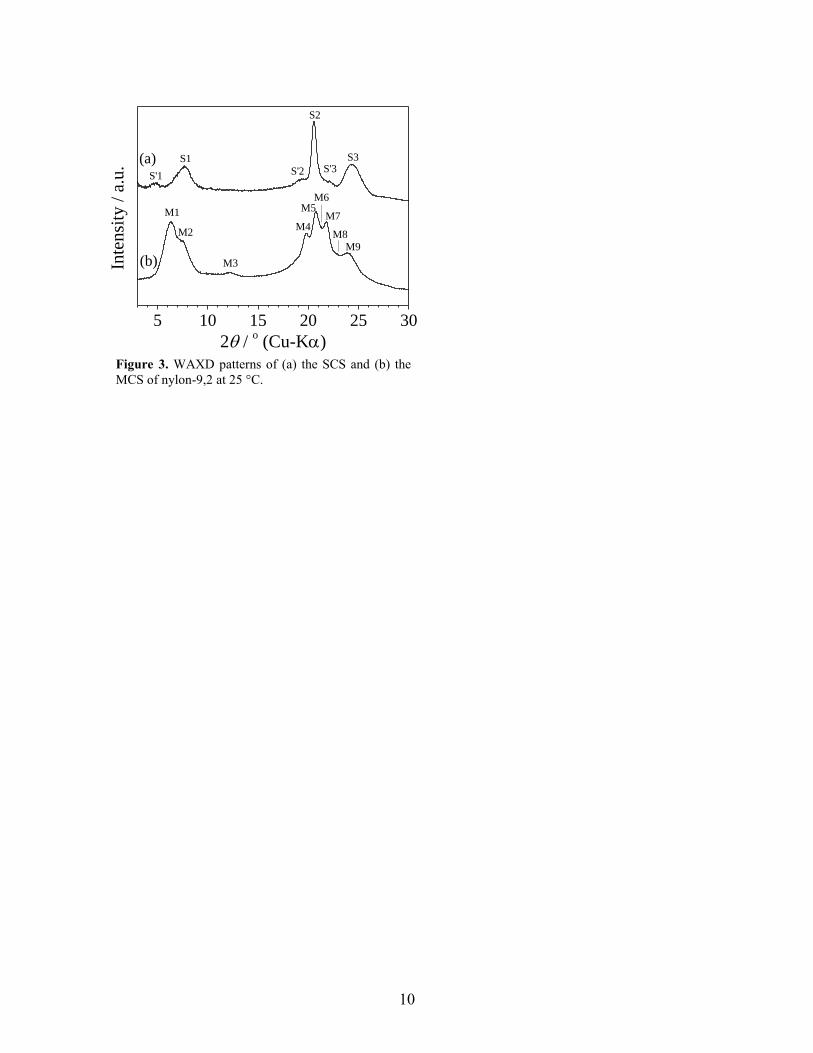
3.2. WAXD patterns of the SCS and MCS
Figure 3(a) shows the WAXD pattern of the SCS. The intense three Bragg reflections are
observed at 2 = 7.92° (S1), 20.85° (S2), and 24.66° (S3). The d-spacings of them are 11.16 Å,
4.26 Å, and 3.61 Å, which approximately correspond to the d-spacings of the 002, 020, and 110
Bragg reflections of form I, respectively. Therefore, the main crystalline phase of the SCS is
considered to be form I. These reflection data are listed in Table 2. Reflections Sʹ1, Sʹ2, and Sʹ3
in Fig. 3(a), which cannot be indexed as form I, are also observed for the SCS. According to the
previous study [11], the authors pointed out that the reduced number of chain repeat units in the
lamellar thickness may contribute to the reflection Sʹ1. It is therefore not a Bragg reflection peak.
We believe that reflections Sʹ2 and Sʹ3 around the 020 reflection of form I are identified as
amorphous halo and Bragg reflection of different crystalline form, as will be discussed later.
Figure 3(b) shows the WAXD pattern of the MCS, which is clearly different from that of
the SCS. Observed Bragg reflections are listed in Table 2. The observed d-spacings were
calculated using the peak positions of Bragg reflections obtained by peak separation of the
WAXD pattern. Reflections M2, M5, and M9 in Fig. 3(b) are identified as the 002, 020, and 110
reflections of form I, respectively. However, the reflections except M2, M5, and M9 cannot be
indexed by using the lattice parameters of form I. This result indicates that additional crystalline
form, other than form I, crystallize in the MCS. Although the detail will be shown later, this
additional crystalline phase is defined as form Iʹ in this study.
10
5 10 15 20 25 30
(b)
S'3S'2
S3
S2
S1
S'1
M9
M8
M7
M6M5
M4
M3
M2
Inte
nsi
ty /
a.u
.
2 / o (Cu-K)
M1
(a)
Figure 3. WAXD patterns of (a) the SCS and (b) the
MCS of nylon-9,2 at 25 °C.

11
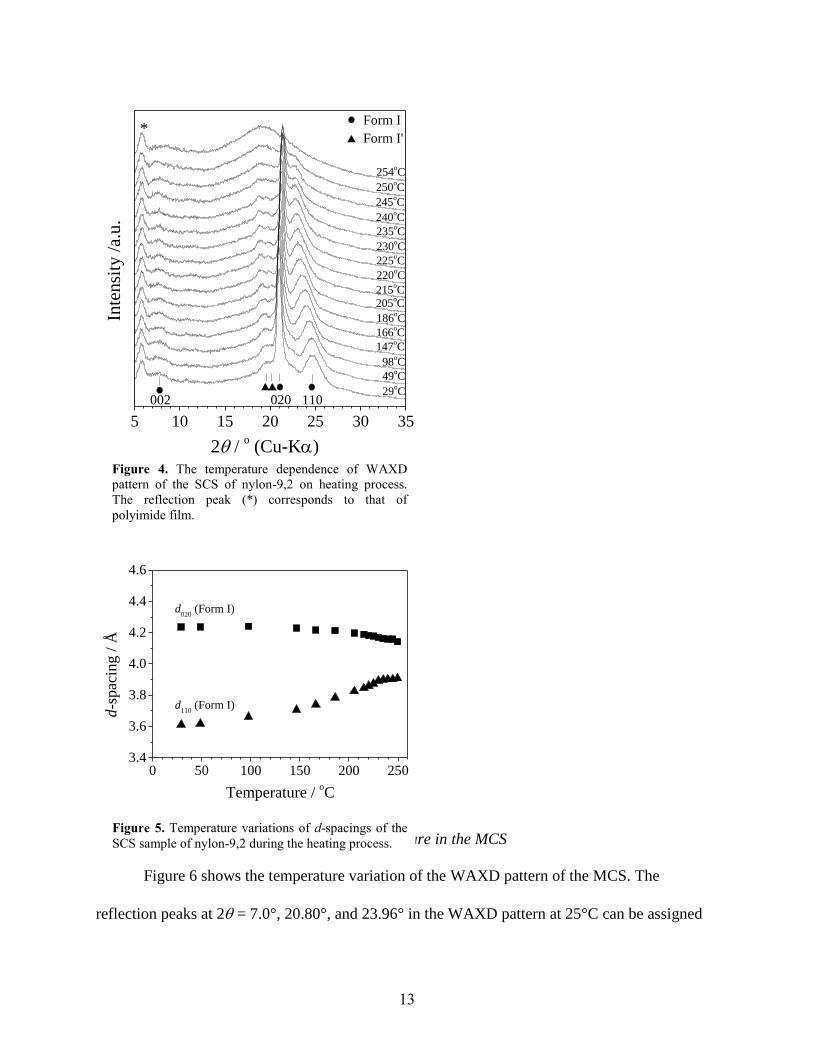
3.3. Temperature variation of the crystal structure in the SCS
The temperature variation of the crystal structure in the SCS is investigated by WAXD.
Figure 4 shows the temperature dependence of the WAXD patterns of the SCS upon heating. The
peak position of the 002 reflection of form I does not change until melting. While, the 020 and
110 reflection peaks shift to higher scattering angle and the lower scattering angle, respectively.
Temperature dependences of the d-spacings, d020 and d110, of the SCS are shown in Fig. 5. As
SCS MCS
Reflection
No.
dobs
[Å]
hkl
Crystalline
phase
Reflection
No.
dobs
[Å]
hkl
Crystalline
phase
M1 14.47 Form I′
S1 11.16 0 0 2 Form I M2 11.60 0 0 2 Form I
M3 7.22 Form I′
M4 4.49 Form I′
S2 4.26 0 2 0 Form I M5 4.28 0 2 0 Form I
M6 4.19 Form I′
M7 4.07 Form I′
M8 3.91 Form I′
S3 3.61 1 1 0 Form I M9 3.70 1 1 0 Form I
Table 2 Observed d-spacings for the two nylon-9,2 samples: the solution-crystallized sample (SCS) and the
melt-crystallized sample (MCS)

12
temperature rises, d020 decreases. While, d110 increases with an increase in temperature. The
changes in the d-spacings show that the orthorhombic molecular chain packing in form I at low
temperature comes close to the quasi-hexagonal one at high temperature.
Above behavior of the molecular chain packing is often observed for other nylon below
the Brill transition. On heating, the crystalline phase transition, the so-called Brill transition, is
observed in aliphatic nylons [4,5,19,20]. The Brill transitions of various nylons have been
extensively studied [21-23]. X-ray diffraction is the most useful technique to confirm this
transition. The two strong reflections at d-spacings of 4.4 and 3.7 Å merge into a single peak at
the Brill transition. According to a conformational study on the transition, the mobility of the
methylene segments between the amide groups increases at the Brill transition, although the
hydrogen bonds between the neighboring chains are maintained [24,25]. As a result, the packing
of the molecular chains changes from triclinic or orthorhombic to quasi-hexagonal.
In present case, the 020 and 110 reflections do not merge into a single peak before
melting. Thus, it is concluded that form I crystal of the nylon-9,2 does not undergo the Brill
transition. This experimental fact has been already reported by Franco and coworkers [11].
According to them, the hydrogen bonds in two directions at an oxamide group between nylon-9,2
molecules seem to make difficult to occur the Brill transition. The reflections S′2 and S′3
belonging to form I′ in Fig. 3 shift to lower scattering angle with an increase in temperature and
vanish at 250 °C. The behavior detail of the reflections belonging to form I′ will be discussed
later (in the MCS section).
13
3.4. Temperature variation of the crystal structure in the MCS
Figure 6 shows the temperature variation of the WAXD pattern of the MCS. The
reflection peaks at 2 = 7.0°, 20.80°, and 23.96° in the WAXD pattern at 25°C can be assigned
0 50 100 150 200 2503.4
3.6
3.8
4.0
4.2
4.4
4.6
d110
(Form I)
d-s
pac
ing /
Å
Temperature / oC
d020
(Form I)
Figure 5. Temperature variations of d-spacings of the
SCS sample of nylon-9,2 during the heating process.
Figure 4. The temperature dependence of WAXD
pattern of the SCS of nylon-9,2 on heating process.
The reflection peak (*) corresponds to that of
polyimide film.
5 10 15 20 25 30 35
254oC
250oC
245oC
240oC
235oC
230oC
225oC
220oC
215oC
205oC
186oC
166oC
147oC
98oC
49oC
29oC
110020002
Form I'
Inte
nsi
ty /
a.u.
2 / o (Cu-K)
Form I*

14
the 002, 020, and 110 reflection of form I, respectively. These reflections correspond to the M2,
M5, and M9 reflection peaks in Fig. 3(b). The temperature variations of the peak positions of
these reflections are consistent with those of the SCS shown in Fig. 4.
The reflection peaks at 2 = 6.37°, 12.26°, 19.82°, 21.20°, 21.84°, and 22.80° in the
WAXD pattern at 25°C in Fig. 6, which correspond to the M1, M3, M4, M6, M7, and M8
reflection peaks in Fig. 3(b), respectively, are considered to be identified as the Bragg reflections
of form I′. The peak M1, which is expected to relate to the fiber period (00l), shifts to a higher
scattering angle with an increase in temperature. On the other hand, the M3, M4, M6, and M7
reflection peaks, which are expected to be from the lateral packing of the molecules, shift to
lower scattering angles. At 245°C, the M1, M3, M4, M6, M7, and M8 reflection peaks disappear
simultaneously; this means that these peaks belong to same crystalline phase, form I′. While, the
reflection peaks of form I begin to disappear at 254°C. Solid-solid phase transition between
forms I and I′ is not observed. Thus, it is concluded that the new form I′ is found for the MCS,
and the melting temperature of form I′ is lower than that of form I. The latter fact suggests that
form I is more stable than form I′.
Figure 7 shows the temperature dependences of the d-spacings observed for the MCS.
The temperature dependences of the d-spacings of M5 and M9, which are d020 and d110 of form I,
are same as those observed for the SCS. The tendency of the change of the molecular chain
packing in form I from orthorhombic to quasi-hexagonal is confirmed also for the MCS. It
should be noted that the d020 and d110 of form I in the MCS are larger than those in the SCS, but
the reason have not been cleared, yet. On the other hand, all the d-spacings of form I′ (M4, M6,
M7, and M8) continuously increase with an increase in temperature; the molecular chain packing
in form I’ becomes loose due to the thermal expansion.

15
0 50 100 150 200 2503.4
3.6
3.8
4.0
4.2
4.4
4.6
d110
(Form I)
d020
(Form I)
M9
M8
M7
M6
M5
M4
d-s
pac
ing /
Å
Temperature / oC
Figure 7. Temperature variations of d-spacings of the
MCS of nylon-9,2 during the heating process.
Figure 6. The temperature dependence of XRD pattern
of the MCS sample of nylon-9,2 on the heating
process. The reflection peak (*) corresponds to that of
polyimide film.
5 10 15 20 25 30 35
259 oC
250 oC
235 oC
215 oC
186 oC
147 oC
49 oC
110020002
240 oC
225 oC
205 oC
166 oC
98 oC
254 oC
245 oC
25 oC
*In
ten
sity
/a.
u.
2 / o (Cu-K)
Form I
Form I'

16
Figure 8 shows the DSC heating curve of the MCS of nylon-9,2. The initial sample was
crystallized at 235 °C for 24 h. Three endothermic peaks are observed at 235 °C, 244 °C, and
252 °C. The endothermic peaks at 245 °C and 252 °C is considered to be the melting peaks of
form I′ and form I, respectively. It should be noticed that the small endothermic peak at 235 °C is
broad. The temperature variation of WAXD pattern of the MCS showed no polymorphic
transition on heating process. In the case of crystalline polymers, small crystals formed during
the cooling after the isothermal crystallization. Therefore, the small endothermic peak at 235ºC
is probably due to the melting of small crystallites.
3.5. Crystal structure of form I′
As mentioned above, it was found that nylon-9,2 crystal shows the polymorphism; form I
and form I′ appear depending on crystallization condition. Polymorphism is often observed in
other nylon materials as well as nylon-9,2. For example, the -like form and -form are observed
Figure 8. DSC heating curve of melt crystallized
sample (MCS) of nylon-9,2. The peaks a and b is
expected to correspond to the melting of form I′ and
form I, respectively.
40 80 120 160 200 240 280
b
a
Hea
t fl
ow
/ a
rb.
-> E
nd
oth
erm
Temperature / oC
1 mW

17
for odd-even nylons. It has been reported that nylon-5,10 shows a polymorphism depending on
the conditions of sample preparation [10]. Nylon-5,10 had an -like structure when the sample
was prepared from strong acid solutions or their mixture with chloroform. While, the -form
crystallizes from the melt. Nylon-9,2 may pack in the same manner to the -form, and should
give rise to a Bragg reflection around d = 4.15 Å which is peculiar to the -form crystal.
However, the WAXD patterns of form I and form I′ are clearly different from the WAXD pattern
of the -form. The torsion angle 120° of the NH-CH2 bond is required for the -form. The higher
conformational rigidity of the oxamide groups than amide groups may cause the absence of the
-form for nylon-9,2.
In some aliphatic nylons, a high-temperature form is observed. For example, the high-
temperature form of nylon-5,6 has been found by Puiggalí, et al [8]. Nylon-5,6 crystallized from
a solution has a monoclinic structure, where hydrogen bonds are formed along two directions the
same as form I of nylon-9,2. This form undergoes the Brill transition involving a structural
change to a quasi-hexagonal packing on heating. On successive heating, a new crystalline phase
with monoclinic structure appears at a temperature a few degrees below the melting point. This
high-temperature form is also found for nylon-5,6 crystallized from the melt. Characteristic
Bragg reflections are observed at d = 4.54 Å, and 4.36 Å, and 4.23 Å in the WAXD pattern of
the high-temperature form at 220 °C. These two reflections cannot be assigned to the reflection
peaks of the -form. A monoclinic unit cell with ≠ 90° was determined for the high–
temperature form from X-ray fiber diffraction patterns at 220 °C. The unit cell of the high-
temperature form is related to that of the low temperature form taking into account a slight
change in the angle between the two hydrogen bond directions and thermal expansion.

18
In the case of nylon-9,2, form I′ shows characteristic reflections at d = 4.49 Å, 4.19 Å,
and 4.07 Å (see Fig. 3b) in the WAXD pattern at 25 °C. This suggests that the molecular packing
of form I′ may be similar to that of the high-temperature form of nylon-5,6. In the WAXD
pattern of the bulk sample, the reflection peak, which originates from fiber period of form I′ (and
may be 002 (or 001) reflection), is detected at 2 = 6.22° (d = 14.19 Å). While, the 002 reflection
of form I is observed at 2 = 7.61° (d = 11.60 Å) for the MCS. There are two possible
interpretations of this difference. One is the difference in molecular conformation. The molecular
chain in form I′ takes more extended conformation than that in form I. The chains has practically
all-trans conformation, and the torsion angle C(O)-N(H)-C(H2)-C(H2) is about 155° in form I. A
fiber period increases if the torsion angle becomes large with preservation of angle. For
example, fiber period reaches about 32 Å when the torsion angle is 180°. However, the 002 (or
001) reflection of form I′ suggests that lattice parameter c is 37.4 Å, which is larger than 32 Å.
Therefore, it is likely that the larger d002 in form I′ is not expected by the extended conformation
of molecules.
The other interpretation is difference in molecular arrangement. The unit cell parameter
becomes large for form I′ in the case that the relative molecular position along the chain axis
between neighboring chains is different from that in form I, which is caused by the hydrogen
bond geometry. In this case, we obtain a monoclinic unit cell with a = 4.73 Å, b = 8.96Å, c =
29.54 Å, and = 76.7°, assuming that the lattice constant c of form I is preserved. The unit cell
parameters enable us to index the observed Bragg reflections of form I′. Finally, a tentative
lattice constant of form I′ is refined using the observed d-spacings (dobss) and determined to be a
= 4.83 Å, b = 8.97 Å, c = 30.64 Å, and = 70.9°. The dobs values nearly agree with the
calculated d-spacings as listed in Table 3.

19
Moreover, form I′ is less stable than form I and shows temperature variation owing to
thermal expansion on heating. Hence, the crystal structure in form I′ is disordered, and molecules
in form I′ have many defects. The disordered molecular structure in form I′ may cause the
stretching the fiber period. Furthermore, the molecular conformation containing defects in form
I′ requires the different packing of the chains and the different hydrogen bonding system from
those in form I.
4. Conclusions
We have investigated the polymorphism of nylon-9,2. Two different crystal structures are
confirmed by WAXD. One is monoclinic form I, which is previously reported and has -like
Index
dcal
[Å]
dobs
[Å]
0 0 2 14.48 14.47
0 0 4 7.24 7.22
0 2 0 4.49 4.49
1 1 1 4.20 4.19
1 1 0 4.07 4.07
1━
1 1 3.88 3.91
Table 3 Observed and calculated d-spacings for form I′
of nylon-9,2.
20
structure, where hydrogen bonds are formed along two directions. The other is new form I′ found
in this study. When nylon-9,2 is crystallized from the solution, form I dominantly appears.
While, in the case of melt-crystallized nylon-9,2, form I and form Iʹ coexist. The temperature
variations of the WAXD patterns shows that both forms do not undergo any phase transitions
until their melting and that the melting of the form I′ crystal begins at a lower temperature than
that of form I. These facts suggest that the form I′ is a metastable phase. It is considered from the
WAXD pattern that crystal structure of form Iʹ is disordered compared to that of form I.
Acknowledgments
The authors thank M. Gondo of Yamaguchi University for his help in obtaining the
WAXD patterns and the DSC thermogram reported here.
References
(1) Bunn CW, Garner EV. Proc R Soc London Ser A 1947;189:39-68.
(2) Jones NA, Atkins EDT, Hill MJ. Macromolecules 2000;33:2642-50.
(3) Jones NA, Atkins EDT, Hill MJ, Cooper SJ, Franco L. Macromolecules 1997;30:3569-78
(4) Jones NA, Atkins EDT, Hill MJ, Cooper SJ, Franco L. Polymer 1997;38:2689-99.
(5) Jones NA, Cooper SJ, Atkins EDT, Hill MJ, Franco L. J Polym Sci, Polym Phys
1997;35:675-88.
(6) Xenopoulos A, Clark ES. In: Kohan MI, editor. Nylonplastics handbook, Chap 5.
Munich, Vienna and New York: Hanser Publishers; 1995. p. 108-37.
(7) Kinoshita Y. Makromol Chem 1959;33:1-20.
(8) Puiggalí J, Franco L, Alemán C, Subirana JA. Macromolecules 1998;31:8540-8.

21
(9) Morales-Gámez L, Soto D, Franco L, Puiggali J.Polymer 2010;51:5788-98
(10) Villaseñor P, Franco L, Subirana JA, Puiggali J. J Polym Sci Part B Polym Phys Ed
1999;37:2383-95.
(11) Franco L, Subirana JA, Puiggalí J. Macromolecules 1998;31:3912-24.
(12) Navarro E, Franco L, Subirana JA, Puiggalí J. Macromolecules 1995;28:8742-50.
(13) Navarro E, Subirana JA, Puiggalí J. Polymer 1997;38:3429-32.
(14) Cui XW, Yan DY. J Polym Sci Part B Polym Phys 2005;43:2048-60
(15) Gaymans RJ, Venkatraman VS, Schuijer SJ. Polym Sci Polym Chem Ed 1984;22:1373-82.
(16) Shalaby SW, Pearce EM, Fredericks RJ, Turi EA. J Polym Sci Polym Phys Ed
1973;11:1-14.
(17) Chatani Y, Ueda Y, Tadokoro H, Deits W, Vogl O. Macromolecules 1978;11:636-8.
(18) Casas MT, Armelin E, Alemán C, Puiggalí J. Macromolecules 2002;35:8781-87.
(19) Jones NA, Atkins EDT, Hill MJ, Cooper SJ, Franco L. Macromolecules 1996;29:6011-18.
(20) Jones NA, Atkins EDT, Hill MJ. J Polym Sci Part B Polym Phys 2000;38:1209-21.
(21) Yoshioka Y, Tashiro K. Polymer 2003;44:7007-19.
(22) Huang Y, Li WH, Yan DY. Eur Polym J 2003;39:1133–1140.
(23) Cui XW, Yan DY. Eur Polym J 2005;41:863–70.
(24) Tashiro K, Yoshioka Y. Polymer 2004;45:6349-55.
(25) Yoshioka Y, Tashiro K, Ramesh C. Polymer 2003;44:6407-17.


