
PointsBetQ4 FY2020 Business Update
July 2020
For
per
sona
l use
onl
y
Business Update│ July 2020
Important notice and disclaimerThis document and any oral presentation accompanying it has been prepared in good faith, however, no express or implied representation or warranty is given as to the accuracy or completeness of theinformation in this document, in any accompanying presentation or in any other written or oral communication transmitted or made available to any investor or potential investor (collectively, the “OtherMaterials”). Nothing in this document, in any accompanying presentation or in any Other Materials is, or shall be relied upon as, a promise or representation. All statutory representations and warranties areexcluded, and any liability in negligence is excluded, in both cases to the fullest extent permitted by law. No responsibility is assumed for any reliance on this document or the accompanying presentation or anyOther Materials.
Without limiting the above, this document, any accompanying presentation and any Other Materials may contain forecasts, forward looking statements or statements as to future affairs which are based onestimates, assumptions and expectations of PointsBet Holdings Limited or its subsidiaries (collectively, the “Company”) (some or all of which may not be satisfied or may not occur) that, while used in good faith,necessarily involve (i) subjective judgments; (ii) inherent uncertainties; and (iii) significant contingencies, many of which are beyond the Company’s control or reflect future business decisions which are subjectto change. Any forecast or financial information presented in this presentation any accompanying presentation and any Other Materials must not be taken as a representation as to future matters.
Therefore, there can be no assurance that such forecasts, forward looking statements or statements as to future affairs will be realised or that the Company's actual or future results, or subsequent forecasts,will not vary significantly from such forecasts, forward looking statements and statements as to future affairs. The actual results may vary from the anticipated results and such variations may be material. Anyand all forecasts and financial information in this document, in any accompanying presentation and in any Other Materials are not, and shall not be relied upon as, a promise or representation as to futurematters. The Company accepts no responsibility or liability in relation to the accuracy or completeness of any forecasts, forward looking statements or statements as to future affairs, or whether they areachievable. The Company does not assume any obligation to revise or update this document, any accompanying presentation, any Other Materials or any of the estimates, assumptions or expectationsunderlying such forecasts, forward looking statements and statements as to future affairs. No representations or warranties are made as to the accuracy or reasonableness of such estimates, assumptions orexpectations or the forecasts, forward looking statements or statements as to future affairs based thereon. Certain data included herein has been obtained from alternative external sources and as such may beinconsistent given differing underlying assumptions and sources.
Any discrepancies between totals and sums of components in tables and figures contained in this presentation are due to rounding. Tables and figures contained in this presentation have not been amended bythe Company to correct immaterial summation differences that may arise from this rounding convention.
Disclosures in this document, the accompanying presentation or any Other Materials are not investment advice and are not intended to be relied upon as advice to investors or potential investors and do nottake into account the investment objectives, financial situation or needs of any particular investor. These should be considered, with independent professional advice when deciding if an investment isappropriate.
The information contained in this document (including tables) has not been audited in accordance with the Australian Auditing Standards.
This document remains the property of the Company and the Company reserves the right to require the return of this document (and any copies or extracts hereof) at any time.
The receipt of this document by any investor or potential investor shall constitute such investor’s or potential investor’s acceptance of the foregoing terms and conditions.
All amounts disclosed in this document are presented in Australian dollars unless otherwise noted.
2 │
For
per
sona
l use
onl
y
Business Update│ July 2020
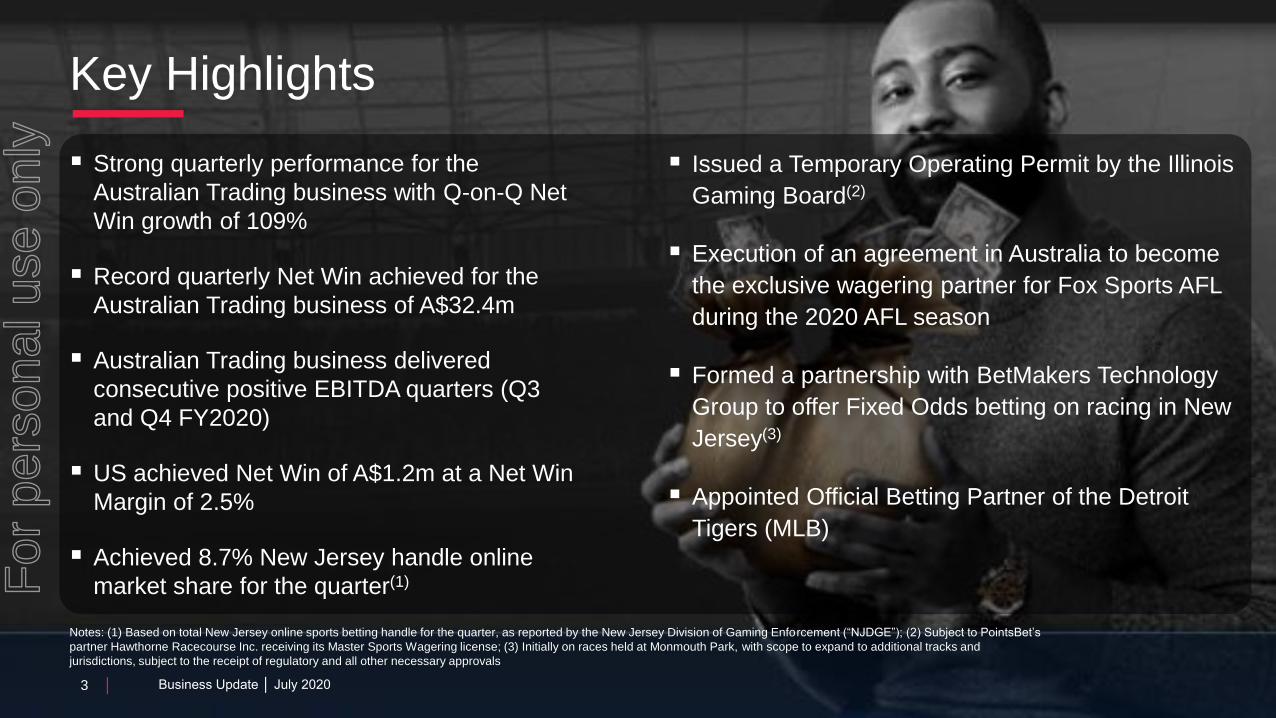
Key Highlights
▪ Strong quarterly performance for the
Australian Trading business with Q-on-Q Net
Win growth of 109%
▪ Record quarterly Net Win achieved for the
Australian Trading business of A$32.4m
▪ Australian Trading business delivered
consecutive positive EBITDA quarters (Q3
and Q4 FY2020)
▪ US achieved Net Win of A$1.2m at a Net Win
Margin of 2.5%
▪ Achieved 8.7% New Jersey handle online
market share for the quarter(1)
3 │
Notes: (1) Based on total New Jersey online sports betting handle for the quarter, as reported by the New Jersey Division of Gaming Enforcement (“NJDGE”); (2) Subject to PointsBet’s
partner Hawthorne Racecourse Inc. receiving its Master Sports Wagering license; (3) Initially on races held at Monmouth Park, with scope to expand to additional tracks and
jurisdictions, subject to the receipt of regulatory and all other necessary approvals
▪ Issued a Temporary Operating Permit by the Illinois
Gaming Board(2)
▪ Execution of an agreement in Australia to become
the exclusive wagering partner for Fox Sports AFL
during the 2020 AFL season
▪ Formed a partnership with BetMakers Technology
Group to offer Fixed Odds betting on racing in New
Jersey(3)
▪ Appointed Official Betting Partner of the Detroit
Tigers (MLB)
Business Update │ July 2020
For
per
sona
l use
onl
y

Business Update│ July 2020
Strong Growth Across Key KPIs
4 │
TURNOVER
NET WIN
NET WIN %
ACTIVE
CLIENTS(1)
(‘000)
Group Australia US
58%
356%
6.3pp
39%
80%
330%
6.2pp
32%
13%
n.m.
2.8pp
81%
Notes: (1) Clients that have placed a bet in the 12 months preceding the relevant quarter end date
Q4 FY19 Q4 FY20 PCP Increase Q4 FY19 Q4 FY20 PCP Increase Q4 FY19 Q4 FY20 PCP Increase
A$221.3m A$349.4m
A$7.4m
A$33.5m
3.3%
9.6%
80.0
111.4
A$7.5m
A$32.4m
4.5%
10.7%
A$167.8m
A$302.9m
(A$0.2m)
A$1.2m
(0.3%)
2.5%
11.5
20.9 68.5
90.4
A$53.4m A$46.5m
For
per
sona
l use
onl
y

Business Update│ July 2020
PointsBet Australia
✓ Strong quarterly performance for the
Australian Trading business with Q-on-Q
Net Win growth of 109%
✓ Record quarterly Net Win achieved for the
Australian Trading business of A$32.4m
✓ Australian Trading business delivered
consecutive positive EBITDA quarters (Q3
and Q4 FY2020)
✓ Continued higher quarter-on-quarter Net
Win Margin partially due to favourable
results and transfer from sports to racing
✓ Hugely successful timing & execution of
Tier 1 Channel 7 Australian horse racing
partnership and Fox Sports AFL
partnership
5 │
PointsBet Australia – Quarterly & PCP Performance (A$m)
Key metrics Q4 FY20 Q4 FY19 Increase on PCP
Turnover 302.9 167.8 80.5%
Gross Win 41.6 15.8 163.1%
Gross Win Margin 13.7% 9.4% +4.3pp
Net Win 32.4 7.5 330.4%
Net Win Margin 10.7% 4.5% +6.2pp
PointsBet Australia – YTD Performance (A$m)
Key metrics Q1 FY20 Q2 FY20 Q3 FY20 Q4 FY20 FY20 FY19Increase
on PCP
Turnover 164.4 184.8 178.4 302.9 830.5 490.1 69.5%
Gross Win 17.3 20.7 21.2 41.6 100.8 50.5 99.6%
Gross Win Margin 10.6% 11.2% 11.9% 13.7% 12.1% 10.3% +1.8pp
Net Win 12.6 14.6 15.5 32.4 75.1 28.9 159.4%
Net Win Margin 7.7% 7.9% 8.7% 10.7% 9.0% 5.9% +3.1pp
For
per
sona
l use
onl
y

Business Update│ July 2020
PointsBet US
✓ Net Win across the quarter of A$1.2m, was impacted by all 4 major US sporting leagues being absent for Q4 FY2020
✓ FY2020 Net Win of A$7.0m
✓ Successful execution of client engagement and activation strategy by offering non-traditional sports wagering markets
✓ The US marketing spend was significantly reduced from pre-COVID19 expectations
✓ Appointed Official Betting Partner of the Detroit Tigers (MLB)
✓ Achieved 8.7% New Jersey handle online market share for the quarter(1)
6 │
PointsBet United States – YTD Performance (A$m)(2)
Key metrics Q1 FY20 Q2 FY20 Q3 FY20 Q4 FY20 FY20
Turnover 71.4 112.5 90.7 46.5 321.1
Gross Win 1.1 8.1 5.6 1.6 16.5
Gross Win Margin 1.5% 7.2% 6.2% 3.5% 5.1%
Net Win (0.8) 3.4 3.3 1.2 7.0
Net Win Margin (1.1%) 3.0% 3.6% 2.5% 2.2%
Notes: (1) Based on total New Jersey online sports betting handle for the quarter, as reported by the New Jersey Division of Gaming Enforcement (“NJDGE”); (2) The AUD:USD foreign
exchange rate used for the figures in the table was the average rate for the specified period
PointsBet United States – Quarterly & PCP Performance (A$m)
Key metrics Q4 FY20 Q4 FY19 Increase on PCP
Turnover 46.5 53.4 (12.9%)
Gross Win 1.6 1.3 29.4%
Gross Win Margin 3.5% 2.4% +1.2pp
Net Win 1.2 (0.2) n.m.
Net Win Margin 2.5% (0.3%) +2.8pp
For
per
sona
l use
onl
y

Business Update│ July 2020
12 months to 31-Dec-17 31-Mar-18 30-Jun-18 30-Sep-18 31-Dec-18 31-Mar-19 30-Jun-19 30-Sep-19 31-Dec-19 31-Mar-20 30-Jun-20
45,828 56,788
68,464 72,011 81,014 83,330
90,422 35
8,243
11,544 15,380
21,141 22,716
20,939
7,927 12,963
24,445
32,913
45,863
65,031
80,008 87,391
102,155 106,046
111,361
Active Clients(1)
7 │
Notes: (1) Active Clients are clients that have placed a bet in the 12 months preceding the relevant date
Active Clients impacted due to sporting
suspensions in Q3 & Q4 FY2020Active Clients US
Active Clients Australia
Clients who have bet in the last twelve months
+ 74%
+ 9%
For
per
sona
l use
onl
y

Business Update│ July 20208 │
▪ Announced on 3 July 2020 a multi-year
partnership with the Detroit Tigers
▪ First sports betting partnership for any MLB
franchise
▪ First sports betting partnership for a
professional sports team within Michigan
▪ Secured branding at Comerica Park and
features on the Detroit Tigers Radio Network
Comerica Park
Partnership with Detroit Tigers
8 │ Business Update │ July 2020
For
per
sona
l use
onl
y

Business Update│ July 2020
Ready for Illinois In-person Launch PeriodMajor cities
Casino (10)
Arlington Park
Sports facility
Hawthorne Race Course
Fairmount Park• Illinois has legislated an in-
person sign-up period for the first 18-months of sports wagering operations
• 75% of Illinois’ population (c. 9.5m people) live within the Chicago Metropolitan Area
• PointsBet is ideally placed with a Flagship sportsbook to be located at the iconic Hawthorne Race Course – c. 13km / 8mi from Downtown Chicago
• PointsBet will also fit-out 3 branded off-track betting establishments throughout the Chicago Metropolitan area
9 │
Aurora
Joliet
DOWNTOWN
CHICAGO
Naperville
SeatGeek
Stadium
Wrigley Field
Soldier Field
Guaranteed
Rate Field
United Center
Joliet Speedway
Chicago
ILLINOIS
Springfield
Naperville
Aurora
Rockford
Peoria
Champaign
Fairmount ParkArgosy Casino AltonGateway motorsports
park
Joliet
6 miles10 km
Hawthorne Race Course
▪ c. 13km / 8mi from
Downtown Chicago
Arlington Park
▪ c. 41km / 26mi from
Downtown Chicago
Grand Victoria Casino
▪ c. 61km / 38mi from
Downtown Chicago
▪ c. 71km / 44mi from
Downtown Chicago
▪ c. 71km / 44mi from
Downtown Chicago
▪ c. 61km / 38mi from
Downtown Chicago
Rivers Casino
▪ c. 25km / 16mi from
Downtown Chicago
Note: Foxbet has a skin via Penn National Gaming
For
per
sona
l use
onl
y

Business Update│ July 2020
Quarterly Cash Flows
10 │
(1) Includes Player Cash Accounts of A$9.0m; (2) Majority of corporate cash held in USD
Group Cash Flows (A$m)Q4 FY2020 FY2020
Receipts from Customers 33.4 82.0
Cost of Sales (11.2) (33.1)
Sales and Marketing (9.3) (34.6)
Staff Costs (6.7) (29.4)
Administration and Corporate Costs (5.4) (16.2)
Change in Player Cash Accounts 1.9 0.2
Other operating cash flow 0.3 0.8
Net cash from / (used in) operating activities 3.1 (30.3)
Capex (3.9) (21.4)
Net cash from / (used in) investing activities (3.9) (21.4)
Proceeds from issues of shares - 122.1
Proceeds from exercise of share options - 0.2
Transaction costs related to issues of shares, convertible notes or options - (3.6)
Other financing cash flow 0.2 (0.5)
Net cash from / (used in) financing activities 0.2 118.3
Cash and cash equivalents at beginning of Quarter / Year to Date 156.7 75.9
Net cash flow (0.6) 66.5
Effect of movement in exchange rates on cash held (11.7) 1.9
Cash and cash equivalents at end of quarter(1) 144.3 144.3
• Corporate cash at end of quarter was A$135.4m(2)For
per
sona
l use
onl
y

Remaining Focused on our Vision
✓ Well capitalised with A$135.4m of corporate cash at 30 June 2020. The Company has no borrowings
✓ Australian Trading business delivered consecutive positive EBITDA quarters (Q3 and Q4 FY2020)
✓ In Australia, continue to opportunistically take advantage of industry consolidation and the growing consumer trend to
online behaviour
✓ Forthcoming launches of sportsbook operations in Illinois, Colorado and Michigan
✓ Execute on US media strategy
✓ Continued investment in product and technology platform including iGaming
✓ As the big 4 US sports re-launch concurrently in Q1 FY2021, a historical first, execute brand-led marketing strategy in
Indiana and Illinois to achieve target market share
For
per
sona
l use
onl
y


