
PLANT FUNCTIONAL TRAITS AND COMMUNITY ASSEMBLY AND STRUCTURE
by
JEFFREY K. LAKE
(Under the Direction of Stephen P. Hubbell)
ABSTRACT
Understanding how plant species coexist and interact with their biotic and abiotic
environment remains a key goal of community ecology. A growing knowledge of plant
functional traits has led to their increasing use in studies of community assembly. This
dissertation addresses questions of trait evolution and community assembly from both theoretical
and empirical perspectives.
Using simulations, I explored the interacting impacts of species richness, habitat
heterogeneity, multiple, linked traits, and varying levels of dispersal limitation on trait evolution
and species persistence in an ecological community. Fine-scale habitat heterogeneity led to
broad ecological equivalence and long-term species persistence, while the outcome of
simulations with coarse-scale heterogeneity depended on other factors. These findings differ
substantially from prior work, likely because we implemented the unique combination of
spatially explicit interactions along with using a genetical model of trait evolution.
Most current work studies considering community assembly from the perspective of
functional traits have been based on species mean trait values, minimizing the importance of
intraspecific variation. In this study, I examined the structure of a temperate forest in detail with
relation to five leaf functional traits. There is a strong intraspecific plastic response to light

availability in these traits, as well as substantial unexplained intraspecific and even within
individual variation. This broad range of intraspecific trait values translates to strong
interspecific overlap in trait values, suggesting most of the tree species within the studied forest
share a common strategy with respect to these leaf functional traits. These results also call
attention to the importance of considering individual-level variation in studies of community
ecology. When these same traits are considered in a spatially explicit manner, there is some
evidence supporting clustering of individuals with more similar traits than expected by chance,
as well as many traits that appear randomly placed across the landscape. Combining the major
temperate forest dataset with more limited data from a tropical forest, I attempted to address
competing hypotheses of niche breadth and overlap in relation to the latitudinal gradient in
species diversity. While data continues to be collected on this part of the project, initial analysis
of the data suggests that some traits behave differently in the species-rich tropical forest than in
the temperate system, but overall, niche breadth seems to be similar in the two systems.
INDEX WORDS: Community assembly, neutral theory, niche theory, limiting similarity,
functional traits, functional ecology, community ecology, Barro Colorado Island, Panama, Belize, Thompson Mills Forest, functional equivalence, trait evolution

PLANT FUNCTIONAL TRAITS AND COMMUNITY ASSEMBLY AND STRUCTURE
by
JEFFREY K. LAKE
Bachelor of Arts, Grinnell College, 1996
A Dissertation Submitted to the Graduate Faculty of The University of Georgia in Partial
Fulfillment of the Requirements for the Degree
DOCTOR OF PHILOSOPHY
ATHENS, GEORGIA
2007

© 2007
Jeffrey K. Lake
All Rights Reserved

PLANT FUNCTIONAL TRAITS AND COMMUNITY ASSEMBLY AND STRUCTURE
by
JEFFREY K. LAKE
Major Professor: Stephen P. Hubbell
Committee: Lisa A. Donovan James L. Hamrick W. John Kress Chris J. Peterson
Electronic Version Approved: Maureen Grasso Dean of the Graduate School The University of Georgia August 2007

iv
DEDICATION
To my mother, Joyce A. Lake, and my wife, Julie L. Whiston

v
ACKNOWLEDGEMENTS
There are so many individuals and organizations who provided support of this work. I
wish to first extend thanks to my advisor, Steve Hubbell, for his extraordinary patience in
dealing with an often challenging student and project and his insightful questions and scientific
advice. The opportunities he provided throughout my career are truly amazing. Thanks to my
committee members, Lisa Donovan, Jim Hamrick, John Kress, and Chris Peterson for their
insightful input and suggestions, as well as to former members Bob Kuzoff and Pej Rohani. I
have received extraordinary input and support from my labmates, especially Luis Borda de
Agua, who has taught me all I know about computer programming, and Jim Kellner, who has
been a great colleague for sharing ideas and critiques, as well as Yu-Yun Chen, Liza Comita,
Denise Hardesty, Robert John, Monica Poelchau, Rachel Spigler, Jason Watkins as well as
colleagues Robert Warren II and Eva Gonzales, and UGA faculty members Bruce Haines and
Ron Pulliam. Input from researchers at many institutions has been instrumental to the
development of this work, including Brian Enquist and his lab, Robert Holt, Annette Ostling,
David Alonso, Rampal Etienne, Mike Weiser, Chuck Price, David Ackerly, Joe Wright, Peter
Reich, Ethan White, and countless others.
Without the intellectual advice and collaboration of David Campbell and his team at
Grinnell College and in Belize, this project would simply have not been possible; I also owe
David a considerable debt for his encouraging my love for nature and for tropical ecology in
particular. Vern and Lenore Durkee and Diane Robertson have also been extraordinary mentors
to me. In Belize, I owe special thanks to Leopoldo Romero, the most talented bushmaster and

vi
botanist I know, as well Claudia Hudson, Mike Green and the crew at Chaa Creek, Jay Walker,
Constanza Ocampo-Raeder, John Guittar, and the entire Belize-Grinnell crew.
A phenomenal group of undergraduate students and lab technicians from UGA were
instrumental in working with me to implement much of this project. The project would not have
succeeded without Jonathan Drury’s extraordinary work during more than a two year
commitment to this project, as well as that of fellow students Isabelle Boittin, Kate Seader, Tim
Sullivan, Todd Stockham, Amy Murray, Olivia Sappenfield, Mark Friedman, Matt Fennell, and
Elijah Carter.
The University of Georgia’s Warnell School of Forest Resources was also kind enough to
allow me to conduct much of my research at their Thompson Mills Forest. Bill Lott and Jimmy
Lee, both on the Thompson Mills staff, taught me how to identify the tree species of TM, and
Jimmy’s abilities with a shotgun allowed the collection of many of my leaf specimens. In the
UGA Ecological Chemistry lab, Tom Maddox provided phenomenal guidance and timely
processing of specimens.
I was also fortunate to have a number of sources for my research support. I especially
thank the UGA Graduate School and Research Foundation for support on the UGA Presidential
Fellowship and the National Science Foundation Graduate Research Fellowship for full salary
support. Much of my research was funded by a Doctoral Dissertation Improvement Grant from
the National Science Foundation, as well as a research grant from the Smithsonian Tropical
Research Institute’s Center for Tropical Forest Science. In addition, small grants from the
Explorer’s Club Exploration Fund, Sigma Xi Grants In Aid of Research, the UGA Graduate
School, UGA Department of Plant Biology Palfrey Fund, and the UGA Center for Latin
American and Caribbean Studies. Additional funding for early field work came from Grinnell

vii
College, the New York Botanical Garden, US AID, and the Henry Luce Foundation.
Undergraduate research work was supported in part by the NSF Research Experiences for
Undergraduates program.
Finally, I must thank my family for all of their support, especially my mother, Joyce A.
Lake, and my wife, Julie L. Whiston. From my first memories, my mother has always
encouraged my love for learning and for nature. Her ongoing encouragement and sacrifices to
help me succeed have been extraordinary. During the many trying times of researching and
writing my dissertation, my wife, Julie, has always been a patient, loving and supportive partner.
Her willingness to help in the field and the lab with data collection and entry and to read
manuscripts and grant applications has been invaluable. Her patience and support has meant the
world to me.
.

viii
TABLE OF CONTENTS
Page
ACKNOWLEDGEMENTS.............................................................................................................v
LIST OF TABLES......................................................................................................................... ix
LIST OF FIGURES ....................................................................................................................... xi
CHAPTER
1 INTRODUCTION AND LITERATURE REVIEW .....................................................1
2 COMMUNITY NICHE OVERLAP ESTIMATES: WEIGHTING FOR SPECIES
IMPORTANCE IN A COMMUNITY....................................................................13
3 EVOLUTION OF FUNCTIONAL EQUIVALENCE: EXPLORING THE IMPACT
OF SPECIES DIVERSITY, MULTIPLE LINKED TRAITS, DISPERSAL
LIMITATION, AND SPATIAL STRUCTURE ON TRAIT EVOLUTION IN A
MULTI-SPECIES SIMULATION MODEL ..........................................................35
4 THE DISTRIBUTION OF VARIANCE IN LEAF FUNCTIONAL TRAITS IN A
TEMPERATE FOREST TREE COMMUNITY ....................................................66
5 SPATIAL DISTRIBUTION OF FUNCTIONAL TRAITS IN A TEMPERATE TREE
COMMUNITY......................................................................................................106
6 CAN THE DISTRIBUTION OFPLANT FUNCTIONAL TRAITS HELP EXPLAIN
LATITUDINAL GRADIENTS IN SPECIES DIVERSITY?...............................132
7 CONCLUDING REMARKS.....................................................................................146

ix
LIST OF TABLES
Page
Table 2.1: Species abundance and basal area within study quadrat .............................................28
Table 2.2: Unweighted cross-species niche overlap, using kernel-based index ...........................29
Table 2.3: Weighted cross species niche overlap, using adapted index weighted for species
abundance......................................................................................................................30
Table 2.4: Weighted cross species niche overlap, using adapted index weighted for total basal
area for each species......................................................................................................31
Table 2.5: Community niche overlap estimates, based on weighting factor ................................32
Table 3.1: Summary statistics of trait values and species persistence based on all simulations,
Scenario 1 ......................................................................................................................57
Table 3.2: Summary statistics of trait values and species persistence based on all simulations,
Scenario 2 ......................................................................................................................58
Table 3.3: Summary statistics of trait values and species persistence based on all simulations,
Scenario 3 ......................................................................................................................59
Table 3.4: Summary of outcomes from simulations.....................................................................60
Table 4.1: Count of species, adults and saplings, within sampling area........................................87
Table 4.2: Percent of Variation in each trait explained by different levels, resulting from nested
ANOVA.........................................................................................................................88
Table 4.3: Species means and standard deviation for different canopy positions, Specific Leaf
Area ...............................................................................................................................89
Table 4.4: Species means and standard deviation for different canopy positions, Leaf Size .......91

x
Table 4.5: Species means and standard deviation for different canopy positions, Leaf Nitrogen
Concentration ................................................................................................................93
Table 4.6: Species means and standard deviation for different canopy positions, Perimeter2:
Area Ratio......................................................................................................................95
Table 4.7: Species means and standard deviation for different canopy positions, Leaf Shape
Index..............................................................................................................................97
Table 4.8: Adjust r2 values for pairwise correlative relationships between all traits ....................99
Table 4.9: Mean trait overlaps for each trait for all leaves pooled, and for leaves in individual
canopy positions ..........................................................................................................100
Table 6.1: Mean trait overlaps for each trait for all leaves pooled, and for leaves in individual
canopy positions ..........................................................................................................144
xi
LIST OF FIGURES
Page
Figure 2.1: Overlap between the same two species, Kalmia latifolia (solid line) and Fagus
grandifolia (dotted line), with three different weighting factors...................................33
Figure 2.2: Overlap between the same two species, Oxydendrum arboreum (solid line) and Nyssa
sylvatica(dotted line), with three different weighting factors .......................................34
Figure 3.1: Initial conditions for all models..................................................................................61
Figure 3.2: Results from starting species as non-equivalent.........................................................62
Figure 3.3: Sample species trait distributions resulting from low diversity simulation under
scenario 1.......................................................................................................................63
Figure 3.4: Sample species trait distributions resulting from low diversity simulation under
scenario 2.......................................................................................................................64
Figure 3.5: Sample species trait distributions resulting from low diversity simulation under
scenario 3.......................................................................................................................65
Figure 4.1: Map of Thompson Mills Forest and location of study transects ...............................101
Figure 4.2: Boxplots of Specific Leaf Area (SLA) for Quercus alba individuals, each box
representing leaves collected from a single individual tree.........................................102
Figure 4.3: Boxplots of Specific Leaf Area (SLA) for Acer leucoderme (an understory tree)
individuals, each box representing leaves collected from a single individual tree .....103
Figure 4.4: Correlation between Leaf Nitrogen Content (LNC) and Specific Leaf Area............104

xii
Figure 4.5: Distribution of 100 randomizations of species assignments to existing tree-leaf data
for Specific Leaf Area .................................................................................................105
Figure 5.1: Overlap in specific leaf area as a function of plot size..............................................124
Figure 5.2: Pairwise overlap in specific leaf area (SLA) for all species pooled as a function of
distance within transect 3 ............................................................................................125
Figure 5.3: Spatial distribution of pairwise overlap in specific leaf area (SLA) for selected
individual species, size classes, and individual transects. ...........................................126
Figure 5.4: Spatial distribution of pairwise overlap in specific leaf area (SLA) for additional
selected individual species, size classes, and individual transects ..............................128
Figure 5.5: Spatial distribution of pairwise overlap in leaf nitrogen content (LNC) for selected
individual species, size classes, and individual transects. ...........................................130
Figure 6.1: Correlation Plot of trait breadth vs. number of leaves collected for a given species at
Thompson Mills and on Barro Colorado Island..........................................................145

1
CHAPTER 1
INTRODUCTION AND LITERATURE REVIEW
The origin and maintenance of species diversity remains a contentious and
unresolved issue in understanding patterns of biodiversity (Wills et al. 2006; Wright
2002). The fundamental questions still remain – how do species make their living and
coexist? Do species survive, as believed for years, through fine-scale niche
differentiation, or, as more recently proposed, by sharing a common phenotype with their
neighbors, giving no one species a strong upper hand? How is variation distributed
among and within species? Do ontogeny or canopy position influence traits, or can a
species (or individual) be well described by a single mean trait value? How is it that in
species-rich tropical tree communities, hundreds of species can co-exist, while temperate
forests only have at most a few dozen species of woody plants? This dissertation
explores these questions using several different approaches.
Theories of community assembly
The advent of neutral theory in ecology (Hubbell 2001) has rekindled interest in
the hypothesis of limiting similarity because it bears directly on the neutral-non-neutral
debate. A central tenet of classical theory in community ecology is that coexistence
requires that species exploit limiting resources differently from one another (Grinnell
1914 and 1917; Elton 1927; Gause 1934; Hutchinson 1957, 1959; MacArthur and Levins

2
1967; Tilman 1982). These classical theories posit that ecological communities are
structured by competition. Despite decades of extensive and largely theoretical debate on
this question, there are still relatively few empirical studies of within- and among-species
distribution of variation in functional traits among coexisting species, particularly in plant
communities. There are almost no tests of the hypothesis of limiting similarity in plant
communities. However, a recent study of one plant community (Stubbs and Wilson
2004) found inconclusive evidence the authors claimed supported limiting similarity in
some traits examined, but the study suffered from a lack of cross-community comparison,
and substantial risk of type I error due to the large number of tests performed on the same
dataset.
Under classical niche theory, as the number of species in a community goes up,
either the total niche volume for the community must be larger, or else niches must
become narrower to allow for coexistence of additional species. In modern terms, we can
define niches in part by the collection of functional traits borne by the species. In
species-rich tropical forest tree communities, hundreds of tree species co-occur within a
relatively small area. Because of the importance of spatial structure in sessile plant
communities, if functional trait differentiation is important to coexistence in these
communities, then one should find greater trait differentiation of plants that grow in
closer proximity to one another, i.e., as neighbors, than in random samples of these
communities. Ecologists have argued that a fine partitioning of light and a greater range
of light intensities in the tropics could help explain the higher tree diversity in tropical
forests (e.g., Ricklefs 1977; Denslow 1980; Orians 1982). Schwilk and Ackerly (2005)

3
and Tilman (2004) argue, however, that limiting similarity and niche differentiation can
and often will arise even with a significant role for stochasticity.
In contrast, Hubbell (2001) and colleagues argue that all this changes under strong
dispersal and recruitment limitation. Dispersal and recruitment limitation mean that
species fail to disperse to and/or recruit in all sites favorable to their survival and growth.
Hubbell et al. (1999) found strong dispersal and recruitment limitation in a tree
community in Panama, which they argued extensively delays competitive exclusion. In
theoretical models, strong dispersal and recruitment limitation permits many species to
coexist essentially indefinitely, even in the absence of limiting similarity (Hurtt and
Pacala 1995). Hubbell (2006) has recently shown in model communities that under
persistent dispersal and recruitment limitation, species can evolve functional equivalence
easily and often, converging on traits adapting them to those environments that they most
commonly experience over their evolutionary histories. He argues, for example, in
shady, closed-canopy forests, a majority of species should evolve shade tolerance.
Moreover, selection on trait character displacement may weaken in species-rich
communities because pairwise encounter rates between any two species are low (Hubbell
and Foster 1986). This hypothesis would predict opposite results from those of niche
theory—namely, greater phenotypic divergence in a relatively species-poor temperate
forest than in a species-rich tropical forest.
Weiher and Keddy (1995) offer another hypothesis, which they call
environmental filtering. They suggest that plant species will tend to be filtered and sorted
according to their respective environmental requirements, with the result that more
similar species will occupy more similar habitats. The result should be a clustering of
4
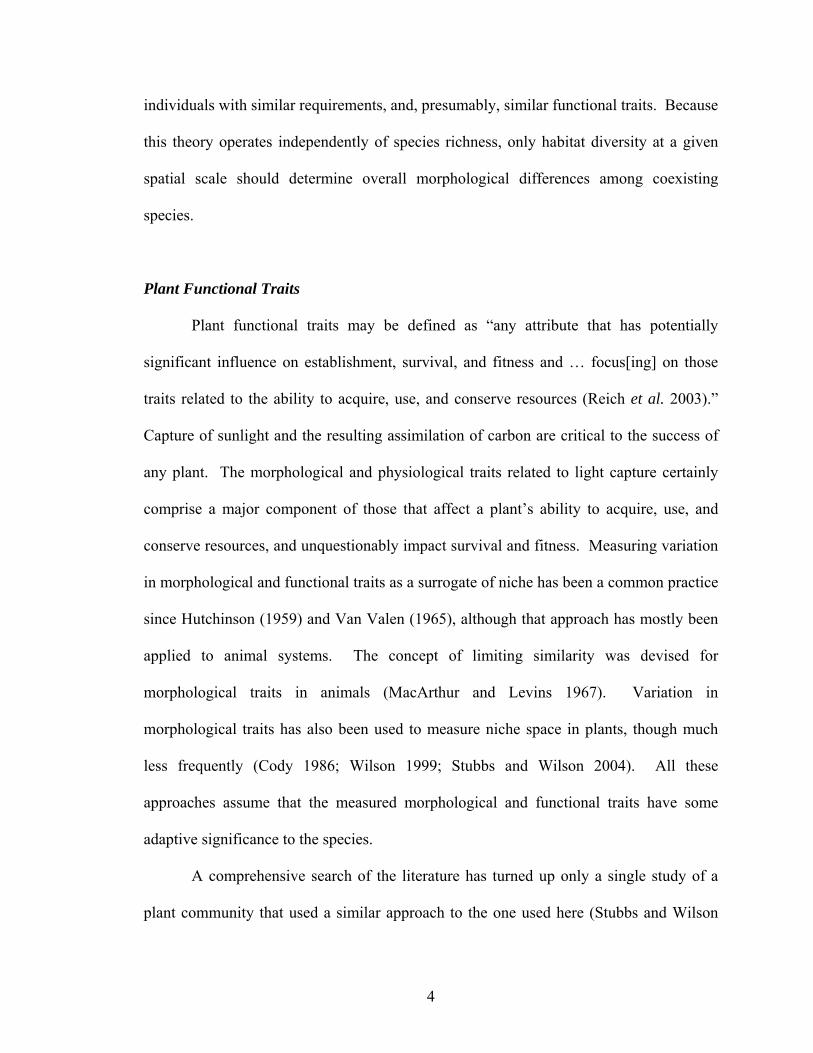
individuals with similar requirements, and, presumably, similar functional traits. Because
this theory operates independently of species richness, only habitat diversity at a given
spatial scale should determine overall morphological differences among coexisting
species.
Plant Functional Traits
Plant functional traits may be defined as “any attribute that has potentially
significant influence on establishment, survival, and fitness and … focus[ing] on those
traits related to the ability to acquire, use, and conserve resources (Reich et al. 2003).”
Capture of sunlight and the resulting assimilation of carbon are critical to the success of
any plant. The morphological and physiological traits related to light capture certainly
comprise a major component of those that affect a plant’s ability to acquire, use, and
conserve resources, and unquestionably impact survival and fitness. Measuring variation
in morphological and functional traits as a surrogate of niche has been a common practice
since Hutchinson (1959) and Van Valen (1965), although that approach has mostly been
applied to animal systems. The concept of limiting similarity was devised for
morphological traits in animals (MacArthur and Levins 1967). Variation in
morphological traits has also been used to measure niche space in plants, though much
less frequently (Cody 1986; Wilson 1999; Stubbs and Wilson 2004). All these
approaches assume that the measured morphological and functional traits have some
adaptive significance to the species.
A comprehensive search of the literature has turned up only a single study of a
plant community that used a similar approach to the one used here (Stubbs and Wilson

5
2004). This was a study of a sand dune community in New Zealand. The authors used a
variety of plant morphological traits related to water, nutrient, and light acquisition to
examine questions of limiting similarity among dune species. Of 670 tests performed, 54
showed significant results for limiting similarity, while three were significant in the
direction of character convergence. Although the authors concluded that their study
provided “the most convincing support for the theory of limiting similarity” in a plant
community, over 90% of their statistical tests were non-significant, so Type I error may
explain many of these supposedly significant results (54/670 = 0.08). The analysis was
also static, and did not evaluate how variation in individual performance (survival,
growth) correlated with trait variation, and did not consider relative degrees of limiting
similarity in different communities. Further, their different approaches to testing these
ideas did not produce robust results in terms of traits or species overlapping.
Several researchers have considered the distribution of leaf morphology either
within or among communities, though most of the research was not couched in the
theoretical background of community assembly. Some larger scale studies have shown
some support for habitat filtering. Halloy and Mark (1996) found morphological
convergence among species in similar alpine sites on different continents, and greater
differences among sites of differing altitudes on the same continent than among similar
sites on different continents. Schneider et al. (2003) found altitudinal gradients in some
leaf morphological traits in Venezuelan forest communities, but few differences among
stands of different ages, suggesting a limited role for habitat filtering for disturbance
driven traits.

6
In contrast, some have found support for niche differentiation, particularly within
specific genera. Cavender-Bares et al. (2004a, 2004b) concluded that Florida oak species
were partitioning niche space finely in relation to habitat usage and functional traits.
Davies (1998, 2001) showed that coexisting pioneer species in the tropical genus
Macaranga were partitioning a continuum of niche-space in relation to photosynthetic
traits, though the study focused more on mean species values than trait overlap.
Holscher et al. (2004) found that eight Asian pioneer species differed significantly
from one another in leaf morphology, suggesting a continuum of trait values even within
this functional class. Kappelle and Leal (1996) demonstrated that leaf nutrient levels
decrease along a successional gradient, while leaf morphology is less impacted by
successional status of the forest. Bragg and Westoby (2002) found that smaller-leaved
understory species in a sclerophyllous forest tended to need higher light levels than
larger-leaved species, while Ackerly and Donoghue (1998) found no such relationship
among temperate species within the genus Acer.
Community Assembly from Functional Traits
Recent developments in functional ecology offer a promising approach to the
problem of scaling attributes of individuals to community assembly and dynamics.
Specifically, one must consider not just the species in a community, but the diversity of
functional traits those species represent (Duarte et al. 1995; Diaz and Cabido 1997;
Weiher et al. 1999; Lavorel and Garnier 2002; Chapin 2003; Diaz et al. 2004).
Functional traits embody the mechanisms through which plants interact with their biotic
and abiotic environment and reflect fundamental ‘niche axes’ which characterize the
7
leading dimensions by which plants differentiate from one another (Westoby et al. 2002).
From this perspective, functional traits of plants entail multiple direct and indirect
pathways, as well as feedbacks between structure and function, organisms and
environment. The impact of functional traits on whole plant growth and survival is also
well-established (i.e., Poorter and Bongers 2006; Laurence et al. 2006). However, a
more generalized theory relating plant traits and the structure and dynamics of plant
communities across diverse ecosystems has remained an elusive “Holy Grail” for plant
community ecology (Lavorel and Garnier 2002). Shipley et al. (2006) have attempted
built a predictive model of community assembly from functional traits using maximum
entropy techniques, and used it rather successfully to predict community composition
over a chronosequence of abandoned vineyards. However, the model has both problems
of circularity and generality, having failed to accurately predict abundances in a more
diverse temperate forest system (Lake et al., in prep).
Key Questions
These efforts have left a number of fundamental questions that must be addressed
both empirically and theoretically in order to move to a more general model of
community assembly from plant functional traits. Specifically, we ask:
1. Is it appropriate to simply treat species as present or absent in a community
when considering trait overlap and limiting similarity, or can a more complete picture be
developed by considering abundance or other weighting factors?
2. Is it possible for ecological equivalence to evolve within a defined community,
and if so, can equivalent or near equivalent species persist in the long term in such a

8
community?
3. How are trait values distributed within and among individuals and species in a
temperate tree community?
4. How are traits distributed spatially among individuals in a temperate tree
community, and what can that distribution tell us about the way ecological communities
are assembled and structured?
5. Can the latitudinal gradient in species diversity be explained, at least in part,
by increased specialization in a species-rich tropical forest system?
In attempting to answer each of these questions, we employ different methods to
attempt to bring ecology a bit closer to that holy grail of understanding how ecological
communities are assembled, of understanding why and how species are able to coexist, in
spite of many apparent similarities.

9
Literature Cited
Ackerly D.D. 2003. Community assembly, niche conservatism, and adaptive evolution in changing environments. International Journal of Plant Sciences, 164: S165-S184
Ackerly, D.D. 1999. Comparative plant ecology and the role of phylogenetic information. In: Press, M., Scholes, J.D., and Barker, M.G., eds., Physiological Plant Ecology, pp. 391-413. Blackwell Scientific, Oxford, UK.
Ackerly, D.D. and Donoghue, M.J. 1998. Leaf size, sapling allometry and Corner’s rules: a phylogenetic study of correlated evolution in maples (Acer). American Naturalist 152: 767-791.
Ackerly, D.D., C.A. Knight, S.B. Weiss, K. Barton, and K.P. Starmer. 2002. Leaf size, specific leaf area and microhabitat distribution of chaparral woody plants: contrasting patterns in species level and community level analyses. Oecologia 130: 449-457.
Ahumada, J., S. P. Hubbell, R. B. Foster, and R. Condit. 2004. Long-term tree survival in a neotropical forest: The influence of local biotic neighborhood In: E. Losos, E. G. Leigh, Jr., and R. Condit, eds. Forest Diversity and Dynamism: Findings from a Network of Large-Scale Tropical Forest Plots. University of Chicago Press, Chicago, IL.
Bragg, J.G. and Westoby, M. 2002. Leaf size and foraging for light in a sclerophyll woodland. Journal of Ecology 16: 633-639.
Cavender-Bares, J., D. D. Ackerly, D. A. Baum and F. A. Bazzaz. 2004a. Phylogenetic overdispersion in Floridian oak communities. The American Naturalist 163: 823-843.
Cavender-Bares, J., K. Kitajima and F. A. Bazzaz. 2004b. Multiple trait associations in relation to habitat differentiation among 17 Floridian oak species. Ecological Monographs 74: 635-662.
Chapin, F.S., III. 2003. Effects of plant traits on ecosystem and regional processes: A conceptual framework for predicting the consequences of global change. Annals of Botany 91:455-463.
Cody, M.L. 1986. Structural niches in plant communities. In: Diamond, J. and Case, T.J. Community Ecology. Harper and Row, New York, NY, pp. 381-405.
Cornelissen, J.H.C., Lavorel, S., Garnier, E., Diaz, S., Buchmann, N., Gurvich, D.E., Reich, P.B., ter Steege, H., Morgan, H.D., van der Heijden, M.G.A., Pausas, J.G., and Poorter, H. A handbook of protocols for standardized and easy measurement of plant functional traits worldwide. Australian Journal of Botany 51: 335-380.
Davies, S. J. 2001. Tree mortality and growth in 11 sympatric Macaranga species in Borneo. Ecology 82: 920-932.
Davies, S. J. 1998. Photosynthesis of nine pioneer Macaranga species from Borneo in relation to life history. Ecology 79: 2292-2308.
Denslow, J. 1980. Gap partitioning among tropical rain forest trees. Biotropica (Suppl.) 12: 47-55.
Diaz, S., et al. 2004. The plant traits that drive ecosystems: Evidence from three continents. Journal of Vegetation Science 15: 295-304.
Diaz, S. and M. Cabido. 1997. Plant functional types and ecosystem function in relation to global change. Journal of Vegetation Science 8: 463-474.

10
Diamond, J. and Case, T.J. 1986. Community Ecology. Harper and Row, New York, NY. Duarte, C.M., et al. 1995. Comparative functional plant ecology: Rationale and
potentials. Trends in Ecology and Evolution 10: 418-421. Elton, C. 1927. Animal Ecology. Sidgwick and Jackson, London, England. Gause, G. F. 1934. The struggle for existence. Williams and Wilkins. Baltimore, MD. Grinnell, J. 1914. An account of the mammals and birds of the Lower Colorado Valley
with especial reference to the distributional problems presented. University of Colorado Publication in Zoology 12: 51-294.
Grinnell, J. 1917. The niche-relationships of the California thrasher. The Auk 34: 427-433.
Halloy, S.R.P. and Mark, A.F. 1996. Comparative leaf morphology spectra of plant communities in New Zealand, the Andes, and the European Alps. Journal of the Royal Society of New Zealand 26: 41-78.
Holscher, D., Leuschner, C., Bohman, K., Juhrbandt, J., and Tjitrosemito, S. 2004. Photosynthetic characteristics in relation to leaf traits in eight co-existing pioneer tree species in Central Sulawesi, Indonesia. Journal of Tropical Ecology 20: 157-164.
Hubbell, S.P. 2006. Neutral theory and the evolution of ecological equivalence. Ecology 87: 1387-1398.
Hubbell, S. P. 2001. The Unified Neutral Theory of Biodiversity and Biogeography. Princeton University Press, Princeton.
Hubbell, S.P., Ahumada, J.A., Condit, R. and Foster, R.B. 2001. Local neighbourhood effects on long-term survival of individual trees in a neotropical forest. Ecological Research, 16, 859–875.
Hubbell, S. P., R. B. Foster, S. T. O'Brien, K. E. Harms, R. Condit, B. Wechlser, S. J. Wright, and S. Loo de Lau. 1999. Light-gap disturbances, recruitment limitation, and tree diversity in a Neotropical forest. Science 283: 554-557.
Hubbell, S.P. and Foster, R.B. 1986. Biology, chance, and history and the structure of tropical train forest tree communities. pp. 314-329. In: Diamond, J. and Case, T.J. Community Ecology. Harper and Row, New York, NY.
Hurtt, G.C. and Pacala, S.W. 1995. The consequences of recruitment limitation: Reconciling chance, history, and competitive differences between plants. Journal of Theoretical Biology 176: 1-12.
Hutchinson, G.E. 1957. Concluding remarks. Population Studies: Animal Ecology and Demography. Cold Springs Harbors Symposia on Quantitative Biology 22: 415-422.
Hutchinson, G.E. 1959. Homage to Santa Rosalia; or, why are there so many kinds of animals? The American Naturalist 93: 145-159.
Kappelle, M, and M. Leal. 1996. Changes in leaf morphology and foliar nutrient status along successional gradient in a Costa Rica Upper Montane Quercus forest. Biotropica 28: 331-344.
Laurance, W.F. et al. 2006. Rapid decay of tree-community composition in Amazonian forest fragments. Proc. National Academy of Science 103: 19010-19014.
Lavorel, S. and E. Garnier. 2002. Predicting changes in community composition and ecosystem functioning from plant traits: revisiting the Holy Grail.Functional Ecology 16: 545–556.

11
Lusk, C.H. 2002. Leaf area accumulation helps juvenile evergreen trees tolerate shade in a temperate rainforest. Oecologia 132: 188-196.
MacArthur, R.H. and Levins, R. 1967. The limiting similarity, convergence and divergence of coexisting species. American Naturalist 101: 377-385.
McGill B.J., Enquist B.J., Weiher E. and Westoby M. 2006. Rebuilding community ecology from functional traits. Trends in Ecology and Evolution, 21, 178-185.
Mouillot, D. et al. 2005. Niche overlap estimates based on quantitative functional traits: a new family of non-parametric indices. Oecologia 145: 345–353.
Niinemets, U, and K. Kull. 1994. Leaf weight per area and leaf size of 85 Estonian woody species in relation to shade tolerance and light availability. Forest Ecology and Management 70: 1-10.
Orians, G.H. 1982. The influence of tree-falls in tree species richness. Tropical Ecology 23: 255-279.
Poorter, L. and F. Bongers. 2006. Leaf traits are good predictors of plant performance across 53 rain forest species. Ecology 87: 1733-1743.
Reich, P. B., D. S. Ellsworth, M. B. Walters, J. Vose, C. Gresham, J. Volin and W. Bowman. 1999. Generality of leaf traits relationships: a test across six biomes. Ecology 80:1955-1969.
Reich, P.B., Walters, M.B., and Ellsworth, D.S. 1997. From tropics to tundra: Global convergence in plant functioning. Proceedings of the National Academy of Sciences USA 94: 13730-13734.
Reich, P.B., Wright, I.J., Cavender-Bares, J., Craine, J.M., Oleksyn, J., Westoby, M., and Walters, M.B. 2003. The evolution of plant functional variation: Traits, spectra, and strategies. International Journal of Plant Science 164: S143-S164.
Ricklefs, R.E. 1977. Environmental heterogeneity and plant species diversity: a hypothesis. American Naturalist 978: 376-381.
Rozendaal, D.M.A, V.H. Hurtado, and L. Poorter. 2006. Plasticity in leaf traits of 38 tropical tree species in response to light; reslationships with light demand and adult stature. Functional Ecology 20: 207-216.
Sack, L., P.J. Melcher, WH Liu, E. Middleton, T. Pardee. 2006. How strong is intracanopy leaf plasticity in temperate deciduous trees? American Journal of Botany 93: 829-839.
Schneider, J.V., Zipp, D., Gaviria, J., and Zizka, G. 2003. Successional and mature stands in an upper Andean rain forest transect of Venezuela: do leaf characteristics of woody species differ? Journal of Tropical Ecology 19: 251-259.
Schwilk, D.W. and D.D. Ackerly. 2005. Limiting similarity and functional diversity along environmental gradients. Ecology Letters 8: 272-281.
Shipley, B., D. Vile, and E. Garnier. 2006. From plant traits to plant communities: a statistical mechanistic approach to biodiversity. Science 314: 812-814.
Sterck, F.J., Poorter, L. and F. Schieving 2006. Leaf traits determine the growth-survival trade-off across rain forest tree species. The American Naturalist, 167:758-765.
Stubbs W. and Wilson J.B. 2004. Evidence for limiting similarity in a sand dune community. Journal of Ecology, 92, 557-567.
Talbert, C.M. and A.E. Holch. 1957. A study of the lobing of sun and shade leaves. Ecology 38: 655-658.

12
Tilman, D. 2004. Niche tradeoffs, neutrality, and community structure: A stochastic theory of resource competition, invasion, and community assembly. Proceedings of the National Academy of Sciences 101:10854-10861.
Tilman, D. 1982. Resource Competition and Community Structure. Princeton University Press, Princeton, NJ.
Valladares, F., Wright, S.J., Lasso, E., Kitajima, K., and Pearcy, R.W. 2000. Plastic phenotypic response to light of 16 congeneric shrubs from a Panamanian rainforest. Ecology 81: 1925-1936.
Van Valen, L. 1965. Morphological variation and the width of ecological niche. The American Naturalist 99: 377-390.
Weiher, E., Clarke, G., and Keddy, P. 1998. Community assembly rules, morphological dispersion, and the co-existence of plant species. Oikos 81: 309-322.
Weiher, E., and Keddy, P., eds. 1999. Ecological Assembly Rules: Perspectives, Advances, Retreats. Cambridge University Press, Cambridge, UK.
Weiher, E. and Keddy, P. 1995. The assembly of experimental wetland plant communities. Oikos73: 323-335.
Westoby, M, et al. 2002. Plant Ecological Strategies: Some leading dimensions of variation between species. Ann. Rev. Ecol. Syst. 33: 125-159.
Wills, C. et al. 2006. Nonrandom processes maintain diversity in tropical forests. Science 311:527-531.
Wilson, J.B. 1999. Assembly rules in plant communities. In: Weiher, E., and Keddy, P., eds. Ecological Assembly Rules: Perspectives, Advances, Retreats. Cambridge University Press, Cambridge, UK.
Wright, I. J. et al. 2004. The worldwide leaf economics spectrum. Nature 428: 821–827. Wright, S. J. 2002. Plant diversity in tropical forests: a review of mechanisms of species
coexistence. Oecologia 130: 1-14. Wright, S. J., H. C. Muller-Landau, R. Condit, and S. P. Hubbell. 2003. Gap-dependent
recruitment, realized vital rates, and size distributions of tropical trees. Ecology 84: 3174- 3185.

13
CHAPTER 2
COMMUNITY NICHE OVERLAP ESTIMATES: WEIGHTING FOR SPECIES
IMPORTANCE IN A COMMUNITY1
1 Lake, JK, L.A. Borda de Agua, and S.P. Hubbell. Submitted to Functional Ecology

14
Abstract
1. Recently proposed non-parametric measures of niche overlap for quantitative
functional traits provide a new approach to questions of trait overlap among
coexisting species (Mouillot et al. 2005). However, these community overlap
indices weight all species as equally important in the community, regardless of
their relative size, abundance or other impact on the community, which tends to
overestimate the extent of community niche overlap.
2. To address fundamental questions of community assembly, particularly for
communities of organisms varying in abundance or size, these measures can be
extended to give a more complete picture of niche overlap in the community. In
this research, we propose an extension to these new indices that allows weighting
for community importance of species.
3. We explore the impact of different weighting methods on niche overlap estimates
in a temperate forest tree community. Weighting by either species abundance or
total basal area of a species, we re-estimate community niche overlap to be only
about half of the community-level overlap obtained from the unweighted analysis
(0.23-0.25 vs. 0.46). Although we found similar total community overlap from
these two weighted approaches, the source of that overlap was different, and the
similarity between these measures is coincidental.
4. These weighted indices and the application of appropriate measures of community
importance provide another tool to further our understanding of community
assembly.
Keywords: Kernel estimator, niche overlap, community assembly, functional traits

15
Introduction
Increasingly, the study of community ecology is focusing on the distribution of
functional traits among species (McGill et al. 2006), examining the effect of traits not just
on pairwise interactions among co-occurring species, but also looking at community-
wide patterns. The fundamental question is the degree to which the assembly of
particular communities is explicable in terms of functional traits of member and non-
member species. In classical terminology, this question was framed in terms of the
degree of niche overlap among member species; but this question can also be framed in
terms of the similarity or dissimilarity of key functional traits involved in resource
capture, environmental tolerance, and life history attributes, such as fecundity and
colonizing ability. We know that simply considering pairwise competitive interactions
cannot tell us what species will comprise a community or at what abundances.
Nonetheless, until recently, there were few good quantitative tools to help us address
questions of the species composition of entire communities.
Mouillot et al. (2005) have proposed a family of non-parametric indices to
measure niche space and overlap based on quantitative functional traits. These indices
provide a new tool for measuring both pairwise overlap and calculating a community
index of niche overlap. The flexibility allowed by the continuous and non-parametric
nature of these measures is a significant advance for quantitative measures of niche and
for furthering understanding of community patterns of coexistence. These indices
consider not only mean niche values, but also the variation around the mean, and the
resulting trait overlap, with no prior assumptions of how trait variation is distributed.
16
Thus, we no longer need to force a fit of data to a particular pre-conceived statistical
distribution to address questions of niche or trait overlap.
In the context of studying community assembly, however, such indices that
calculate average niche overlap for a community do not yet capture some of the most
important aspects of community structure—notably, the abundance or relative importance
of each species in the community. The current Mouillot et al. (2005) method evaluates
community niche overlap based on presence/absence data alone. It does not weight the
importance of overlap by relative species abundance or relative biomass, even though
some species might be orders of magnitude more abundant than other species. The result
is that these indices weight rare species on a per capita basis much more heavily than
common species in terms of the total amount of niche or trait space they occupy. This in
turn skews the true picture of community niche structure. This problem arises in the
Mouillot approach because the area under each species’ niche breadth curve is
normalized to unity. Few if any natural communities have an even distribution of species
abundance or any other measure of importance; rather, most communities are dominated
by a relatively few species, and many more are rare within the given community (ie,
Hubbell 2001).
A key assumption behind the hypothesis that coexisting species exhibit limiting
niche similarity and defining niches in terms of functional traits is that these traits affect
the acquisition and use of limiting resources. Since functional traits are defined by Reich
et al. (2003) as “any attribute that has potentially significant influence on establishment,

17
survival, and fitness…,” it is probable that, simply by definition, they should be closely
related to classical niche axes for a species. If the distribution of functional traits among
species reflect underlying differences in resource uptake and use (necessary if one is to
study the question of limiting similarity of functional traits), then we must also consider
the abundance (or some other measure of importance) of the species and therefore, their
functional traits.
Relative species abundance provides one possible measure of the relative impact
of a species in an ecological community. However, abundance is not the only or
necessarily the best representation of the relative resource use of a given species. For
example, in a forest tree community, adult individuals of a canopy species likely utilize
many times the amount of resources of an individual of an understory species. In this
case, biomass or a biomass surrogate such as a plant’s basal area or a scaleable linear
measurement in animals, may be a better weighting factor. Or, perhaps, a measure such
as importance values (an index of relative frequency, dominance, and density) would
better describe a species’ resource use. These considerations lead us to propose some
extensions to Mouillot et al.’s (2005) indices of community niche overlap that allow a
more complete view of the distribution of resource use among species in a community.
Original niche metric described
As originally proposed (Mouillot et al. 2005), the index of niche overlap utilizes
kernel estimators to describe the distribution of a continuous trait x, with n data points:
)(11)(1
^
hXxK
hnxf i
n
ih
−= ∑
=
(1)

18
The standard normal density function K is used to represent each data point; note that
using a normal density function here does not assume normality in the data, only in the
error around a given datapoint (ie, Stine and Heyse 2001). Bandwidth, which controls
the smoothness of the distribution, is represented by h. We chose to follow the lead of
Mouillot et al. (2005) in selecting an estimator of bandwidth, h = 1.06σn-1/5, where σ
represents the standard deviation of the dataset.
π22/)(
2)(hXx
i
i
eh
XxK
−−
=− (2)
Next, pairwise overlap indices can be calculated for trait t for species i and j, estimated as
the area under the lower of the two population density functions:
∫= dxxfxfjiNO jtitKt ))(),((min),( (3)
The authors of the original index go on to demonstrate methods for dealing with multiple
traits, including discounting non-independent traits using correlation coefficients,
producing NOKw, an estimate of niche overlap in many niche dimensions. They then
extended this index to the full community by producing a community niche overlap
estimator, NOK,community:
2)1(
)),((1
1 1, −
=∑ ∑−
= +=
SS
jiNONO
S
i
S
ijKw
communityK (4)
19
Materials and methods
Niche overlap in a community
In the Mouillot et al. (2005) method the area under the niche curve (“kernel”)
describing the frequency distribution of trait values over individuals of each species is
normalized to unity. We suggest modifying this method by weighting the species kernels
by the relative abundance of the species in the community. To make this modification,
we simply multiply the kernels of each species by a relative weighting factor. These
weights must sum to one. With no loss of generality, represent this weighting factor by
gi/G, where gi represents the weight for species i, and G the sum of all gi across all
species in the community. Finally, multiply each species’ functional kernel by the total
number of species in the community. This multiplication normalizes the total functional
trait space in the community so that it sums to an integer equal to the number of species,
S, but a sum that is now weighted by the relative importance of species in the community.
This modification makes cross-community comparisons of niche overlap more
meaningful and less sensitive to rare species effects that have little or no significance to
community assembly. It also allows the user to adapt the overlap metrics to his or her
own study system, and weight individuals according to the relevant metrics.
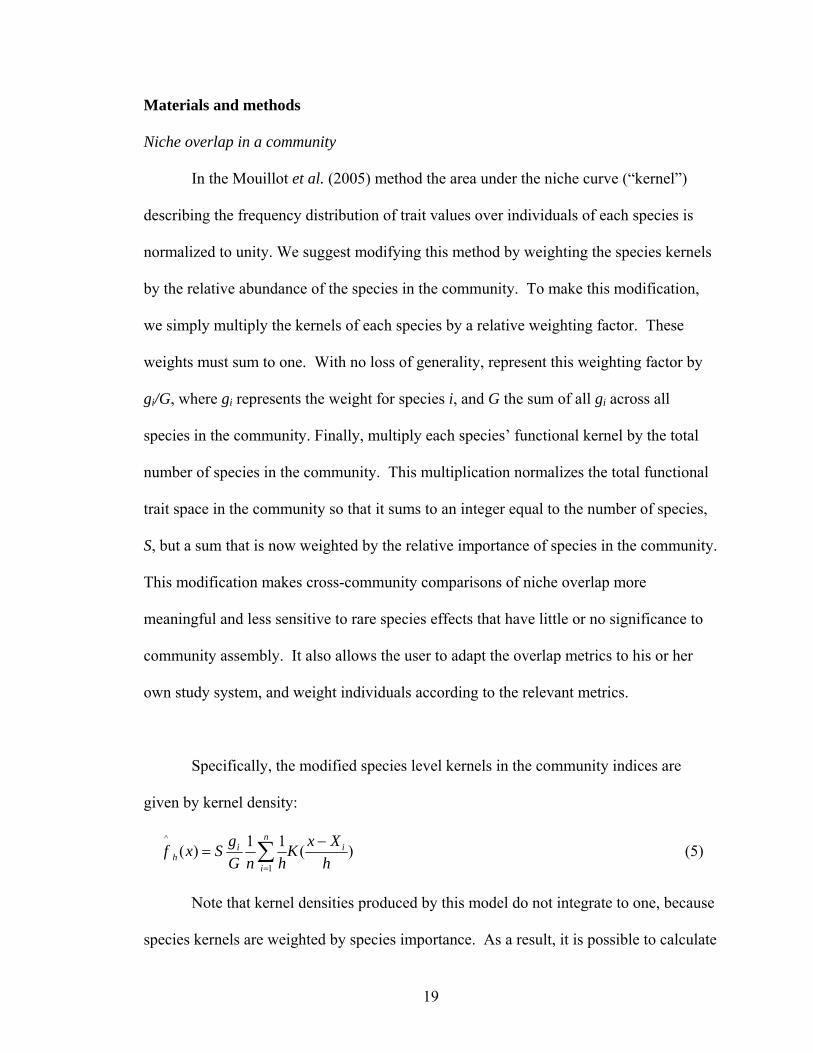
Specifically, the modified species level kernels in the community indices are
given by kernel density:
)(11)(1
^
hXxK
hnGgSxf i
n
i
ih
−= ∑
=
(5)
Note that kernel densities produced by this model do not integrate to one, because
species kernels are weighted by species importance. As a result, it is possible to calculate

20
pairwise overlap values in excess of 1.0, although the community-wide overlap index
ought to never exceed 1. Therefore, this method is appropriate for assessing niche
overlap at the community level, but not for pairwise species overlap calculations for
across the range of a species (where relative abundances and biomass become less
relevat). Results showing pairwise overlaps used in calculating the final community
niche overlap index should thus be interpreted with extreme caution; they are better used
to demonstrate the relative contributions of pairwise interactions to the community index
than as a “stand-alone” metric.
Mathematically, the only change needed to the original work is in the initial
calculation of population trait kernel estimators. By weighting these kernel estimators,
we can then use already developed mathematical tools previously presented in Mouillot
et al. (2005) to proceed in calculating community overlap estimates.
Temperate forest tree community
We illustrate the use of these modified indices, as well as why these modifications
are important, by analyzing a dataset on leaf traits in a temperate tree community, and
comparing three different approaches. The first utilizes an unweighted analysis of
species, as described in Mouillot et al. (2005). The second weights species by relative
abundance in the sample community, and the third utilizes stem basal area as a surrogate
for biomass. For all three analyses, we use data from thirteen tree species sampled from a
forest tree community at Thompson Mills Forest, Braselton, Georgia (See Table 1 for a
list of species, their relative abundance, and basal areas in the study plot). Trait values

21
were sampled broadly from trees within three 0.4-ha. transect plots in the forest;
however, the present analysis was restricted to a single 20x20 m quadrat at the base of a
single transect to illustrate the impact of these weighting factors with a relatively simple
system, and one that represents the likely area of among-individual interactions (see
Hubbell et al. (2001), for example).
Analyses were restricted to a single trait, specific leaf area (SLA = one sided leaf
surface area/leaf dry mass), measured according to standard procedures (Cornellisen et
al. 2003), to make our methodological point. SLA is often associated with leaf level gas
exchange, leaf lifespan as well as whole-plant growth rate (see Reich et al. 1999;
Niinemets 2001; Wright et al. 2004). This paper is therefore not about the actual niche
assembly of the tree community at Thompson Mills, but rather about the value of
weighting community overlap indices by species importance. Further detailed analysis of
community niche structure in this forest can be found in Lake (thesis chs. 4-5).
Results
Unweighted analysis
Specific leaf area (SLA) showed wide variation in cross-species overlap within
the given community, ranging from 0 to 0.876 (Table 2 shows all unweighted pairwise
overlaps). The species showing the least overlap with others is Kalmia latifolia, an
evergreen understory shrub with very thick leaves. The SLA distribution of this species
is very narrow, indicating strong similarity among the leaves sampled (fig. 1). Because
of the narrow range of trait values, overlap was necessarily low with other species with

22
broader trait distributions. Canopy trees in general, particularly species in the genus
Quercus, showed considerable overlap in their SLA distributions with one another, as did
most sub-canopy species (i.e., Acer leucoderme, Cornus florida, Crataegus spp.).
Community niche overlap was estimated at 0.46.
Weighted by abundance
When considering abundance, pairwise overlaps (Table 3) among the three most
common species (Acer leucoderme, Fagus grandifolia, Crataegus species) accounted for
much of the total community overlap. This is not a necessary result, because if species
exhibited strong limiting similarity, the most common species should be segregated in
functional trait space. Overall community niche overlap for SLA was estimated at 0.26.
Weighted by basal area
Not surprisingly, when using basal-area weighting, the community overlap index
was driven by canopy tree individuals within the study area. Notably, area weighted
pairwise overlap (Table 4) among the three species of Quercus and between Fagus and
Oxydendrum were particularly high, while small individuals and understory species
typically contributed relatively little to trait overlap simply because of their small size.
Overall community niche overlap for SLA was 0.23.
Community level overlap estimation
Community overlap estimates varied widely (0.23-0.46) depending upon the
species weighting system used. Unweighted overlap estimates as proposed by Mouillot

23
produced the highest (0.46) overlap, while weighting for a species’ basal area produced
the lowest estimate of trait overlap (0.23). This composite community mean, however,
masks the variation in contribution of individual species pairs to overall niche overlap.
Individual species pairs varied widely in their contribution to community-wide means of
overlap depending on the weighting factors used.
Discussion
The aim of this paper is to illustrate the value of incorporating community
importance of species in estimating overall community levels of niche overlap,
particularly in communities where size or abundance vary widely. If we adopt a
functional niche approach as proposed by Rosenfeld (2002) and followed in Mouillot et
al. (2005), that is, use functional traits of a species as a surrogate for resource use, then it
is valuable to consider more than simply the presence or absence of a species in a
community. The abundance, biomass, or other measure of importance of species within a
community is important to evaluating the relative exploitation of a given resource by
those species. The unweighted estimators of niche overlap proposed by Mouillot et al.
(2005) give equal weight to all species, and thus tend to inflate estimated niche overlap
by over-emphasizing the contribution to niche overlap from rare species. When used to
calculate community overlap estimates, the unweighted approach tacitly assumes that all
species are utilizing a comparable total amount of resource, regardless of size,
abundance, etc. The weighted overlap indices proposed here provide a more refined look
at the resources or trait space used by individual species within a community.

24
This study also highlights the importance of selecting a weighting metric
appropriate to the community being studied. Although both weighting methods
(abundance, basal area) used here nearly halved the total community overlap index, the
source of that overlap reduction is very different. Pairwise overlap between adult canopy
trees dominated the overlap when weighting for total stem basal area, whereas highly
abundant understory trees dominated the overlap indices when weighting for abundance.
This point is well illustrated by considering two canopy tree species (Nyssa sylvatica and
Oxydendrum arboreum), represented respectively in the study plot by a single sub-adult,
the other by two adult individuals. When unweighted, the overlap between these two
species is over 0.85; but overlap decreases considerably (to 0.26) when weighting by
abundance, and even further when weighting by basal area (0.19) (See fig. 2). A similar
pattern occurred in two highly divergent species—Kalmia latifolia and Fagus
grandifolia. The SLA distribution of the two species overlap very little, but the effect of
the changing relative importance is well illustrated by the changing relative areas under
the distributions (fig. 1). Not surprisingly, when weighted for basal area (fig. 1C), the
large canopy tree of Fagus grandifolia dominated the trait distribution, while the
understory shrub, Kalmia, showed a very small distribution. While the overlap index is
not much affected by this weighting (because of a lack of overlap to begin with), the
overall distributions change markedly when weighting by importance measures is
included instead of the unweighted analysis (fig. 1A).
We also must carefully consider the assumptions behind and limitations to these
indices. While introducing a weighting factor provides a unique opportunity to consider

25
a species in the context of a particular local community, it also necessarily requires us to
consider those traits within the context of the entire community. For example, if we were
to consider pairwise trait overlap for two particular species separate from the broader
community, but continued to use these weighting factors, the results would be
biologically meaningless. In other words, this approach would be a poor choice for
considering the trait overlap of two coexisting species; it is only meaningful with regard
to the full community in which species have a particular abundance, biomass, etc.
Consider the basal area-weighted pairwise overlap values for two understory tree species,
Cornus florida and Acer leucoderme. In an unweighted analysis, their SLA overlaps
0.56—strong overlap, and hardly unexpected in these ecologically similar species.
Because of their relatively small stature, however, these two species contribute relatively
little to the basal area in the community, and therefore demonstrate “low pairwise
overlap” of 0.19 when traits are weighted for basal area. This reminds us that we must
regard the community-wide overlap metric as a measure of the total average overlap of
the use of trait space, rather than as a summation of equal interspecific interactions.
Another limitation to consider is that these measures (comparable to those
originally proposed by Mouillot et al. (2005) do not address one of the fundamental
problems of species sorting into local communities from a metacommunity. It is possible
that species are being competitively excluded from a community because they overlap
too much in niche with other species. Equally plausible is the possibility that species are
not arriving at a given local community due to dispersal limitation (ie, Hubbell et al.
1999). It may be possible to address this issue for rare, potentially transient species by

26
comparing the distributions for that species inside the study community to values for the
species elsewhere, but this is not the primary purpose of these community niche metrics.
The development of weighted community niche overlap indices provides a new
tool for studying the relative amount of niche overlap in various communities. It allows
us to consider the relative use of trait space by each species within the community, while
accounting for issues of abundance, biomass, and other measures of importance. Because
of the flexibility of the metric and the weighting, these tools should be useful for a wide
range of niche measures—both continuous and discrete—in a variety of ecological
communities.
Acknowledgments
Thanks to I. Boittin, K. Seader, T. Sullivan, J. Drury, J. Whiston, W. Lott, J. Lee, and T.
Maddox for assistance in the field and laboratory. B. Enquist, L. Donovan, M. Weiser, E.
White, J. Pither and J. Kellner for insightful comments and suggestions to improve this
article. JL was supported by National Science Foundation Graduate Research Fellowship
and Doctoral Dissertation Improvement Grant and University of Georgia Graduate
School and Department of Plant Biology.

27
Literature Cited
Cornelissen, J.H.C., Lavorel, S., Garnier, E., Diaz, S., Buchmann, N., Gurvich, D.E., Reich, P.B., ter Steege, H., Morgan, H.D., van der Heijden, M.G.A., Pausas, J.G., & Poorter, H. (2003) A handbook of protocols for standardized and easy measurement of plant functional traits worldwide. Australian Journal of Botany 51, 335-380.
Hubbell, S. P. (2001) The Unified Neutral Theory of Biodiversity and Biogeography. Princeton University Press, Princeton.
Hubbell, S.P., Ahumada, J.A., Condit, R. & Foster, R.B. (2001) Local neighbourhood effects on long-term survival of individual trees in a neotropical forest. Ecological Research 16, 859–875.
Hubbell, S. P., Foster, R.B., O'Brien, S. T., Harms, K. E., Condit, R.,Wechlser, B., Wright, S. J. & Loo de Lau, S. (1999) Light-gap disturbances, recruitment limitation, and tree diversity in a Neotropical forest. Science 283, 554-557.
McGill, B.J., Enquist, B.J., Weiher, E. & Westoby, M. (2006) Rebuilding community ecology from functional traits. TRENDS in Ecology and Evolution 21, 178-185.
Mouillot, D., Stubbs, W., Faure, M., Dumay, O., Tomasini, J.A., Wilson, J.B. & Chi, T.D. (2005) Niche overlap estimates based on quantitative functional traits: a new family of non-parametric indices. Oecologia 145, 345–353.
Niinemets, U. (2001) Global-scale climatic controls of leaf dry mass per area, density, and thickness in trees and shrubs. Ecology 82, 453–469.
Reich, P. B., Ellsworth, D. S., Walters, M. B., Vose, J., Gresham, C., Volin, J. & Bowman, W. (1999) Generality of leaf traits relationships: a test across six biomes. Ecology 80, 1955-1969.
Reich, P.B., Wright, I.J., Cavender-Bares, J., Craine, J.M., Oleksyn, J., Westoby, M., & Walters, M.B. (2003) The evolution of plant functional variation: Traits, spectra, and strategies. International Journal of Plant Science 164, S143-S164.
Rosenfeld J.S. (2002) Functional redundancy in ecology and conservation. Oikos 98, 156–162.
Stine, R.A. & Heyse, J.F. 2001. Non-parametric estimates of overlap. Statistics in Medicine 20: 215-236.
Wright, I. J. et al. 2004. The worldwide leaf economics spectrum. Nature 428: 821–827.

28
Table 2.1. Species abundance and basal area within study quadrat.
Species Abundance Rel. Abund. Basal Area (mm2) Rel. Basal Area
Acer leucoderme 21 0.42 50783.85 0.08002 Acer rubrum 1 0.02 314.16 0.00050 Cornus florida 3 0.06 9296.76 0.01465 Crataegus sp. 5 0.1 2335.77 0.00368 Fagus grandifolia 5 0.1 150024.40 0.23640 Kalmia latifolia 3 0.06 1665.83 0.00262 Liriodendron tulipifera 1 0.02 44862.73 0.07069 Nyssa sylvatica 1 0.02 9331.32 0.01470 Oxydendrum arboreum 2 0.04 54428.88 0.08577 Quercus alba 4 0.08 74421.97 0.11727 Quercus nigra 1 0.02 145220.12 0.22883 Quercus rubra 2 0.04 91233.42 0.14376 Symploccos tinctoria 1 0.02 706.86 0.00111

29
Table 2.2. Unweighted cross-species niche overlap, using kernel-based index as proposed by Mouillot et al (2005).
Species A. rubrum
C. florida
Crataegus sp.
F. grandifolia
K. latifolia
L. tulipifera
N. sylvatica
O. arboreum Q. alba
Q. nigra
Q. rubra
S. tinctoria
Acer leucoderme 0.324 0.558 0.621 0.688 0.001 0.722 0.811 0.852 0.422 0.122 0.330 0.641Acer rubrum 0.443 0.560 0.240 0.125 0.504 0.431 0.356 0.675 0.489 0.796 0.610Cornus florida 0.767 0.374 0.000 0.530 0.546 0.494 0.573 0.170 0.447 0.666Crataegus sp. 0.039 0.014 0.579 0.586 0.556 0.585 0.291 0.545 0.717Fagus grandifolia 0.000 0.696 0.749 0.732 0.308 0.074 0.242 0.509Kalmia latifolia 0.157 0.020 0.031 0.307 0.567 0.235 0.042Liriodendron tulipifera 0.819 0.810 0.587 0.341 0.520 0.740Nyssa sylvatica 0.876 0.504 0.191 0.437 0.703Oxydendrum arboreum 0.438 0.173 0.360 0.650Quercus alba 0.549 0.780 0.700Quercus nigra 0.624 0.283Quercus rubra 0.610

30
Table 2.3. Weighted cross species niche overlap, using adapted index weighted for species abundance.
Species A. rubrum
C. florida
Crataegus sp.
F. grandifolia
K. latifolia
L. tulipifera
N. sylvatica
O. arboreum
Q. alba
Q. nigra
Q. rubra
S. tinctoria
Acer leucoderme 0.246 0.788 1.266 1.198 0.034 0.207 0.26 0.494 0.737 0.129 0.392 0.257Acer rubrum 0.197 0.242 0.132 0.041 0.114 0.113 0.148 0.259 0.128 0.259 0.159Cornus florida 0.773 0.439 0.00278 0.144 0.177 0.29 0.532 0.0699 0.291 0.216Crataegus sp. 0.509 0.0262 0.154 0.186 0.333 0.662 0.122 0.381 0.335Fagus grandifolia 0.0029 0.193 0.253 0.48 0.375 0.045 0.199 0.226Kalmia latifolia 0.029 0.0091 0.0223 0.308 0.166 0.145 0.016Liriodendron tulipifera 0.198 0.216 0.168 0.0736 0.138 0.177Nyssa sylvatica 0.263 0.172 0.0524 0.135 0.185Oxydendrum arboreum 0.278 0.0772 0.193 0.238Quercus alba 0.25 0.518 0.231Quercus nigra 0.192 0.076Quercus rubra 0.201

31
Table 2.4. Weighted cross species niche overlap, using adapted index weighted for total basal area for each species.
Species A. rubrum
C. florida
Crataegus sp.
F. grandifolia
K. latifolia
L. tulipifera
N. sylvatica
O. arboreum
Q. alba
Q. nigra
Q. rubra
S. tinctoria
Acer leucoderme 0.0063 0.1919 0.0483 1.0414 0.0034 0.6290 0.1890 0.9481 0.5170 0.2125 0.4448 0.0144 Acer rubrum 0.0056 0.0061 0.0064 0.0011 0.0064 0.0064 0.0064 0.0064 0.0064 0.0064 0.0061 Cornus florida 0.0470 0.1919 0.0003 0.1919 0.1061 0.1919 0.1919 0.1080 0.1919 0.0127 Crataegus sp. 0.4828 0.0010 0.0483 0.0483 0.0483 0.0483 0.0465 0.0483 0.0124 Fagus grandifolia 0.0026 0.6651 0.1916 1.0345 0.7081 0.2393 0.5949 0.0146 Kalmia latifolia 0.0341 0.0038 0.0164 0.0344 0.0344 0.0344 0.0009 Liriodendron tulipifera 0.1929 0.7255 0.5243 0.3380 0.5912 0.0147 Nyssa sylvatica 0.1929 0.1447 0.1041 0.1383 0.0142 Oxydendrum arboreum 0.5419 0.2719 0.4821 0.0145 Quercus alba 0.9573 1.3206 0.0141 Quercus nigra 1.3599 0.0123 Quercus rubra 0.0134

32
Table 2.5. Community niche overlap estimates, based on weighting factor.
Weighting Factor Overlap Unweighted 0.464Abundance 0.256Total basal area 0.230

33
Figure 2.1. Overlap between the same two species, Kalmia latifolia (solid line) and Fagus grandifolia (dotted line), with three different
weighting factors: (a) with unweighted kernel method, (b) weighted by abundance, and (c) weighted by total basal area.
A B C

34
Figure 2.2. Overlap between the same two species, Oxydendrum arboreum (solid line) and Nyssa sylvatica(dotted line), with three
different weighting factors: (a) with unweighted kernel method, (b) weighted by abundance, and (c) weighted by total basal area.
A B C

35
CHAPTER 3
EVOLUTION OF FUNCTIONAL EQUIVALENCE: EXPLORING THE IMPACT OF
SPECIES DIVERSITY, MULTIPLE LINKED TRAITS, DISPERSAL LIMITATION,
AND SPATIAL STRUCTURE ON TRAIT EVOLUTION IN A MULTI-SPECIES
SIMULATION MODEL1
1 Lake, JK, L.A. Borda de Agua, and S.P. Hubbell. To be submitted to Ecology Letters.

36
Abstract
Understanding how functional traits of species may evolve under varying
ecological conditions directly addresses some of the fundamental mechanisms driving
community assembly. Traditional ecological theory has posited that species that are too
ecologically similar cannot coexist, and that competition should lead to niche
differentiation or to extinction of one of the competing species. However, Hurtt and
Pacala (1995) suggested that dispersal and recruitment limitation can severely retard
competitive exclusion. Hubbell (2006) has shown circumstances that can lead to the
evolution of functionally equivalent species that subsequently coexist, seemingly stably,
for thousands of community turn-overs. Using simulations, we explore the interacting
impacts of species richness, habitat heterogeneity, multiple, linked traits, and varying
levels of dispersal limitation on trait evolution and community persistence. We find that
fine-scale habitat heterogeneity always leads to broad ecological equivalence and long-
term species persistence, while the outcome of simulations with coarse-scale
heterogeneity depends on other factors. With weak dispersal limitation and no linkage,
many species typically become extinct, and one or two species dominate most of trait and
habitat space. With stronger dispersal limitation, and clumped initial species distribution,
classical niche differentiation evolves, while random initial distribution of species leads
to species displaying multiple ecotypes. So long as dispersal limitation is strong, most or
all species persist for the duration of the simulations. These findings differ substantially
from prior work, likely because we implemented the unique combination of spatially
explicit interactions along with using a genetical model of trait evolution that more
closely mimics “real world” plant reproduction.

37
Introduction
From the beginning of the study of community ecology in the 1880’s, coexisting
species have been assumed to require a limiting similarity in resource usage and
functional traits such that greater similarity would lead one to competitively exclude
another (Gause 1934; Hutchinson 1959; MacArthur and Levins 1967). In communities
consisting of only a few species, particularly animal communities, this model seems well-
supported both theoretically and empirically (e.g., Connell 1961; Werner and Hall 1976;
Bengtsson 1989). Limiting similarity and competitive exclusion in spatially structured
plant communities is much less well-documented, however, particularly when
communities contain more than two or three species (i.e., Fowler 1981; Clatworthy and
Harper 1962; but see Stubbs and Wilson 2004).
Recently, neutral theory has challenged this classical paradigm of community
niche assembly (Hubbell 2001). By demonstrating strong fits to natural systems with a
community model parameterized only with community size, migration rates, and
speciation, neutral theory spurred ecologists to delve into the mechanisms resulting in
observed community abundance patterns (e.g., Chave et al. 2002; Tilman 2004).
Although most ecologists continue to invoke niche differences as driving community
assembly (see Chase and Leibold 2003; McGill et al. 2006), Bell (2001) notes that the
patterns predicted by neutral theory can be achieved either through a “strong version”,
where species are truly ecologically equivalent, or, alternatively, that the patterns result
from a “weak version”, where a combination of underlying mechanisms of relatively
weak effect join to produce the observed patterns.

38
While equivalence in traits is not required for assumptions of neutrality to be
upheld (only demographic equivalence is needed, so trait-driven, fitness equalizing trade-
offs are not excluded), ecological equivalence in traits coupled with demographic
equivalence provides perhaps the strongest evidence for neutral theory. Critiques of
neutrality commonly arise from observations that “species are just different from one
another”, and while this is true, much more seldom are these trait differences tied to
demographic differentiation. While it is possible that stochastic effects or a variety of
forces of relatively small effect simply swamp species-level fitness differences (Bell
2001; Hubbell 2001), making functional traits irrelevant to species’ success and leading
to the patterns predicted under neutral theory, it is also possible that species are truly
“doing the same thing”, at least to a first approximation, and that doing so may be the
evolutionarily optimal strategy under certain ecological conditions. Indeed, while
ecological equivalence among coexisting trophically similar species is highly
controversial for most ecologists, and anathema to traditional views on community
assembly, there are demonstrated circumstances under which close competitors (Hurtt
and Pacala 1995) or ecologically equivalent species can persist for a very long time
(Hurtt & Pacala 1995; Hubbell 2006).
However, most theoretical work has focused on mechanisms of trait divergence
among species and coexistence through niche differentiation and tradeoffs (e.g., Tilman
1982; Lehmann and Tilman 1997; Chave et al. 2002), arguing that too similar of species
would not arise, and if they did, evolutionary forces would either lead to selection for
diversification, or to competitive exclusion. Rarely, if ever, has the evolution of traits
within a broader ecological community comprised of many trophically similar species

39
been modeled, and then, it has usually focused on the evolution of trade offs (see Hubbell
2006). Indeed, Lehmann and Tilman (1997) specifically demonstrated that species would
tend to evolve unique niches with regular spacing and little overlap in order to coexist.
Their model allowed narrow phenotypic shifts in evolutionary time, and sympatric
speciation, essentially packing the competition/colonization trade-off axis with species
over hundreds of thousands of time steps. In this model community, coexistence was
largely limited only by the size of the system. However, the nature of the assumptions on
which this experiment was built virtually guaranteed the outcome. Because species were
treated as monolithic entities following the species mean closely, most did not have the
opportunity to evolve a generalist strategy; furthermore, by modeling trait evolution as
incremental changes to phenotypic mean, it would be hardly surprising to find species
differentiating into narrow niche space.
Although evolution of functional equivalence and persistence of equivalent
species have seldom been modeled, there are a number of hypotheses suggesting
circumstances that ought to favor either the evolution of equivalence, persistence of
similar or identical species, or both. Perhaps most well-documented of these factors is
the role of dispersal limitation in the context of species coexistence. Hurtt and Pacala
(1995) demonstrated theoretically that strong and severe dispersal limitation could
drastically slow the competitive exclusion of weaker competitors simply by preventing a
given species from reaching all of its “ideal” sites.
Gravel et al. (2006), in pointing out the role of both niche and neutral processes in
structuring communities, showed some circumstances that would tend to favor neutrality
in community structure. These included increased neutrality with increasing species

40
richness (a result also predicted by Hubbell and Foster 1986), increased immigration
from outside the local community, a more fine grained environment (results similar to
those in Hubbell 2006), and longer local dispersal distances. This last result seems to
contradict the work of Hurtt and Pacala (1995), where increasing dispersal limitation
increased the persistence of similar species, but it is possible that the differences in grain
of environment under consideration may have led to these divergent results. However,
the authors again did not use a genetical model of trait evolution.
Hubbell (2006) demonstrated some circumstances under which functional
equivalence could arise in a local community, although the model did not test the effects
of many varying parameters. While showing that functional equivalence could evolve so
long as the environment was fine-grained in nature, this study also found that a coarse-
grained habitat could lead species to evolve and maintain widespread polymorphism for
the selected trait.
In this paper, we fundamentally seek to answer the questions: 1) Are there
realistic scenarios under which we would expect species in a community to evolve
ecological equivalence; and 2) If so, can those ecologically equivalent species coexist?
To more explicitly address those questions, we ask, do species exposed to a similar range
of environmental conditions tend to converge on similar trait values and thus, ecological
equivalence? Here, we further explore what ecological and species circumstances may
lead to the evolution of various trait and niche structures in communities. Specifically,
we explore: 1) the impact of fine- vs. coarse-grain spatial arrangement of habitat types; 2)
the role of initial clumping or random distribution of species; 3) the importance of trait
linkage; 4) the impact of varying degrees of dispersal limitation; and 5) the initial species

41
richness in a community. We use simulation-based modeling of the evolution of two
traits, each governed by many genes of small effect, with selection for those traits driven
by two habitat variables. We track trait evolution and the persistence of those species
over many generations. To our knowledge, this is the first such study to incorporate
multiple, linked traits, a genetical model of trait evolution, and spatially explicit, kernel-
based dispersal limitation of varying strengths.
The Model
As in Hubbell (2006), we built on the initial model of Hurtt and Pacala (1995).
With no loss of generality, we consider a community of 100,000 or 500,000 sites, or cells
(which can be occupied by 10 and 50 species, respectively) with periodic boundary
conditions to control for edge effects. Each cell is the site for a single individual, and is
represented by two independent habitat values, each ranging from 0-40. To initialize,
each cell was randomly (or, in later models, in a clustered fashion) assigned two
independent habitat values ranging from 0-40, and a species number. Habitat variables
were drawn from β (5,2) and β (2,5) distributions (which are mirrors of one another; see
figure 1). Species were randomly sampled from a uniform abundance distribution, so
starting abundances for all species were close to the total number of cells divided by
number of species (about 10,000 in these simulations). In the first two scenarios, these
species were initially randomly assigned to cells; in the third, conspecific individuals
were clustered together.
The simultaneous evolution of two traits was studied, each modeled as a
quantitative trait driven by additive genes of small effect for each trait (20 loci, diploid

42
organism, value of 0 or 1, so that the summation of all loci can result in genotype values
from 0-40). These additive trait values were then used as a measure of “fit” to habitat
variables—with each trait tied to its respective habitat. Linkage of these traits was
modeled by weighting the probability of an allele in a given position “hitch-hiking” with
the allele for the first trait. Linkage probabilities were either 0 (no linkage, random
assortment) or 1 (complete linkage). Each individual was randomly assigned a genotype
through repeated binomial sampling, mean=0.5, for each locus.
At each time step, all individuals were first mated, then killed and replaced, with
complete turn-over of the community at each time step. Mating was established by
selecting the nearest conspecific within a 100 cell distance in each direction; if no
conspecific was found, the individual was selfed. Following pollination, a pool of 100
potential replacements for each cell was built by sampling from within the neighborhood.
Dispersal limitation determined which potential parents from the prior generation could
get offspring to the site, and was modeled as an exponential decay kernel with exponent
levels of 0.1 and 1.0. From the pool of potential replacements, the site “winner” was
selected by choosing the individual with the least total distance between genotype values
and the habitat values for the cell in question.
Three main “starting scenarios” were run. The first scenario was with fine-scale
(ie, uncorrelated) habitat levels and fully randomly distributed species. This scenario
allowed all species to sample all habitats and to encounter all other species. Scenario 2
retained random initial species distributions, but added significant habitat autocorrelation,
or “coarse-scale” habitat heterogeneity, with habitats following a full single cycle of
increasing, then decreasing values along the linear habitat gradient. The second set of

43
habitat variables were offset by 0.125 of the length of the cycle so that the two habitat
values were not strongly correlated with one another. This scenario still allowed species
to fully sample available habitat. The third scenario used a clumped starting species
distribution across coarse-scale habitats, leading species to only be able to sample one or
a few habitats, particularly with strong dispersal limitation.
All simulations were run for 1000 turnovers; this proved more than adequate time
for genotype frequencies and species abundance to stabilize in the community. Note that
this does not equate to true “stable equilibrium” levels because of the stochastic nature of
the simulations, merely a point where strong and ongoing directional trends in abundance
and genotype was no longer occurring. Each model scenario and possible combination of
linkage (0 or 1), number of species (10 or 50), and dispersal exponent (0.1 or 1.0) was
run 10 times, each with a different initializing seed to ensure consistency of results.
Because we typically began simulations with all species sharing a shared genotype
distribution, we were concerned that any findings of evolved equivalence would simply
be written off as “starting equivalence-ending equivalence”. Therefore, we also
conducted a series of simulations with species’ means starting out evenly spaced over
niche space (see fig. 2A for distribution).
We analyzed data from the simulations for longevity of species (number
persisting after 1000 generations), as well as for a variety of trait characteristics. In
addition to reporting the range of species mean trait values in simulations, we also
calculated the standard deviations around the species means, and report the ranges found;
this is one representation of the breadth of trait space used by the species present. We
also report both the minimum and maximum pairwise Euclidean distances between

44
species means, as well as the range of overall mean Euclidean distances found in the
simulations. Finally, we report the degree of niche overlap, following the methods
proposed by Mouillot et al. (2005). For each species and trait, a trait distribution was
calculated using a kernel estimator, and then calculating pairwise overlaps in trait space
of coexisting species. Overlap is simply represented as the integral of the area under the
species’ respective kernel curves when overlaid on one another. From these pairwise
overlaps, a community-wide overlap index is then calculated, simply by averaging these
overlaps; comparably, multiple traits can be averaged for a multi-trait average overlap.
Results
Although this model was extensively modified from the basic approach of
Hubbell (2006), we found qualitatively similar results to those presented earlier under all
three scenarios, so long as strong dispersal limitation was maintained within the model.
However, both explicit dispersal limitation and trait linkage produced a number of
interesting interactions with the starting scenario, as did starting species numbers. Here,
we outline the major findings for these three main scenarios.
Scenario 1: Fine scale habitat, no species clustering – Role of dispersal limitation, trait
linkage, number of species
Under scenario 1, with fine-scale distribution of habitat and no initial species
clumping, in no case did any species go extinct. These simulations consistently produced
the most overall trait overlap, and the smallest differences among coexisting species. The
lowest reported mean trait overlap within these scenarios was 0.39, while 0.20 was the
highest reported in any other scenario. Overall trait evolution, however, differed

45
depending upon the number of species, dispersal limitation, and trait linkage. Increasing
the number of species had relatively little overall effect on trait evolution and interacted
little with other factors. The 50 species simulations tended to produce somewhat more
trait overlap and slightly lower mean Euclidean distances between species than the 10
species scenario, which is not surprising given that the amount of niche space had not
increased while the number of species did.
Strong dispersal limitation (d = 1.0) produced a narrower range of mean trait
values for species, less distance between the means, and broader niched species than
weak dispersal limitation (d = 0.1). Trait overlap was also higher in simulations with
strong dispersal limitation (0.73-0.84) than weak dispersal limitation (0.39-0.61). Note
the differences among the four sample scenarios in fig. 3. Trait linkage had no
discernible effect on trait values under scenario 1.
Because we did find strong trait overlap and broad equivalence in these situations,
we chose to address the potential critique of “starting similarity might lead to ending
similarity”. In simulations with strongly niche-differentiated species, the species still
evolved broad equivalence and overlap during the course of the simulation (see fig. 2B
for results). Note that two species did go extinct almost immediately in this simulation;
each of these species was initially specialized on a part of niche space for which there
was essentially no available habitat. Therefore, their extinction is not surprising, and
indeed confirms the strong selective environment to which all species in these
simulations are exposed.
46
Scenario 2: Coarse-scale habitat, species not clustered – Role of dispersal limitation,
trait linkage, and number of species
In the second scenario, with the habitat aggregated into a coarse-scale pattern and
species initially distributed randomly across the landscape, species number, linkage and
dispersal limitation all impact both species survival and trait distributions. Overall, this
scenario consistently produces a suite of species with most or all species having multiple
“ecotypes”, or trait peaks. Beyond this observation, however, these simulations produce
the most variable and least predictable set of results, as well as the most complex set of
interactions among factors.
Increasing the initial number of species from 10 to 50 decreases the percentage of
species surviving 1000 generations (60-100% in 10 species system; 52.5-88% in 50
species). Higher initial species diversity results in species means ranging over a broader
set of niche space, greater mean Euclidean distance among species, and, somewhat
paradoxically, a broader range of species’ niche breadths. In spite of packing additional
species into the same potential niche space, species trait overlap is also lower with higher
starting numbers of species (0.04-0.06 vs. 0.08-0.20).
Trait linkage resulted in higher species survival, somewhat higher trait overlap,
reduced Euclidean distances between species’ trait means, and a narrower range of mean
trait values, at least in the low diversity scenario. Comparably, increasing dispersal
limitation also increased species survival, but had little impact overall on trait evolution.
However, there seem to be complex interactions when all three factors are considered in
combination. Notice, in particular, the lower number of surviving species, broader range
of species trait means and higher Euclidean distance between species in the unlinked, low

47
diversity scenario with little dispersal limitation. In terms of traits, the other three low-
diversity scenarios are quite similar to one another. This pattern, however, does not exist
within the higher diversity scenario.
With no trait linkage and low dispersal limitation (d = 0.1), about half of the
initial species became extinct within 1000 generations, and one or a few species dominate
the system. The most common species tend to occupy much of trait space, while those of
middling abundance tend to be polymorphic for the traits, and rare species habitat
specialists (fig. 4A). In contrast, strong dispersal limitation leads to high species
persistence, and most species developed multiple ecotypes, a sort of polymorphic
generalist strategy that develops quite rapidly and is stable for the long-term (fig. 4B).
Genetic linkage between the two traits serves as a surprising stabilizing
mechanism in the absence of dispersal limitation. With weak dispersal limitation (d =
0.1), but full genetic linkage (l = 1.0), traits again were distributed into multiple ecotypes
within most or all species (fig. 4C). Adding dispersal limitation (d = 1.0) changes
abundances and patterns very little from the above scenario (fig. 4D).
Scenario 3: Coarse-scale habitat, species initially clumped – Role of dispersal
limitation, trait linkage, number of species
The third scenario, with coarse-scale habitat and a clumped initial distribution of
species led to a result most similar to classical “niche differentiation.” The starting
species diversity, dispersal limitation and trait linkage had impact on species longevity
and trait distributions. Consistently, this scenario produced relatively classically “niche
differentiated” species within communities, with each species having a single trait peak

48
and with values distributed relatively narrowly around that value. It also was the scenario
allowing the lowest overall percent persistence of species, ranging as low as 50%.
Increasing species numbers led overall to more species extinctions in spite of
starting species with the same average population size in all scenarios (average
persistence of 73-99% of species for 10 species vs. 45.6-77.4% for 50 species
communities). Higher starting species number also resulted in species means ranging
over a broader set of niche space, lower overall niche breadth, and, surprisingly, lower
species trait overlap in spite of more species being packed into the same total niche space
(0.03-0.05 vs. 0.08-0.17). Increasing dispersal limitation allowed additional species to
persist, and tended to lead to more niche differentiated species with lower niche breadths
and trait overlap. Comparably, trait linkage increased the number of species persisting.
Again, there are complex interactions between these factors, leading to different survival
patterns, in particular, with the high vs. low diversity simulations.
In scenarios with no trait linkage and low dispersal limitation (d = 0.1), many of
the initial species disappear within 1000 turn-overs, and a few species dominate the
system. The most common species tend to occupy much of trait space, while rarer
species are more specialized, and, though trait means are quite widely dispersed, there is
considerable overlap among species (Fig. 5A). When dispersal limitation is increased to
d =1.0, while maintaining no trait linkage, a classical scenario of niche differentiation
emerges (fig. 5B). Species closely track habitat values, and species are able to coexist on
similar habitat values so long as they (and the habitat values) are fairly well isolated in
space.

49
Adding trait linkage produced surprising results, particularly in scenarios with
weak dispersal limitation. In the low diversity scenario, when full linkage (l=1.0) is
invoked with low dispersal limitation, species are able to disperse to multiple habitats in
spite of their initially clustered situation (fig. 5C). This scenario led to convergence
toward similar trait means among the different species. When strong dispersal limitation
was added (d = 1.0), trait distributions were very similar to those seen without trait
linkage (Fig. 5D).
Discussion
In these simulations, trait evolution has proven sensitive to a variety of both
environmental and species-driven factors, but we have shown that under many
circumstances, ecologically equivalent species can arise easily and persist indefinitely
within an ecological community. Indeed, our results suggest that evolving equivalence is
the route most frequently leading to the (relatively) stable coexistence of species over the
long term. While some of our results were expected, a number of factors proved both
surprising in their direct impacts and in the results of their interactions with other factors.
These interactions are important to understanding the ultimate outcomes of our
simulations.
Dispersal limitation
In terms of persistence in the community, dispersal limitation behaved quite
consistently, regardless of other factors at work. Dispersal limitation serves as a strong
stabilizing mechanism in communities, radically slowing rates of extinction, much as
demonstrated by Hurtt and Pacala (1995). Interestingly, in simulations with fine scale

50
habitat distribution, dispersal limitation was unimportant for the number of species
surviving to the completion of the simulations. In all of these simulations, no species
became extinct, suggesting strong stabilization with a shared generalist phenotype. This
scenario was the one with true ecological equivalence—in most cases, species showed
widespread exploitation of most or all available habitat values, strong niche overlap and
very similar mean trait values.
The impact of dispersal kernels on trait evolution, however, is more scenario-
dependent. In scenario 1, wider dispersal led to somewhat more differentiation in trait
means (not unlike a guild-structured community) than did limited dispersal. Greater
dispersal distances cast genotypes and species more broadly into competition with each
other, and thereby selected for weak niche differentiation. These results overall were in
contrast to the increased equivalence Gravel et al. (2006) found in more freely dispersing
simulations. Gravel’s relatively small (but not single celled) patch size, combined with
dispersal distances likely led to these seemingly divergent results.
Trait Linkage
The impact of trait linkage also seems to be scenario dependent, with little visible
effect in scenario 1, but stronger effects in 2 and 3, especially cases with little dispersal
limitation, and particularly on species survival. Linkage consistently allowed additional
species to persist throughout the simulations by slowing or preventing the evolution of an
“ideal” genotype for a given site. Surprisingly, though, it favored more ecological
equivalence, particularly in the absence of strong dispersal limitation in both coarse-scale
habitat simulations—more of an ecotypic generalist approach when species are not

51
initially clumped. These probably result from a combination of sampling a wider range of
habitats and the slowed evolution imposed by the linkage of traits.
Number of Species
Within scenario 1, overlap increased with number of species, supporting the idea
that more species leads to a stronger shared common generalist strategy (Hubbell and
Foster 1986). However, the overlap and shared strategy was high regardless of number
of species, so it seems likely that a system with as few as ten species has enough
unpredictability of neighborhood to promote diffuse pairwise selection and thus,
ecological equivalence among coexisting species, so long as dispersal is limited and
environmental factors are not highly autocorrelated.
In the other two scenarios, increasing the number of species increased the niche
structure in the community. As species numbers increased, there was less trait overlap,
trait means spanned a wider range of trait space, and in scenario 3, less variance around
species’ trait means. This suggests that individual species are specializing more on a
particular habitat type as the number of species increases, in contrast with the
expectations of Hubbell and Foster (1986) and Gravel et al. (2006). However, we only
observed this result in the case when habitat is coarse-grained.
Fine vs. Coarse-Grained Habitat
Not surprisingly, the scale or grain of habitat has a profound impact on the
evolution of functional traits within a community. More interestingly, it seems,
whenever species are able to disperse to a wide variety of habitat conditions, they tend to
evolve toward a generalist strategy. Note that even when species start out clustered in

52
coarse-grained habitat, so long as they are able to disperse widely, they continue to
sample and adapt to a wide variety of ecological conditions (fig. 4A,C).
It may be argued that most habitat values will be coarse-grained in nature—where
individuals and populations are not able to experience the full range of values. However,
we would argue that many ecologically relevant plant traits in fact deal more with
resources that are quite patchily distributed. Consider scenario 1, the fine scale habitat
and lack of initial clustering of species. In the context of a forest community, light gaps
are often much like this scenario—with particular light levels shown in only one or a few
open sites (at least sites available to a mature individual) (ie, Denslow 1986) and with
species not highly clumped, at least to a first approximation (Hubbell and Foster 1986).
On the other hand, soil nutrients may provide an example of a more coarse-scale habitat
factor (ie, Hubbell et al. in press; John et al. 2007), but even so, species clumping and
dispersal limitation seldom prevent species from experiencing most of the diverse types
of habitat available (as modeled in scenario 3).
Importance of Ecotypes within a Species
In a more dispersal limited scenario, individual species that experience selection
from multiple habitat types (in a coarse-grained habitat matrix) tend to develop spatially
segregated ecotypes that seldom disperse to populations of or mate with other conspecific
ecotypes (fig. 2). This suggests that Levins (1968) was right in highlighting the
importance of both environmental scale and degree of habitat differentiation in the
persistence of multiple ecotypes within a species.

53
Role for individuals
While some authors (i.e., Rueffler et al 2006; Ackerly and Cornwell 2007) have
begun to highlight the importance of considering the traits of individuals when
considering ecological interactions, most work has focused mostly on trait means when
considering species composition within a community (ie, Gravel et al. 2006; Lehmann
and Tilman 1997). Our work suggests that considering trait means, or even mean and
variance, is inadequate when considering how species are distributed within a
community. After all, it is the individual that is interacting with both its biotic and
abiotic environment, and traits at the level of that individual will determine its success or
failure.
Reconciling niche and neutrality?
Recently, a number of authors have suggested possible methods of considering
niche and neutral processes as extremes of a continuum of methods of structuring a
community (ie, Adler et al. 2007; Gravel et al. 2006). The results presented here may
provide insight to help us to reconcile the seemingly intractable differences between
strongly niche and neutral world views. Some of the strongest evidence for classical
niche processes driving plant communities comes from work in grasslands (i.e., Tilman
2004; Adler 2004), while Hubbell et al. (in press) provide strong evidence that these sorts
of approaches have little or no predictive power in species rich tropical forest systems. It
is worth noting that prairie plants, relative to their size, likely perceive a heavily spatially
autocorrelated environment in terms of soil moisture and nutrients, and light levels are
relatively constant across a landscape. In contrast, trees (particularly adult individuals, as

54
modeled here) likely perceive a much finer grained habitat relative to adult size. While
we do not claim to capture all of the many complexities in an ecological community in
this relatively simple model, it is worth noting that these results are, at a minimum,
consistent with seemingly disparate empirical results observed in these plant
communities.
Conclusion
In spite of repeated critiques of ecological equivalence and neutral theory as
unrealistic, unlikely in nature, or even a virtual impossibility, ecological equivalence in
relevant traits can evolve, and equivalent (or very similar) species can coexist for a very
long time without directional change in either traits or abundance. The ecological
conditions simulated are neither terribly unrealistic nor rare. Interactions among the
grain of environmental variables, dispersal limitation, and trait linkage often produce
surprising results. Perhaps most shocking to us was the prevalence of conditions that led
to the evolution of either truly equivalent generalists or multiple ecotypes within a single
species. Indeed, only in cases with coarse-grained habitat, clustered initial species
distributions, and strong dispersal limitation did classical niche differentiation develop.
These results suggest that we may frequently expect to find ecological equivalence, or at
least ecotypic generalists, within spatially structured plant communities.

55
Literature Cited Ackerly, D.D. & Cornwell, W.K. 2007. A trait-based approach to community assembly:
partition of species trait values into within- and among- community components. Ecology Letters 10: 135-145.
Adler, P.B. 2004. Neutral models fail to reproduce observed species-time and species-area relationships in Kansas grasslands. Ecology 85: 1265-1272.
Adler, P.B., HilleRisLambers, J., and J.M. Levine. 2007. A niche for neutrality. Ecology Letters 10: 95-104.
Bell G. 2001. Neutral macroecology. Science, 293, 2413-2418. Bengtsson, J. 1989. Interspecific competition increases local extinction rate in a
metapopulation system. Nature 340: 713-715. Chase, J.M. & Leibold, M.A. 2003. Ecological niches. University of Chicago Press,
Chicago, IL. Chave J., Muller-Landau H.C. & Levin S.A. 2002. Comparing classical community
models: Theoretical consequences for patterns of diversity. American Naturalist, 159, 1-23.
Clatworthy, J.N. and Harper, J.L. 1962. The comparative biology of closely related species living in the same area. V. Inter- and intraspecific interference within cultures of Lemna spp. And Salvia natans. Journal of Experimental Botany 13: 307-324.
Connell, J.H. 1961. The influence of interspecific competition and other factors on the distribution of the barnacle Chthamalus stellatus. Ecology, 42, 710-723.
Denslow, J. 1980. Gap partitioning among tropical rain forest trees. Biotropica (Suppl.) 12: 47-55.
Fowler, N.L. 1981. Competition and coexistence in a North Carolina grassland II. The effects of the experimental removal of species. Journal of Ecology 69: 843-854.
Gause, G. F. 1934. The struggle for existence. Williams & Wilkins. Baltimore, MD. Gravel D., Canham C.D., Beaudet M. & Messier C. 2006. Reconciling niche and
neutrality: the continuum hypothesis. Ecology Letters, 9, 399-409. Hubbell S.P. 2006. Neutral theory and the evolution of ecological equivalence. Ecology,
87, 1387-1398 Hubbell S.P. 2001. The Unified Neutral Theory of Biodiversity and Biogeography.
Princeton University Press, Princeton. Hubbell, S.P. & Foster, R.B. 1986. Biology, chance, and history and the structure of
tropical train forest tree communities. pp. 314-329. In: Diamond, J. & Case, T.J. Community Ecology. Harper and Row, New York, NY.
Hurtt G.C. & Pacala S.W. 1995. The consequences of recruitment limitation: reconciling chance, history and competitive differences between plants. Journal of Theoretical Biology, 176, 1-12
Hutchinson, G.E. 1959. Homage to Santa Rosalia; or, why are there so many kinds of animals? The American Naturalist 93: 145-159.
John, R. et al. 2007. Soil nutrients influence spatial distributions of tropical tree species. Proceedings of the National Academy of Sciences, USA104: 864-869.

56
Lehmann, C.L. & Tilman, D. 1997. Competition in spatial habitats. In: Tilman, D. & P. Kareiva, eds. Spatial Ecology: The Role of Space in Population Dynamics and Interspecific Interactions. Princeton University Press, New Jersey.
Levins R. 1968. Evolution in Changing Environments. Princeton University Press, Princeton.
MacArthur, R.H. & Levins, R. 1967. The limiting similarity, convergence and divergence of coexisting species. The American Naturalist 101: 377-385.
McGill, B. et al. 2006. Rebuilding community ecology from functional traits. TRENDS in Ecology and Evolution 21: 178-185.
Mouillot, D. et al. 2005. Niche overlap estimates based on quantitative functional traits: a new family of non-parametric indices. Oecologia 145: 345–353.
Rueffler, C., Egas, M., and Metz, A.J. 2006. Evolutionary predictions should be based on individual-level traits. The American Naturalist 168: E148-E162.
Stubbs, W.J. & Wilson, J.B. 2004. Evidence for limiting similarity in a sand dune community. Journal of Ecology 92: 557-567.
Tilman, D. 2004. Niche tradeoffs, neutrality, and community structure: A stochastic theory of resource competition, invasion, and community assembly. Proceedings of the National Academy of Sciences 101:10854-10861.
Tilman, D. 1982. Resource Competition and Community Structure. Princeton University Press, Princeton, NJ.
Van Valen, L. 1965. Morphological variation and the width of ecological niche. The American Naturalist 99: 377-390.
Werner, E.E. and Hall, D.J. 1976. Niche shifts in sunfishes: experimental evidence and significance. Science 191: 404-406.

57
Table 3.1. Summary statistics of trait values and species persistence based on all simulations, Scenario 1.
S D L
Range of Sp. Means, 10 runs, T1
Range of SD's within
spp, high and low for 10
runs, T1
Range of Sp.
Means, 10 runs, T2
Range of SD's within
spp, high and low for 10
runs, T2
Range of average
Euclidean distances among all
species, 10 runs
Range of pairwise Euclid
distances, all runs
T1 Overlap Range
T2 Overlap Range
Mean Trait
Overlap Range, 10 runs
Mean #
spp.
Range of # of Spp
10 0.1 0 18.35-35.84 1.87-7.62 4.22-22.25 1.86-8.16 8.33-10.51 0.37-21.28 0.37-0.49 0.34-0.56 0.39-0.50 10 10 10 0.1 1 17.34-36.00 1.77-7.07 3.78-21.73 1.40-6.37 8.24-10.28 0.33-21.47 0.38-0.55 0.39-0.53 0.41-0.53 10 10 10 1 0 23.15-33.20 3.83-7.55 7.28-17.91 4.29-7.69 2.55-5.14 0.15-10.17 0.74-0.84 0.70-0.83 0.73-0.82 10 10 10 1 1 24.27-32.74 3.87-7.61 6.95-14.55 3.76-7.61 1.69-3.97 0.20-8.71 0.76-0.84 0.73-0.86 0.75-0.84 10 10 50 0.1 0 18.63-35.93 2.13-8.95 4.60-21.28 2.12-9.06 5.60-6.74 0.02-18.66 0.56-0.62 0.57-0.62 0.58-0.61 50 50 50 0.1 1 18.35-35.60 1.96-8.89 3.86-21.00 1.91-8.92 5.51-6.24 0.10-18.86 0.57-0.64 0.57-0.63 0.59-0.61 50 50 50 1 0 26.39-31.28 4.94-7.62 8.69-14.05 4.86-7.33 1.42-1.71 0.01-4.94 0.83-0.84 0.83-0.85 0.83-0.84 50 50 50 1 1 26.18-31.79 4.83-7.64 8.12-14.17 4.92-7.52 1.45-1.74 0.02-5.58 0.82-0.84 0.82-0.84 0.83-0.84 50 50

58
Table 3.2. Summary statistics of trait values and species persistence based on all simulations, Scenario 2.
S D L
Range of Sp. Means, 10 runs, T1
Range of SD's
within spp, high and low for 10 runs, T1
Range of Sp.
Means, 10 runs, T2
Range of SD's
within spp, high and low for 10 runs, T2
Range of average
Euclidean distances among all species, 10 runs
Range of pairwise Euclid
distances, all runs
T1 Overlap Range
T2 Overlap Range
Mean Trait
Overlap Range, 10 runs
Mean #
spp.
Range of # of Spp
10 0.1 0 8.04-38.81 0-8.45 2.79-30.49 0.00-9.08 8.71-14.71 0.57-33.30 0.06-0.16 0.07-0.16 0.08-0.14 7.6 6-9 10 0.1 1 20.11-37.96 0-10.71 3.00-22.44 0.00-9.73 4.65-8.32 0.30-20.23 0.12-0.19 0.12-0.21 0.13-0.20 9.8 9-10 10 1 0 17.74-39.14 0-10.41 3.71-23.44 0.00-12.03 4.74-10.09 0.36-24.21 0.10-0.14 0.10-0.13 0.10-0.13 9.9 9-10 10 1 1 19.76-34.27 1.78-9.27 3.64-20.69 1.63-8.87 4.04-6.14 0.20-15.33 0.13-0.17 0.16-0.20 0.15-0.18 10 10 50 0.1 0 4.79-40.00 0.00-12.85 0.96-35.32 0.00-12.00 9.77-12.64 0.00-39.11 0.04-0.06 0.04-0.06 0.04-0.06 28.5 21-35 50 0.1 1 4.71-40.00 0.00-11.16 0.00-35.24 0.00-11.94 9.28-10.74 0.12-36.42 0.04-0.06 0.046-0.055 0.04-0.05 40.4 37-43 50 1 0 3.08-40.00 0.00-11.86 0.58-37.06 0.00-12.74 9.33-14.51 0.07-42.38 0.03-0.05 0.03-0.05 0.04-0.05 35.3 31-39 50 1 1 8.59-40.00 0.00-13.06 0.93-36.97 0.00-14.77 9.27-11.66 0.14-38.83 0.04-0.05 0.04-0.05 0.04-0.05 41.9 40-44

59
Table 3.3. Summary statistics of trait values and species persistence based on all simulations, Scenario 3.
S D L
Range of Sp. Means, 10 runs, T1
Range of SD's within
spp, high and low for 10
runs, T1
Range of Sp.
Means, 10 runs, T2
Range of SD's
within spp, high and low for 10 runs, T2
Range of average
Euclidean distances among all
species, 10 runs
Range of pairwise Euclid
distances, all runs
T1 Overlap Range
T2 Overlap Range
Mean Trait Overlap
Range, 10 runs
Mean #
spp.
Range of # of Spp
10 0.1 0 4.78-37.65 0.00-9.40 1.05-33.60 0.00-11.06 10.97-16.78 1.03-38.04 0.04-0.13 0.07-0.12 0.07-0.13 7.3 5-8 10 0.1 1 16.00-39.56 0.00-8.44 2.10-22.40 0.00-9.78 7.22-10.45 0.32-25.67 0.10-0.15 0.14-0.19 0.13-0.17 9.5 8-10 10 1 0 16.26-38.51 0.00-4.70 1.51-38.00 0.00-4.53 11.17-15.87 0.44-37.72 0.08-0.13 0.06-0.09 0.08-0.13 9.1 8-10 10 1 1 14.92-39.25 0.00-4.31 2.04-23.69 0.00-4.65 11.37-12.66 2.50-26.13 0.08-0.12 0.09-0.13 0.09-0.12 9.9 9-10 50 0.1 0 4.70-40.00 0.00-4.85 0.98-30.13 0.00-5.36 10.90-13.36 0.26-36.43 0.04-0.05 0.04-0.07 0.04-0.05 22.8 20-25 50 0.1 1 8.06-40.00 0.00-4.67 0.00-31.91 0.00-6.06 10.98-12.77 0.06-36.66 0.04-0.05 0.04-0.05 0.04-0.05 36.1 33-41 50 1 0 3.00-40.00 0.00-2.91 0.00-28.45 0.00-3.41 12.28-13.72 0.05-37.71 0.03-0.04 0.037-0.041 0.037-0.040 27.9 23-32 50 1 1 11.09-40.00 0.00-3.23 0.00-28.69 0.00-2.88 11.88-12.56 0.04-31.80 0.03-0.04 0.03-0.04 0.03-0.04 38.7 35-44

60
Table 3.4. Summary of outcomes from simulations. Scenario 1. Fine-Scale Habitat 10 Species 50 Species Linkage Linkage Dispersal Limitation 0 1 0 1
0.1 Moderate Equivalence Moderate Equivalence Moderate Equivalence Moderate Equivalence All species persist All species persist All species persist All species persist
1 Broad Equivalence Broad Equivalence Broad Equivalence Broad Equivalence All species persist All species persist All species persist All species persist Scenario 2. Coarse-Scale Habitat, Random Individuals 10 Species 50 Species Linkage Linkage Dispersal Limitation 0 1 0 1
0.1 Mixed Polymorphic generalist Mixed Polymorphic generalist Many species extinct Most species persist All species persist Most species persist
1 Polymorphic generalist Polymorphic generalist Polymorphic generalist Polymorphic generalist Most species persist All species persist Most species persist Most species persist Scenario 3. Coarse-Scale Habitat, Conspecifics Clumped 10 Species 50 Species Linkage Linkage Dispersal Limitation 0 1 0 1
0.1 Mixed Polymorphic generalist Mixed Polymorphic generalist Many species extinct Most species persist Many species extinct Most species persist
1 Niche Differentiation Niche Differentiation Niche Differentiation Niche Differentiation Most species persist Most species persist Most species persist Most species persist

61
Figure 3.1. Initial conditions for all models. Above, a distribution of starting genotype frequencies for each trait are shown, based on
repeated binomial sampling. Below, the distribution of habitat values, ranging from 0-40, drawn from Beta (2,5) and Beta (5,2)
distributions, respectively.

62
Figure 3.2. Results from starting species as non-equivalent. A. Starting conditions on left for trial simulation with species niche differentiated. B. Trait distributions after 1000 community turn-overs. Note the broad overlap and shared generalist approach of the species.
B
A

63
Figure 3.3. Sample species trait distributions resulting from low diversity simulation under scenario 1. A (upper left) with d=0.1, l=0; B (upper right) d=1.0, l=0; C (lower left) d=0.1, l=1.0; D (lower right) d=1.0; l=1.0.
0
1000
2000
3000
1 3 5 7 9 11 13 15 17 19 21 23 25 27 29 31 33 35 37 39 41 43 45 47 49 51 53 55 57 59 61 63 65 67 69 71 73 75 77 79 81
0
500
1000
1 3 5 7 9 11 13 15 17 19 21 23 25 27 29 31 33 35 37 39 41 43 45 47 49 51 53 55 57 59 61 63 65 67 69 71 73 75 77 79 81
0
1000
2000
3000
1 3 5 7 9 11 13 15 17 19 21 23 25 27 29 31 33 35 37 39 41 43 45 47 49 51 53 55 57 59 61 63 65 67 69 71 73 75 77 79 81
0
200
400
600
1 3 5 7 9 11 13 15 17 19 21 23 25 27 29 31 33 35 37 39 41 43 45 47 49 51 53 55 57 59 61 63 65 67 69 71 73 75 77 79 81
0
500
1000
1500
1 3 5 7 9 11 13 15 17 19 21 23 25 27 29 31 33 35 37 39 41 43 45 47 49 51 53 55 57 59 61 63 65 67 69 71 73 75 77 79 81
0
500
1000
1500
2000
1 3 5 7 9 11 13 15 17 19 21 23 25 27 29 31 33 35 37 39 41 43 45 47 49 51 53 55 57 59 61 63 65 67 69 71 73 75 77 79 81
0
500
1000
1 3 5 7 9 11 13 15 17 19 21 23 25 27 29 31 33 35 37 39 41 43 45 47 49 51 53 55 57 59 61 63 65 67 69 71 73 75 77 79 81
0
500
1000
1500
2000
1 3 5 7 9 11 13 15 17 19 21 23 25 27 29 31 33 35 37 39 41 43 45 47 49 51 53 55 57 59 61 63 65 67 69 71 73 75 77 79 81
0
500
1000
1500
1 3 5 7 9 11 13 15 17 19 21 23 25 27 29 31 33 35 37 39 41 43 45 47 49 51 53 55 57 59 61 63 65 67 69 71 73 75 77 79 81
0
500
1000
1500
1 3 5 7 9 11 13 15 17 19 21 23 25 27 29 31 33 35 37 39 41 43 45 47 49 51 53 55 57 59 61 63 65 67 69 71 73 75 77 79 81
Species 1; n=11039
Species 2; n=8292
Species 3; n=11256
Species 4; n=6455
Species 5; n=11428
Species 6; n=11560
Species 7; n=9399
Species 8; n=8710
Species 9; n=10398
Species 10; n=11463
A0
200
400
600
800
0
200
400
600
800
0
500
1000
1500
0
500
1000
0
500
1000
0
500
1000
0
200
400
600
800
0
500
1000
1500
0
200
400
600
800
0
500
1000
1500
Species 1; n=8731
Species 2; n=9761
Species 4; n=9402
Species 6; n=9846
Species 3; n=11397
Species 5; n=11361
Species 7; n=8704
Species 8; n=11648
Species 9; n=9407
Species 10; n=9743
B
0
1000
2000
3000
0
500
1000
1500
2000
0
500
1000
1500
2000
0
500
1000
1500
0
500
1000
0
500
1000
1500
0
500
1000
1500
2000
0
500
1000
1500
0
500
1000
1500
2000
0
200
400
600
800
Species 1; n=10343
Species 2; n=8309
Species 3; n=12105
Species 4; n=12703
Species 5; n=6856
Species 6; n=9363
Species 7; n=9488
Species 8; n=11802
Species 9; n=12821
Species 10; n=6150
C
Trait 1 value
0
200
400
600
800
1 3 5 7 9 11 13 15 17 19 21 23 25 27 29 31 33 35 37 39 41 43 45 47 49 51 53 55 57 59 61 63 65 67 69 71 73 75 77 79 81
0
200
400
600
1 3 5 7 9 11 13 15 17 19 21 23 25 27 29 31 33 35 37 39 41 43 45 47 49 51 53 55 57 59 61 63 65 67 69 71 73 75 77 79 81
0
200
400
600
800
1 3 5 7 9 11 13 15 17 19 21 23 25 27 29 31 33 35 37 39 41 43 45 47 49 51 53 55 57 59 61 63 65 67 69 71 73 75 77 79 81
0
500
1000
1500
1 3 5 7 9 11 13 15 17 19 21 23 25 27 29 31 33 35 37 39 41 43 45 47 49 51 53 55 57 59 61 63 65 67 69 71 73 75 77 79 81
0
200
400
600
800
1 3 5 7 9 11 13 15 17 19 21 23 25 27 29 31 33 35 37 39 41 43 45 47 49 51 53 55 57 59 61 63 65 67 69 71 73 75 77 79 81
0
500
1000
1500
1 3 5 7 9 11 13 15 17 19 21 23 25 27 29 31 33 35 37 39 41 43 45 47 49 51 53 55 57 59 61 63 65 67 69 71 73 75 77 79 81
0
500
1000
1 3 5 7 9 11 13 15 17 19 21 23 25 27 29 31 33 35 37 39 41 43 45 47 49 51 53 55 57 59 61 63 65 67 69 71 73 75 77 79 81
0
500
1000
1 3 5 7 9 11 13 15 17 19 21 23 25 27 29 31 33 35 37 39 41 43 45 47 49 51 53 55 57 59 61 63 65 67 69 71 73 75 77 79 81
0
200
400
600
800
1 3 5 7 9 11 13 15 17 19 21 23 25 27 29 31 33 35 37 39 41 43 45 47 49 51 53 55 57 59 61 63 65 67 69 71 73 75 77 79 81
0
200
400
600
800
Species 1; n=6404
Species 2; n=12166
Species 3; n=10949
Species 4; n=10976
Species 5; n=11451
Species 6; n=8412
Species 7; n=9941
Species 8; n=9182
Species 9; n=10133
Species 10; n=10386
D

64
Figure 3.4. Sample species trait distributions resulting from low diversity simulation under scenario 2. A (upper left) with d=0.1, l=0; B (upper right) d=1.0, l=0; C (lower left) d=0.1, l=1.0; D (lower right) d=1.0; l=1.0.
0
1000
2000
3000
4000
0
2000
4000
6000
0
1000
2000
3000
0
1000
2000
3000
0
1000
2000
3000
Species 1; n=21444
Species 3; n=66459
Species 9; n=2932
Species 4; n=4289
Species 10; n=4876
A
0
1000
2000
3000
0
500
1000
1500
2000
0
1000
2000
3000
0
1000
2000
3000
0
1000
2000
3000
0
1000
2000
3000
4000
0
1000
2000
3000
4000
0
2000
4000
6000
0
1000
2000
3000
4000
0
1000
2000
3000
4000
Species 1; n=8135
Species 2; n=3122
Species 4; n=12360
Species 6; n=14702
Species 3; n=6099
Species 5; n=9656
Species 7; n=15338
Species 8; n=12538
Species 9; n=13492
Species 10; n=4558
B
0
500
1000
1500
2000
0
500
1000
1500
0
1000
2000
3000
0
2000
4000
6000
0
1000
2000
3000
0
1000
2000
3000
0
1000
2000
3000
4000
0
1000
2000
3000
4000
0
1000
2000
3000
0
1000
2000
3000
4000
Species 1; n=5176
Species 2; n=5014
Species 4; n=12179
Species 6; n=5065
Species 3; n=10742
Species 5; n=8710
Species 7; n=18846
Species 8; n=12227
Species 9; n=12133
Species 10; n=9908
C0
1000
2000
3000
4000
0
500
1000
1500
2000
0
1000
2000
3000
0
2000
4000
6000
0
2000
4000
6000
0
1000
2000
3000
0
1000
2000
3000
4000
0
1000
2000
3000
4000
0
1000
2000
3000
0
1000
2000
3000
4000
Species 1; n=8107
Species 2; n=7984
Species 4; n=22230
Species 6; n=5739
Species 3; n=6574
Species 5; n=10315
Species 7; n=11438
Species 8; n=10046
Species 9; n=9093
Species 10; n=8484
D

65
Figure 3.5. Sample species trait distributions resulting from low diversity simulation under scenario 3. A (upper left) with d=0.1, l=0; B (upper right) d=1.0, l=0; C (lower left) d=0.1, l=1.0; D (lower right) d=1.0; l=1.0.
0
1000
2000
3000
4000
1 3 5 7 9 11 13 15 17 19 21 23 25 27 29 31 33 35 37 39 41 43 45 47 49 51 53 55 57 59 61 63 65 67 69 71 73 75 77 79 81
0
500
1000
1500
1 3 5 7 9 11 13 15 17 19 21 23 25 27 29 31 33 35 37 39 41 43 45 47 49 51 53 55 57 59 61 63 65 67 69 71 73 75 77 79 81
0
2000
4000
6000
1 3 5 7 9 11 13 15 17 19 21 23 25 27 29 31 33 35 37 39 41 43 45 47 49 51 53 55 57 59 61 63 65 67 69 71 73 75 77 79 81
0
500
1000
1 3 5 7 9 11 13 15 17 19 21 23 25 27 29 31 33 35 37 39 41 43 45 47 49 51 53 55 57 59 61 63 65 67 69 71 73 75 77 79 81
0
1000
2000
3000
4000
1 3 5 7 9 11 13 15 17 19 21 23 25 27 29 31 33 35 37 39 41 43 45 47 49 51 53 55 57 59 61 63 65 67 69 71 73 75 77 79 81
0
1000
2000
3000
4000
1 3 5 7 9 11 13 15 17 19 21 23 25 27 29 31 33 35 37 39 41 43 45 47 49 51 53 55 57 59 61 63 65 67 69 71 73 75 77 79 81
Species 3; n=21382
Species 4; n=3241
Species 7; n=951
Species 10; n=20481
Species 6; n=48561
Species 8; n=5384
A0
10 0 0
2 0 0 0
3 0 0 0
4 0 0 0
1 3 5 7 9 11 13 15 17 19 2 1 2 3 2 5 2 7 2 9 3 1 3 3 3 5 3 7 3 9 4 1 4 3 4 5 4 7 4 9 5 1 5 3 5 5 5 7 5 9 6 1 6 3 6 5 6 7 6 9 7 1 7 3 7 5 7 7 7 9 8 1
0
10 0 0
2 0 0 0
3 0 0 0
4 0 0 0
1 3 5 7 9 11 13 15 17 19 2 1 2 3 2 5 2 7 2 9 3 1 3 3 3 5 3 7 3 9 4 1 4 3 4 5 4 7 4 9 5 1 5 3 5 5 5 7 5 9 6 1 6 3 6 5 6 7 6 9 7 1 7 3 7 5 7 7 7 9 8 1
0
10 0 0
2 0 0 0
3 0 0 0
1 3 5 7 9 11 13 15 17 19 2 1 2 3 2 5 2 7 2 9 3 1 3 3 3 5 3 7 3 9 4 1 4 3 4 5 4 7 4 9 5 1 5 3 5 5 5 7 5 9 6 1 6 3 6 5 6 7 6 9 7 1 7 3 7 5 7 7 7 9 8 1
0
10 0 0
2 0 0 0
3 0 0 0
4 0 0 0
1 3 5 7 9 11 13 15 17 19 2 1 2 3 2 5 2 7 2 9 3 1 3 3 3 5 3 7 3 9 4 1 4 3 4 5 4 7 4 9 5 1 5 3 5 5 5 7 5 9 6 1 6 3 6 5 6 7 6 9 7 1 7 3 7 5 7 7 7 9 8 1
0
10 0 0
2 0 0 0
3 0 0 0
4 0 0 0
1 3 5 7 9 11 13 15 17 19 2 1 2 3 2 5 2 7 2 9 3 1 3 3 3 5 3 7 3 9 4 1 4 3 4 5 4 7 4 9 5 1 5 3 5 5 5 7 5 9 6 1 6 3 6 5 6 7 6 9 7 1 7 3 7 5 7 7 7 9 8 1
0
0 . 5
1
1 3 5 7 9 11 13 15 17 19 2 1 2 3 2 5 2 7 2 9 3 1 3 3 3 5 3 7 3 9 4 1 4 3 4 5 4 7 4 9 5 1 5 3 5 5 5 7 5 9 6 1 6 3 6 5 6 7 6 9 7 1 7 3 7 5 7 7 7 9 8 1
0
10 0 0
2 0 0 0
3 0 0 0
4 0 0 0
1 3 5 7 9 11 13 15 17 19 2 1 2 3 2 5 2 7 2 9 3 1 3 3 3 5 3 7 3 9 4 1 4 3 4 5 4 7 4 9 5 1 5 3 5 5 5 7 5 9 6 1 6 3 6 5 6 7 6 9 7 1 7 3 7 5 7 7 7 9 8 1
0
10 0 0
2 0 0 0
3 0 0 0
1 3 5 7 9 11 13 15 17 19 2 1 2 3 2 5 2 7 2 9 3 1 3 3 3 5 3 7 3 9 4 1 4 3 4 5 4 7 4 9 5 1 5 3 5 5 5 7 5 9 6 1 6 3 6 5 6 7 6 9 7 1 7 3 7 5 7 7 7 9 8 1
0
10 0 0
2 0 0 0
3 0 0 0
4 0 0 0
1 3 5 7 9 11 13 15 17 19 2 1 2 3 2 5 2 7 2 9 3 1 3 3 3 5 3 7 3 9 4 1 4 3 4 5 4 7 4 9 5 1 5 3 5 5 5 7 5 9 6 1 6 3 6 5 6 7 6 9 7 1 7 3 7 5 7 7 7 9 8 1
0
10 0 0
2 0 0 0
3 0 0 0
1 3 5 7 9 11 13 15 17 19 2 1 2 3 2 5 2 7 2 9 3 1 3 3 3 5 3 7 3 9 4 1 4 3 4 5 4 7 4 9 5 1 5 3 5 5 5 7 5 9 6 1 6 3 6 5 6 7 6 9 7 1 7 3 7 5 7 7 7 9 8 1
Species 1; n=12563
Species 2; n=9856
Species 4; n=6913
Species 6; n=0
Species 3; n=9640
Species 5; n=19727
Species 7; n=19934
Species 8; n=3156
Species 9; n=10394
Species 10; n=7817
B
0
1000
2000
3000
4000
0
2000
4000
6000
0
1000
2000
3000
4000
0
0.5
1
0
1000
2000
3000
0
1000
2000
3000
4000
0
1000
2000
3000
0
1000
2000
3000
4000
0
1000
2000
3000
0
1000
2000
3000
Species 1; n=10526
Species 2; n=22572
Species 4; n=0
Species 6; n=5885
Species 3; n=10390
Species 5; n=6802
Species 7; n=8592
Species 8; n=9998
Species 9; n=14246
Species 10; n=10989
C0
1000
2000
3000
4000
1 3 5 7 9 11 13 15 17 19 21 23 25 27 29 31 33 35 37 39 41 43 45 47 49 51 53 55 57 59 61 63 65 67 69 71 73 75 77 79 81
0
1000
2000
3000
1 3 5 7 9 11 13 15 17 19 21 23 25 27 29 31 33 35 37 39 41 43 45 47 49 51 53 55 57 59 61 63 65 67 69 71 73 75 77 79 81
0
1000
2000
3000
1 3 5 7 9 11 13 15 17 19 21 23 25 27 29 31 33 35 37 39 41 43 45 47 49 51 53 55 57 59 61 63 65 67 69 71 73 75 77 79 81
0
1000
2000
3000
4000
1 3 5 7 9 11 13 15 17 19 21 23 25 27 29 31 33 35 37 39 41 43 45 47 49 51 53 55 57 59 61 63 65 67 69 71 73 75 77 79 81
0
500
1000
1500
1 3 5 7 9 11 13 15 17 19 21 23 25 27 29 31 33 35 37 39 41 43 45 47 49 51 53 55 57 59 61 63 65 67 69 71 73 75 77 79 81
0
1000
2000
3000
4000
1 3 5 7 9 11 13 15 17 19 21 23 25 27 29 31 33 35 37 39 41 43 45 47 49 51 53 55 57 59 61 63 65 67 69 71 73 75 77 79 81
0
1000
2000
3000
1 3 5 7 9 11 13 15 17 19 21 23 25 27 29 31 33 35 37 39 41 43 45 47 49 51 53 55 57 59 61 63 65 67 69 71 73 75 77 79 81
0
1000
2000
3000
4000
1 3 5 7 9 11 13 15 17 19 21 23 25 27 29 31 33 35 37 39 41 43 45 47 49 51 53 55 57 59 61 63 65 67 69 71 73 75 77 79 81
0
1000
2000
3000
1 3 5 7 9 11 13 15 17 19 21 23 25 27 29 31 33 35 37 39 41 43 45 47 49 51 53 55 57 59 61 63 65 67 69 71 73 75 77 79 81
0
500
1000
1500
2000
1 3 5 7 9 11 13 15 17 19 21 23 25 27 29 31 33 35 37 39 41 43 45 47 49 51 53 55 57 59 61 63 65 67 69 71 73 75 77 79 81
Species 1; n=14928
Species 2; n=8050
Species 4; n=18681
Species 6; n=11925
Species 3; n=8885
Species 5; n=1091
Species 7; n=8448
Species 8; n=13505
Species 9; n=11225
Species 10; n=3262
D

66
CHAPTER 4
THE DISTRIBUTION OF VARIANCE IN LEAF FUNCTIONAL TRAITS IN A
TEMPERATE FOREST TREE COMMUNITY1
1 Lake, J.K. and S.P. Hubbell. To be submitted to Ecological Monographs.

67
Abstract
When studying plant community assembly from the perspective of plant traits,
ecologists have typically focused on species trait means, minimizing the importance of
intraspecific variation, while most studies of plant adaptation have focused on
intraspecific variation, but outside of the broader community context. Here, we examine
the structure of a temperate forest in detail with relation to five leaf functional traits. We
find the expected strong intraspecific plastic response to light availability, while still
finding substantial unexplained intraspecific and even within individual variation in these
traits. This broad range of intraspecific trait values translates to strong interspecific
overlap in trait values, suggesting most of the tree species within the studied forest share
a common generalist strategy with respect to these leaf functional traits. However, a
strong sun-shade leaf continuum also suggests that, at least in part, ontogenetic niche
shifts can be invoked, at least to explain some variance in leaf functional traits. Overall,
these results also suggest that it will not be sufficient to treat individuals of a species as
merely following the species’ mean values, at least for the leaf functional traits studied
here. This means that any predictive model of community composition from functional
traits must, at the least, account for both ontogenetic variation in traits as well as
unexplained variability.

68
Introduction
For centuries, taxonomists, natural historians, and ecologists have looked for, and
found, differences among plant species. For taxonomists, this interspecific variation is
key to describing and differentiating among species. Natural historians used the traits to
relate the organism to its place in the world. And, ecologists have used the differences to
attempt to explain species coexistence and interactions. More seldom has intraspecific
variability been considered, particularly in an ecological context. As community
ecologists turn to functional traits as a method for analyzing questions of community
assembly and coexistence, however, it becomes more important to consider the
distribution of relevant functional traits both within and among species. Most current
work at the community level has focused on species mean trait values (ie, Wright et al.
2004; Stubbs and Wilson 2004; Shipley et al. 2006). While species means may well
provide an adequate cross-taxon comparison in the context of trait evolution within a
clade (i.e., Davies 1998; Cavender-Bares et al. 2004a), or even in considering global
scale patterns of plant traits (Reich et al. 1997; Wright et al. 2004), if intraspecific
variation is substantial, then species means are not a satisfactory representation of the
traits of individuals in an ecological community.
Indeed, in reviewing the use of functional traits in community ecology, McGill et
al. (2006) recognized this difficulty; however, they argue that only traits with
significantly greater interspecific than intraspecific variation are preferable. In their
maximum entropy model for prediction of community assembly from functional traits,
Shipley et al. (2006) again argue that higher interspecific variability is important in
selecting traits for analysis. While selecting such traits unquestionably simplifies

69
analyses and may well improve fits generated by the model, it runs the risk of ignoring
ecologically important traits with higher intraspecific variability. Working from long-
standing ecological observation and study, a group of ecologically important plant traits
have been assembled as a baseline for consideration. While it is possible that high
intraspecific variation in these traits may indicate their reduced ecological relevance, and
therefore reduced selective pressure, it is also possible that such traits remain functionally
relevant, but that plasticity or other intraspecific variability in the trait is simply a more
adaptive strategy. The current body of evidence (i.e., Poorter and Bongers 2006; Wright
et al 2004; Reich et al 2003) does support the selection of many of these traits, in
particular, leaf area, specific leaf area, and leaf nitrogen concentration as relevant to the
survival, growth, and overall strategy of species.
Levels of intraspecific variability can indeed inform us as to the forces structuring
ecological communities, at least within the context of the traits studied. Following from
the very definition of functional traits (Reich et al. 2003) as “any attribute that has
potentially significant influence on establishment, survival, and fitness and … focus[ing]
on those traits related to the ability to acquire, use, and conserve resources,” these traits
must necessarily be linked to the ecological niche of the given plant. Thus, functional
traits embody mechanisms through which plants interact with their biotic and abiotic
environment and reflect fundamental ‘niche axes’ along which plants may be differentiated
from one another (Westoby et al. 2002). Comparably, functional trait variability can
provide a measure of niche breadth and overlap for species.
We know there is at least a moderate degree of intraspecific variability and
intracanopy plasticity in leaf functional traits (Pearcy and Sims 1994; Lusk 2002; Sack et
al. 2006). Many of these traits are leaf based traits, largely related to photosynthetic

70
carbon fixation, or the water or energy balance of individual leaves. Studies of this
variation have predominantly focused on the well-documented, but somewhat less well-
understood, difference between sun and shade leaves within single individuals (e.g., Sack
et al. 2006). These differences typically include denser, smaller and more heavily lobed
leaves in sun than shade (Pearcy and Sims 1994; Bond et al. 1999; Sack et al. 2006),
although conflicting results have sometimes been reported (e.g., Niinemets and Kull
1994).
The degree of plasticity and variability found within a species has frequently been
tied to the functional grouping of that species. Understory trees and shrubs are predicted
to exhibit lower plasticity and variability than canopy tree species because they are
exposed to fewer light environments throughout their lifetime (Pearcy and Sims 1994).
Most studies also suggest that light-demanding gap tree species demonstrate higher
plasticity in traits related to photosynthetic carbon gain than shade tolerant species (i.e.,
Valladares et al. 2000; Lusk 2002; Yamashita et al 2002), but Yamashita et al (2002)
also found high plasticity in highly shade-tolerant species, though this plasticity resulted
from leaf acclimation rather than leaf turnover. In that study, mid-successional species
demonstrated the lowest overall plasticity in response.
To date, most studies have focused either on studies of multiple species under
nearly identical conditions (i.e., Sack et al. 2006) or else of a group of related taxa within
a broader ecological community (i.e., Davies et al. 2000, Cavender-Bares et al. 2004a;
Valladares et al. 2000). Neither of these approaches focuses on trait variance within a
full group of plants co-occurring within a single ecological community. At the
community level, research has focused on species mean differences. Some researchers have
found support for niche differentiation, particularly within specific genera. Cavender-Bares

71
et al. (2004a, 2004b) concluded that Florida oak species were partitioning niche space finely
in relation to habitat usage and functional traits. Davies (1998, 2001) showed that coexisting
pioneer species in the tropical genus Macaranga were partitioning a continuum of niche-
space in relation to photosynthetic traits, though the study focused more on mean species
values than trait overlap (see also Sterck et al. 2006). Holscher et al. (2004) found that eight
Asian pioneer species differed significantly from one another in leaf morphology, suggesting
a continuum of trait values even within this functional class. Kappelle and Leal (1996)
demonstrated that leaf nutrient levels decrease along a successional gradient, while leaf
morphology is less impacted by successional status of the forest. Bragg and Westoby (2002)
found that smaller-leaved understory species in a sclerophyllous forest tended to need higher
light levels than larger-leaved species, while Ackerly and Donoghue (1998) found no such
relationship among temperate species within the genus Acer. However, all of these studies
have focused predominantly on finding differences between species means, without
considering explicitly the importance of individuals or of ontogenetic variation or plasticity
within traits.
Within this study, we have selected five leaf traits upon which to focus: Specific
Leaf Area (SLA), Leaf Size (or area), Leaf Nitrogen Content (Nmass), perimeter2: area
ratio (p2a), and Leaf Shape Index (Length:Width ratio, LSI). Specific Leaf Area (SLA) is
simply the surface area of a leaf divided by its mass. Because SLA is one of the strongest
measures of a plant’s photosynthetic investment, it should to be one of the best discriminants
of niche position (mean), breadth (variance) and overlap. Reich et al. (2003, 1997) show that
specific leaf area is a strong correlate of mass-based maximum photosynthetic (Amax) rate.
Low values also tend to be associated with longer leaf lifespans, nutrient limited
environments, sun leaves and high defensive investment. Across several species of tropical

72
trees, Poorter and Bongers (2006) have also shown that SLA is negatively related to whole-
plant growth and negatively to survival. Leaf size is defined by Cornelissen et al. (2003) as
the area of the leaf lamina or leaflets, excluding the petiole or rachis. It is a good indicator of
photosynthetic surface, and impacts water and energy balance. Typically, sun leaves are
smaller than shade leaves, although this pattern does not always hold (Sack et al. 2006).
Leaf Nitrogen Concentration is highly correlated to mass-based maximum photosynthetic
rates (Amax). It provides insights into nutrient use and availability, and is correlated to leaf
lifespan (Reich et al., 1997). Nmass has been shown to correlate positively with growth, while
Narea correlates with survival (Poorter and Bongers 2006). Perimeter2:Area Ratio (P2A) is a
measure of a leaf’s lobing, with higher values showing greater departure from a circle, and
thus higher lobing; increased lobing is associated with more strongly sun-exposed leaves
(Talbert and Holch 1957), but this does not hold for all species of temperate trees (see Sack et
al 2006). Finally, leaf shape index (LSI), simply the length:width ratio of a leaf, was
included in the analysis. This morphological trait, combined with P2A and leaf size, is
thought to be important to the energy balance of leaves (Rozendaal et al. 2006). Note that
the functional/selective relevance of both P2A and LSI are less well-documented in the
literature; it is indeed quite possible that these traits are more free to drift interspecifically
than others selected.
We have intentionally selected leaf functional traits as the focus of this study because
of the role these traits clearly play in carbon fixation. Given that light is one of the most
limiting resources in a closed-canopy forest community, and given the moderately well-
documented growth-survival trade-off linked to tree demography, these resource axes and
related traits seem a good place to look at how species vary in the way they make their
livings. There is now strong evidence linking plant traits to individual plant performance,

73
including some work explicitly in a community setting (e.g., Poorter and Bongers 2006;
Laurence et al. 2006; Davies 2001). At least some of these traits have also been
demonstrated to affect local growth and survival (Poorter and Bongers 2006, for example),
and to play an important role in the global functional trait spectrum (e.g., Reich et al. 1997;
Wright et al. 2004).
Here, we set out to answer the fundamental question of how variability in leaf
functional traits is partitioned within and among species. We quantify both interspecific
and intraspecific variation in ecologically relevant leaf functional traits for all tree and
shrub species within a temperate forest. Within species, we consider both plastic
variation (within an individual) and broader inter-individual variation within a particular
light environment and size class. By studying this variability, and its sources, we further
the understanding of plant community structure in relation to leaf functional traits.
Materials and Methods
Site description
Thompson Mills Forest is a 135-ha. reserve located near Braselton, Georgia, in
Jackson County, about 40 miles northeast of Atlanta in the Piedmont (34°7′39 N,
83°48′6 W) . The site is composed of late-secondary oak-hickory forest, dominated by
Quercus sp., Carya sp., Liriodendron tulipifera, and Fagus grandifolia. Average annual
rainfall in this area is estimated at 141.7 cm, and mean annual temperature is 15.6 C
(Georgia Automated Environmental Monitoring Network, Gainesville, GA). Three
20x200m sampling transects were established. The first runs along a northwest facing
slope overlooking the Mulberry River; the second, along a southfacing slope overlooking
Lee Creek; the third perpendicular to Lee Creek at a point upstream from the second,

74
rising along a gentle southeast facing slope (See fig. 1 for map of site, placement of
transects). All are located in late-secondary forest areas with very limited or no recent
human-based disturbance.
Sampling Methods
Within each transect, all stems >1 cm diameter at breast height (dbh, 1.4 m above
the ground) were mapped, identified, and dbh was measured. Based on dbh and crown
exposure, specimens were classified as adults or saplings, with cut-off size dependent on
the species at hand (See table 1 for list of species and their abundance in the
community.). For canopy trees, adulthood was equated with attaining a position within
the main canopy of the forest, and thus having leaves exposed to full sunlight. For
understory trees, evidence of reproductive ability or attaining a comparable size threshold
was used to determine ontogenetic status. Shrub species were not subdivided into adult
and sapling due to the already small stature of adult shrubs (ie, small dbh, etc.) and the
lack of light structuring within their crowns. For all tree species (canopy and understory),
up to a total of 24 specimens (12 adults, 12 saplings), as evenly spread as possible among
and within transects, were selected for leaf sampling. In adults, three branchlets each
from the sunniest position, and a strongly shaded position were collected and placed in
water. Specimens were returned to the lab and rehydrated overnight. A total of six
leaves from each canopy position were selected for analysis, two from each of the
branchlets whenever possible. In the case of complex leaves, leaflets were treated as
leaves, because they represent the photosynthetic unit for those plants. While size was
not a factor in determining leaves sampled, we did select the most recently unfolded,

75
fully hardened leaves with the least amount of herbivory and epiphylls possible. Leaves
were scanned on an Epson 1680 flatbed scanner, and analyzed using WinFOLIA 2005b
Software. Subsequently, leaves were dried at 60C for at least 72 hours, then weighed on
a Mettler balance.
Trait Analysis
Morphological traits were analyzed from scanned images using WinFOLIA
software (leaf size), or from compounding data collected (P2A, Leaf Shape Index, SLA).
Leaf Nitrogen Content was analyzed by the Micro Dumas Analytical method, using a
NA1500 C/H/N Elemental Analyzer. Dried leaf samples were ground using a ball mill,
after bulking three leaves from a given canopy position. Specimens were processed in
the University of Georgia analytical chemistry laboratory.
Statistical analyses
For each trait, mean and standard deviation was calculated for each species for
sun and shade leaves separately for adults, and pooled for saplings. Overall pairwise
correlations between traits were calculated. Nested or hierarchical analysis of variance
(ANOVA’s) were performed for each trait, setting species and canopy position/ontogeny
as nested levels. From these ANOVA’s, variance components were estimated for each
level. All statistical analyses were carried out using the R statistical environment (R Core
Development Team 2006).
For each species and trait, a trait distribution was calculated using a kernel
estimator (see Mouillot et al. 2005). This method, which allows us to work with

76
continuous data without assuming a normal distribution of data, calculates a density
function by assuming measurement error around each data point, and then using a
smoothing function to estimate a distribution of all data for a given trait and population.
These species (or population) kernels are then used to estimate pairwise overlaps in trait
space of coexisting species. Overlap is simply represented as the integral of the area
under the species’ respective kernel curves when overlaid on one another. From these
pairwise overlaps, a community-wide overlap index is then calculated, simply by
averaging these overlaps. These overlap indices were calculated both while pooling all
leaves sampled, and within each light exposure (sun-adult, shade-adult, and shade-
sapling). Randomization tests on overlaps were performed to determine the impact of
species identity on trait overlap. We held leaves constant on stems, and within canopy
positions, but assigned species identity to individuals at random.
Results
Explanation of Variance
Using nested ANOVA’s, we tested the hierarchical models to explain trait
variation using species identity and canopy position/light exposure as predictor variables.
In all cases, all levels of analysis were strongly statistically significant (p<0.0001). We
then calculated the percentage of variance explained by each level, finding in most cases
a strong species signal, moderate signal for light, and a surprisingly large percentage of
unexplained variation (see table 2). Notably, for three of the five traits tested (SLA, p2a,
and Leaf Area), unexplained variation exceeded both species and canopy position in their
explanatory ability; in all cases, over 34% of the variance remained unexplained by these
77
variables. For specific leaf area, species identity and sun exposure explained comparable
amounts of variance; for the remaining traits, species identity explained more of the
variance than canopy position, with the strongest species-level effects in LNC and LSI.
In both of these cases, canopy position explained very little of the variance in these traits
(3.15 and 6.24%, respectively).
Variation among canopy positions: Effect of light levels
Once species was taken into account, leaves varied strongly in all tested leaf traits
across canopy locations and ontogeny (Tables 3-7). Our results for SLA largely
confirmed prior work—higher SLA, or thinner, less dense leaves in the shade than in
sunny positions. Typically, there was little statistical difference between shade leaves of
adult individuals and those of shaded saplings, but a few species did show a difference
(Carya spp., Liquidamber styraciflua, Liriodendron tulipifera, Prunus serotina, Quercus
alba, Q. rubra, Ulmus americana), with saplings showing even higher SLA than shade
leaves of adults. For leaf size, there is no discernible pattern that can be applied to all, or
even most, species. Within each canopy class, extraordinary variability swamped most
observed differences. However, Morus rubra and Cercis canadensis, both understory
tree species, showed markedly smaller leaves in shade environment than sun.
Perimeter2:Area (p2a) ratios varied greatly among species, as well. Most species
of oaks (Quercus alba, Q. coccinea, Q. falcata, Q. rubra) as well as Liquidamber showed
greater p2a values, and therefore deeper lobing, in sun leaves than shade. Comparable to
the findings of Sack et al. (2006), we found that species in genus Acer showed the
opposite pattern—more lobed leaves in the shade than sun. Within Liriodendron, we
found a more complex pattern that partially conflicts with Sack’s findings. Notably, p2a
78
is similar in sun leaves of adults, and shaded leaves of saplings, with lower, rather than
higher, p2a in shade leaves of adults. This finding is puzzling, though it may be a result
of the higher relative light environments that most saplings of this species require.
Leaf Shape Index (LSI), the leaf blade length:width ratio showed little discernible
trend either within the group of species, or within any given species, suggesting that it is
little affected by canopy position. Surprisingly, leaf nitrogen (Nmass) showed little overall
response to canopy position, but a much stronger species level response.
Variation Among and Within Individuals
Within a single species, there is strong within and among individual variation for
these traits, particularly SLA, even when controlling for canopy position. This is true for
both canopy tree species (illustrated by Quercus alba in fig. ) and for understory trees
that experience a much reduced range of light environments over their ontogeny
(illustrated by Acer leucoderme in fig. 2).
Correlation Among Traits
Generally, correlations among traits within this community were weak, with
r2<0.08 in all but one case (See table 8 for details). A moderately strong correlation
(0.397) was found, as predicted, between LNC and SLA (see fig. 3), but the correlation
was positive rather than negative, as found by Reich et al. (1997). It is has been
suggested that including sun, shade, and sapling leaves in a single dataset would
confound the typically observed pattern (P.B. Reich, pers.comm.), but even when we split
our dataset to only consider adult sun leaves, the correlation remained positive, and

79
moderately strong (0.359). The strong scatter, and relatively weak nature of virtually all
trait correlations suggests that we can consider these traits as independent axes in
community analyses.
Overlaps Among Species
Trait overlap among species for SLA is extraordinarily strong. Average overlap
for species, when considering all leaves from all positions, is 0.482. When considering
leaves from a single canopy position or age group (adult-sun, adult-shade, sapling),
overlap fell slightly to 0.424, 0.392, 0.421, respectively, but these numbers still remain
extraordinarily high for functional traits in coexisting species. Indeed, when we
randomized the species identities of each individual, merely holding leaves within a
given canopy position and on a given tree, in all cases, actual SLA overlap indices fell
well within the values produced by the randomization tests (See fig. 4). Comparably,
other traits fall within similar ranges, from 0.324-0.449 for LNC, 0.416-0.504 for Leaf
Area, 0.402-0.443 for perimeter2:area ratio, and 0.287-0.386 for Leaf Shape Index (LSI).
See table 9 for specifics. Importantly, there was no single leaf layer that consistently
showed higher or lower overlap than others.
Discussion
Traits in community assembly
Our results suggest that these species of temperate trees are largely generalist
species, at least with regard to these leaf functional traits. Intraspecific variability, even
within a canopy position, is high enough to lead to broad trait overlap in all of these
80
functional traits, suggesting that species are not specializing within these leaf traits at the
relatively fine spatial scale of this study. Even though species-level differences in the
means of these traits are important in explaining the overall variance in traits, the trait
spectrum for each species is sufficiently broad to produce strong interspecific trait
overlap. Indeed, in predicting overlap values, species identity was unimportant, once
canopy position and size class was accounted for. Such results make it highly unlikely to
find support for limiting similarity within such a community.
It is clear that intracanopy plasticity and intra-individual variation in leaf
functional traits as a function of light availability is high. Most of our results were
consistent with the findings of earlier studies of the sun-shade leaf dichotomy; one
notable exception was the lack of sizeable differences in LNC in sun vs. shade leaves. It
is important to note, however, that even this well-documented ontogenetic and canopy-
driven plasticity is not often factored into current studies of traits in ecological
communities (e.g. Poorter and Bongers 2006; Shipley et al. 2006). It is clear that size
matters, in some cases, as much species identity, to these leaf functional traits.
However, it is notable that this variability did not alone account for much of the
variation within and among conspecific individuals. Clearly, this variability within
individuals has the potential to have substantial impact on whole plant function. It will
be difficult to scale plant function from leaf to tree to community given the amount of
intra-canopy variability that remains unexplained in this type of study.
Comparably, the high trait variability among conspecific individuals, even when
accounting for canopy position, will substantially impact community assembly and
function. Even when we account for ontogeny and canopy position, we cannot explain

81
one-third to one-half of the variability among conspecifics in a single, narrowly delimited
ecological community. This extraordinary variability within and among individuals
argues strongly for trees as generalists—in part, responding through plasticity to the light
environments to which they are exposed—but also as individuals with a unique genotype
in a unique environment. Since trees clearly interact with one another and their
environment as individuals, not as species, this variability becomes quite important to
community interactions.
These findings suggest that it is ill-advised to represent these traits in species as a
simple species mean for studies of community ecology, as recommended by McGill et al.
(2006) and implemented by Shipley et al. (2006). In all ecological communities, it is
individuals, not species, that are interacting with one another; within a spatially structured
plant community, interactions of any given individual are governed by the particular
neighborhood of that individual (e.g., Ahumada et al. 2004; Hubbell and Foster 1986;
Hubbell et al. 2003). Given that a particular individual is likely only interacting with 10-
20 other individuals at a particular time, to the extent that competition is driving
selection, the selective environment of that focal individual is strongly driven by the traits
of those –individual- neighbors, not the trait means of the species to which those
neighbors belong. The well-documented ontogenetic and plastic response of plant traits
(ie, Sack et al. 2006; Rozendaal et al. 2006) further suggests that, at least in tree
communities, it ought to be possible to address some, but not all, of these complications
by considering a size structured community. While this will undoubtedly help to address
difficulties in building predictive trait-based models of community assembly, it still does

82
not capture or address the fundamentally high within and among individual variation we
find within a single canopy position of a single individual.
Some proponents of a traits-based approach to community assembly suggest that
traits for such studies should simply be selected based on a much higher degree of
interspecific than intraspecific variability (i.e., McGill et al. 2006; Shipley et al. 2006).
While this condition would produce a more convenient approach to predicting
community assembly, it also assumes that it is those differentiated traits that are driving
the observed species abundance patterns, and a priori invokes niche differentiation as the
driving force in community assembly. While this approach may capture the mechanisms
of community assembly quite successfully, it would exclude many of the traits long
believed to be important to the ecology of tree communities—perhaps, most notably,
those related to the capture of light resources. This leaves us to either ignore decades of
work on plant functional traits (ie, Reich et al 1997; Reich et al 2003; Wright et al 2004),
at least in terms of community assembly, or to reconsider approaches to predictive
models of assembly to incorporate strong intraspecific variability.
Overall, this work shows that intracanopy as well as unexplained intra- and inter-
individual variation in leaf traits is high, and will need to be factored into future efforts to
predict community structure from plant functional traits. While we cannot conclude that
these temperate tree species are generalists for all ecologically relevant traits, for the leaf
functional traits measured, the strong interspecific trait overlap, combined with strong
light-driven variability suggests that species are not specializing strongly on light
gradients, at least as measured by these traits. It may be that the size asymmetric

83
competition inevitable in forest tree communities simply swamps any interspecific
differences.

84
Literature Cited
Ackerly D.D. (2003) Community assembly, niche conservatism, and adaptive evolution
in changing environments. International Journal of Plant Sciences, 164, S165-S184
Ackerly, D.D. 1999. Comparative plant ecology and the role of phylogenetic information. In: Press, M., Scholes, J.D., & Barker, M.G., eds., Physiological Plant Ecology, pp. 391-413. Blackwell Scientific, Oxford, UK.
Ackerly, D.D. & Donoghue, M.J. 1998. Leaf size, sapling allometry and Corner’s rules: a phylogenetic study of correlated evolution in maples (Acer). American Naturalist 152: 767-791.
Ackerly, D.D., C.A. Knight, S.B. Weiss, K. Barton, and K.P. Starmer. 2002. Leaf size, specific leaf area and microhabitat distribution of chaparral woody plants: contrasting patterns in species level and community level analyses. Oecologia 130: 449-457.
Ahumada, J., S. P. Hubbell, R. B. Foster, and R. Condit. 2004. Long-term tree survival in a neotropical forest: The influence of local biotic neighborhood In: In E. Losos, E. G. Leigh, Jr., and R. Condit, eds. Forest Diversity and Dynamism: Findings from a Network of Large-Scale Tropical Forest Plots. University of Chicago Press, Chicago, IL.
Bond, B.J., B.T. Farnsworth, R.A. Coulombe, and W.E. Winner. 1999. Foliage physiology and biochemistry in response to light gradients in conifers with varying shade tolderance. Oecologia 120: 183-192.
Bragg, J.G. & Westoby, M. 2002. Leaf size and foraging for light in a sclerophyll woodland. Journal of Ecology 16: 633-639.
Cavender-Bares, J., D. D. Ackerly, D. A. Baum and F. A. Bazzaz. 2004a. Phylogenetic overdispersion in Floridian oak communities. The American Naturalist 163(6): 823-843.
Cavender-Bares, J., K. Kitajima and F. A. Bazzaz. 2004b. Multiple trait associations in relation to habitat differentiation among 17 Floridian oak species. Ecological Monographs 74(4): 635-662.
Cornelissen, J.H.C., Lavorel, S., Garnier, E., Diaz, S., Buchmann, N., Gurvich, D.E., Reich, P.B., ter Steege, H., Morgan, H.D., van der Heijden, M.G.A., Pausas, J.G., & Poorter, H. A handbook of protocols for standardized and easy measurement of plant functional traits worldwide. Australian Journal of Botany 51: 335-380.
Davies, S. J. 2001. Tree mortality and growth in 11 sympatric Macaranga species in Borneo. Ecology 82(4): 920-932.
Davies, S. J. 1998. Photosynthesis of nine pioneer Macaranga species from Borneo in relation to life history. Ecology 79(7): 2292-2308.
Holscher, D., Leuschner, C., Bohman, K., Juhrbandt, J., & Tjitrosemito, S. 2004. Photosynthetic characteristics in relation to leaf traits in eight co-existing pioneer tree species in Central Sulawesi, Indonesia. Journal of Tropical Ecology 20: 157-164.
Hubbell, S. P. 2001. The Unified Neutral Theory of Biodiversity and Biogeography. Princeton University Press, Princeton.

85
Hubbell, S.P., Ahumada, J.A., Condit, R. & Foster, R.B. 2001. Local neighbourhood effects on long-term survival of individual trees in a neotropical forest. Ecological Research, 16, 859–875.
Hubbell, S.P. & Foster, R.B. 1986. Biology, chance, and history and the structure of tropical train forest tree communities. pp. 314-329. In: Diamond, J. & Case, T.J. Community Ecology. Harper and Row, New York, NY.
Kappelle, M, & M. Leal. 1996. Changes in leaf morphology and foliar nutrient status along successional gradient in a Costa Rica Upper Montane Quercus forest. Biotropica 28: 331-344.
Laurance, W.F. et al. 2006. Rapid decay of tree-community composition in Amazonian forest fragments. Proc. National Academy of Science 103: 19010-19014.
Lusk, C.H. 2002. Leaf area accumulation helps juvenile evergreen trees tolerate shade in a temperate rainforest. Oecologia 132: 188-196.
McGill B.J., Enquist B.J., Weiher E. & Westoby M. 2006. Rebuilding community ecology from functional traits. Trends in Ecology & Evolution, 21, 178-185.
Mouillot, D. et al. 2005. Niche overlap estimates based on quantitative functional traits: a new family of non-parametric indices. Oecologia 145: 345–353.
Niinemets, U, & K. Kull. 1994. Leaf weight per area and leaf size of 85 Estonian woody species in relation to shade tolerance and light availability. Forest Ecology and Management 70: 1-10.
Pearcy, R.W. & Sims, D.A. 1994. Photosynthetic acclimation to changing light environments: scaling from the leaf to the whole plant. In: Caldwell, M.M. & Pearcy, R.W., eds. Exploitation of Environmental heterogeneity by Plants: Ecophysiological Processes Above- and Belowground. Academic Press, San Diego. 145-174.
Poorter, L. & F. Bongers. 2006. Leaf traits are good predictors of plant performance across 53 rain forest species. Ecology 87: 1733-1743.
R Development Core Team. 2006. R: a language and environment for statistical computing, version 2.4.1. R Foundation for Statistical Computing. Website: http://www.r-project.org/.
Reich, P. B., D. S. Ellsworth, M. B. Walters, J. Vose, C. Gresham, J. Volin and W. Bowman. 1999. Generality of leaf traits relationships: a test across six biomes. Ecology 80:1955-1969.
Reich, P.B., Walters, M.B., & Ellsworth, D.S. 1997. From tropics to tundra: Global convergence in plant functioning. Proceedings of the National Academy of Sciences USA 94: 13730-13734.
Reich, P.B., Wright, I.J., Cavender-Bares, J., Craine, J.M., Oleksyn, J., Westoby, M., & Walters, M.B. 2003. The evolution of plant functional variation: Traits, spectra, and strategies. International Journal of Plant Science 164: S143-S164.
Rozendaal, D.M.A, V.H. Hurtado, & L. Poorter. 2006. Plasticity in leaf traits of 38 tropical tree species in response to light; reslationships with light demand and adult stature. Functional Ecology 20: 207-216.
Sack, L., P.J. Melcher, WH Liu, E. Middleton, T. Pardee. 2006. How strong is intracanopy leaf plasticity in temperate deciduous trees? American Journal of Botany 93: 829-839.

86
Shipley, B., D. Vile, & E. Garnier. 2006. From plant traits to plant communities: a statistical mechanistic approach to biodiversity. Science 314: 812-814.
Sterck, F.J., Poorter, L. & F. Schieving 2006. Leaf traits determine the growth-survival trade-off across rain forest tree species. The American Naturalist, 167:758-765.
Stubbs W. & Wilson J.B. 2004. Evidence for limiting similarity in a sand dune community. Journal of Ecology, 92, 557-567.
Talbert, C.M. & A.E. Holch. 1957. A study of the lobing of sun and shade leaves. Ecology 38: 655-658.
Valladares, F., Wright, S.J., Lasso, E., Kitajima, K., & Pearcy, R.W. 2000. Plastic phenotypic response to light of 16 congeneric shrubs from a Panamanian rainforest. Ecology 81: 1925-1936.
Westoby, M, et al. 2002. Plant Ecological Strategies: Some leading dimensions of variation between species. Ann. Rev. Ecol. Syst. 33: 125-159.
Wright, I. J. et al. 2004. The worldwide leaf economics spectrum. Nature 428: 821–827. Wright, S. J. 2002. Plant diversity in tropical forests: a review of mechanisms of species
coexistence. Oecologia 130: 1-14. Wright, S. J., H. C. Muller-Landau, R. Condit, and S. P. Hubbell. 2003. Gap-dependent
recruitment, realized vital rates, and size distributions of tropical trees. Ecology 84: 3174- 3185.
Yamashita, N., Koike, N., & Ishida, A. 2002. Leaf ontogenetic dependence of light acclimation in invasive and native subtropical trees of difference successional status. Plant, Cell and Environment 25: 1341-1356.
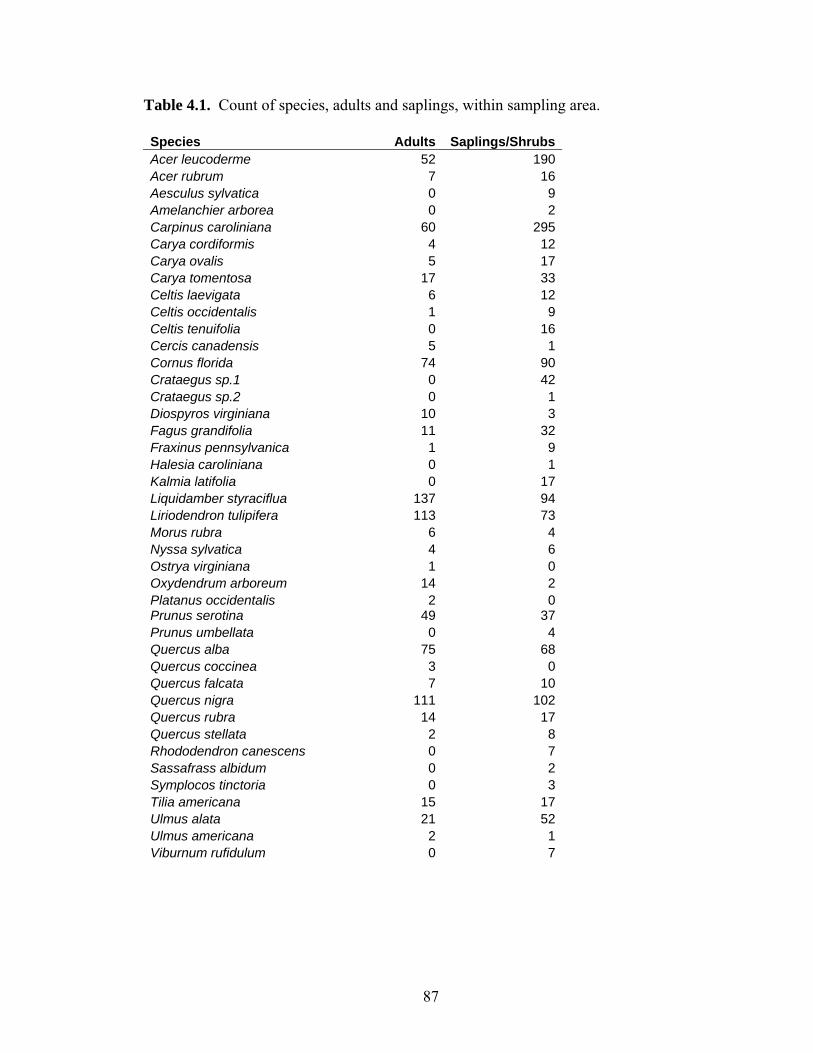
87
Table 4.1. Count of species, adults and saplings, within sampling area. Species Adults Saplings/Shrubs Acer leucoderme 52 190Acer rubrum 7 16Aesculus sylvatica 0 9Amelanchier arborea 0 2Carpinus caroliniana 60 295Carya cordiformis 4 12Carya ovalis 5 17Carya tomentosa 17 33Celtis laevigata 6 12Celtis occidentalis 1 9Celtis tenuifolia 0 16Cercis canadensis 5 1Cornus florida 74 90Crataegus sp.1 0 42Crataegus sp.2 0 1Diospyros virginiana 10 3Fagus grandifolia 11 32Fraxinus pennsylvanica 1 9Halesia caroliniana 0 1Kalmia latifolia 0 17Liquidamber styraciflua 137 94Liriodendron tulipifera 113 73Morus rubra 6 4Nyssa sylvatica 4 6Ostrya virginiana 1 0Oxydendrum arboreum 14 2Platanus occidentalis 2 0Prunus serotina 49 37Prunus umbellata 0 4Quercus alba 75 68Quercus coccinea 3 0Quercus falcata 7 10Quercus nigra 111 102Quercus rubra 14 17Quercus stellata 2 8Rhododendron canescens 0 7Sassafrass albidum 0 2Symplocos tinctoria 0 3Tilia americana 15 17Ulmus alata 21 52Ulmus americana 2 1Viburnum rufidulum 0 7

88
Table 4.2. Percent of Variation in each trait explained by different levels, resulting from nested ANOVA: species identity, canopy position, and residual error. All levels were statistically significant (p<0.001). Note that within this model, residual variation can arise from either within or among individual variation.
Trait SLA LNC p2a LSI Leaf Area
Source Species 32.03 50.28 41.18 59.73 47.11 Sun/Shade/Sapling 31.3 3.15 15.05 6.24 4.94 Unexplained 36.67 46.56 43.77 34.02 47.95

89
Table 4.3. Species means and standard deviation for different canopy positions, Specific Leaf Area Specific leaf area (SLA) Mean +/- SD for canopy position, # inds, # lves
Species
# Adult Inds Sampled
# Sun lves
Sun Leaf Mean Sun SD
# Shade leaves
Shade leaf mean
Shade Leaf SD
# Sapling Inds Sampled
# Sapling lves
Sapling Leaf mean
Sapling Leaf SD
Acer leucoderme 13 78 268.6309 48.77294 72 351.5356 45.10914 14 84 328.3536 53.60124 Acer rubrum 11 60 181.823 27.56172 66 210.2892 44.94198 15 90 235.1443 30.75812 Aesculus sylvatica 0 0 NA NA 0 NA NA 10 139 247.7713 37.12039 Amelanchier arborea 0 0 NA NA 0 NA NA 2 12 235.531 53.77976 Carpinus caroliniana 13 72 277.511 53.03192 78 329.4077 52.99439 13 78 333.2993 44.92806 Carya cordiformis 8 44 205.1768 35.60718 39 270.6434 27.52301 10 109 340.8522 56.06869 Carya ovalis 11 55 185.7942 24.70736 35 212.2543 35.27123 12 180 268.4343 44.20921 Carya tomentosa 10 174 194.8507 44.65359 156 266.0825 56.9388 14 308 298.9851 42.91961 Celtis laevigata 7 36 244.3576 59.92299 42 315.4493 62.00801 13 78 325.859 55.33702 Celtis occidentalis 1 6 267.8086 18.01791 6 314.8079 49.06475 11 66 317.4218 54.65919 Celtis tenuifolia 0 0 NA NA 0 NA NA 11 65 331.1267 65.58159 Cercis canadensis 7 42 277.9723 56.28567 31 330.4882 40.64735 1 6 299.7559 12.14643 Cornus florida 13 78 229.184 35.55862 78 256.5012 51.89105 11 66 277.0706 54.01505 Crataegus sp.1 0 0 NA NA 0 NA NA 18 120 257.145 47.08371 Crataegus sp.2 0 0 NA NA 0 NA NA 2 24 291.2402 26.45168 Diospyros virginiana 8 48 187.3388 37.17971 54 219.8498 59.82574 3 18 231.0634 32.67158 Fagus grandifolia 13 78 277.5037 46.75548 72 397.9051 54.45845 15 90 374.1957 57.06425 Fraxinus pennsylvanica 2 4 256.421 9.347267 22 335.9167 37.26133 7 173 298.3688 81.6177 Halesia caroliniana 0 0 NA NA 0 NA NA 1 12 459.14 30.98753 Kalmia latifolia 0 0 NA NA 0 NA NA 14 102 117.4934 19.04649 Liquidamber styraciflua 15 90 165.2325 60.50066 90 227.7028 78.4736 14 96 322.6126 75.5052 Liriodendron tulipifera 13 78 223.342 69.88192 82 276.5679 66.01009 12 72 383.5277 68.0298 Morus rubra 7 42 309.1989 100.9079 42 459.7583 143.4309 5 29 419.4649 82.7711 Nyssa sylvatica 5 24 234.0903 39.5955 30 366.0915 86.26629 7 42 319.1102 46.53312 Ostrya virginiana 1 6 226.3121 18.85448 6 256.5786 20.06597 0 0 NA NA

90
Oxydendrum arboreum 12 72 291.9167 65.31476 72 353.9602 99.83765 2 12 365.5411 38.31016 Platanus occidentalis 2 12 208.74 43.37104 12 231.7098 35.34842 0 0 NA NA Prunus serotina 14 84 174.4463 43.50275 84 196.9549 28.75545 17 113 244.669 40.32729 Prunus umbellata 0 0 NA NA 0 NA NA 6 36 287.0871 40.07991 Quercus alba 17 102 159.1969 39.03515 92 227.2419 60.14931 12 71 264.6915 32.59776 Quercus coccinea 3 18 114.9013 38.12938 16 122.4392 24.51915 0 0 NA NA Quercus falcata 9 60 114.5675 23.84644 51 201.1467 52.52623 12 72 182.5418 35.31279 Quercus nigra 21 126 120.0757 25.68836 109 182.3661 32.33572 21 126 186.7108 34.66883 Quercus rubra 15 99 160.3244 34.65731 64 178.4683 37.5494 16 101 234.584 38.36594 Quercus stellata 2 12 156.921 12.5845 12 204.3056 13.28742 12 71 192.3051 29.84559 Rhododendron canescens 0 0 NA NA 0 NA NA 9 54 312.0817 37.05627 Sassafrass albidum 0 0 NA NA 0 NA NA 2 12 267.7857 39.41172 Symplocos tinctoria 0 0 NA NA 0 NA NA 4 30 278.9287 90.30062 Tilia americana 11 65 299.7838 57.89236 63 314.3374 72.63774 14 108 365.0808 71.83069 Ulmus alata 13 60 217.7354 31.95619 78 272.0506 74.06423 18 144 278.3756 44.23512 Ulmus americana 2 12 196.1324 54.07187 12 285.486 32.52101 1 6 384.2695 30.75123 Viburnum rufidulum 0 0 NA NA 0 NA NA 9 54 202.3074 23.27804

91
Table 4.4. Species means and standard deviation for different canopy positions, Leaf Size. Leaf Size Mean +/- SD for canopy position, # inds, # lves
Species
# Adult Inds Sampled
# Sun lves
Sun Leaf Mean Sun SD
# Shade lves
Shade leaf mean
Shade Leaf SD
# Sapling Inds Sampled
# Sapling lves
Sapling Leaf mean
Sapling Leaf SD
Acer leucoderme 13 78 30.56846 11.27213 72 26.84778 12.81891 14 84 23.75144 9.486291 Acer rubrum 11 60 38.96007 18.16135 66 40.22844 19.42595 15 90 38.53916 17.89524 Aesculus sylvatica 0 0 0 10 139 23.84435 10.78483 Amelanchier arborea 0 0 0 2 12 34.17298 7.353341 Carpinus caroliniana 13 72 16.06428 6.499894 78 13.96363 7.861039 13 78 15.10906 6.336846 Carya cordiformis 8 44 17.04733 10.52703 39 26.26619 18.09366 10 109 27.65477 20.92348 Carya ovalis 11 55 47.94604 27.27377 35 50.25994 29.02271 12 180 71.80588 52.44248 Carya tomentosa 10 174 44.66543 33.24352 156 47.12309 35.15694 14 308 40.23951 28.49249 Celtis laevigata 7 36 19.41613 6.902212 42 18.21593 12.13989 13 78 18.04804 8.187772 Celtis occidentalis 1 6 18.28893 5.672424 6 18.55003 5.168887 11 66 25.52941 12.5465 Celtis tenuifolia 0 0 0 11 65 13.75791 5.820809 Cercis canadensis 7 42 96.63797 82.94286 31 88.20329 54.80088 1 6 48.8969 26.06668 Cornus florida 13 78 45.4521 12.7792 78 43.03794 18.74696 11 66 42.94652 15.51658 Crataegus sp.1 0 0 0 18 120 10.64637 4.86606 Crataegus sp.2 0 0 0 2 24 53.02608 14.37974 Diospyros virginiana 8 48 37.49213 19.05356 54 40.43844 23.29956 3 18 32.56161 14.96574 Fagus grandifolia 13 78 50.04431 15.04965 72 38.48284 16.60644 15 90 42.67323 15.20404 Fraxinus pennsylvanica 2 4 25.4685 6.265876 22 39.26945 19.08487 7 173 43.53693 21.01387 Halesia caroliniana 0 0 0 1 12 53.79293 19.97286 Kalmia latifolia 0 0 0 14 102 14.64222 5.053044 Liquidamber styraciflua 15 90 54.97626 23.29085 90 49.65065 25.16564 14 96 35.53933 17.53619 Liriodendron tulipifera 13 78 92.00166 48.81698 82 100.023 52.9843 12 72 106.4453 49.91303 Morus rubra 7 42 206.0994 95.45601 42 131.5167 65.34004 5 29 106.0721 74.86587 Nyssa sylvatica 5 24 59.3939 12.69627 30 48.0367 26.68239 7 42 37.621 14.37366 Ostrya virginiana 1 6 36.60807 10.61803 6 39.84247 14.51073 0 0

92
Oxydendrum arboreum 12 72 48.0354 15.84219 72 48.03705 18.28977 2 12 51.17373 22.31803 Platanus occidentalis 2 12 65.57417 33.19631 12 92.79203 65.11883 0 0 Prunus serotina 14 84 21.70732 7.675255 84 20.15273 8.121449 17 113 19.41667 5.852402 Prunus umbellata 0 0 0 6 36 13.37976 4.183791 Quercus alba 17 102 51.67077 28.30624 92 69.15961 43.09291 12 71 55.84802 33.20616 Quercus coccinea 3 18 124.3786 48.17834 16 119.0085 68.86621 0 0 Quercus falcata 9 60 70.11174 29.24406 51 61.74022 35.63151 12 72 66.31524 31.26076 Quercus nigra 21 126 15.44312 8.536488 109 20.13679 12.92189 21 126 22.46271 12.72685 Quercus rubra 15 99 94.50623 37.33838 64 100.2823 45.03106 16 101 116.3512 67.97442 Quercus stellata 2 12 113.3695 32.80362 12 92.32698 29.91245 12 71 108.4784 55.43497 Rhododendron canescens 0 0 0 9 54 14.11151 4.372057 Sassafrass albidum 0 0 0 2 12 70.77583 44.95784 Symplocos tinctoria 0 0 0 4 30 32.09939 9.89787 Tilia americana 11 65 67.14371 34.03376 63 68.5779 33.69911 14 108 48.03782 24.83066 Ulmus alata 13 60 14.65603 5.431416 78 15.46218 8.08096 18 144 14.31081 5.908738 Ulmus americana 2 12 26.13543 8.502084 12 19.05937 8.214681 1 6 27.39713 11.37189 Viburnum rufidulum 0 0 0 9 54 19.11806 8.61728

93
Table 4.5. Species means and standard deviation for different canopy positions, Leaf Nitrogen Concentration. Leaf Nitrogen Content (LNC) Mean +/- SD for canopy position, # inds, # lves
Species
# Adult Inds Sampled
# Sun lves
Sun Leaf Mean Sun SD
# Shade lves
Shade leaf mean
Shade Leaf SD
# Sapling Inds Sampled
# Sapling lves
Sapling Leaf mean
Sapling Leaf SD
Acer leucoderme 13 78 2.2882 0.3061 72 2.2367 0.2017 14 84 2.2279 0.2063 Acer rubrum 11 60 1.915 0.2052 66 2.1572 0.6222 15 90 1.8567 0.2237 Aesculus sylvatica 0 0 0 . 10 139 2.1704 0.2559 Amelanchier arborea 0 0 0 2 12 1.925 0.1344 Carpinus caroliniana 13 72 2.1031 0.1805 78 2.1185 0.2068 13 78 2.0933 0.1977 Carya cordiformis 8 44 2.2017 0.1458 39 2.1525 0.2949 10 109 2.1647 0.4544 Carya ovalis 11 55 1.6907 0.1147 35 1.8338 0.2139 12 180 2.026 0.2607 Carya tomentosa 10 174 1.9753 0.3257 156 2.0692 0.2981 14 308 2.1289 0.3014 Celtis laevigata 7 36 2.8767 0.23 42 2.792 0.5222 13 78 3.3977 0.3701 Celtis occidentalis 1 6 3.175 0.0071 6 2.875 0.0071 11 66 3.1 0.5708 Celtis tenuifolia 0 0 0 11 65 3.0244 0.3507 Cercis canadensis 7 42 3.09 0.3967 31 2.635 0.7921 1 6 2.595 0.0071 Cornus florida 13 78 1.9154 0.212 78 1.8746 0.2776 11 66 1.8518 0.2226 Crataegus sp.1 0 0 0 18 120 1.965 0.2482 Crataegus sp.2 0 0 0 2 24 1.975 0.0071 Diospyros virginiana 8 48 2.3375 0.3017 54 2.2962 0.3389 3 18 2.0967 0.0851 Fagus grandifolia 13 78 2.265 0.2256 72 2.3117 0.1753 15 90 2.2507 0.1406 Fraxinus pennsylvanica 2 4 2.0925 0.2562 22 2.4575 0.4279 7 173 2.2429 0.3779 Halesia caroliniana 0 0 0 1 12 2.765 0.0778 Kalmia latifolia 0 0 0 14 102 1.37 0.1086 Liquidamber styraciflua 15 90 2.0073 0.2887 90 1.9407 0.3148 14 96 1.9446 0.2319 Liriodendron tulipifera 13 78 2.4127 0.2531 82 2.4882 0.5179 12 72 2.5975 0.2808 Morus rubra 7 42 3.134 0.4698 42 3.6017 0.3144 5 29 2.965 0.9604 Nyssa sylvatica 5 24 2.268 0.4149 30 2.17 0.2631 7 42 2.4557 0.823 Ostrya virginiana 1 6 1.795 0.0071 6 1.755 0.0071 0 0 Oxydendrum arboreum 12 72 2.5018 0.3398 72 2.54 0.3217 2 12 3.2067 1.4931

94
Platanus occidentalis 2 12 2.01 0.1131 12 2.09 0.5091 0 0 Prunus serotina 14 84 2.4531 0.4559 84 2.3869 0.3984 17 113 2.3089 0.2974 Prunus umbellata 0 0 0 6 36 2.506 0.1922 Quercus alba 17 102 2.2394 0.2308 92 2.24 0.2141 12 71 2.2933 0.1893 Quercus coccinea 3 18 2.27 0.2155 16 2.3233 0.3564 0 0 . Quercus falcata 9 60 2.064 0.3439 51 2.1289 0.2667 12 72 1.9145 0.2242 Quercus nigra 21 126 2.0929 0.2276 109 2.14 0.2051 21 126 2.0528 0.1992 Quercus rubra 15 99 2.3886 0.4073 64 2.163 0.2783 16 101 2.2812 0.2592 Quercus stellata 2 12 1.88 0.2121 12 1.8 0.0141 12 71 2.04 0.1374 Rhododendron canescens 0 0 0 9 54 1.8667 0.179 Sassafrass albidum 0 0 0 2 12 2.86 0.0424 Symplocos tinctoria 0 0 0 4 30 2.47 0.3077 Tilia americana 11 65 2.7122 0.5794 63 2.8444 0.4491 14 108 2.6431 0.2681 Ulmus alata 13 60 2.5367 0.2677 78 2.5544 0.4112 18 144 2.5363 0.3522 Ulmus americana 2 12 2.18 0.0424 12 2.155 0.3465 1 6 2.915 0.0071 Viburnum rufidulum 0 0 0 9 54 1.4656 0.1148

95
Table 4.6. Species means and standard deviation for different canopy positions, Perimeter2: Area Ratio. Perimeter2:Area Ratio Mean +/- SD for canopy position, # inds, # lves
Species
# Adult Inds Sampled
# Sun lves
Sun Leaf Mean Sun SD
# Shade lves
Shade leaf mean
Shade Leaf SD
# Sapling Inds Sampled
# Sapling lves
Sapling Leaf mean
Sapling Leaf SD
Acer leucoderme 13 78 39.78188 11.40727 72 47.97577 13.6138 14 84 44.35978 12.31673 Acer rubrum 11 60 33.6775 12.4485 66 37.62324 15.97667 15 90 36.80469 13.92407 Aesculus sylvatica 0 0 0 10 139 24.21291 4.790542 Amelanchier arborea 0 0 0 2 12 20.9635 2.220258 Carpinus caroliniana 13 72 23.38639 3.278872 78 22.46433 3.566124 13 78 23.49702 3.25598 Carya cordiformis 8 44 26.6445 6.396205 39 28.01208 9.902702 10 109 26.74064 10.61033 Carya ovalis 11 55 24.12514 6.750541 35 21.39696 4.799875 12 180 22.25048 11.93496 Carya tomentosa 10 174 22.35177 7.945753 156 20.68021 5.710802 14 308 20.81371 4.729258 Celtis laevigata 7 36 24.31206 6.05586 42 22.28166 3.949479 13 78 24.85292 3.989677 Celtis occidentalis 1 6 22.38558 2.31464 6 21.10448 2.218217 11 66 22.53837 2.977293 Celtis tenuifolia 0 0 0 11 65 21.25414 3.231013 Cercis canadensis 7 42 18.08087 3.543818 31 18.47583 4.494288 1 6 16.03936 0.8408 Cornus florida 13 78 19.2711 3.146441 78 20.59055 3.551524 11 66 19.72843 3.676043 Crataegus sp.1 0 0 0 18 120 33.54459 9.495336 Crataegus sp.2 0 0 0 2 24 21.93886 4.054995 Diospyros virginiana 8 48 20.77459 5.952695 54 21.4751 7.435799 3 18 18.30602 4.322299 Fagus grandifolia 13 78 22.04646 2.441437 72 21.22677 1.561836 15 90 20.05027 1.784177 Fraxinus pennsylvanica 2 4 19.33106 4.232547 22 22.54687 17.45418 7 173 21.15943 8.646284 Halesia caroliniana 0 0 0 1 12 17.00538 1.43729 Kalmia latifolia 0 0 0 14 102 18.71407 2.246125 Liquidamber styraciflua 15 90 51.39438 12.91264 90 42.46415 11.07587 14 96 32.80216 7.137664 Liriodendron tulipifera 13 78 42.32107 10.35628 82 37.24867 13.64882 12 72 45.96805 13.38809 Morus rubra 7 42 24.89091 5.415516 42 30.45833 13.39899 5 29 23.57268 5.45189 Nyssa sylvatica 5 24 17.09605 2.838827 30 18.11152 3.429164 7 42 19.87021 5.526185 Ostrya virginiana 1 6 32.966 5.642472 6 30.11671 3.429886 0 0 Oxydendrum arboreum 12 72 20.21778 3.196316 72 19.9765 3.501095 2 12 16.57679 1.936345

96
Platanus occidentalis 2 12 28.8223 5.718781 12 32.66876 8.486809 0 0 Prunus serotina 14 84 19.20407 3.057007 84 19.23361 3.250509 17 113 19.69341 3.32278 Prunus umbellata 0 0 0 6 36 24.90486 5.52011 Quercus alba 17 102 54.12245 27.0034 92 39.41947 19.60609 12 71 29.18381 5.5319 Quercus coccinea 3 18 91.80054 30.60839 16 59.56929 16.17263 0 0 Quercus falcata 9 60 44.33285 15.03502 51 30.42989 10.53308 12 72 25.25068 7.804173 Quercus nigra 21 126 28.53525 6.025382 109 30.46326 7.8789 21 126 35.71964 11.01322 Quercus rubra 15 99 62.55388 21.69454 64 47.80943 16.36807 16 101 34.57793 12.1531 Quercus stellata 2 12 33.19105 5.675175 12 31.22153 8.462892 12 71 34.52339 9.70272 Rhododendron canescens 0 0 0 9 54 18.66759 3.034335 Sassafrass albidum 0 0 0 2 12 22.07134 5.595912 Symplocos tinctoria 0 0 0 4 30 18.06523 1.747096 Tilia americana 11 65 24.50082 5.636739 63 23.97694 5.287989 14 108 24.55514 3.888587 Ulmus alata 13 60 26.7845 2.611607 78 27.89399 3.242554 18 144 27.24873 3.359083 Ulmus americana 2 12 34.44617 8.066142 12 32.02148 2.486001 1 6 27.62358 2.117315 Viburnum rufidulum 0 0 0 9 54 15.73212 1.686016

97
Table 4.7. Species means and standard deviation for different canopy positions, Leaf Shape Index. Leaf Shape Index (L:W) Mean +/- SD for canopy position, # inds, # lves
Species
# Adult Inds Sampled
# Sun lves
Sun Leaf Mean Sun SD
# Shade lves
Shade leaf mean
Shade Leaf SD
# Sapling Inds Sampled
# Sapling lves
Sapling Leaf mean
Sapling Leaf SD
Acer leucoderme 13 78 0.950827 0.082778 72 0.92355 0.113419 14 84 0.905816 0.094765 Acer rubrum 11 60 1.195228 0.1559 66 1.157242 0.176996 15 90 1.184322 0.185358 Aesculus sylvatica 0 0 0 10 139 2.460617 0.343378 Amelanchier arborea 0 0 0 2 12 1.786193 0.247912 Carpinus caroliniana 13 72 1.921593 0.215523 78 1.851878 0.260656 13 78 1.722578 0.15987 Carya cordiformis 8 44 2.713987 0.415355 39 2.238495 0.426035 10 109 2.208542 0.300523 Carya ovalis 11 55 2.10877 0.500844 35 1.99545 0.276942 12 180 1.953071 0.389997 Carya tomentosa 10 174 2.077291 0.372158 156 2.023115 0.321695 14 308 1.973177 0.284338 Celtis laevigata 7 36 2.116276 0.330182 42 1.874159 0.295615 13 78 2.114039 0.300483 Celtis occidentalis 1 6 1.942081 0.211842 6 1.713524 0.106608 11 66 1.781185 0.260612 Celtis tenuifolia 0 0 0 11 65 1.775124 0.209308 Cercis canadensis 7 42 0.963951 0.113395 31 0.899638 0.066314 1 6 0.982162 0.0707 Cornus florida 13 78 1.845304 0.230139 78 1.867106 0.28634 11 66 1.827429 0.25646 Crataegus sp.1 0 0 0 18 120 1.365041 0.307331 Crataegus sp.2 0 0 0 2 24 1.514465 0.171565 Diospyros virginiana 8 48 1.923479 0.327729 54 1.888818 0.371306 3 18 1.864402 0.240309 Fagus grandifolia 13 78 2.023751 0.193257 72 1.97932 0.169157 15 90 1.909282 0.15653 Fraxinus pennsylvanica 2 4 1.472804 0.131294 22 1.757787 0.339217 7 173 1.925995 0.340731 Halesia caroliniana 0 0 0 1 12 1.729532 0.202681 Kalmia latifolia 0 0 0 14 102 2.351754 0.280415 Liquidamber styraciflua 15 90 0.810238 0.089952 90 0.802752 0.083518 14 96 0.844846 0.074025 Liriodendron tulipifera 13 78 0.772996 0.147239 82 0.797 0.133712 12 72 0.722706 0.124272 Morus rubra 7 42 1.483542 0.187026 42 1.338021 0.182053 5 29 1.316942 0.1566 Nyssa sylvatica 5 24 1.923453 0.384433 30 1.932524 0.325351 7 42 1.982023 0.301804 Ostrya virginiana 1 6 2.506753 0.092177 6 2.150547 0.111168 0 0

98
Oxydendrum arboreum 12 72 2.537847 0.431906 72 2.501493 0.43012 2 12 1.950733 0.246035 Platanus occidentalis 2 12 0.910844 0.126197 12 0.963775 0.133403 0 0 Prunus serotina 14 84 2.249035 0.365112 84 2.208705 0.379669 17 113 2.268643 0.361888 Prunus umbellata 0 0 0 6 36 2.191637 0.342461 Quercus alba 17 102 1.713764 0.392522 92 1.743127 0.330333 12 71 1.809393 0.269363 Quercus coccinea 3 18 1.220372 0.182669 16 1.319135 0.185659 0 0 Quercus falcata 9 60 1.755653 0.346146 51 1.970047 0.307382 12 72 1.803525 0.258348 Quercus nigra 21 126 2.512057 0.743839 109 3.082247 1.328326 21 126 3.863547 1.900629 Quercus rubra 15 99 1.406981 0.179604 64 1.415105 0.150778 16 101 1.486345 0.168936 Quercus stellata 2 12 1.499922 0.143443 12 1.462881 0.182303 12 71 1.441187 0.197485 Rhododendron canescens 0 0 0 9 54 2.171583 0.38494 Sassafrass albidum 0 0 0 2 12 1.865885 0.263472 Symplocos tinctoria 0 0 0 4 30 2.224987 0.212675 Tilia americana 11 65 1.247858 0.159157 63 1.220005 0.156113 14 108 1.295438 0.162461 Ulmus alata 13 60 2.404124 0.248495 78 2.325394 0.252903 18 144 2.416431 0.369989 Ulmus americana 2 12 2.070433 0.134219 12 2.31236 0.207427 1 6 2.002024 0.197998 Viburnum rufidulum 0 0 0 9 54 1.569031 0.18651

99
Table 4.8. Adjust r2 values for pairwise correlative relationships between all traits. All reported are significant to p<0.001, except for non-significant, reported NS.
LNC p2a LSI Leaf Area
SLA 0.1578 0.0499 0.01748 0.000732LNC NS NS 0.02205p2a 0.03355 0.06026LSI 0.07788

100
Table 4.9. Mean trait overlaps for each trait for all leaves pooled, and for leaves in individual canopy positions.
Group All Adults-Sun Lves
Adults-Shade Lves Saplings
Trait Specific Leaf Area 0.482 0.424 0.392 0.421 N mass 0.397 0.416 0.449 0.324 Perimeter 2: Area 0.443 0.402 0.439 0.435 Leaf Shape Index 0.371 0.287 0.315 0.386
Leaf Area 0.456 0.416 0.504 0.469

101
Figure 4.1. Map of Thompson Mills Forest and location of study transects. Map courtesy UGA Warnell School of Forest Resources.

102
Figure 4.2. Boxplots of Specific Leaf Area (SLA) for Quercus alba individuals, each box representing leaves collected from a single individual tree, sun leaves of adults in top graph; sapling shade leaves below. Note the breadth of trait values within single individuals, as well as the lack of consistency among individuals.

103
Figure 4.3. Boxplots of Specific Leaf Area (SLA) for Acer leucoderme (an understory tree) individuals, each box representing leaves collected from a single individual tree, sun leaves of adults in top graph; sapling shade leaves below. Again, note the breadth of trait values within single individuals, as well as the lack of consistency among individuals.

104
Figure 4.4. Correlation between Leaf Nitrogen Content (LNC) and Specific Leaf Area; adult sun leaves only on leaf; all leaves on right. Note wide scatter, but moderate positive correlation in both graphs.

105
Figure 4.5. Distribution of 100 randomizations of species assignments to existing tree-leaf data. Note that observed trait overlap falls well within that expected to be generated if individuals were randomly assigned to species.
Actual Value =0.482
Actual Value = 0.421
Actual Value =0.424
Actual Value =0.392
Actual Value =0.424 Ac
Actual Value =

106
CHAPTER 5
SPATIAL DISTRIBUTION OF FUNCTIONAL TRAITS IN A TEMPERATE TREE
COMMUNITY1
1 Lake, J.K. and S.P. Hubbell. To be submitted to Ecology Letters.

107
Abstract
Three competing hypotheses of community assembly are tested using plant
functional traits: limiting similarity, habitat filtering, and ecological
equivalence/neutrality. The spatial distribution of trait overlap was used as a measure of
similarity at the neighborhood level. We found no support for limiting similarity in our
data, some support for habitat filtering, especially based on leaf nitrogen levels, and a
largely random signal for these traits in most tested species.

108
Introduction
One of the most challenging ongoing problems in plant community ecology is that
of species coexistence. Scores, or even hundreds, of species of woody plants commonly
co-occur within a single hectare of tropical forests. Even in relatively species poor
temperate forests, it is not uncommon to find 40 or more species of trees and shrubs in a
comparable area. These observations have led to numerous hypotheses for mechanisms
of coexistence (e.g., MacArthur and Levins 1967; Hubbell 2001; Weiher and Keddy
1995; Tilman 1982), but rigorous mechanistic tests of these hypotheses have remained
relatively elusive. The advent of neutral theory in ecology (Hubbell 2001) has rekindled
interest in hypotheses of community assembly because they bear directly on the neutral-
non-neutral debate. However, developing a mechanistic, predictive theory of community
assembly remains a “Holy Grail” of ecology (Lavorel and Garnier 2002).
Recently, there has been a renewed focus on plant functional traits as a driver of
species coexistence (McGill et al. 2006). Because functional traits are defined as “any
attribute that has potentially significant influence on establishment, survival, and fitness and
… focus[ing] on those traits related to the ability to acquire, use, and conserve resources
(Reich et al. 2003)”, they ought to be a good measure of niche. And, although there is a long
history of using morphological traits as a surrogate for niche in animal systems (i.e.,
Hutchinson 1967, Van Valen 1965), the idea has not been used on a wide-spread basis in
plant communities until quite recently.
In the last few years, a series of studies have demonstrated a number of fundamental,
globally applicable trade-offs (Reich et al. 1997; Wright et al. 2004) in plant functional traits,
and particularly in leaf traits. These traits, associated with life history variation, appear
fundamentally important to the way plants make their living (Wright et al. 2003). Poorter
109
and Bongers (2006) showed that leaf traits, in particular, are well correlated with plant
performance in relation to particular crown exposure. In this research, we have chosen to
focus on leaf traits, both because of their demonstrated importance in global patterns of plant
diversity (ie, Wright et al. 2004) and also because of their central role in photosynthesis and
respiration. Light has long been recognized as one of the most limiting resources in tropical
forests, and indeed has been hypothesized to be one of the most finely partitioned resources
in a tropical forest (i.e., Orians 1982, Ricklefs 1977, Denslow 1980). Of course, we do not
imply that leaf traits represent every aspect of a species’ niche space, but they certainly ought
to be important to the way these species are surviving and coexisting.
Specifically, we have chosen five leaf traits upon which to focus. Specific leaf
area (SLA, measured in cm2/g) is one of the strongest measures of a plant’s
photosynthetic investment, and is a strong correlate of mass-based maximum
photosynthetic rates (Amax). Low values tend to be associated with longer leaf lifespans,
nutrient limited environments, and high defensive investment (Reich et al. 2003; Reich et al.
1997). Across several species of tropical trees, Poorter and Bongers (2006) have also shown
that the SLA is positively related to whole-plant growth and negatively to survival,
suggesting low investment in high turn-over, metabolically fast leaves in short-lived sun
demanding plants. Leaf size, the area of leaf lamina or leaflets, excluding petiole or rachis, is
a measure of actual photosynthetic surface, and is important to both water and energy balance
(Cornelissen et al. 2003). Leaf Nitrogen Content (LNC) is highly correlated to mass-based
maximum photosynthetic rates (Amax). It provides insights into nutrient use and availability,
and is correlated to leaf lifespan (Reich et al., 1997). Nmass has been shown to correlate
positively with growth, while Narea correlates with survival (Poorter and Bongers 2006).
Carbon: Nitrogen ratios (C:N Ratio) are indirectly tied to plant defense strategies. Higher

110
C:N ratios suggest a lack of nitrogen in the leaves, and the excess carbon is often invested in
high carbon phenolic compounds for defense against herbivory (Sterner and Elser 2002).
Finally, two leaf morphological traits, while less well understood ecologically, appear related
to sun exposure and overall energy balance. Perimeter2:Area ratio provides a good measure
of lobing, in essence providing the degree to which a leaf blade’s shape diverges from a
circle (Sack et al. 2006). Leaf Shape Index (LSI), or the ratio of leaf length to width, provides
another metric of a leaf’s shape (Rozendaal et al. 2006).
Recently, several authors have begun to look to plant functional traits to assess
questions of community assembly and structure (summarized in McGill et al. 2006).
Shipley et al. (2006) have built a predictive model of community composition based on
plant functional traits using maximum entropy methods. Stubbs and Wilson (2004)
demonstrated a degree of limiting similarity in plant functional traits in a New Zealand
dune community. Cornwell et al. (2006) used a combination of species with functional
traits to demonstrate habitat filtering in small plots of California scrub forest communities
using a convex hull volume method, and more recently, Ackerly and Cornwell (2007)
used the same data to attempt to tease apart species’ alpha and beta niche values for
similar functional traits.
However, with the exception of the work of Ackerly and Cornwell (2007), all of
these studies have assumed that interspecific variation is much stronger than intraspecific
variability in these traits. Indeed, the success of Shipley et al. (2006)’s model depends on
this assumption, and McGill et al. (2006) go so far as to argue that functional traits are
only useful in community assembly if these assumptions are met. Yet, many of the traits
used in this study show strong intraspecific variability. While this reality makes it more
difficult to apply predictive models of community assembly, a vast literature has

111
demonstrated the importance of these traits to the ecology of species (ie, Reich et al.
1997; Wright et al. 2004). Therefore, this variability must be considered in any study of
functional traits in the context of ecological communities.
Because spatial structure is inherent in sessile plant communities, an individual’s
biotic and abiotic environment is relatively easy to quantify. If functional trait
differentiation is important to coexistence in these communities, then one should find
greater trait differentiation of plants that grow in closer proximity to one another, i.e., as
neighbors, than in random samples of these communities. A central tenet of classical
theory in community ecology is that coexistence requires that species exploit limiting
resources differently from one another (Grinnell 1914 and 1917; Elton 1927; Hutchinson
1957, 1959; MacArthur and Levins 1967; Tilman 1982). Gause (1934) invoked
competitive exclusion as a process that ought to prevent too close of competitors from
coexisting. Under classical niche theory, as the number of species in a community goes
up, either the total niche volume for the community must be larger, or else niches must
become narrower to allow for coexistence of additional species.
However, within plant communities, there is relatively little support for limiting
similarity and competitive exclusion. Indeed, the asymmetric nature of plant competition
and the spatial nature of their arrangement may reduce the importance of these forces.
Nonetheless, within-taxon evidence from tropical gap plants (Davies et al. 2004) and
within the genus Quercus (Cavendar-Bares et al. 2004a, 2004b) suggest that there may be
differentiation of ecological traits within closely related species. Furthermore, Stubbs
and Wilson (2004) found what they describe as the most compelling evidence for limiting
similarity in plant communities in a study of dune species in New Zealand, although the
112
proportion of statistically significant tests showing such evidence was only around 8%,
perhaps more the result of type I error than a real pattern. However, Ackerly and
Cornwell (2007) also show a degree of differentiation among species in local plots of
woody plant communities in California.
Weiher and Keddy (1995) offer another hypothesis, which they call
environmental filtering. Plant species will tend to be filtered and sorted according to
their respective environmental requirements, with the result that more similar species will
occupy more similar habitats. The result should be a clustering of individuals with
similar requirements, following the same spatial distribution as habitat availability.
Although not typically tested in continually spatially explicit fashion, there is more
evidence for habitat filtering (ie, Cornwell and Ackerly 2006; Harms et al. 2002) in plant
communities.
In contrast, Hubbell (2001) and colleagues argue that all this changes under strong
dispersal and recruitment limitation. Dispersal and recruitment limitation mean that
species fail to disperse to and/or recruit in all sites favorable to their survival and growth.
Hubbell et al. (1999) found strong dispersal and recruitment limitation in a tree
community in Panama, which they argued extensively delays competitive exclusion. In
theoretical models, strong dispersal and recruitment limitation permits many species to
coexist essentially indefinitely, even in the absence of limiting similarity (Hurtt and
Pacala 1995). Hubbell’s neutral theory (2001) and the concept of ecological equivalence
that has grown from the theory (ie, Hubbell 2006; Lake et al., submitted) suggests that
species share a common generalist approach. Some evidence relating plant occurrence to
nutrient levels and ratios within a tropical forest suggests equivalence may be the norm,

113
at least within that system (Hubbell et al., in press). If ecological equivalence is indeed
driving community patterns, we would expect no spatial signal in plant traits.
In this paper, we test these three hypotheses using leaf functional traits. Each
hypothesis has generated unique, specific predictions for the spatial distribution of
functional traits within plant communities. While neutrality ought to produce a random
distribution of ecologically relevant traits, limiting similarity would lead to
overdispersion of mean trait values and reduced trait overlap at close spatial scales,
decaying over additional space to a random pattern. In contrast, habitat filtering ought to
lead to species with a shared strategy and shared requirements in close proximity, so
mean trait values ought to be clustered at small spatial scales and there should be
increased trait overlap, and concurrent with a change in habitat, there would be a change
in species composition and ecologically-relevant traits.
Materials and Methods
Site description
Thompson Mills Forest is a 135-ha. reserve located near Braselton, Georgia, in
Jackson County, about 40 miles northeast of Atlanta in the Piedmont (34°7′39 N,
83°48′6 W) . The site is composed of late-secondary oak-hickory forest, dominated by
Quercus sp., Carya sp., Liriodendron tulipifera, and Fagus grandifolia. Average annual
rainfall in this area is estimated at 141.7 cm, mean annual temperature is 15.6 C (Georgia
Automated Environmental Monitoring Network, Gainesville, GA). Three 20x200m
sampling transects were established. The first runs along a northwest facing slope
overlooking the Mulberry River; the second, along a southfacing slope overlooking Lee

114
Creek; the third perpendicular to Lee Creek at a point upstream from the second, rising
along a gentle southeast facing slope. All are located in late-secondary forest areas with
very limited or no recent human-based disturbance.
Sampling Methods
Within each transect, all stems >1 cm diameter at breast height (dbh, 1.4 m above
ground) were mapped, identified, and dbh was measured. Based on dbh and light
availability, specimens were classified as adults or saplings, with cut-off size dependent
on the species at hand. For all tree species (canopy and understory), up to a total of 24
specimens (12 adults, 12 saplings), as evenly spread as possible among and within
transects, were selected for leaf sampling. In adults, three branchlets each from the
sunniest position, and a strongly shaded position were collected and placed in water.
When possible, branchlets were collected with pole pruners. However, sun leaves (and
many shade leaves) of adult canopy trees were not accessible from the ground. For those
specimens, we used used a shotgun to bring down the branchlets with a ground spotter
verifying canopy position. Specimens were returned to the lab and rehydrated overnight.
A total of six leaves from each canopy position were selected for analysis, attempting to
select two from each of the branchlets whenever possible. While size was not a factor in
determining leaves sampled, we selected the most recently unfolded, fully hardened
leaves with the least amount of herbivory and epiphylls possible. Leaves were scanned
on an Epson 1680 flatbed scanner, and analyzed using WinFOLIA 2005b Software.
Subsequently, leaves were dried at 60C for at least 72 hours, then weighed on a Mettler
balance.

115
Trait Analysis
WinFOLIA automatically collects data on leaf area, perimeter, length and width,
all used in subsequent analyses, usually as compound measures. Morphological traits
were analyzed from scanned images using WinFOLIA software (leaf size), or from
compounding data collected (P2A, Leaf Shape Index, SLA). Leaf Nitrogen Content and
C:N Ratio were analyzed by the Micro Dumas Analytical method, using a NA1500
C/H/N Elemental Analyzer. Dried leaf samples were ground using a ball mill, after
bulking three leaves from a given canopy position. Specimens were processed in the
University of Georgia analytical chemistry laboratory.
Statistical analyses
For these analyses, we focused primarily on SLA and LNC, the two traits most
ecologically relevant to photosynthetic capacity and thus most likely to impact
interspecific competition or species habitat affinities. For each species and trait, a trait
distribution was calculated using a kernel estimator (see Mouillot et al. 2005). This
method, which allows us to work with continuous data without assuming a normal
distribution of data, calculates a density function by assuming measurement error around
each data point, and then using a smoothing function to estimate a distribution of all data
for a given trait and population. These species (or population) kernels are then used to
estimate pairwise overlaps in trait space of coexisting species. Overlap is simply
represented as the integral of the area under the species’ respective kernel curves when

116
overlaid on one another. From these pairwise overlaps, a community-wide overlap index
is then calculated, simply by averaging these overlaps.
In our first analysis, this community overlap index was calculated for nested
“communities” of different sizes (0.04 ha, 0.1 ha, and 0.4 ha.), built from within the
transects sampled. This approach followed traditional ecological methods of considering
simply the presence or absence of a species within a given plot, or community. These
overlap values were then regressed onto plot size.
Second, we considered an individual level spatial model, where the exact
coordinates of each individual was used to calculate distances from every other individual
within each transect. Saplings were separated from adults, and only values from sun
leaves in adults were used for these analyses, in accordance with traditional approaches to
functional ecology (Cornellisen et al. 2003). Trait overlap (as described above) was
calculated for each individual pair in each transect, and then averaged at 5 m distance
classes, both within species and size class, and subsequently, without regard to species.
These analyses were run individually for each species and ontogenetic class, as well as
pooled with all individuals. For each analysis, we also performed 100 community
randomizations, maintaining size classes and overall abundance distributions, but
randomly assigning species identities and their associated trait values to each individual.
From these 100 randomizations, we recorded minimum and maximum overlap values at
each distance class. All analyses were conducted using the R Statistical Environment (R
Core Development Team 2006).

117
Results
When simply considering trait overlap as a function of community size, without
regard to species abundances, we found no pattern in two of the three transects, and in the
third, a significant negative association between trait overlap and plot size (R2 = 0.35;
p=0.02; see fig. 1) . For the third transect, this suggests decreasing species similarity/trait
overlap as we sample a larger area; this pattern was not observed in either of the other
sampling transects.
When all species were pooled, there were no departures from random
expectations for overlap of SLA within any of the transects, illustrated here by transect 3
(see fig. 2). When performed by individual species and size class within each transect,
there were seven out of 158 plots (4.4%) that showed any pattern outside of the
randomization envelopes for SLA (See figs. 3 and 4). All seven showed greater overlap
than expected by chance at small spatial scales, decreasing into the randomization
envelopes within 15-25 m. With the exception of Liquidamber styraciflua, which
demonstrated non-random patterns in overlap in transects 1 and 3, but not 2, the species
demonstrating non-random patterns were not the same from one transect to the next.
For Leaf Nitrogen Content (LNC), the story is somewhat different. About 30% of
the tests within Transect 1 showed greater trait overlap than expected by chance for LNC,
although the pattern was often only distinguishable in one size class or the other,
typically with a stronger signal in the sapling size class. Again, there was no evidence of
limiting similarity (See fig. 5 for examples.)

118
Discussion
These spatial results strongly suggest a largely random distribution of plants in
relation to specific leaf area across a landscape, and present a more mixed picture for leaf
nitrogen. It is important to note, however, that LNC values often are driven in part by
environmental availability, so it is possible that the patterns observed are being driven by
environmental heterogeneity in soil nitrogen availability. Because we were unable to
measure soil nitrogen levels, we are unable to test this idea directly. However, any
environmental filter would be expected to operate over the lifespan of plants, so signals
would be expected to become stronger in larger size classes (ie, older individuals that
have already undergone selection); we observed exactly the opposite pattern.
In contrast to the strong evidence for limiting similarity found in a dune plant
community (Stubbs and Wilson 2004), there is absolutely no evidence suggesting
limiting similarity in these leaf functional traits in this temperate forest. While this
finding is consistent with the overall paucity of evidence for limiting similarity in plant
communities, it is somewhat surprising to find not a single species or size class showing
any reduced overlap with near neighbors.
There was weak support in SLA overlap for habitat filtering, but as only seven of
158 (4.4%) tests showed a pattern departing from random, one could easily attribute these
results to type I error. There was support, beyond that expected from type I error, for
habitat filtering on the LNC trait, particularly within Transect 1, but the pattern was
neither pervasive nor consistent among size classes. Furthermore, the lack of consistency
in the species demonstrating this pattern among transects suggests that the process may
not be pervasive in this tree community. Nonetheless, it is striking that all non-random

119
patterns found are consistent with habitat filtering, suggesting that this may be at least a
weak force at work within the forest (or that it may be occurring more strongly at larger
spatial scales than are tested with this 1.2 ha. study). Nonetheless, this is a process for
which moderately strong support has been found, including at small spatial scales such as
those presented in this study (ie, Cornwell and Ackerly 2006; Weiher and Keddy 1999).
Perhaps most notable is that three species of relatively common understory shrub/small
trees, Kalmia, Rhododendron, and Crataegus all demonstrated this pattern for both traits;
this is perhaps not surprising, given the relatively narrow range of light environments
these species are exposed to throughout their life.
It is surprising that the seemingly strong signal for habitat filtering found in one of
the transects (see fig. 1) when species presence-absence data were used is not borne out
in either the aggregated or species-level individual-driven analyses. It is likely that the
individual-based approach provides a more thorough picture of the actual interactions at a
community level than does a simple presence-absence matrix.
Overall, the high level of trait overlap, and the lack of a spatial signal in these leaf
traits suggests a relatively random assembly process for forests at these spatial scales.
The lack of spatial signal in most species’ SLA overlaps is likely driven by the
extraordinary variability of these traits in nature. Indeed, mean SLA overlaps among all
species at the site were estimated at 0.482 (See chapter 4). While species means are
subtly different from one another, these differences are often swamped by intraspecific
variability, suggesting that trees function best as generalists. Given the wide range of
light levels to which a given individual of a canopy tree is likely exposed over its
lifetime, this strategy of high plasticity is not particularly surprising.

120
Literature Cited
Ackerly D.D. (2003) Community assembly, niche conservatism, and adaptive evolution in changing environments. International Journal of Plant Sciences, 164, S165-S184
Ackerly, D.D. 1999. Comparative plant ecology and the role of phylogenetic information. In: Press, M., Scholes, J.D., & Barker, M.G., eds., Physiological Plant Ecology, pp. 391-413. Blackwell Scientific, Oxford, UK.
Ackerly, D.D. and W.K. Cornwell. 2007. A trait-based approach to community assembly: partitioning of species trait values into within- and among-community components. Ecology Letters 10: 135-145.
Ackerly, D.D. & Donoghue, M.J. 1998. Leaf size, sapling allometry and Corner’s rules: a phylogenetic study of correlated evolution in maples (Acer). American Naturalist 152: 767-791.
Ackerly, D.D., C.A. Knight, S.B. Weiss, K. Barton, and K.P. Starmer. 2002. Leaf size, specific leaf area and microhabitat distribution of chaparral woody plants: contrasting patterns in species level and community level analyses. Oecologia 130: 449-457.
Ahumada, J., S. P. Hubbell, R. B. Foster, and R. Condit. 2004. Long-term tree survival in a neotropical forest: The influence of local biotic neighborhood In: In E. Losos, E. G. Leigh, Jr., and R. Condit, eds. Forest Diversity and Dynamism: Findings from a Network of Large-Scale Tropical Forest Plots. University of Chicago Press, Chicago, IL.
Bragg, J.G. & Westoby, M. 2002. Leaf size and foraging for light in a sclerophyll woodland. Journal of Ecology 16: 633-639.
Cavender-Bares, J., D. D. Ackerly, D. A. Baum and F. A. Bazzaz. 2004a. Phylogenetic overdispersion in Floridian oak communities. The American Naturalist 163(6): 823-843.
Cavender-Bares, J., K. Kitajima and F. A. Bazzaz. 2004b. Multiple trait associations in relation to habitat differentiation among 17 Floridian oak species. Ecological Monographs 74(4): 635-662.
Chapin, F.S., III. 2003. Effects of plant traits on ecosystem and regional processes: A conceptual framework for predicting the consequences of global change. Annals of Botany 91:455-463.
Cody, M.L. 1986. Structural niches in plant communities. In: Diamond, J. & Case, T.J. Community Ecology. Harper and Row, New York, NY, pp. 381-405.
Cornelissen, J.H.C., Lavorel, S., Garnier, E., Diaz, S., Buchmann, N., Gurvich, D.E., Reich, P.B., ter Steege, H., Morgan, H.D., van der Heijden, M.G.A., Pausas, J.G., & Poorter, H. A handbook of protocols for standardized and easy measurement of plant functional traits worldwide. Australian Journal of Botany 51: 335-380.
Cornwell, W.K., D.W. Schwilk, and D.D. Ackerly. 2006. A trait-based test for habitat filtering: convex hull volume. Ecology 87: 1465-1471.
Davies, S. J. 2001. Tree mortality and growth in 11 sympatric Macaranga species in Borneo. Ecology 82(4): 920-932.
Davies, S. J. 1998. Photosynthesis of nine pioneer Macaranga species from Borneo in relation to life history. Ecology 79(7): 2292-2308.

121
Denslow, J. 1980. Gap partitioning among tropical rain forest trees. Biotropica (Suppl.) 12: 47-55.
Diaz, S., et al. 2004. The plant traits that drive ecosystems: Evidence from three continents. Journal of Vegetation Science 15: 295-304.
Diaz, S. & M. Cabido. 1997. Plant functional types and ecosystem function in relation to global change. Journal of Vegetation Science 8: 463-474.
Diamond, J. & Case, T.J. 1986. Community Ecology. Harper and Row, New York, NY. Duarte, C.M., et al. 1995. Comparative functional plant ecology: Rationale and
potentials. Trends in Ecology and Evolution 10: 418-421. Elton, C. 1927. Animal Ecology. Sidgwick and Jackson, London, England. Gause, G. F. 1934. The struggle for existence. Williams & Wilkins. Baltimore, MD. Grinnell, J. 1914. An account of the mammals and birds of the Lower Colorado Valley
with especial reference to the distributional problems presented. University of Colorado Publication in Zoology 12: 51-294.
Grinnell, J. 1917. The niche-relationships of the California thrasher. The Auk 34: 427-433.
Halloy, S.R.P. & Mark, A.F. 1996. Comparative leaf morphology spectra of plant communities in New Zealand, the Andes, and the European Alps. Journal of the Royal Society of New Zealand 26: 41-78.
Holscher, D., Leuschner, C., Bohman, K., Juhrbandt, J., & Tjitrosemito, S. 2004. Photosynthetic characteristics in relation to leaf traits in eight co-existing pioneer tree species in Central Sulawesi, Indonesia. Journal of Tropical Ecology 20: 157-164.
Hubbell, S.P. 2006. Neutral theory and the evolution of ecological equivalence. Ecology 87: 1387-1398.
Hubbell, S. P. 2001. The Unified Neutral Theory of Biodiversity and Biogeography. Princeton University Press, Princeton.
Hubbell, S.P., Ahumada, J.A., Condit, R. & Foster, R.B. 2001. Local neighbourhood effects on long-term survival of individual trees in a neotropical forest. Ecological Research, 16, 859–875.
Hubbell, S. P., R. B. Foster, S. T. O'Brien, K. E. Harms, R. Condit, B. Wechlser, S. J. Wright, and S. Loo de Lau. 1999. Light-gap disturbances, recruitment limitation, and tree diversity in a Neotropical forest. Science 283: 554-557.
Hubbell, S.P. & Foster, R.B. 1986. Biology, chance, and history and the structure of tropical train forest tree communities. pp. 314-329. In: Diamond, J. & Case, T.J. Community Ecology. Harper and Row, New York, NY.
Hurtt, G.C. & Pacala, S.W. 1995. The consequences of recruitment limitation: Reconciling chance, history, and competitive differences between plants. Journal of Theoretical Biology 176: 1-12.
Hutchinson, G.E. 1957. Concluding remarks. Population Studies: Animal Ecology and Demography. Cold Springs Harbors Symposia on Quantitative Biology 22: 415-422.
Hutchinson, G.E. 1959. Homage to Santa Rosalia; or, why are there so many kinds of animals? The American Naturalist 93: 145-159.

122
Kappelle, M, & M. Leal. 1996. Changes in leaf morphology and foliar nutrient status along successional gradient in a Costa Rica Upper Montane Quercus forest. Biotropica 28: 331-344.
Laurance, W.F. et al. 2006. Rapid decay of tree-community composition in Amazonian forest fragments. Proc. National Academy of Science 103: 19010-19014.
Lavorel, S. & E. Garnier. 2002. Predicting changes in community composition and ecosystem functioning from plant traits: revisiting the Holy Grail.Functional Ecology 16: 545–556.
Lusk, C.H. 2002. Leaf area accumulation helps juvenile evergreen trees tolerate shade in a temperate rainforest. Oecologia 132: 188-196.
MacArthur, R.H. & Levins, R. 1967. The limiting similarity, convergence and divergence of coexisting species. American Naturalist 101: 377-385.
McGill B.J., Enquist B.J., Weiher E. & Westoby M. 2006. Rebuilding community ecology from functional traits. Trends in Ecology & Evolution, 21, 178-185.
Mouillot, D. et al. 2005. Niche overlap estimates based on quantitative functional traits: a new family of non-parametric indices. Oecologia 145: 345–353.
Niinemets, U, & K. Kull. 1994. Leaf weight per area and leaf size of 85 Estonian woody species in relation to shade tolerance and light availability. Forest Ecology and Management 70: 1-10.
Orians, G.H. 1982. The influence of tree-falls in tree species richness. Tropical Ecology 23: 255-279.
Poorter, L. & F. Bongers. 2006. Leaf traits are good predictors of plant performance across 53 rain forest species. Ecology 87: 1733-1743.
Reich, P. B., D. S. Ellsworth, M. B. Walters, J. Vose, C. Gresham, J. Volin and W. Bowman. 1999. Generality of leaf traits relationships: a test across six biomes. Ecology 80:1955-1969.
Reich, P.B., Walters, M.B., & Ellsworth, D.S. 1997. From tropics to tundra: Global convergence in plant functioning. Proceedings of the National Academy of Sciences USA 94: 13730-13734.
Reich, P.B., Wright, I.J., Cavender-Bares, J., Craine, J.M., Oleksyn, J., Westoby, M., & Walters, M.B. 2003. The evolution of plant functional variation: Traits, spectra, and strategies. International Journal of Plant Science 164: S143-S164.
Ricklefs, R.E. 1977. Environmental heterogeneity and plant species diversity: a hypothesis. American Naturalist 978: 376-381.
Rozendaal, D.M.A, V.H. Hurtado, & L. Poorter. 2006. Plasticity in leaf traits of 38 tropical tree species in response to light; reslationships with light demand and adult stature. Functional Ecology 20: 207-216.
Sack, L., P.J. Melcher, WH Liu, E. Middleton, T. Pardee. 2006. How strong is intracanopy leaf plasticity in temperate deciduous trees? American Journal of Botany 93: 829-839.
Schneider, J.V., Zipp, D., Gaviria, J., & Zizka, G. 2003. Successional and mature stands in an upper Andean rain forest transect of Venezuela: do leaf characteristics of woody species differ? Journal of Tropical Ecology 19: 251-259.
Schwilk, D.W. & D.D. Ackerly. 2005. Limiting similarity and functional diversity along environmental gradients. Ecology Letters 8: 272-281.

123
Shipley, B., D. Vile, & E. Garnier. 2006. From plant traits to plant communities: a statistical mechanistic approach to biodiversity. Science 314: 812-814.
Sterck, F.J., Poorter, L. & F. Schieving 2006. Leaf traits determine the growth-survival trade-off across rain forest tree species. The American Naturalist, 167:758-765.
Sterner, R. W. and J.J. Elser. 2002. Ecological Stoichiometry: The Biology of Elements from Molecules to the Biosphere. Princeton University Press, Princeton, NJ.
Stubbs W. & Wilson J.B. 2004. Evidence for limiting similarity in a sand dune community. Journal of Ecology, 92, 557-567.
Talbert, C.M. & A.E. Holch. 1957. A study of the lobing of sun and shade leaves. Ecology 38: 655-658.
Tilman, D. 2004. Niche tradeoffs, neutrality, and community structure: A stochastic theory of resource competition, invasion, and community assembly. Proceedings of the National Academy of Sciences 101:10854-10861.
Tilman, D. 1982. Resource Competition and Community Structure. Princeton University Press, Princeton, NJ.
Valladares, F., Wright, S.J., Lasso, E., Kitajima, K., & Pearcy, R.W. 2000. Plastic phenotypic response to light of 16 congeneric shrubs from a Panamanian rainforest. Ecology 81: 1925-1936.
Van Valen, L. 1965. Morphological variation and the width of ecological niche. The American Naturalist 99: 377-390.
Weiher, E., Clarke, G., & Keddy, P. 1998. Community assembly rules, morphological dispersion, and the co-existence of plant species. Oikos 81: 309-322.
Weiher, E., & Keddy, P., eds. 1999. Ecological Assembly Rules: Perspectives, Advances, Retreats. Cambridge University Press, Cambridge, UK.
Weiher, E. & Keddy, P. 1995. The assembly of experimental wetland plant communities. Oikos73: 323-335.
Westoby, M, et al. 2002. Plant Ecological Strategies: Some leading dimensions of variation between species. Ann. Rev. Ecol. Syst. 33: 125-159.
Wills, C. et al. 2006. Nonrandom processes maintain diversity in tropical forests. Science 311:527-531.
Wilson, J.B. 1999. Assembly rules in plant communities. In: Weiher, E., & Keddy, P., eds. Ecological Assembly Rules: Perspectives, Advances, Retreats. Cambridge University Press, Cambridge, UK.
Wright, I. J. et al. 2004. The worldwide leaf economics spectrum. Nature 428: 821–827. Wright, S. J. 2002. Plant diversity in tropical forests: a review of mechanisms of species
coexistence. Oecologia 130: 1-14. Wright, S. J., H. C. Muller-Landau, R. Condit, and S. P. Hubbell. 2003. Gap-dependent
recruitment, realized vital rates, and size distributions of tropical trees. Ecology 84: 3174- 3185.
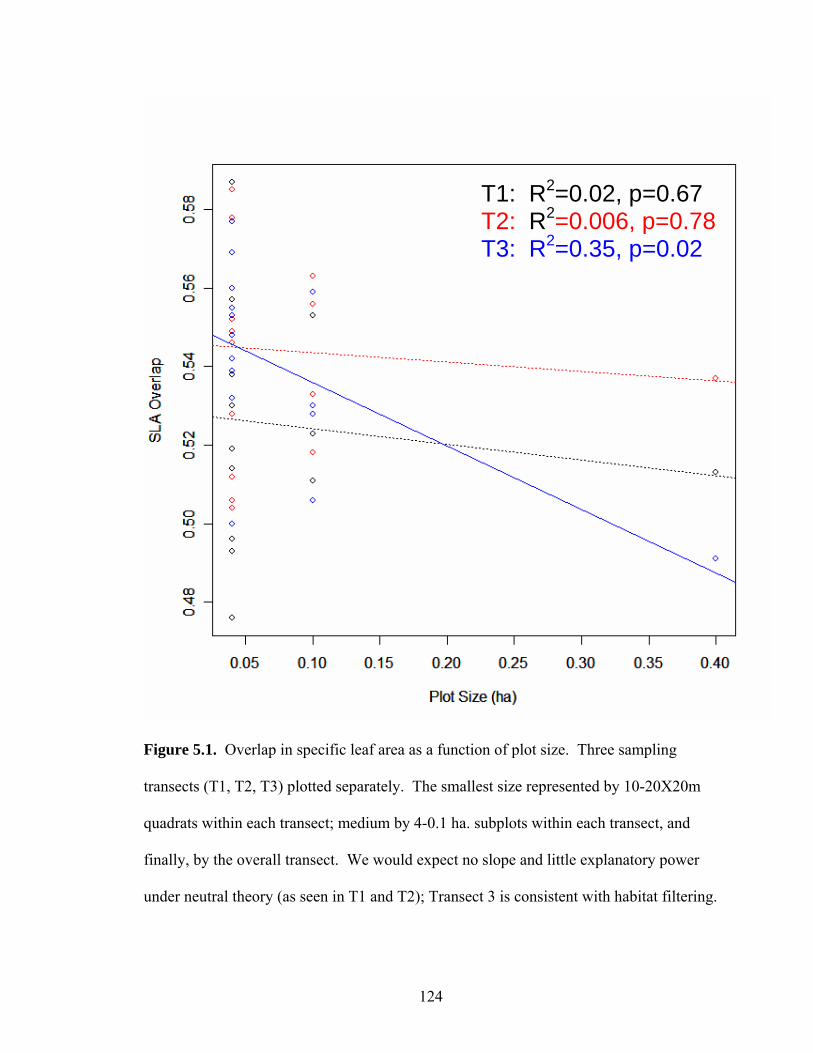
124
Figure 5.1. Overlap in specific leaf area as a function of plot size. Three sampling
transects (T1, T2, T3) plotted separately. The smallest size represented by 10-20X20m
quadrats within each transect; medium by 4-0.1 ha. subplots within each transect, and
finally, by the overall transect. We would expect no slope and little explanatory power
under neutral theory (as seen in T1 and T2); Transect 3 is consistent with habitat filtering.
T1: R2=0.02, p=0.67 T2: R2=0.006, p=0.78T3: R2=0.35, p=0.02

125
Figure 5.2. Pairwise overlap in specific leaf area (SLA) for all species pooled as a
function of distance within transect 3. Data in red, black lines represent minimum and
maximum values from 100 randomization tests.

126

127
Figure 5.3. Spatial distribution of pairwise overlap in specific leaf area (SLA) for
selected individual species, size classes, and individual transects. These seven plots
reflect some of the most abundant species at Thompson Mills. Data in red, black lines
represent minimum and maximum values from 100 randomization tests.

128

129
Figure 5.4. Spatial distribution of pairwise overlap in specific leaf area (SLA) for
additional selected individual species, size classes, and individual transects. These eight
plots reflect the only plots for which any non-random patterns were found. Data in red,
black lines represent minimum and maximum values from 100 randomization tests.

130

131
Figure 5.5. Spatial distribution of pairwise overlap in leaf nitrogen content (LNC) for selected individual species, size classes, and individual transects. These plots represent three common tree species and two shrub species from the site. Data in red, black lines represent minimum and maximum values from 100 randomization tests

132
CHAPTER 6
CAN THE DISTRIBUTION OFPLANT FUNCTIONAL TRAITS HELP EXPLAIN
LATITUDINAL GRADIENTS IN SPECIES DIVERSITY?1
1Lake, J.K. & S.P. Hubbell. To be submitted to Ecology Letters.

133
Abstract
One of the great ongoing questions in community ecology is the latitudinal
gradient in species diversity. While numerous authors have proposed literally hundreds
of mechanisms that could drive existing patterns, few have rigorously tested potential
mechanisms driving this pattern. We use plant functional traits to test two competing
ideas used to explain the coexistence of so many species in tropical forests: 1. classical
fine niche partitioning of light environment and gap space, and 2. increasing ecological
equivalence in a shared generalist, shade-tolerant strategy. While initial findings of trait
overlap suggest narrower niches and less trait overlap in tropical forests, when addressing
smaller sample sizes from the tropical forest, we found little difference in niche/trait
breadth between species in the two forests, suggesting little difference in the forces
structuring leaf traits in forests with nearly an order of magnitude difference in species
diversity.

134
Introduction
One of the most contentious, unresolved issues in understanding patterns of
biodiversity is the strong latitudinal gradient in species diversity (Wills et al. 2006;
Wright 2002; Pianka 1966). Although the current theoretical framework for the debate
shifts over time, the fundamental questions still remains – how do so many species in
tropical forests make their living and coexist? How is it that in species-rich tropical tree
communities, hundreds of species can co-exist, while temperate forests only have at most
a few dozen species of woody plants?
Central to classical theory in community ecology is the idea that coexistence
requires species to exploit limiting resources differently from one another (Grinnell 1914
and 1917; Elton 1927; Hutchinson 1957, 1959; MacArthur and Levins 1967; Tilman
1982). Classical niche theory argues that as the number of species in a community
increases, either the total niche volume for the community must be larger, or else niches
must become narrower to allow for coexistence of additional species. Because of the
extraordinarily high species diversity in the tropics, ecologists have long argued that
these species must be finely partitioning niche space (ie, Dobzhansky 1950).
Specifically, fine partitioning of light and a greater range of light intensities in the tropics
could help explain the higher tree diversity in tropical forests (e.g., Ricklefs 1977;
Denslow 1980; Orians 1982). Behind these hypotheses is the argument that species can
finely partition varying light levels, largely created by the formation of gaps of various
sizes, and the resulting gradient of light from center to gap edge, and into standing forest.
However, this approach also depends upon strong and continual dispersal so that

135
propagules of a given species is in the “ideal” site at or very near the time of gap
formation.
However, dispersal and recruitment limitation, meaning that species fail to
disperse to or recruit in all sites favorable to their survival and growth, may limit the
ability of species to finely partition niche space. Hubbell et al. (1999) found strong
dispersal and recruitment limitation in a tree community in Panama, which they argued
extensively delays competitive exclusion. In addition to a potentially strong role for
dispersal limitation in preventing competitive exclusion, Hubbell and Foster (1986) argue
that selection on trait character displacement may be extremely weak in species-rich
communities because pairwise encounter rates between any two species are so low. This
hypothesis would predict opposite results from those of niche theory—namely, greater
phenotypic divergence in a relatively species-poor temperate forest than in a species-rich
tropical forest.
Surprisingly, in spite of these richly testable predictions, there have not been any
attempts to our knowledge to test these conflicting hypotheses along a latitudinal
gradient. Within the context of this research, we focus on leaf functional traits because of
their demonstrated role in photosynthetic carbon fixation and their fundamental
relationship to shade tolerance/intolerance (Poorter and Bongers 2006; Wright et al
2004). Since most of the predictions for fine scale partitioning of resources in tropical
forests centers around light levels and partitioning of gaps, these traits should show the
strongest interspecific variability related to shade tolerance. Here, we ask the question of
whether trait breadth and overlap is more, less, or comparable between species-rich
tropical forests and relatively species-poor temperate systems.

136
Materials and Methods
Traits
Specifically, we have chosen five leaf traits upon which to focus. Specific leaf
area (SLA, measured in cm2/g) is one of the strongest measures of a plants
photosynthetic investment, and is a strong correlate of mass-based maximum
photosynthetic rates (Amax). Low values tend to be associated with longer leaf lifespans,
nutrient limited environments, and high defensive investment (Reich et al. 2003; Reich et al
1997). Across several species of tropical trees, Poorter and Bongers (2006) have also shown
that the SLA is positively related to whole-plant growth and negatively to survival,
suggesting low investment in high turn-over, metabolically fast leaves in short-lived sun
demanding plants. Leaf size, the area of leaf lamina or leaflets, excluding petiole or rachis, is
a measure of actual photosynthetic surface, and is important to both water and energy balance
(Cornelissen et al 2003). Leaf Nitrogen Content (LNC) is highly correlated to mass-based
maximum photosynthetic rates (Amax). It provides insights into nutrient use and availability,
and is correlated to leaf lifespan (Reich et al., 1997). Nmass has been shown to correlate
positively with growth, while Narea correlates with survival (Poorter and Bongers 2006).
Carbon: Nitrogen ratios (C:N Ratio) are indirectly tied to plant defense strategies. Higher
C:N ratios suggest a lack of nitrogen in the leaves, and the excess carbon is often invested in
high carbon phenolic compounds for defense against herbivory (Sterner and Elser 2002).
Finally, two leaf morphological traits, while less well understood ecologically, appear related
to sun exposure and overall energy balance. Perimeter2:Area ratio provides a good measure
of lobing, in essence providing the degree to which a leaf blade’s shape diverges from a
circle. Leaf Shape Index (LSI), or the ratio of leaf length to width, provides another metric of
a leaf’s shape.

137
Site description: Temperate site
Thompson Mills Forest is a 135-ha. reserve located near Braselton, Georgia, in
Jackson County, about 40 miles northeast of Atlanta in the Piedmont (34°7′39 N,
83°48′6 W) . The site is composed of late-secondary oak-hickory forest, dominated by
Quercus sp., Carya sp., Liriodendron tulipifera, and Fagus grandifolia. Average annual
rainfall in this area is estimated at 141.7 cm, mean annual temperature is 15.6 C (Georgia
Automated Environmental Monitoring Network, Gainesville, GA). Three 20x200m
sampling transects were established. The first runs along a northwest facing slope
overlooking the Mulberry River; the second, along a southfacing slope overlooking Lee
Creek; the third perpendicular to Lee Creek at a point upstream from the second, rising
along a gentle southeast facing slope. All are located in late-secondary forest areas with
very limited or no recent human-based disturbance.
Site Description: Tropical Site
Barro Colorado Island (BCI), Panama, is a 1600-ha. island in the Panama Canal
composed of a seasonally moist tropical forest. A 50-ha Forest Dynamics Plot (FDP) is
located within BCI. The FDP was established in 1980 by Hubbell and Foster (1983). All
trees and shrubs within the plot over 1 cm dbh were tagged, mapped, measured, and
identified between 1982 and 1983 (Hubbell and Foster 1983, Condit 1998). The plot has
subsequently been recensused every five years through 2005. During the censuses, a
total of 316 species have been identified, encompassing about 229,000 stems.
Sampling Methods – Temperate Forest
Within each transect, all stems >1 cm diameter at breast height (dbh, 1.4 m above
ground) were mapped, identified, and dbh was measured. Based on dbh and light

138
availability, specimens were classified as adults or saplings, with cut-off size dependent
on the species. For all tree species (canopy and understory), up to a total of 24 specimens
(12 adults, 12 saplings), as evenly spread as possible among and within transects, were
selected for leaf sampling. In adults, three branchlets each from the sunniest position,
and a strongly shaded position were collected and placed in water. Specimens were
returned to the lab and rehydrated overnight. A total of six leaves from each canopy
position were selected for analysis, attempting to select two from each of the branchlets
whenever possible. While size was not a factor in determining leaves sampled, we did
select the most recently unfolded, fully hardened leaves with the least amount of
herbivory and epiphylls possible. Leaves were scanned on an Epson 1680 flatbed
scanner, and analyzed using WinFOLIA 2005b Software (CITE). Subsequently, leaves
were dried at 60C for at least 72 hours, then weighed on a Mettler balance.
Sampling Methods – Tropical Forest
Within the BCI Forest Dynamics Project Plot, specimens were sampled from a
range of 90 tree species, with 8-12 leaves sampled per individual, and, on average 2-3
individuals sampled per species. One species of understory tree, Faramea occidentalis,
was sampled more intensively, including testing specimens in sun and shade
environments. Leaves were collected, pressed, and dried in the field, and scanned dry
using an Epson 1680 flatbed scanner, and analyzed using WinFOLIA 2005b Software.
While there is shrinkage of leaves during the drying process, there is no expectation of
disproportionate shrinkage (ie, that would substantially alter trait measurements), and
Ackerly (2002) showed that there is typically no significant difference in ultimate trait
values, whether using fresh or dried material for these analyses. Furthermore, because

139
we consistently used a wet or dry technique within a given community and are comparing
traits only within those given communities, we further reduce any risk of confounding
results by mixing fresh and dry material.
Trait Analysis
WinFOLIA automatically collects data on leaf area, perimeter, length and width,
all used in subsequent analyses, usually as compound measures. Morphological traits
were analyzed from scanned images using WinFOLIA software (leaf size), or from
compounding data collected (P2A, Leaf Shape Index, SLA).
Statistical analyses
For each species and trait, a trait distribution was calculated using a kernel
estimator (see Mouillot et al. 2005). This method, which allows us to work with
continuous data without assuming a normal distribution of data, calculates a density
function by assuming measurement error around each data point, and then using a
smoothing function to estimate a distribution of all data for a given trait and population.
These species (or population) kernels are then used to estimate pairwise overlaps in trait
space of coexisting species. Overlap is simply represented as the integral of the area
under the species’ respective kernel curves when overlaid on one another. From these
pairwise overlaps, a community-wide overlap index is then calculated, simply by
averaging these overlaps.
To determine the impact of sample size on trait breadth, log trait standard deviation
was plotted vs. log sample size to get a sense of intraspecific variability. While each point
represents the actual sample size of a species and its respective trait variance, thus masking
any actual interspecific variability in trait breadth, it does provide a good sense of when

140
enough samples have been collected to reach a relatively good estimate of niche or trait
breadth.
Results and Discussion
At first blush, the tropical forest community shows substantially lower
interspecific community trait overlap than does the temperate forest for most traits (see
table 1). These lower values would be strongly consistent with the idea of niche packing
in tropical forest systems. The exception to this trend are the true leaf morphological
metrics (p2a ratio and LSI), which show moderately higher overlap in the tropical forest.
Given the lower overall variability in leaf shape in tropical forest trees (e.g., Janzen 1975)
due to few species with lobed leaves or marginal teeth, that the overlap would be higher
in tropical tree communities is hardly surprising. The fact that these overlaps are not
substantially higher is, in fact, the surprising result here.
However, because our sampling scheme was part of a pilot study, we therefore
sampled relatively few leaves and individuals of most species in the tropical forest,
providing a perhaps weak sample of the species. While our collection numbers were
generally in line with sample sizes recommended by Cornellisen et al (2003), it appears
that our sampling may not have adequately captured intraspecific variance in the traits
sampled (see fig. 1). Indeed, the plots of trait variation (standard deviation) and sample
size for the temperate and tropical forest seem to lie virtually on top of one another,
suggesting our results are likely the result of low sample size.
While our data is currently insufficient to definitively answer the question of
niche packing vs. ecological equivalence in more species-rich tropical systems, the
astounding similarity of the two curves suggests there may be little difference in niche

141
breadth for species in temperate vs. tropical forests. If this similarity holds with more
complete datasets, it would suggest that similar processes may be structuring both
species-rich and species poor forests across the latitudinal gradient. Such a conclusion
would suggest that neither strong specialization on specific parts of a light gradient
through niche packing, nor increasing ecological equivalence through diffuse selective
pressure in species-rich tropical systems are driving the latitudinal gradient in species
diversity.
Fortunately, we should soon be able to better address the above questions. With a
more complete field season in Panama, combined with the completion of analysis of two
small plots in Belize (with approximately 80 and 95 species), we will have adequate
sample sizes and a broader range of communities and species diversity levels to more
rigorously address the central questions posed here.

142
Literature Cited Condit, R., 1998. Tropical Forest Census Plots. Springer-Verlag, Berlin, Germany. Cornelissen J.H.C., Lavorel S., Garnier E., Diaz S., Buchmann N., Gurvich D.E., Reich
P.B., Steege H.t., Morgan H.D., Heijden M.G.A.v.d., Pausas J.G. & Poorter H. (2003) A handbook of protocols for standardised and easy measurement of plant functional traits worldwide. Australian Journal of Botany, 51, 335-380
Denslow J.S. (1987) Tropical rainforest gaps and tree species diversity. Annual Review of Ecology and Systematics, 18, 431-451
Denslow, J. 1980. Gap partitioning among tropical rain forest trees. Biotropica (Suppl.) 12: 47-55.
Diamond, J. & Case, T.J. 1986. Community Ecology. Harper and Row, New York, NY. Dobzhansky, T., 1950, Evolution in the Tropics: American Scientist, v. 38, p. 208-221. Elton, C. 1927. Animal Ecology. Sidgwick and Jackson, London, England. Grinnell, J. 1914. An account of the mammals and birds of the Lower Colorado Valley
with especial reference to the distributional problems presented. University of Colorado Publication in Zoology 12: 51-294.
Grinnell, J. 1917. The niche-relationships of the California thrasher. The Auk 34: 427-433.
Hubbell, S. P., R. B. Foster, S. T. O'Brien, K. E. Harms, R. Condit, B. Wechlser, S. J. Wright, and S. Loo de Lau. 1999. Light-gap disturbances, recruitment limitation, and tree diversity in a Neotropical forest. Science 283: 554-557.
Hubbell, S.P. & Foster, R.B. 1986. Biology, chance, and history and the structure of tropical train forest tree communities. pp. 314-329. In: Diamond, J. & Case, T.J. Community Ecology. Harper and Row, New York, NY.
Hubbell S.P. & Foster R.B. (1983) Diversity of canopy trees in a neotropical forest and implications for conservation. In: Tropical Rain Forest: Ecology and Management (eds. Sutton SJ, Whitmore TC & Chadwick AC), pp. 25-41. Blackwell, Oxford
Hubbell S.P. & Foster R.B. (1986) Canopy gaps and the dynamics of a neotropical forest. In: Plant Ecology (ed. Crawley MJ), pp. 77-95. Blackwell Scientific, Oxford
Hutchinson, G.E. 1957. Concluding remarks. Population Studies: Animal Ecology and Demography. Cold Springs Harbors Symposia on Quantitative Biology 22: 415-422.
Hutchinson, G.E. 1959. Homage to Santa Rosalia; or, why are there so many kinds of animals? The American Naturalist 93: 145-159.
MacArthur, R.H. 1958. Population ecology of some warblers of northeastern coniferous forests. Ecology 39: 599-619.
MacArthur, R.H. & Levins, R. 1967. The limiting similarity, convergence and divergence of coexisting species. American Naturalist 101: 377-385.
Mouillot D., Stubbs W., Faure M., Dumay O., Tomasini J.A., Wilson J.B. & Chi T.D. (2005) Niche overlap estimates based on quantitative functional traits: a new family of non-parametric indices. Oecologia, 145, 345-353
Orians, G.H. 1982. The influence of tree-falls in tree species richness. Tropical Ecology 23: 255-279.

143
Pianka E.R. (1966) Latitudinal gradients in species diversity: a review of concepts. The American Naturalist, 100, 33-45
Poorter L. & Bongers F. (2006) Leaf traits are good predictors of plant performance across 53 rain forest species. Ecology, 87, 1733-1743
Reich P.B., Walters M.B. & Ellsworth D.S. (1997) From tropics to tundra: global convergence in plant functioning. Proceedings of the National Academy of Sciences of the United States of America, 94, 13730-13734
Reich P.B., Wright I.J., Cavender-Bares J., Craine J.M., Oleksyn J., Westoby M. & Walters M.B. (2003) The evolution of plant functional variation: Traits, spectra, and strategies. International Journal of Plant Sciences, 164, S143-S164
Ricklefs R.E. (1976) Environmental heterogeneity and plant species diversity: a hypothesis. The American Naturalist, 376-381
Tilman, D. 1982. Resource Competition and Community Structure. Princeton University Press, Princeton, NJ.
Wills, C. et al. 2006. Nonrandom processes maintain diversity in tropical forests. Science 311:527-531.
Wright I.J., Reich P.B., Westoby M., Ackerly D.D., Baruch Z., Bongers F., Cavender-Bares J., Chapin T., Cornelissen J.H.C., Diemer M., Flexas J., Garnier E., Groom P.K., Gulias J., Hikosaka K., Lamont B.B., Lee T., Lee W., Lusk C., Midgley J.J., Navas M.L., Niinemets U., Oleksyn J., Osada N., Poorter H., Poot P., Prior L., Pyankov V.I., Roumet C., Thomas S.C., Tjoelker M.G., Veneklaas E.J. & Villar R. (2004) The worldwide leaf economics spectrum. Nature, 428, 821-827
Wright S.J. (2002) Plant diversity in tropical forests: a review of mechanisms of species coexistence. Oecologia, 130, 1-14

144
Table 6.1. Mean interspecific trait overlap for tree communities in a temperate forest in
Georgia and tropical forest in Panama, based on preliminary data.
Group #Spp SLA Overlap Leaf Area
Overlap
p2a Ratio
Overlap
LSI Overlap
Thompson Mills,
GA
42 0.482 0.456 0.443 0.371
Barro Colorado
Island, Panama
90 0.301 0.370 0.493 0.416
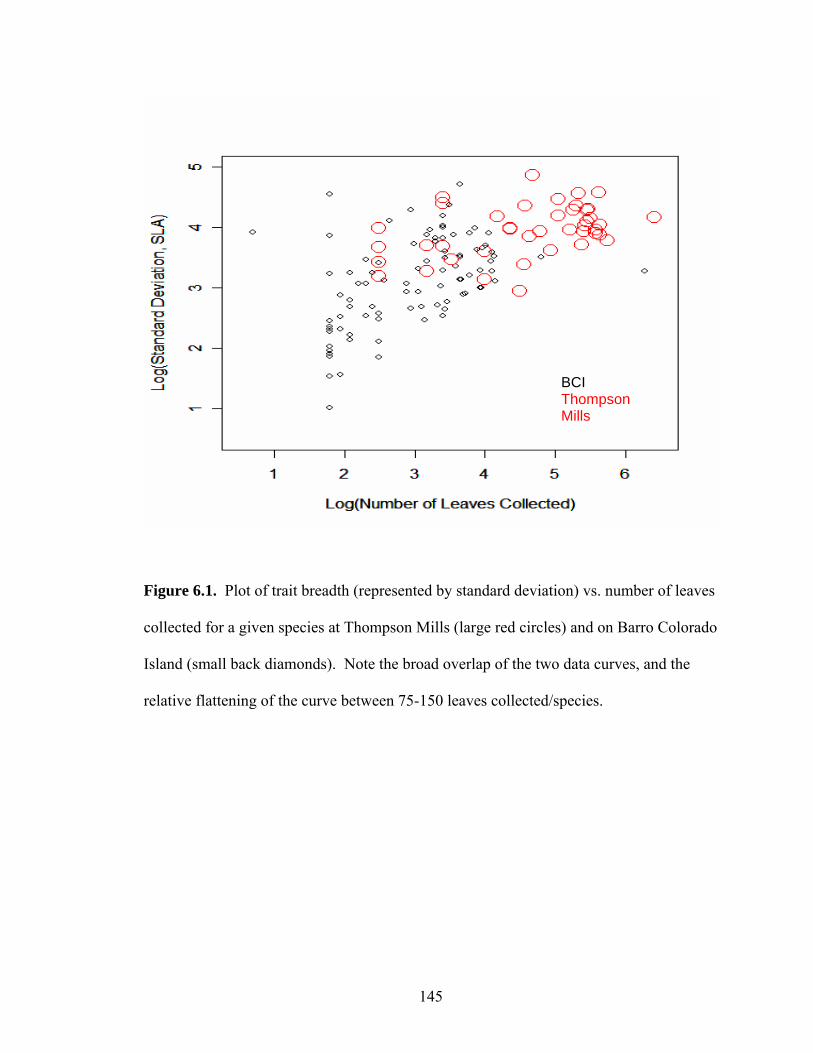
145
Figure 6.1. Plot of trait breadth (represented by standard deviation) vs. number of leaves
collected for a given species at Thompson Mills (large red circles) and on Barro Colorado
Island (small back diamonds). Note the broad overlap of the two data curves, and the
relative flattening of the curve between 75-150 leaves collected/species.
BCI Thompson Mills

146
CHAPTER 7
CONCLUDING REMARKS

147
In this body of research, we set out to test the role of plant functional traits in
community assembly and structure. Plant functional traits have proven an interesting and
potentially useful approach to niche structure, but we have shown that it will be important
to treat these values carefully, to consider not only mean trait values, but also niche (or
trait) breadth and overlap with other species, as well as among conspecific individuals of
varying sizes and canopy exposure. We set out to answer five specific questions, each of
which we address briefly.
1. Is it appropriate to simply treat species as present or absent in a community
when considering trait overlap and limiting similarity, or can a more complete picture be
developed by considering abundance or other weighting factors?
The appropriate niche metric is directly related to the questions a researcher is
attempting to answer. If the goal is to compare species-level traits of species present in a
given community, perhaps in contrast to excluded species, then it is not important or even
appropriate to weight species for abundance, size, or any other factor. On the other hand,
if a researcher is seeking to determine the way species are actually using the whole of
trait space within a community, a weighted index may be crucially important to
understanding the strength of interspecific interactions.
2. Is it possible for ecological equivalence to evolve within a defined community,
and if so, can equivalent or near equivalent species persist in the long term in such a
community?

148
We have shown that ecological equivalence can evolve easily and often, within
the context of simulated communities, particularly when species are easily able to
experience most or all of trait space—that is, having dispersal that greatly exceeds the
grain of the environment. Coarse-grained environmental heterogeneity, but randomly
distributed species leads to the evolution of multiple, spatially-segregated ecotypes within
each species. Of our simulations, only a dispersal-limited, coarse-grained environment
with species strongly clumped on the landscape led to traditional niche differentiation.
Dispersal limitation, in particular, along with true ecological equivalence, provided the
most consistent, stable long-term coexistence for species within our simulations.
3. How are traits distributed within and among individuals and species in a
temperate tree community?
While we found some of the expected variation among species within a temperate
tree community at Thompson Mills, GA, we also found strong intraspecific variation,
driven in part by plastic response to the light environment. However, much unexplained
intraspecific and intra-individual variation led to broad trait distributions that widely
overlapped with co-occurring species. These results suggest an important role for canopy
position and individual in determining a tree’s functional trait spectrum, in addition to its
species identity. Indeed, we report perhaps some of the highest niche overlap indices
reported in the literature to date for the leaf functional traits within this community.
4. How are traits distributed spatially among individuals in a temperate tree

149
community, and what can that distribution tell us about the way ecological communities
are assembled and structured?
There is little or no significant spatial structure in leaf functional traits in a
temperate forest community. These results suggest that there is no role for limiting
similarity in structuring these communities, and a weak role for habitat filtering at these
spatial scales. Most observed patterns in trait overlap fell largely within values produced
in randomization tests, suggesting that the broad trait overlaps reported in chapter 4 are
indeed driving a largely random pattern of trait variation in the small spatial scales tested
here.
5. Can the latitudinal gradient in species diversity be explained, at least in part,
by increased specialization in a species-rich tropical forest system?
Our data are too preliminary to draw many conclusions about whether there is
more or less niche differentiation in a highly diverse tropical forest than in a species-poor
temperate community. However, our preliminary data suggest that niche, or trait, breadth
within our more poorly sampled tropical forest may largely be a function of sample size,
suggesting no role for latitude, and thus species diversity, in driving niche breadth. This
contrasts with expectations of many researchers espousing either niche or neutral views
of community assembly.

150
Overall, we have demonstrated a strong role for both equivalence and chance in
driving community assembly, at least within the context of terrestrial forest communities.
We have shown the need to consider not only species mean trait values, but to also look
at actual individual-level variation, driven both by genetics and microhabitat. While
current attempts to predict community assembly from functional traits are woefully
inadequate in capturing this variation, it may be possible to incorporate enough
variability within functional traits to build a more predictive model. Nonetheless, the
generality and value of such models is called into doubt as the number of parameters
begins to increase, calling into question the fundamental goal of predictive trait-based
models of community assembly.

ERRATUM
DISSERTATION: PLANT FUNCTIONAL TRAITS AND COMMUNITY
ASSEMBLY AND STRUCTURE
BY JEFFREY K. LAKE
On pages 78-79, the correlation reported from the literature was incorrect; while
explanatory power was lower in this research than in the literature, the correlation
between LNC and SLA reported is, in both cases, positive.


