
1
Kamal EL KADI ABDERREZZAK
EDF-R&D, Laboratoire National d’Hydraulique et Environnement (LNHE)
PHYSICAL PROPERTIES OF SEDIMENT PARTICLES
17-19 September 2009 | UNL, Santa Fe, Argentina

2
OUTLINE
I. Non-cohesive sediment particles
II. Cohesive sediment particles

3
OUTLINE
I. Non-cohesive sediment particles
II. Cohesive sediment particles

4
SINGLE PARTICLE (1/2)
• Sediment density ρs: ≈ 2,650 kg/m3, assumed to be constant in most rivers
• Particle size and grade scale
• Nominal diameter d: the diameter of a sphere that has the same volume as thegiven particle
• If the sediment particle is considered as an ellipsoid (a, b, and c as its diametersin the longest, the intermediate, and the shortest mutually perpendicular axes, respectively)
• Sieve diameter: the length of the side of a square sieve opening through whichthe given particle will just pass ≈ b
• Fall diameter: the diameter of a sphere that has a specific gravity of 2.65 andhas the same settling velocity as the given particle in quiescent, distilled water ata temperature of 24 °C
3 abcd = a b
c

5
SINGLE PARTICLE (2/2)
• Corey Shape factor: = 0.7 for naturally particles, =1 for spherical ones
• Cohesive particles: d<60 µm
• How to measure the diameter
• For coarse particles (boulders, cobbles, and coarse gravel): direct measurements of the volume or the diameters a, b, and c
• For fine gravel and sand: sieving or visual accumulation tube • For cohesive particle (silt, clay): hydraulic settling methods (pipet method,
hydrometer method)
abcS p /=
Wu (2007)
Cobble
Sand
Gravel
6
SEDIMENT MIXTURE (1/2)
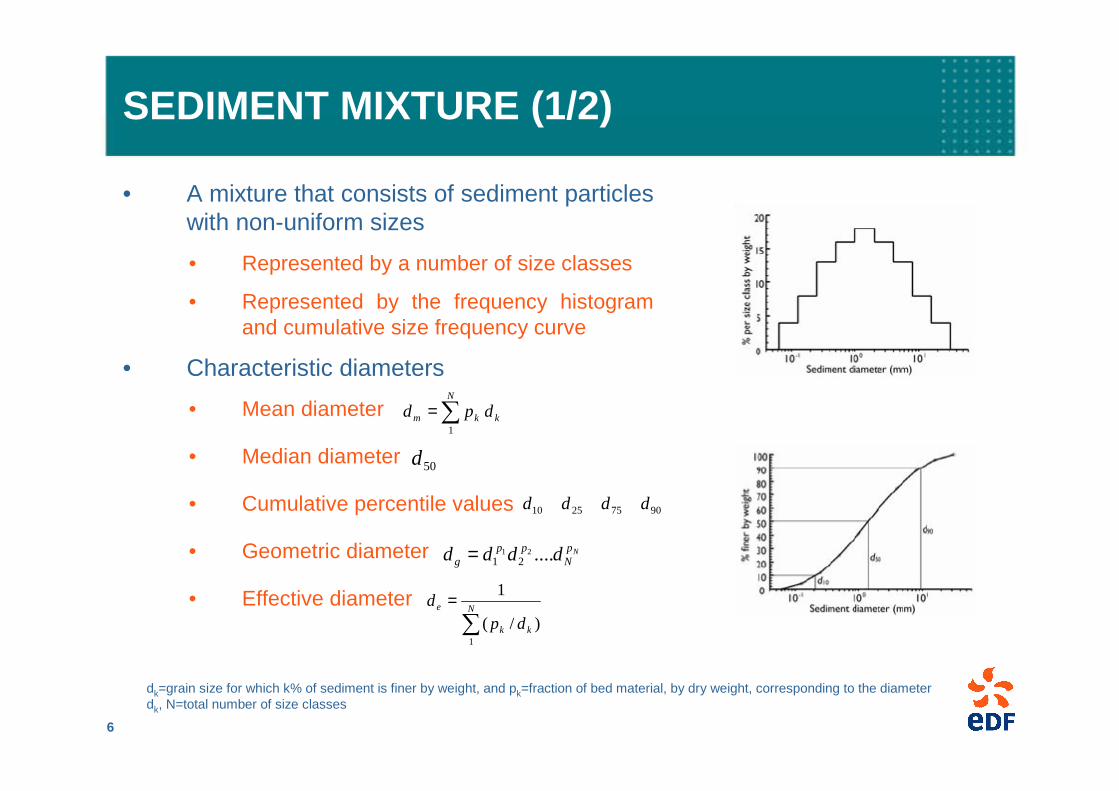
• A mixture that consists of sediment particleswith non-uniform sizes
• Represented by a number of size classes
• Represented by the frequency histogramand cumulative size frequency curve
• Characteristic diameters
• Mean diameter
• Median diameter
• Cumulative percentile values
• Geometric diameter
• Effective diameter
∑=N
kkm dpd1
50d
∑=
N
kk
e
dpd
1
)/(
1
NpN
ppg dddd ....21
21=
dk=grain size for which k% of sediment is finer by weight, and pk=fraction of bed material, by dry weight, corresponding to the diameter dk, N=total number of size classes
90752510 dddd

7
SEDIMENT MIXTURE (2/2)
• Uniformity
• A smaller value of σ (or Gr) corresponds to a uniform sediment mixture
• Porosity: measure of the volume of voids per unit volume of the deposit
• Uniform sediment mixture
• Non-uniform sediment mixture
• Angle of repose
• may range from 30◦ to 42◦ for non-cohesive sediment particles
16
84
d
d=σStandard deviation Gradation coefficient
+=
16
50
50
84
2
1
d
d
d
dGr
( )
≥−−+
<
+−
=
mm
mm
1)/095.0exp(175.03.0
14
525.01
00
3
1
dddd
dd
dp δ
21.050 )1.0(
0864.0245.0
dp +=
d=sediment size in mm; d0= a reference size, set at 1 mm, δ1= thickness of the water film attaching to sediment particles, set 0.0004 mm, φ in degrees
5027.15.32 d+=φ

8
GRAIN SIZE DITRSIBUTION (1/2)
• Why characterize grain size distributions in terms of a logarithmic scale
• Plotted using a linear grain size scale, all the information about the finest grain sizes are crowded off the scale
Grain Size Distribution: Half Sand, Half Gravel0.0625 mm ~ 64 mm, Logarithmic Scale
0
10
20
30
40
50
60
70
80
90
100
0.01 0.1 1 10 100
D mm
Per
cen
t F
iner sand gravel
Grain Size Distribution: Half Sand, Half Gravel0.0625 ~ 64 mm, linear scale
0
10
20
30
40
50
60
70
80
90
100
0 10 20 30 40 50 60 70
D mm
Per
cen
t F
iner
sand
gravel
Parker (2004)
Logarithmic scale for grain size Linear scale for grain size
Parker (2004)

9
GRAIN SIZE DITRSIBUTION (2/2)
• Unimodal distributions
• The function p(d) has a single mode (or peak)
• The grain size distributions of most sand-bed streams are unimodal, and can often be approximated with a Gaussian function
• Bimodal distributions
• The function p(d) has two modes
• The grain size distributions of many gravel-bed river show bimodal grain size distributions (a sand mode and a gravelmode)
Unimodal
Bimodal
Plateau
f denotes the mass fraction of a sample that is finer than size d, p is the probability density of size d

10
GRADISTAT: A GRAIN SIZE DISTRIBUTION TOOL
• GRADISTAT: a free computer programfor grain size distribution of unconsolidated sediments (by Blott(2000))
• Analysis of grain size statistics fromany of the standard measuringtechniques, such as sieving and laser granulometry
• Mean, mode, sorting, skewness andother statistics are calculatedarithmetically, geometrically andlogarithmically using moment and Folk and Ward graphical methods.
• The program runs within Excel
• producing a range of graphical outputs including frequency and ternary plots
• To download:www.kpal.co.uk/gradistat_abstract.htm

11
OUTLINE
I. Non-cohesive sediment particles
II. Cohesive sediment particles

12
GENERAL TRANSPORT PATTERNS
• Cohesive particles: d<60 µm
• Cohesive sediments (clay, mud, fine silt) widely exist in rivers, lakes, reservoirs, estuaries, and coastal waters
• Cohesive sediments may stick together due to the action of electrostaticalforces (flocculation)
• Flocs may be transported by convection, turbulent diffusion, and gravitational settling
• Suspension is usually the main transport mode
• Variations in flow conditions may cause sediment erosion and deposition
• The settled cohesive deposits may consolidate, due to gravity and the overlying water pressure
Wu (2007)Tsai et al. (1987)

13
FLOCCULATION (1/2)
• Flocculation is affected by sediment size, concentration, salinity, turbulence, temperature…
• Sediment size
• Flocculation is negligeable for d>30µm, but becomes stronger as d reduces
• The flocculation factor varies with the median size ofthe dispersed sediment according to (Migniot, 1968)
• Concentration of sediment
• As the sediment concentration increases, the flocsettling velocity increases
• As the sediment concentration increases further, the floc settling velocity decreases
• At very large concentrations, a large number of
• particles form large-scale floc matrices; the flocsettling velocity becomes very small
Migniot (1968)
n
rw
d
dF
=
50
ωsf and ωsd=median settling velocities of flocs and the corresponding dispersed sediment particles, respectivelyn = 1.8, and dr = a reference diameter, about 0.0215 mm
Mehta (1986)

14
FLOCCULATION (2/2)
• Salinity
• When salinity is low, the floc settling velocity increases rapidly as salinity When salinity exceeds a certain value, its influence on flocsettling becomes very slight
• Turbulence intensity
• For low shears, turbulence increases the chance of collision among sediment particles and thus strengthens flocculation
• For high shears, strong turbulence may break apart the flocs and attentuate flocculation
• Formulas of floc settling velocity
(Chien and Wan, 1983)
4/150
3/14/36/118.0 dCCsasf−= ςβω
2/1
20
80
= d
dς 2/15014.01 −+= dβ
Csa is the salinity

15
DEPOSITION AND EROSION
• Deposition rate: Krone (1962) and Mehta and Partheniades (1975) proposed formulas to determine the deposition rate
τ=shear stress, τmin=critical bed shear stress below which all sediment particles have a full probability to deposit on the bed, τmax=critical bed shear stress above which all sediment particles remain in suspension
• According to Krone (1962), τmin = 0, whereas Mehta and Partheniades (1975) found that τmin might be larger than zero
• Erosion rate: According to Partheniades (1965), the surface erosion rate is a linear function of the dimensionless excess shear stress
M=erodibility coefficient, and τce=critical shear stress for erosion
−=
ce
ceb ME
τττ
maxmin
max
min,0max,0min
min
01
)/()(1
1
τττττ
ττττττ
≤≤
≥−
−−−≤
if
if
if

16
CONSOLIDATION
• Consolidation is a compaction process of deposited materials under the influence of gravity and water pressure with a simultaneous expulsion of pore water and a gain in strength of bed materials
• Variation of bed density
• The dry bed density varies along the depth below the bed surface (Hayter, 1983)
• Lane and Koelzer (1953) proposed a formula to determine the dry density of bed material in the consolidation process
ρd=dry density of bed, H=bed thickness, z=depth below the bed surface, and a and m= coefficients dependent
ρd0 = dry density after 1 year of consolidation


