THIS REPORT CONTAINS ASSESSMENTS OF COMMODITY AND TRADE ISSUES MADE BY
USDA STAFF AND NOT NECESSARILY STATEMENTS OF OFFICIAL U.S. GOVERNMENT
POLICY
Date:
GAIN Report Number:
Approved By:
Prepared By:
Report Highlights:
The Philippines is a regional pioneer in renewable energy (RE) and has biofuels legislation in place that
calls for the blending of ethanol and biodiesel in gasoline and diesel fuel. RE sources accounted for 43
percent of the country’s primary energy mix in 2009. However, its contribution to total power supply is
likely to decline in the next five years due to its comparatively higher cost and the preference of local
officials to turn to familiar sources of power to address rapidly growing demand. Feedstock suppliers
have had no difficulty in complying with the mandated two percent biodiesel blend due to the
abundance of coconut oil in the country. Industry sources are confident they could even meet blends of
up to a five percent. Compliance with the mandated ethanol blend using locally produced ethanol,
however, will continue to be problematic mainly due to a lack of investment, distribution infrastructure
Perfecto G. Corpuz
William Verzani
Philippine Biofuels Industry Situation and Outlook
Biofuels Annual
Philippines
8/15/2011
Required Report - public distribution

and uncertainty over policy considerations. As a result, ethanol imports are expected to increase
through at least 2012, in order to satisfy local ethanol-blended gasoline requirements.
Post:
Executive Summary:
When Republic Act 9513 (RA 9513) or the Renewable Energy Act was signed in 2008, the country was
the second largest producer of geothermal energy (next to the U.S.) and had established the first
commercial wind farm in Southeast Asia. It had likewise set up the first grid-connected solar
photovoltaic power plant in the region. In 2009, renewable energy (RE) sources (geothermal, biomass,
hydro, wind and solar) accounted for 43 percent of the Philippine primary energy mix.
The country has experienced continued positive economic growth in recent years. However, a highly
skewed income distribution pattern has meant most of the benefits of this growth have not trickled down
to the masses. Increasing fuel and food prices have negatively affected the growing number of poor
Filipino families. The increased demand for electricity by the growing dichotomous Philippine
economy and frequent power outages are forcing the Philippine Government (GPH) to shift priority
from sophisticated RE-power facilities to more traditional power plants such as those that run on coal.
The anticipated issuance of less than expected feed-in-tariffs (FITs) and RE installation targets before
the end of 2011 support this perceived shift. As a result, the contribution of RE power sources to the
country’s primary energy mix is expected to decline in the next five years.
Even before RA 9513, the country had biofuels legislation in place when Republic Act 9367 (RA 9367)
or the Biofuels Act was signed in January 2007. RA 9367 mandated the blending of biodiesel and
ethanol in all locally distributed diesel and gasoline. Since the 2007 legislation, compliance with the
mandated biofuels blends has been mixed.
RA 9367 mandated the use of a minimum one percent biodiesel blend in all diesel fuels by February
2007, to increase to a two percent blend by February 2009. There have been no major issues in local
biodiesel production and compliance, and the domestic coconut industry has expressed optimism it can
supply the feedstock requirements should a higher biodiesel blend be enforced. Coconut methyl ester
(CME) is the Philippine biodiesel feedstock of choice, and is derived from coconut oil (CNO).
Research and development efforts in the use of Jatropha curcas (jatropha) is being pursued as an
advanced biodiesel feedstock although a national standard for biodiesel has not yet been established.
RA 9367 also mandated that by February 2009, at least five percent ethanol shall comprise the annual
total volume of gasoline sold and distributed by oil companies in the country, increasing to a ten percent
blend by February 2011. Although the amount of ethanol used in gasoline increased since the
legislation took effect, the percentage blend has been consistently below the mandated requirement.
According to industry players, non-compliance is due to insufficient investment due to low consumer
awareness, inadequate logistical and distribution systems, and a lack of clarity in the overall policy
implementation plan. Additionally, delays in the issuance of updated most favored nation (MFN) tariffs
on goods (including biofuels) have added uncertainty for potential fuel ethanol investors.
Due to problems in meeting the mandated ethanol blend, implementation of the 10 percent blend
requirement by February, 2011 was suspended by the Philippine Department of Energy (DOE). Local
Manila
ethanol producers and oil companies were granted a six month extension to August 2011 for them to
attend to logistical and infrastructure concerns. In the same DOE directive, local oil companies are
allowed to import ethanol to cover shortfalls in local production through August 2015. Sugarcane is
the preferred feedstock used by the Philippine bioethanol industry while cassava and sweet sorghum are
alternative feedstocks currently under study.
To summarize, there are no expected Philippine biodiesel issues and compliance with the mandated
blend is expected. For ethanol, however, compliance using locally produced ethanol will continue to be
problematic, and more imports will be needed to comply with the mandated blend.
Author Defined:
POLICY AND PROGRAMS
Overview
This report is based on the Philippine Energy Plan (PEP) 2007-2014 prepared by the country’s DOE.
The proposed PEP 2009-2030 mentioned in the previous annual report is undergoing further
refinements and has not been approved.
In 2009, the country’s total energy mix according to the September 2010 update of the Philippine
Biofuels Program (most recent available), reached 40.4 MTOE. Based on the same update, the
Philippines was 59 percent energy self-sufficient in 2009, and RE sources (geothermal, biomass, hydro,
wind and solar) accounted for 43 percent of the country’s energy mix.
The percentage contribution of the 2009 energy sources follow:
PHILIPPINE PRIMARY ENERGY MIX - 2009 Percent (%) Oil 32 Geothermal 23 Coal 17 Biomass 14 Natural Gas 8 Hydro 6 Wind & Solar 0
TOTAL 100
Source: Philippine Biofuels Program, September 2010
The Philippines has one of the highest, if not the highest, power rates in Asia, and because of the
increasing number of poor Filipinos, the Philippine government (GPH) has been quite sensitive to
increasing fuel prices.
Since 2001, poor households have been beneficiaries of a ‘lifeline subsidy’ or discounts from large
power producers under the Electric Power Industry Reform Act of 2001 or Republic Act No. 9136. The
EPIRA provides households that consume less than 20 kilowatt-hours (KWh) a month a 100 percent
discount, 50 percent for those using 21-50 KWh, 35 percent for those using 51-70 KWh, and 20 percent
for those consuming 71-100 KWh. The subsidy was set to expire on June 26, 2011 but was extended
for another 10 years by the Philippine Congress in early June 2011.
Renewable Energy
On December 16, 2008, then President Gloria Macapagal-Arroyo signed RA 9513 or the Renewable
Energy Act of 2008. RA 9513 had as its declared policies the following:
Accelerate the exploration and development of RE resources to achieve energy self-reliance,
through the adoption of sustainable energy development strategies to reduce the country's
dependence on fossil fuels; Increase the utilization of RE and promote its commercial application by providing fiscal and
non-fiscal incentives; Encourage the development and utilization of renewable energy resources as tools to effectively
prevent or reduce harmful emissions and thereby balance the goals of economic growth and
development with the protection of health and the environment; and Establish the necessary infrastructure and mechanism to carry out the mandates specified in this
Act and other existing laws.
When RA 9513 was signed, the Philippines was the second largest producer of geothermal energy (next
to the U.S.) and had established the first commercial-size wind farm in Southeast Asia. It likewise had
set up the first and largest grid-connected solar photovoltaic power plant in the region. According to
press reports, the DOE had already awarded P88 billion ($2 billion) worth of RE projects since the
signing of RA 9513 and hopes to generate an additional $9-10 billion worth of investments through
2020. Section seven (7) of RA 9513 provides for FITs to be paid by consumers as compensation for RE
developers that generate and infuse power into the local transmission system. Per RA 9513, the
proposed FIT rates were to be in place in August 2010, but were not submitted by the National
Renewable Energy Board (NREB) to the Energy Regulatory Commission (ERC) until May 2011. The
NREB proposal set the FITs at P7 ($0.16) per KWh for biomass, P6.15 ($0.14) per KWh for hydro,
P10.37 ($0.23) per KWh for wind, P17.65 ($0.41) per KWh for ocean energy, and P17.95 ($0.42) for
solar power. In addition, the NREB proposal also endorses a 830 Megawatt (MW) cap on RE
installation projects. This is broken down as follows: hydro and biomass sectors 500 MW (or 250 MW
each), wind, 220 MW; solar 100 MW; and ocean, 10 MW. The proposed FIT is a fixed rate for 20
years, and is expected to be approved before the end of 2011. Local RE developers have been complaining over the delay in the issuance of the FITs and have
repeatedly warned of pulling out their investments unless more encouraging FIT rates are granted or a
higher installation target is set. The NREB, on the other hand, had claimed the use of RE would raise
power costs, according to press reports.
Intermittent power outages continue to occur, particularly in Mindanao island. Power shortages in some
areas in the island are common during the summer months when demand for electricity is high (for
cooling), and water supply to power hydro electric plants is low. As a result, coupled with the growing
demand for electricity by the growing Philippine economy, the GPH appears to have shifted priorities
from sophisticated RE-power facilities, to more conventional power plants such as coal and nuclear
power. While the nuclear option has been dampened by the recent Fukushima nuclear plant disaster in
Japan, more attention on traditional fuels such as coal is being given as the fastest way to increase
power capacity. The DOE, according to press reports, expect an additional 2,700 MW of coal-fired
generation coming in during the period 2013-2015. Coal powered plants have to comply with the
Philippine Clean Air Act of 1999 (Republic Act No. 8749) whose Implementing Rules and Regulations
are provided in the following link:
http://www.chanrobles.com/philippinecleanairactrules1.htm
Largely because of the perceived shift, the contribution of RE power sources to the country’s primary
energy mix are expected to decline below the 50 percent level during the 2013-2015 period.
During the launching in June 14, 2011 of the GPH’s 20-year National Renewable Energy Program
(NREP), incumbent President Benigno Aquino III sought to reassure the public that RE development
would not lead to higher energy costs.
Biofuels
Former President Arroyo also signed RA 9367, or the Biofuels Act, on January 12, 2007. This act
mandated a minimum one percent biodiesel blend into all diesel fuels within two months of the law
taking effect, to increase to a two percent blend by January 2009. RA 9367 also mandated that by
January 2009, at least 5 percent ethanol would comprise the annual total volume of gasoline sold and
distributed by oil companies in the country, increasing to a ten percent blend by February 2011. Due to
problems in meeting the mandated ten percent ethanol blend (i.e. infrastructure and logistical issues),
implementation was suspended by the DOE in early 2011 and local oil companies were granted a 6
month extension to August 2011 for compliance.
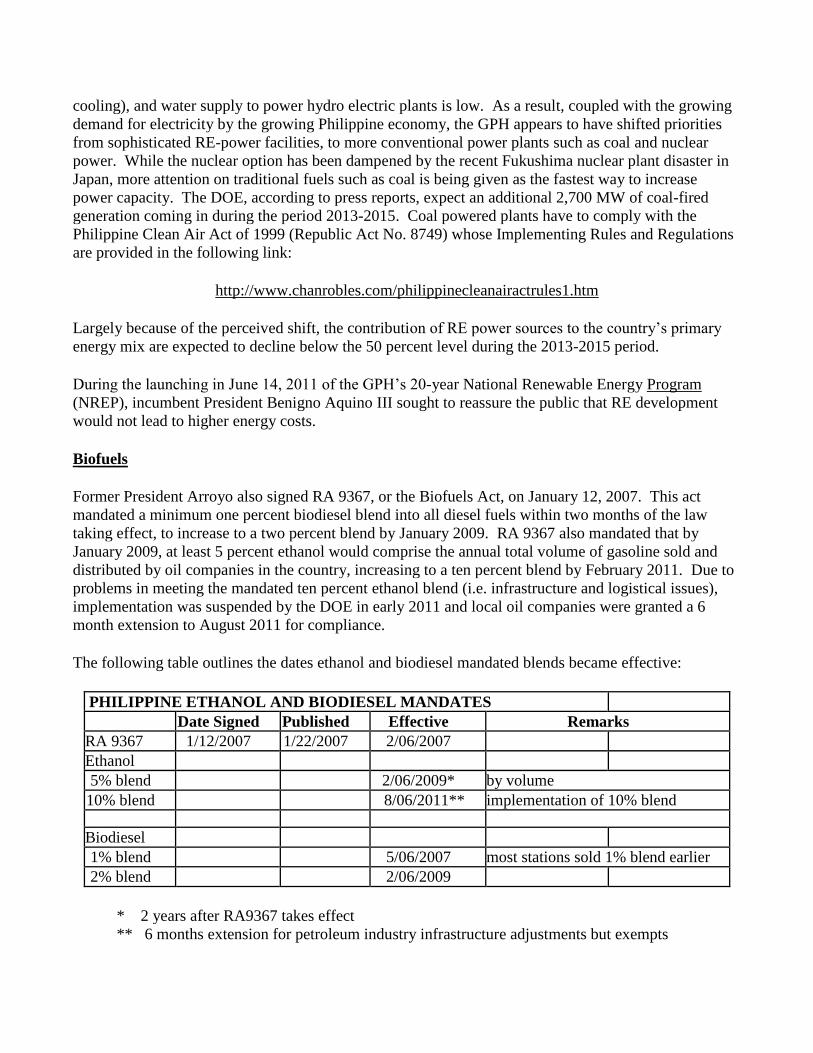
The following table outlines the dates ethanol and biodiesel mandated blends became effective:
PHILIPPINE ETHANOL AND BIODIESEL MANDATES
Date Signed Published Effective Remarks
RA 9367 1/12/2007 1/22/2007 2/06/2007
Ethanol
5% blend 2/06/2009* by volume
10% blend 8/06/2011** implementation of 10% blend
Biodiesel
1% blend 5/06/2007 most stations sold 1% blend earlier
2% blend 2/06/2009
* 2 years after RA9367 takes effect ** 6 months extension for petroleum industry infrastructure adjustments but exempts
certain regular gasoline grades for some motorcycles
Source: Republic Act 9367
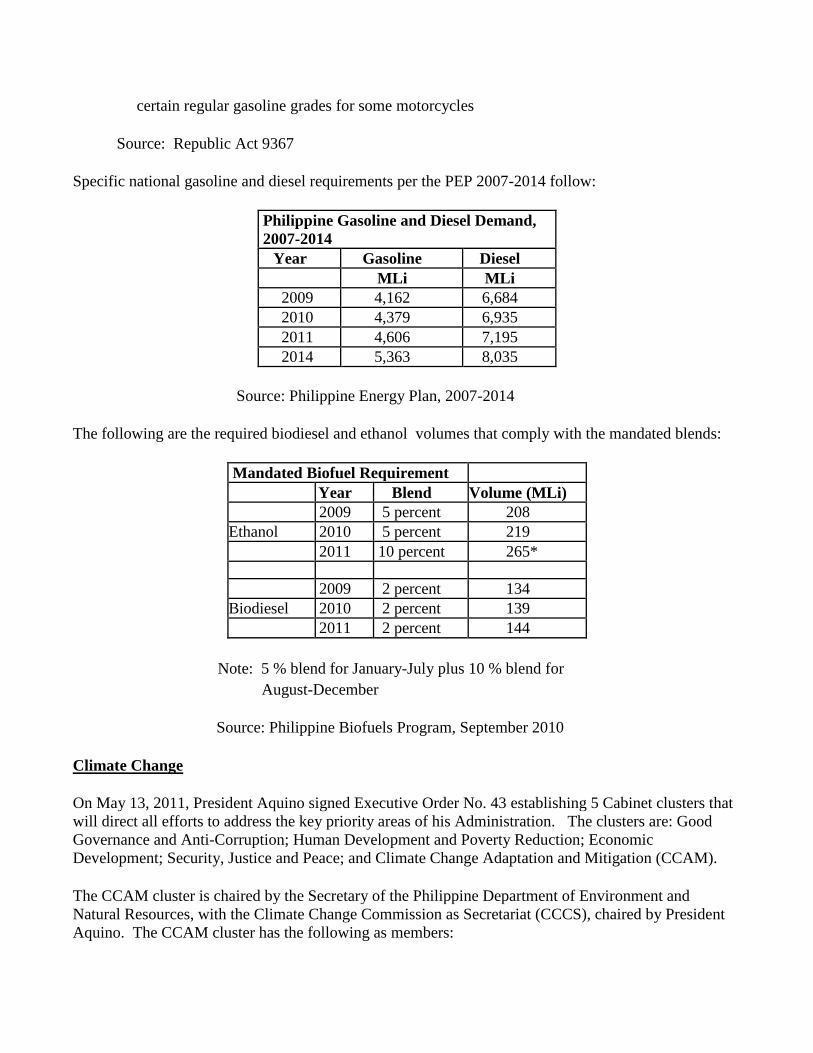
Specific national gasoline and diesel requirements per the PEP 2007-2014 follow:
Philippine Gasoline and Diesel Demand, 2007-2014
Year Gasoline Diesel
MLi MLi 2009 4,162 6,684
2010 4,379 6,935
2011 4,606 7,195
2014 5,363 8,035
Source: Philippine Energy Plan, 2007-2014
The following are the required biodiesel and ethanol volumes that comply with the mandated blends:
Mandated Biofuel Requirement
Year Blend Volume (MLi)
2009 5 percent 208
Ethanol 2010 5 percent 219
2011 10 percent 265*
2009 2 percent 134
Biodiesel 2010 2 percent 139
2011 2 percent 144
Note: 5 % blend for January-July plus 10 % blend for
August-December
Source: Philippine Biofuels Program, September 2010
Climate Change
On May 13, 2011, President Aquino signed Executive Order No. 43 establishing 5 Cabinet clusters that
will direct all efforts to address the key priority areas of his Administration. The clusters are: Good
Governance and Anti-Corruption; Human Development and Poverty Reduction; Economic
Development; Security, Justice and Peace; and Climate Change Adaptation and Mitigation (CCAM).
The CCAM cluster is chaired by the Secretary of the Philippine Department of Environment and
Natural Resources, with the Climate Change Commission as Secretariat (CCCS), chaired by President
Aquino. The CCAM cluster has the following as members:
Chair, Housing and Urban Development Coordinating Council
Secretary, Department of Science and Technology
Secretary, Department of the Interior and Local Government
Secretary, Department of Public Works and Highways
Secretary, Department of Social Welfare and Development
Secretary, Department of Agriculture
Secretary, Department of Agrarian Reform
Secretary, Department of Energy
Secretary, Department of National Defense
Chair, Metropolitan Manila Development Authority
Ensuring food security is the priority of the Philippine Department of Agriculture (DA) for the farm
sector. Hence, the DA and the CCC have placed adaptation and disaster management as the priority
agricultural climate change concern. This observation was confirmed by the recent visit to the
Philippines by an inter-agency team under the USG’s Enhancing Capacity for Low Emissions
Development Strategies initiative.
ETHANOL
Production
Philippine ethanol production remains to be sugarcane based. Post uses a 65 Li/MT conversion rate in
the required Ethanol PSD Table and a sugarcane co-product (bagasse) recovery rate of 300 kilos (kg)
per ton cane.
Local ethanol production continues to be problematic and output in 2010 (9.9 MLi) was lower than
expected due to inadequate investments, and is based on the 2010 Biofuels Report of the NBB. There
were 3 ethanol distilleries in 2010 with a combined capacity of around 75 million liters (MLi). Only a
couple, however, were in production through May 2010, with the third facility basically under
commissioning during the second half of 2010. The largest among the 3 existing distilleries ceased
ethanol production operations in mid-2010 as a result of losses reportedly due to increasing sugar prices
as well as stiff competition from imported ethanol from Brazil and Thailand. The local industry has
been asking for higher tariffs to encourage more investments as a result (see TRADE, Ethanol).
For 2011, production is expected to increase from the previous year’s level although the NBB notes
there was no ethanol production in the first quarter of the year. Sugar prices have stabilized and
infrastructure improvements instituted by oil companies mentioned in the POLICY Section are likely to
enhance ethanol distribution and consumption in 2011. While the improvements are expected to
enhance competitiveness of the industry, production will still be way below the desired level due to the
inadequate capacity of operating distilleries. The 2011 production estimate in the Ethanol PSD Table
reflects the NBB projection for the year.
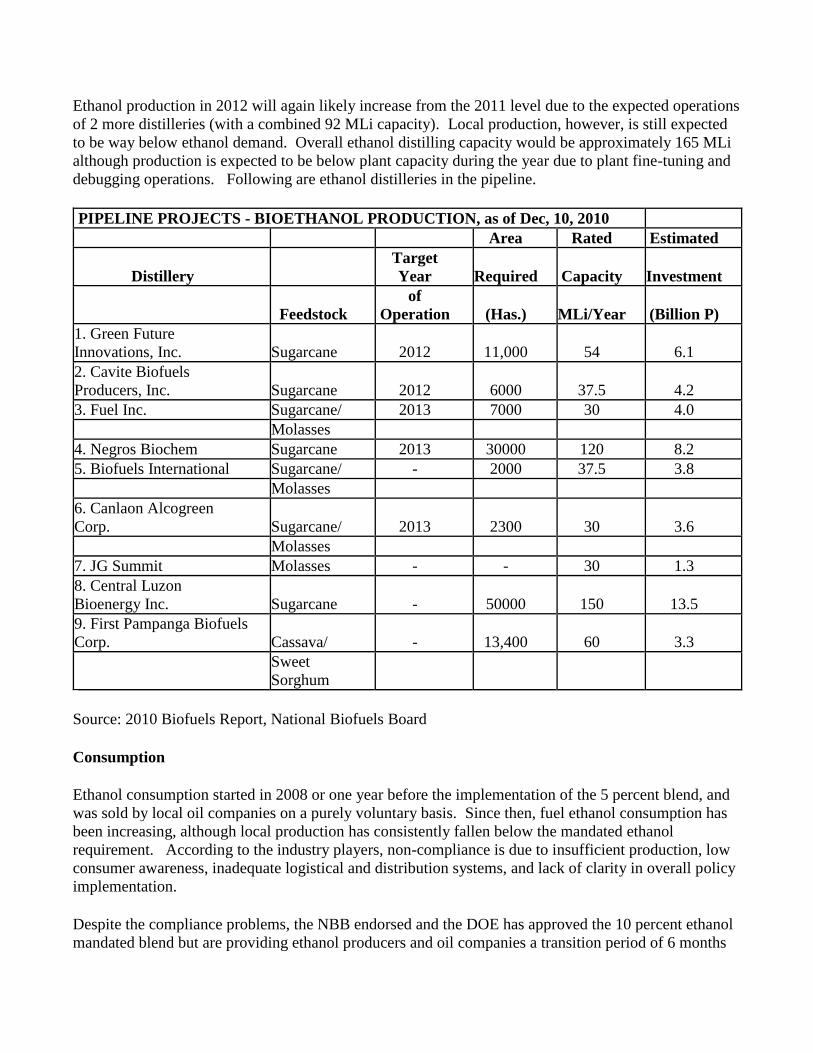
Ethanol production in 2012 will again likely increase from the 2011 level due to the expected operations
of 2 more distilleries (with a combined 92 MLi capacity). Local production, however, is still expected
to be way below ethanol demand. Overall ethanol distilling capacity would be approximately 165 MLi
although production is expected to be below plant capacity during the year due to plant fine-tuning and
debugging operations. Following are ethanol distilleries in the pipeline.
PIPELINE PROJECTS - BIOETHANOL PRODUCTION, as of Dec, 10, 2010
Area Rated Estimated
Distillery
Target
Year Required Capacity Investment
Feedstock of
Operation (Has.) MLi/Year (Billion P) 1. Green Future
Innovations, Inc. Sugarcane 2012 11,000 54 6.1
2. Cavite Biofuels
Producers, Inc. Sugarcane 2012 6000 37.5 4.2
3. Fuel Inc. Sugarcane/ 2013 7000 30 4.0
Molasses
4. Negros Biochem Sugarcane 2013 30000 120 8.2
5. Biofuels International Sugarcane/ - 2000 37.5 3.8
Molasses
6. Canlaon Alcogreen
Corp. Sugarcane/ 2013 2300 30 3.6
Molasses
7. JG Summit Molasses - - 30 1.3
8. Central Luzon
Bioenergy Inc. Sugarcane - 50000 150 13.5
9. First Pampanga Biofuels
Corp. Cassava/ - 13,400 60 3.3
Sweet
Sorghum
Source: 2010 Biofuels Report, National Biofuels Board
Consumption
Ethanol consumption started in 2008 or one year before the implementation of the 5 percent blend, and
was sold by local oil companies on a purely voluntary basis. Since then, fuel ethanol consumption has
been increasing, although local production has consistently fallen below the mandated ethanol
requirement. According to the industry players, non-compliance is due to insufficient production, low
consumer awareness, inadequate logistical and distribution systems, and lack of clarity in overall policy
implementation.
Despite the compliance problems, the NBB endorsed and the DOE has approved the 10 percent ethanol
mandated blend but are providing ethanol producers and oil companies a transition period of 6 months
to attend to distribution and logistics infrastructure concerns. The E10 blend will be fully implemented
August 2011 and ethanol imports will be allowed to cover local production deficits through August
2015.
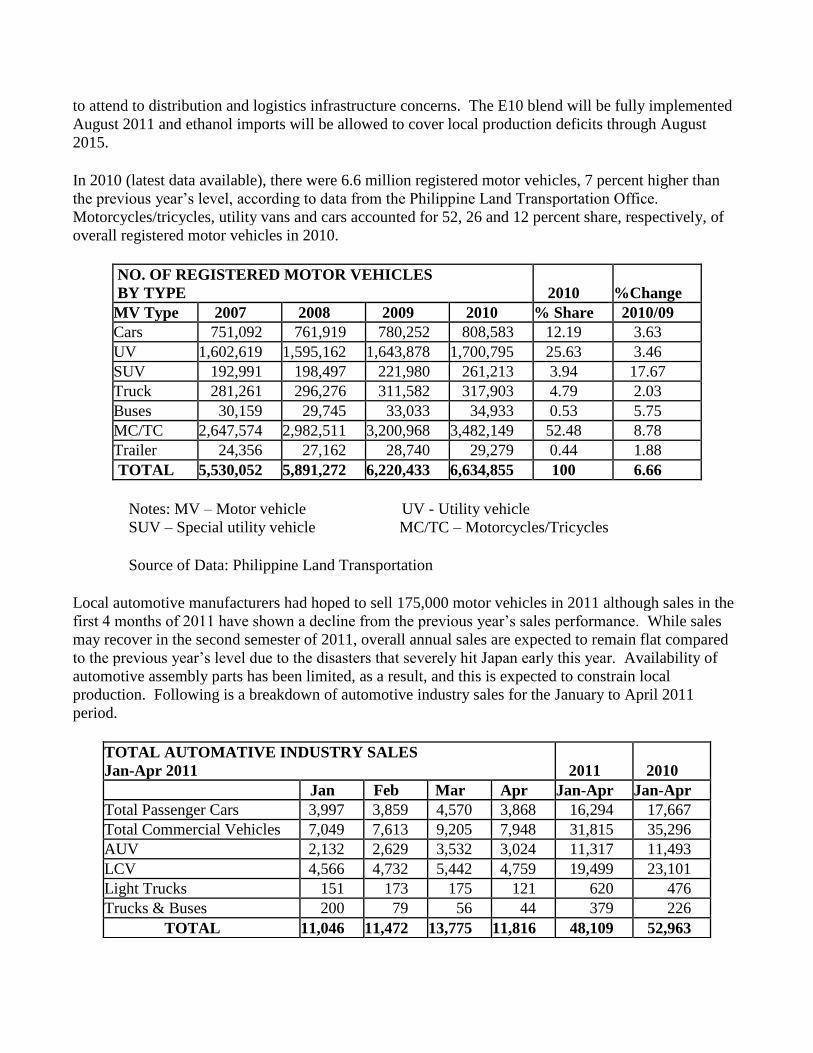
In 2010 (latest data available), there were 6.6 million registered motor vehicles, 7 percent higher than
the previous year’s level, according to data from the Philippine Land Transportation Office.
Motorcycles/tricycles, utility vans and cars accounted for 52, 26 and 12 percent share, respectively, of
overall registered motor vehicles in 2010.
NO. OF REGISTERED MOTOR VEHICLES BY TYPE 2010 %Change
MV Type 2007 2008 2009 2010 % Share 2010/09 Cars 751,092 761,919 780,252 808,583 12.19 3.63
UV 1,602,619 1,595,162 1,643,878 1,700,795 25.63 3.46
SUV 192,991 198,497 221,980 261,213 3.94 17.67
Truck 281,261 296,276 311,582 317,903 4.79 2.03
Buses 30,159 29,745 33,033 34,933 0.53 5.75
MC/TC 2,647,574 2,982,511 3,200,968 3,482,149 52.48 8.78
Trailer 24,356 27,162 28,740 29,279 0.44 1.88
TOTAL 5,530,052 5,891,272 6,220,433 6,634,855 100 6.66
Notes: MV – Motor vehicle UV - Utility vehicle SUV – Special utility vehicle MC/TC – Motorcycles/Tricycles
Source of Data: Philippine Land Transportation
Local automotive manufacturers had hoped to sell 175,000 motor vehicles in 2011 although sales in the
first 4 months of 2011 have shown a decline from the previous year’s sales performance. While sales
may recover in the second semester of 2011, overall annual sales are expected to remain flat compared
to the previous year’s level due to the disasters that severely hit Japan early this year. Availability of
automotive assembly parts has been limited, as a result, and this is expected to constrain local
production. Following is a breakdown of automotive industry sales for the January to April 2011
period.
TOTAL AUTOMATIVE INDUSTRY SALES Jan-Apr 2011 2011 2010
Jan Feb Mar Apr Jan-Apr Jan-Apr
Total Passenger Cars 3,997 3,859 4,570 3,868 16,294 17,667
Total Commercial Vehicles 7,049 7,613 9,205 7,948 31,815 35,296
AUV 2,132 2,629 3,532 3,024 11,317 11,493
LCV 4,566 4,732 5,442 4,759 19,499 23,101
Light Trucks 151 173 175 121 620 476
Trucks & Buses 200 79 56 44 379 226
TOTAL 11,046 11,472 13,775 11,816 48,109 52,963
Source of Data: Chamber of Automotive Manufacturers of the Philippines Inc.
With longer term implications is the policy regarding legislation on motor engine and parts. Signed by
ex-President Arroyo in April 2010, Executive Order 877 (EO 877) or the new Motor Vehicle
Development Program (MVDP) was meant to strengthen the local industry. A contentious item, among
others, involves a provision that allows the re-importation of used vehicles engines and parts. The local
industry has voiced its opposition although the issuance of the implementing rules and regulations
(IRRs) of EO 877 have yet to be issued.
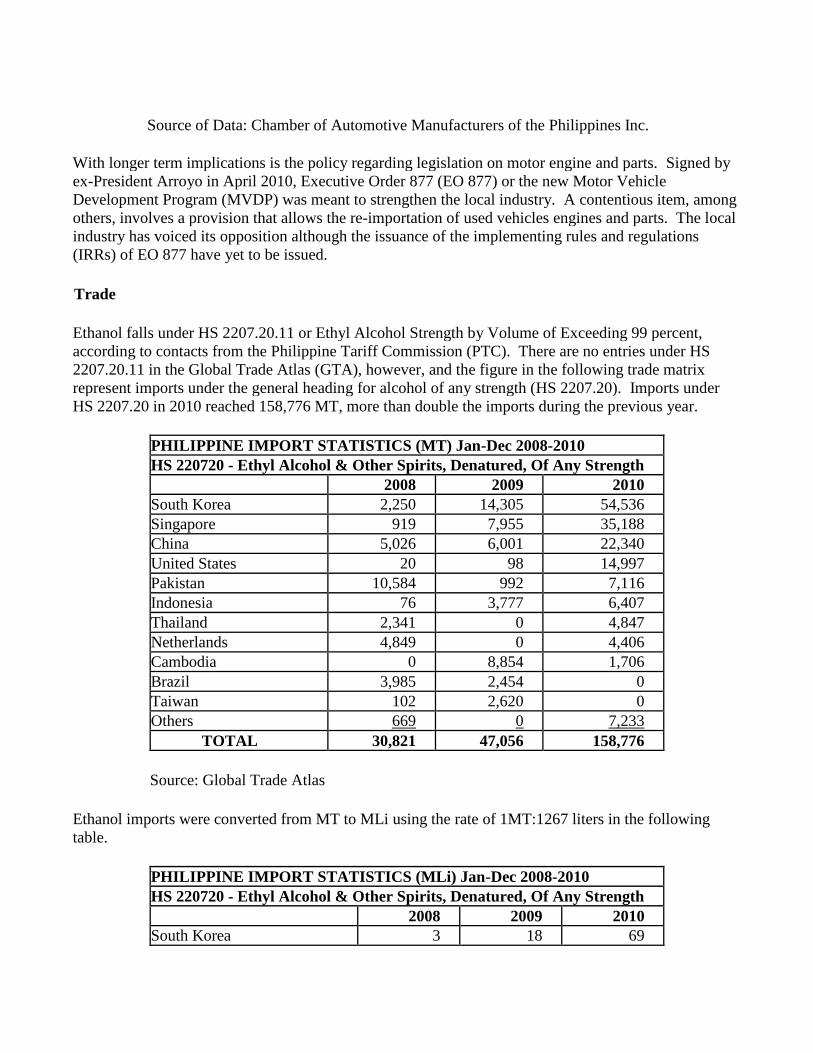
Trade
Ethanol falls under HS 2207.20.11 or Ethyl Alcohol Strength by Volume of Exceeding 99 percent,
according to contacts from the Philippine Tariff Commission (PTC). There are no entries under HS
2207.20.11 in the Global Trade Atlas (GTA), however, and the figure in the following trade matrix
represent imports under the general heading for alcohol of any strength (HS 2207.20). Imports under
HS 2207.20 in 2010 reached 158,776 MT, more than double the imports during the previous year.
PHILIPPINE IMPORT STATISTICS (MT) Jan-Dec 2008-2010
HS 220720 - Ethyl Alcohol & Other Spirits, Denatured, Of Any Strength 2008 2009 2010
South Korea 2,250 14,305 54,536
Singapore 919 7,955 35,188
China 5,026 6,001 22,340
United States 20 98 14,997
Pakistan 10,584 992 7,116
Indonesia 76 3,777 6,407
Thailand 2,341 0 4,847
Netherlands 4,849 0 4,406
Cambodia 0 8,854 1,706
Brazil 3,985 2,454 0
Taiwan 102 2,620 0
Others 669 0 7,233
TOTAL 30,821 47,056 158,776
Source: Global Trade Atlas
Ethanol imports were converted from MT to MLi using the rate of 1MT:1267 liters in the following
table.
PHILIPPINE IMPORT STATISTICS (MLi) Jan-Dec 2008-2010
HS 220720 - Ethyl Alcohol & Other Spirits, Denatured, Of Any Strength 2008 2009 2010 South Korea 3 18 69
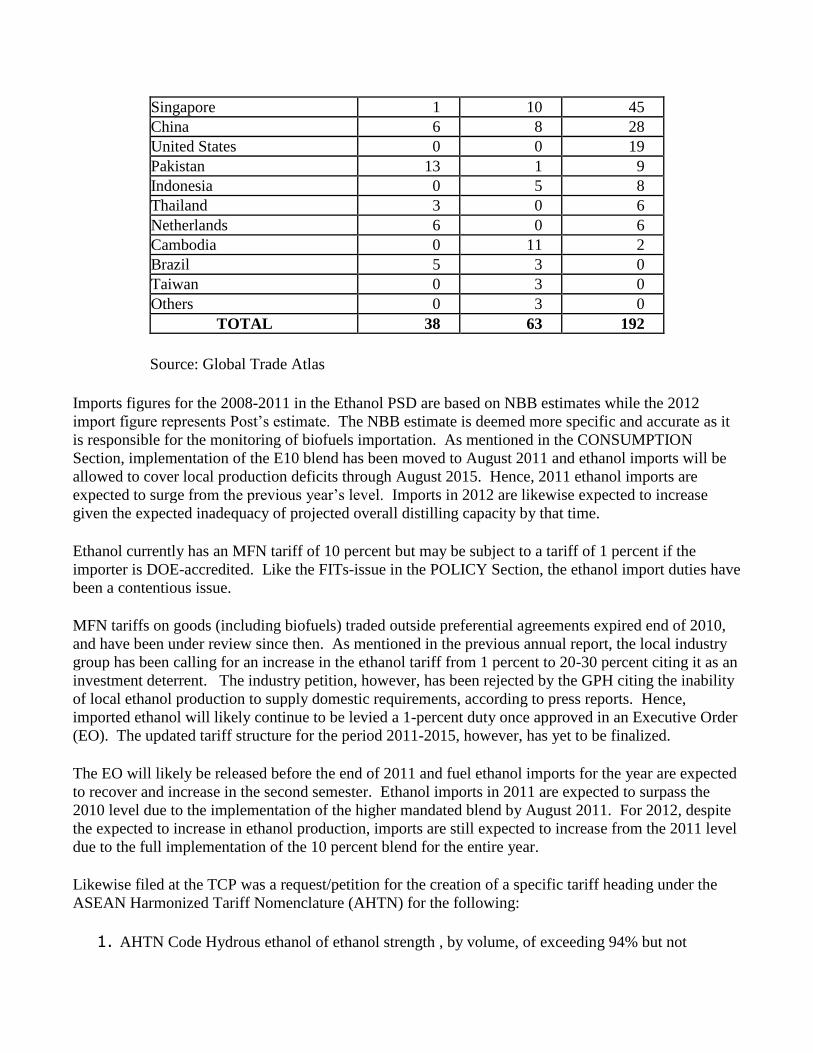
Singapore 1 10 45
China 6 8 28
United States 0 0 19
Pakistan 13 1 9
Indonesia 0 5 8
Thailand 3 0 6
Netherlands 6 0 6
Cambodia 0 11 2
Brazil 5 3 0
Taiwan 0 3 0
Others 0 3 0
TOTAL 38 63 192
Source: Global Trade Atlas
Imports figures for the 2008-2011 in the Ethanol PSD are based on NBB estimates while the 2012
import figure represents Post’s estimate. The NBB estimate is deemed more specific and accurate as it
is responsible for the monitoring of biofuels importation. As mentioned in the CONSUMPTION
Section, implementation of the E10 blend has been moved to August 2011 and ethanol imports will be
allowed to cover local production deficits through August 2015. Hence, 2011 ethanol imports are
expected to surge from the previous year’s level. Imports in 2012 are likewise expected to increase
given the expected inadequacy of projected overall distilling capacity by that time.
Ethanol currently has an MFN tariff of 10 percent but may be subject to a tariff of 1 percent if the
importer is DOE-accredited. Like the FITs-issue in the POLICY Section, the ethanol import duties have
been a contentious issue.
MFN tariffs on goods (including biofuels) traded outside preferential agreements expired end of 2010,
and have been under review since then. As mentioned in the previous annual report, the local industry
group has been calling for an increase in the ethanol tariff from 1 percent to 20-30 percent citing it as an
investment deterrent. The industry petition, however, has been rejected by the GPH citing the inability
of local ethanol production to supply domestic requirements, according to press reports. Hence,
imported ethanol will likely continue to be levied a 1-percent duty once approved in an Executive Order
(EO). The updated tariff structure for the period 2011-2015, however, has yet to be finalized.
The EO will likely be released before the end of 2011 and fuel ethanol imports for the year are expected
to recover and increase in the second semester. Ethanol imports in 2011 are expected to surpass the
2010 level due to the implementation of the higher mandated blend by August 2011. For 2012, despite
the expected to increase in ethanol production, imports are still expected to increase from the 2011 level
due to the full implementation of the 10 percent blend for the entire year.
Likewise filed at the TCP was a request/petition for the creation of a specific tariff heading under the
ASEAN Harmonized Tariff Nomenclature (AHTN) for the following:
1. AHTN Code Hydrous ethanol of ethanol strength , by volume, of exceeding 94% but not
2207.20.12 more than 99%, for us as fuel in an internal combustion engine or other motive
power.
2. AHTN Code Anhydrous ethanol of ethanol strength , by volume, of exceeding 93.2% and
2207.20.13 above but not more than 99%, for us as fuel in an internal combustion engine or
other motive power.
The petition notes the subheading 2207.20.11 (i.e. ethyl alcohol strength by volume of exceeding 99%)
is not adequate enough to describe ethanol imported by participants to the Fuel Ethanol Program. This
infers some ethanol imports were being diverted to purposes other than fuel use.
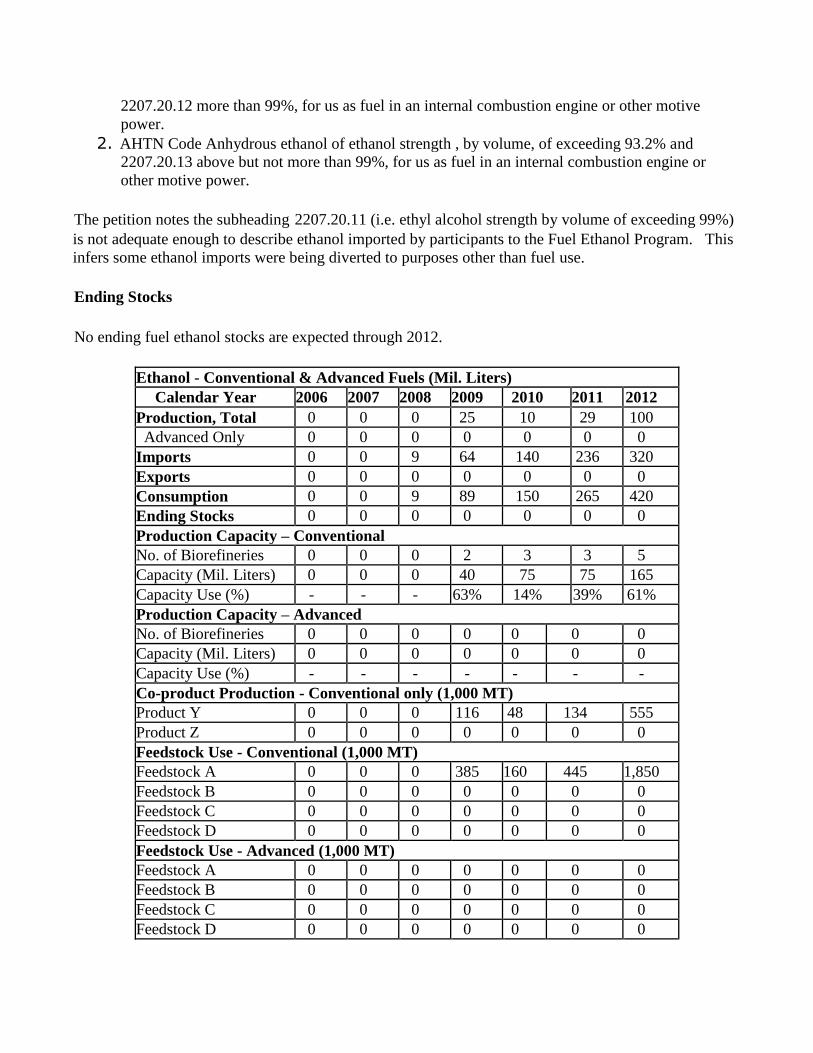
Ending Stocks
No ending fuel ethanol stocks are expected through 2012.
Ethanol - Conventional & Advanced Fuels (Mil. Liters)
Calendar Year 2006 2007 2008 2009 2010 2011 2012
Production, Total 0 0 0 25 10 29 100
Advanced Only 0 0 0 0 0 0 0
Imports 0 0 9 64 140 236 320
Exports 0 0 0 0 0 0 0
Consumption 0 0 9 89 150 265 420
Ending Stocks 0 0 0 0 0 0 0
Production Capacity – Conventional No. of Biorefineries 0 0 0 2 3 3 5
Capacity (Mil. Liters) 0 0 0 40 75 75 165
Capacity Use (%) - - - 63% 14% 39% 61%
Production Capacity – Advanced No. of Biorefineries 0 0 0 0 0 0 0
Capacity (Mil. Liters) 0 0 0 0 0 0 0
Capacity Use (%) - - - - - - -
Co-product Production - Conventional only (1,000 MT) Product Y 0 0 0 116 48 134 555
Product Z 0 0 0 0 0 0 0
Feedstock Use - Conventional (1,000 MT) Feedstock A 0 0 0 385 160 445 1,850
Feedstock B 0 0 0 0 0 0 0
Feedstock C 0 0 0 0 0 0 0
Feedstock D 0 0 0 0 0 0 0
Feedstock Use - Advanced (1,000 MT) Feedstock A 0 0 0 0 0 0 0
Feedstock B 0 0 0 0 0 0 0
Feedstock C 0 0 0 0 0 0 0
Feedstock D 0 0 0 0 0 0 0
Notes:
1. 2008-2010 imports, production, no. of distilleries and their capacities are based on the 2010 Biofuels
Report by of the NBB and the September 2010 update of the Philippine Biofuels
Program. 2. 2006-07 and 2011-12 numbers are Post’s estimates.
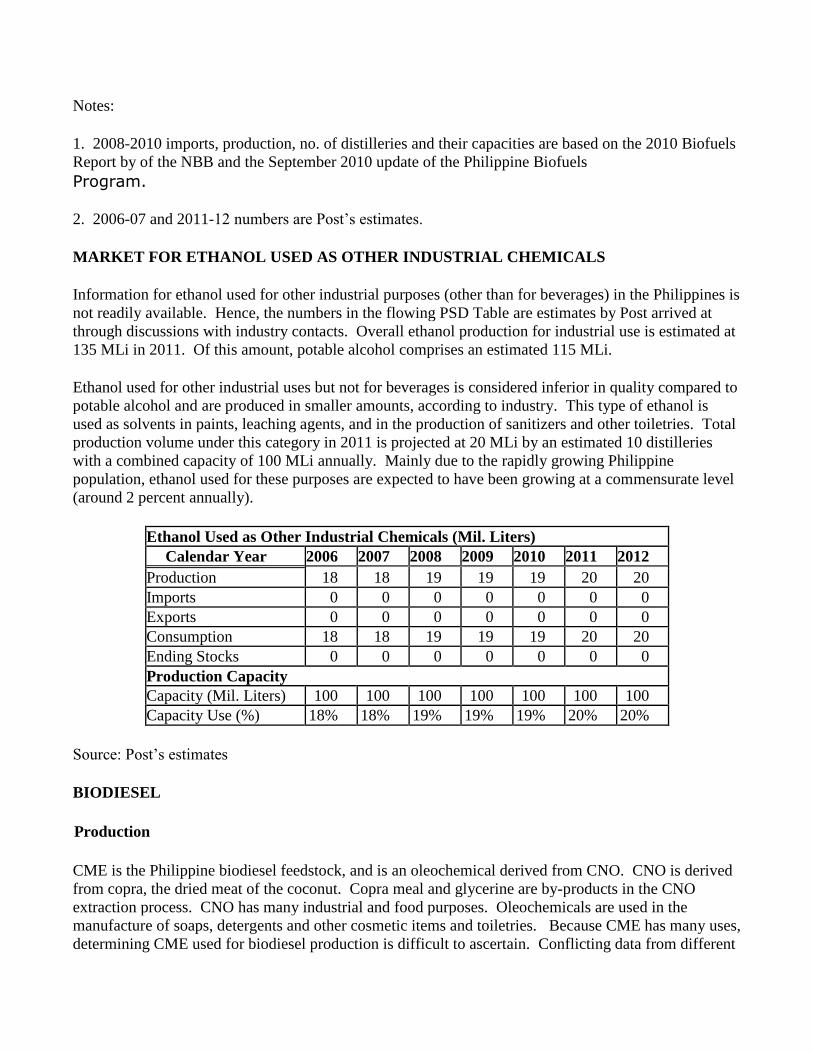
MARKET FOR ETHANOL USED AS OTHER INDUSTRIAL CHEMICALS
Information for ethanol used for other industrial purposes (other than for beverages) in the Philippines is
not readily available. Hence, the numbers in the flowing PSD Table are estimates by Post arrived at
through discussions with industry contacts. Overall ethanol production for industrial use is estimated at
135 MLi in 2011. Of this amount, potable alcohol comprises an estimated 115 MLi.
Ethanol used for other industrial uses but not for beverages is considered inferior in quality compared to
potable alcohol and are produced in smaller amounts, according to industry. This type of ethanol is
used as solvents in paints, leaching agents, and in the production of sanitizers and other toiletries. Total
production volume under this category in 2011 is projected at 20 MLi by an estimated 10 distilleries
with a combined capacity of 100 MLi annually. Mainly due to the rapidly growing Philippine
population, ethanol used for these purposes are expected to have been growing at a commensurate level
(around 2 percent annually).
Ethanol Used as Other Industrial Chemicals (Mil. Liters)
Calendar Year 2006 2007 2008 2009 2010 2011 2012
Production 18 18 19 19 19 20 20
Imports 0 0 0 0 0 0 0
Exports 0 0 0 0 0 0 0
Consumption 18 18 19 19 19 20 20
Ending Stocks 0 0 0 0 0 0 0
Production Capacity Capacity (Mil. Liters) 100 100 100 100 100 100 100
Capacity Use (%) 18% 18% 19% 19% 19% 20% 20%
Source: Post’s estimates
BIODIESEL
Production
CME is the Philippine biodiesel feedstock, and is an oleochemical derived from CNO. CNO is derived
from copra, the dried meat of the coconut. Copra meal and glycerine are by-products in the CNO
extraction process. CNO has many industrial and food purposes. Oleochemicals are used in the
manufacture of soaps, detergents and other cosmetic items and toiletries. Because CME has many uses,
determining CME used for biodiesel production is difficult to ascertain. Conflicting data from different
sources further compound reporting.
According to industry contacts, 5 coconuts will make 1 kg of copra, which make 0.60 kg of CNO.
This means 60 percent of copra weight is oil. Hence, a kg of CNO will come from 1.67 kg of copra
extracted from 8.35 coconuts. The conversion of CNO to CME is 1:1. Thus, 1.11 Li of coco oil will
also make 1.11 Li of CME coming from 8.35 nuts. On per liter basis, a liter CME is extracted from 7.5
nuts.
In 2010, there were 12 DOE-accredited CME biodiesel producers, according to the NBB 2010 report,
with a combined annual capacity of approximately 400 MLi. Of the 12 plants, however, only eight (8)
were in commercial production in 2010. By early 2011, there were only 7 biodiesel producers,
according to the NBB report. Despite the reduction in the number of CME plants, biodiesel production
is expected to remain fairly flat since 2009 or when the 2 percent blend was implemented, indicative of
the local coconut industry’s capability to provide the adequate biodiesel feedstock. Roughly over a
third of overall CME production capacity is being devoted for biodiesel production.
The Philippine coconut industry continues to be optimistic on its capability to supply the copra required
to make CNO for CME production. In its Biodiesel Situationer of March 2011, the Philippine Coconut
Authority (PCA) reported that local CNO supply would be adequate even at the 5 percent mandated
blend requirement. The PCA places CNO requirements at this blend level at 350,000 MT or about 22
percent of its current annual production capacity.
Consumption
Even before the Biofuels Law was signed in 2007, the GPH had required the use of CME-blended diesel
by all GPH government vehicles. The consumption estimates for 2006-2007 are Post estimates and
represent CME used during the same period. For the years 2008-2009, Post used NBB consumption
estimates while demand numbers through 2012 are Post’s projections.
The smooth transition from a 1 percent to a 2 percent CME blend in 2009 had raised hopes for a
possible higher 5 percent blend possibly by 2011. For this to happen, however, the PCA says the higher
blend should be proven technically feasible, taking into consideration the engines and fuel systems of
reconditioned and refurbished vehicles, among others. The local automotive industry has reported that
locally manufactured diesel-powered motor vehicles are currently designed for a 5 percent biodiesel
blend.
The transport industry is the dominant oil consuming sector accounting for over half of the country’s
overall oil demand. Recent increasing fuel prices have resulted in higher freight and delivery costs of
food items. The resulting higher food prices have serious implications. According to the Asian
Development Bank, should Philippine food prices increase by 10-30 percent in 2011, the number of
poor Filipinos would expand by 1.4 million to 4.9 million.
In response, President Aquino signed on April 1, 2011 Executive Order 32 (EO 32) which provides fuel
subsidies to the public transportation sector. EO 32 allocates P450 million ($10.5 million) from the
special funds of the DOE for the subsidy program and is meant to provide temporary relief from the
spike in fuel prices as a result of the conflicts in the Middle East and North Africa.
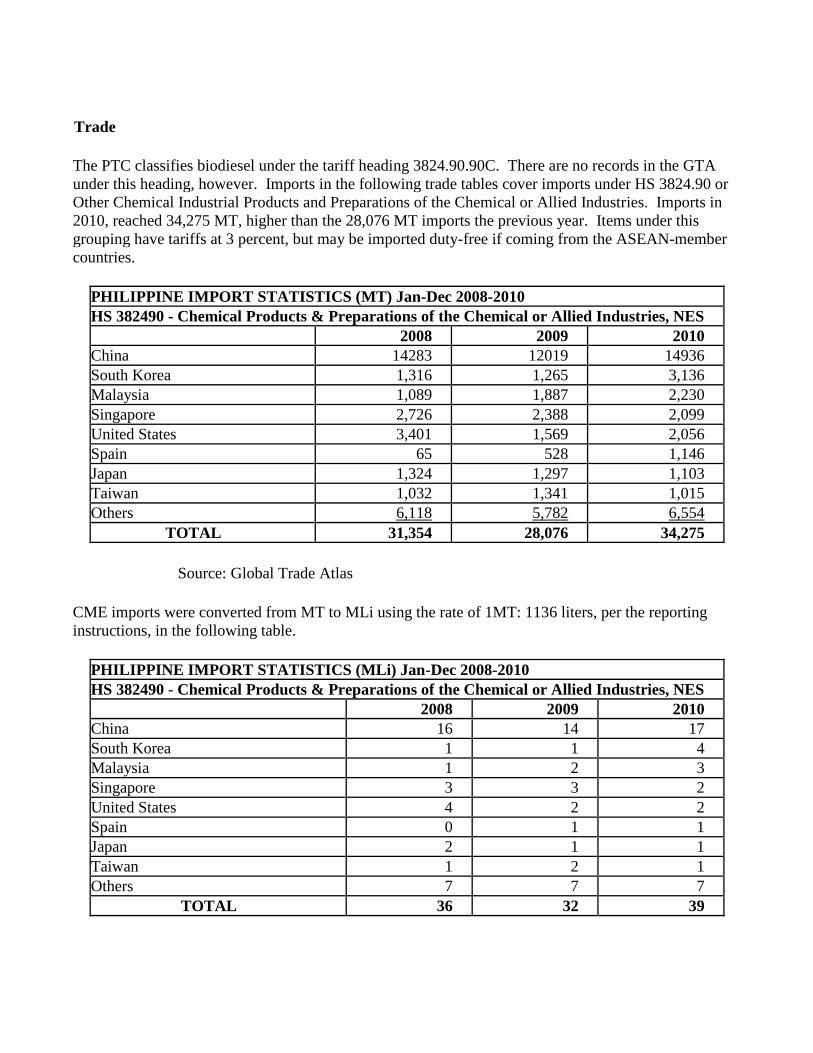
Trade
The PTC classifies biodiesel under the tariff heading 3824.90.90C. There are no records in the GTA
under this heading, however. Imports in the following trade tables cover imports under HS 3824.90 or
Other Chemical Industrial Products and Preparations of the Chemical or Allied Industries. Imports in
2010, reached 34,275 MT, higher than the 28,076 MT imports the previous year. Items under this
grouping have tariffs at 3 percent, but may be imported duty-free if coming from the ASEAN-member
countries.
PHILIPPINE IMPORT STATISTICS (MT) Jan-Dec 2008-2010
HS 382490 - Chemical Products & Preparations of the Chemical or Allied Industries, NES 2008 2009 2010
China 14283 12019 14936
South Korea 1,316 1,265 3,136
Malaysia 1,089 1,887 2,230
Singapore 2,726 2,388 2,099
United States 3,401 1,569 2,056
Spain 65 528 1,146
Japan 1,324 1,297 1,103
Taiwan 1,032 1,341 1,015
Others 6,118 5,782 6,554
TOTAL 31,354 28,076 34,275
Source: Global Trade Atlas
CME imports were converted from MT to MLi using the rate of 1MT: 1136 liters, per the reporting
instructions, in the following table.
PHILIPPINE IMPORT STATISTICS (MLi) Jan-Dec 2008-2010
HS 382490 - Chemical Products & Preparations of the Chemical or Allied Industries, NES 2008 2009 2010
China 16 14 17
South Korea 1 1 4
Malaysia 1 2 3
Singapore 3 3 2
United States 4 2 2
Spain 0 1 1
Japan 2 1 1
Taiwan 1 2 1
Others 7 7 7
TOTAL 36 32 39
Source: Global Trade Atlas
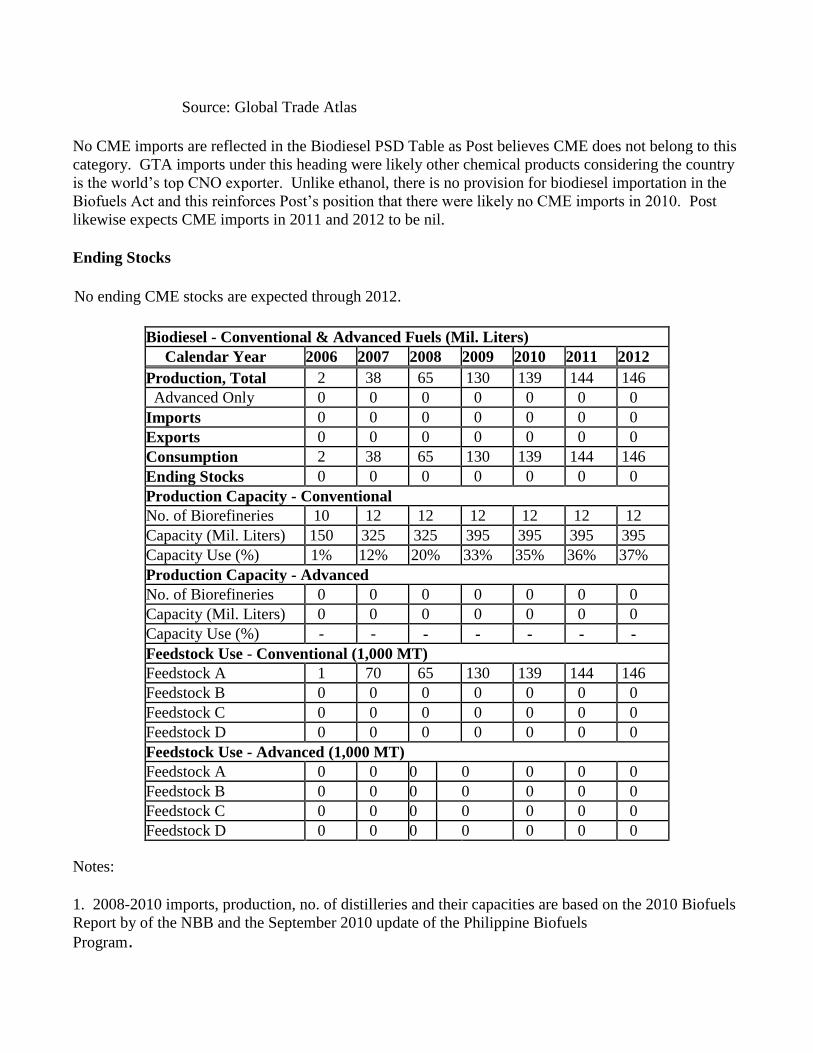
No CME imports are reflected in the Biodiesel PSD Table as Post believes CME does not belong to this
category. GTA imports under this heading were likely other chemical products considering the country
is the world’s top CNO exporter. Unlike ethanol, there is no provision for biodiesel importation in the
Biofuels Act and this reinforces Post’s position that there were likely no CME imports in 2010. Post
likewise expects CME imports in 2011 and 2012 to be nil.
Ending Stocks
No ending CME stocks are expected through 2012.
Biodiesel - Conventional & Advanced Fuels (Mil. Liters)
Calendar Year 2006 2007 2008 2009 2010 2011 2012
Production, Total 2 38 65 130 139 144 146
Advanced Only 0 0 0 0 0 0 0
Imports 0 0 0 0 0 0 0
Exports 0 0 0 0 0 0 0
Consumption 2 38 65 130 139 144 146
Ending Stocks 0 0 0 0 0 0 0
Production Capacity - Conventional No. of Biorefineries 10 12 12 12 12 12 12
Capacity (Mil. Liters) 150 325 325 395 395 395 395
Capacity Use (%) 1% 12% 20% 33% 35% 36% 37%
Production Capacity - Advanced
No. of Biorefineries 0 0 0 0 0 0 0
Capacity (Mil. Liters) 0 0 0 0 0 0 0
Capacity Use (%) - - - - - - -
Feedstock Use - Conventional (1,000 MT) Feedstock A 1 70 65 130 139 144 146
Feedstock B 0 0 0 0 0 0 0
Feedstock C 0 0 0 0 0 0 0
Feedstock D 0 0 0 0 0 0 0
Feedstock Use - Advanced (1,000 MT)
Feedstock A 0 0 0 0 0 0 0
Feedstock B 0 0 0 0 0 0 0
Feedstock C 0 0 0 0 0 0 0
Feedstock D 0 0 0 0 0 0 0
Notes:
1. 2008-2010 imports, production, no. of distilleries and their capacities are based on the 2010 Biofuels
Report by of the NBB and the September 2010 update of the Philippine Biofuels
Program.
2. 2006-07 and 2011-12 numbers are Post’s estimates.
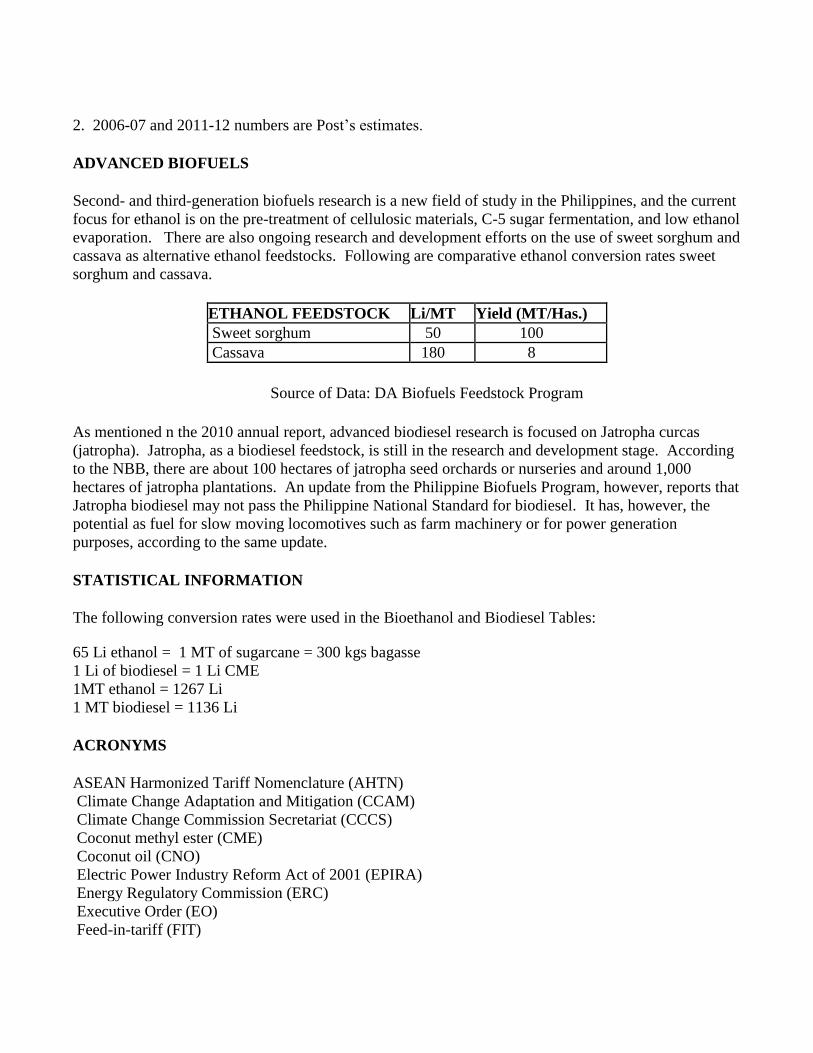
ADVANCED BIOFUELS
Second- and third-generation biofuels research is a new field of study in the Philippines, and the current
focus for ethanol is on the pre-treatment of cellulosic materials, C-5 sugar fermentation, and low ethanol
evaporation. There are also ongoing research and development efforts on the use of sweet sorghum and
cassava as alternative ethanol feedstocks. Following are comparative ethanol conversion rates sweet
sorghum and cassava.
ETHANOL FEEDSTOCK Li/MT Yield (MT/Has.) Sweet sorghum 50 100
Cassava 180 8
Source of Data: DA Biofuels Feedstock Program
As mentioned n the 2010 annual report, advanced biodiesel research is focused on Jatropha curcas
(jatropha). Jatropha, as a biodiesel feedstock, is still in the research and development stage. According
to the NBB, there are about 100 hectares of jatropha seed orchards or nurseries and around 1,000
hectares of jatropha plantations. An update from the Philippine Biofuels Program, however, reports that
Jatropha biodiesel may not pass the Philippine National Standard for biodiesel. It has, however, the
potential as fuel for slow moving locomotives such as farm machinery or for power generation
purposes, according to the same update.
STATISTICAL INFORMATION
The following conversion rates were used in the Bioethanol and Biodiesel Tables:
65 Li ethanol = 1 MT of sugarcane = 300 kgs bagasse
1 Li of biodiesel = 1 Li CME
1MT ethanol = 1267 Li 1 MT biodiesel = 1136 Li
ACRONYMS
ASEAN Harmonized Tariff Nomenclature (AHTN) Climate Change Adaptation and Mitigation (CCAM) Climate Change Commission Secretariat (CCCS) Coconut methyl ester (CME) Coconut oil (CNO) Electric Power Industry Reform Act of 2001 (EPIRA) Energy Regulatory Commission (ERC) Executive Order (EO) Feed-in-tariff (FIT)
Global Trade Atlas (GTA) Jatropha curcas (jatropha) Kilo (kg) Kilowatt-hours (KWh) Metric ton (MT) Million Liter (MLi) Megawatt ( MW) Motor Vehicle Development Program (MVDP) National Biofuels Board (NBB) National Renewable Energy Board (NREB) National Renewable Energy Program (NREP) Philippine Coconut Authority (PCA) Philippine Department of Agriculture (DA) Philippine Department of Energy (DOE) Philippine Energy Plan (PEP) Philippine government (GPH) Philippine Land Transportation Office (LTO) Philippine Tariff Commission (PTC) Republic Act 9513 (RA 9513) Renewable energy (RE) Republic Act 9367 (RA 9367)


