
University of South CarolinaScholar Commons
Theses and Dissertations
2014
Phenotypes and Variants in Cases Submitted for X-Linked Intellectual Disability (XLID) Gene PanelTestingMichael J. FriezUniversity of South Carolina - Columbia
Follow this and additional works at: https://scholarcommons.sc.edu/etd
Part of the Genetics and Genomics Commons
This Open Access Thesis is brought to you by Scholar Commons. It has been accepted for inclusion in Theses and Dissertations by an authorizedadministrator of Scholar Commons. For more information, please contact [email protected].
Recommended CitationFriez, M. J.(2014). Phenotypes and Variants in Cases Submitted for X-Linked Intellectual Disability (XLID) Gene Panel Testing. (Master'sthesis). Retrieved from https://scholarcommons.sc.edu/etd/2586
Phenotypes and Variants in Cases Submitted for X-Linked Intellectual Disability (XLID) Gene Panel Testing
by
Katherine Leigh Hill-Harfe
Artium Baccalaureus Dartmouth College, 1992
Doctor of Philosophy
Emory University, 2000
Submitted in Partial Fulfillment of the Requirements
For the Degree of Master of Science in
Genetic Counseling
School of Medicine
University of South Carolina
2014
Accepted by:
Michael J. Friez, Director of Thesis
R. Curtis Rogers, Reader
Peggy Walker, Reader
Lacy Ford, Vice Provost and Dean of Graduate Studies

ii
© Copyright by Katherine Leigh Hill-Harfe, 2014 All Rights Reserved.

iii
Abstract
Intellectual disability (ID) refers to reduced cognitive function, apparent before
the age of 18, that negatively affects a person's learning and adaptive capacity.
Approximately 1-3% of the population is affected with ID, males more than females, and
most in the mild-to-moderate range. ID creates financial, logistical and psychosocial
challenges for affected persons and their families and caregivers. It is estimated that up
to 50% of ID has a genetic cause. Molecular genetic diagnosis may help in obtaining
services and has important implications for family members, but can be elusive. Genes
causing ID are known to be over-represented on the X chromosome. Over 160 X-linked
intellectual disability (XLID) syndromes and > 100 XLID genes have been identified to
date. Greenwood Genetic Center (GGC) offers a next-generation sequencing panel of
approximately 90 XLID genes. The diagnostic potential offered by large gene panels is
offset by the challenges of interpreting variants of uncertain significance (VUS). In this
study, molecular and clinical data from 592 cases submitted for XLID panel testing were
evaluated for patterns of phenotype and genotype, in order to further the understanding of
XLID. We found a low pathogenic hit rate, a high VUS-only rate and a general absence
of statistically significant phenotypic patterns. These results highlight the need for
appropriate patient selection, full and accurate phenotype reporting and open sharing of
information in order to interpret and learn from the results of genetic testing.
iv
Table of Contents
Abstract .............................................................................................................................. iii
List of Tables .......................................................................................................................v
Chapter 1: Introduction ........................................................................................................1
1.1 Intellectual Disability Overview .................................................................................1
1.2 Living With and Caring For Intellectual Disability ....................................................2
1.3 X-linked Intellectual Disability...................................................................................4
1.4 Selected Features Often Associated with Intellectual Disability ................................5
1.5 Genetic Testing For Intellectual Disability .................................................................9
1.6 Selected X-linked Intellectual Disability Genes .......................................................14
Chapter 2: Phenotypes and Variants in Cases Submitted for X-Linked Intellectual Disability (XLID) Gene Panel Testing ...........................................25
2.1 Abstract .....................................................................................................................25
2.2 Introduction ...............................................................................................................26
2.3 Methods and Materials ..............................................................................................28
2.4 Results .......................................................................................................................31
2.5 Discussion .................................................................................................................35
Chapter 3: Conclusions ......................................................................................................53
References ..........................................................................................................................54
Appendix A: X-linked Intellectual Disability Panel Variants ...........................................69
v
List of Tables
Table 2.1. Phenotype Frequencies, All Cases ...................................................................43
Table 2.2. Phenotype Frequencies, IDEAS Cases ............................................................44
Table 2.3. Phenotype Frequencies, Non-IDEAS Cases ....................................................45
Table 2.4. Chi Square Analysis of Phenotypic Associations, All Cases ...........................46
Table 2.5. Chi Square Analysis of Phenotypic Associations, IDEAS cases .....................47
Table 2.6. Pathogenic Variants .........................................................................................48
Table 2.7. Genes with Variants of Uncertain Significance ...............................................49
Table 2.8. Non-synonymous Variants Associated with Skewed Maternal X-inactivation .....................................................................................................52
Table A.1. X-linked Intellectual Disability Panel Variants ..............................................69
1
Chapter 1. Introduction
1.1 Intellectual Disability Overview
Intellectual Disability (ID) is defined as reduced intellectual capacity that is
apparent before the age of 18 years, and which creates significant limitations on the
individual's ability to learn, understand, communicate and adapt (American Association
on Intellectual and Developmental Disabilities (AAIDD), 2014). Intellectual capacity is
commonly reported in terms of an Intelligence Quotient, or IQ score. Average IQ is
defined as a score of 100. ID is diagnosed when an individual's IQ falls > 2 standard
deviations below the age-appropriate mean (Tirosh & Jaffe, 2011). ID is considered to
begin at IQ of 70-75 and below, and can be characterized as mild, moderate, severe or
profound, with measurable decreases in the individual's functional capacity with
increasing ID severity. Approximately 1-3% of the population is affected with ID, most
in the mild-to-moderate range. Prevalence of ID is 30-40% higher in males, perhaps
reflecting the influence of X-linked genes on brain development and function (Leonard &
Wen, 2002; Nguyen & Disteche, 2006). Individuals with ID may have difficulty living
independently, securing or maintaining employment or caring for themselves. This
creates financial and logistical challenges for the affected individuals and for their
families, caregivers, and communities.
2
ID may exist as part of a recognizable, consistent constellation of intellectual,
physical and/or functional anomalies that are due to a single underlying etiology, in
which case it is considered syndromic ID. Common examples include Down syndrome,
Fragile X syndrome and untreated Phenylketonuria (PKU). On the other hand, in non-
syndromic forms, ID may be the only finding, brought to attention by the child's failure to
develop along a typical time course, or the loss of developmental milestones. There may
be other anomalies that do not fall within a recognizable pattern. While some reports
state that only 20% of all ID has an identifiable cause (Rauch et al., 2006), others
estimate that genetic factors may contribute in up to 85% of all cases (Curry et al., 1997).
1.2 Living With and Caring For Intellectual Disability
By definition, individuals with ID face difficulties in conducting the tasks of daily
living. They require assistance ranging from minor supervision and aid to round-the-
clock, total care. In addition to their intellectual challenges, individuals with ID may
have significant medical and behavioral problems that must be managed. Studies have
demonstrated that the responsibility for care falls mainly on families, most particularly
mothers, a majority of whom may not have additional, outside employment (Rowbotham,
Cuskelly, & Carroll, 2011). Caregivers must personally provide care, arrange and attend
medical and service appointments, negotiate with parties such as educators and third
party payors, and pay for expenses related to care and services for their family member
with ID. This, compounded with the additional expense of care for a disabled child or
adult, places enormous strain on caregivers. The ability to provide care is directly related
to socioeconomic status and age, with older and younger parents having fewer resources
than those in the 45-to-54 age group (Parish, Rose, & Swaine, 2010). Moreover,

3
intellectual disability is more common in individuals of lower socioeconomic status,
meaning that the population with the fewest resources for providing care and obtaining
services for disabled individuals has the greatest need of those services (Emerson, 2012).
Children with ID grow up to be adults with ID, who continue to require lifelong
supervision and care. The burden and expense to their families/caregivers is therefore
lifelong as well. As parents age, there can be considerable distress surrounding issues of
care beyond the time the parents are able to provide it themselves (Dillenburger &
McKerr, 2011). As many as 62% of caregivers have no alternative care plan in place for
if or when they are no longer able to provide care personally (Anderson, Larson &
Wuorio, 2011). This has become an issue of increasing significance as care and life
expectancy for individuals with intellectual disability have improved markedly over the
last several decades. For instance, life expectancy for individuals with Down syndrome
in the 1980s was approximately 25 years, but in the late 1990s had increased to 49 and is
currently estimated at the mid-50s (Coppus, 2013; Yang, Rasmussen, & Friedman, 2002).
As with any aging persons, individuals with ID face increasing health concerns as they
grow older, a factor that increases the complexity and cost of their care (Strydom et al.,
2010), even as their parents experience the challenges of aging themselves (Bittles et al.,
2002).
A major source of services for the intellectually disabled is state-funded
assistance programs, the history of which is nicely reviewed by Harold Pollack (Pollack,
2011). The largest of these is Medicaid, which funds not only medical services, but other
educational and disability resource services. The recent decline in the United States
economy and associated tax revenue has necessitated cost-cutting measures among state

4
governmental agencies, including those programs providing services for the disabled.
The early 2000s saw a dramatic drop in the average yearly increase in state funding for
disability services, from 6.6% to less than 2%. Between 2008 and 2009, 47 states
experienced percentage decreases and there was a drop in actual dollar expenditures for
disability services in 23 states (Braddock et al., 2011). Perhaps most unfortunately, the
states with the lowest pre-recession disability funding levels (that is, states in which the
disabled were already at a disadvantage) were also the states that implemented the
deepest cuts in disability services funding (Pollack, 2011).
In addition to the financial and logistical burdens borne by individuals with ID
and their families, there are social burdens as well. Intellectual impairment remains one
of the disabilities that is least understood and accepted in many modern cultures (Scior,
2011). The lack of awareness can lead to negative attitudes about people with ID,
manifested in such ways as bullying, violent/hate crimes, discrimination, avoidance, lack
of inclusion and stigmatization (Ali, Hassiotis, Strydom, & King, 2012; Scior, 2011;
Werner, Corrigan, Ditchman, & Sokol, 2012). Stigmatization may be directed not just
toward individuals with ID, but toward their families, friends and associates as well,
known as "courtesy" or "affiliate" stigma (Ali et al., 2012). Tragically, affected
individuals exposed to such negative attitudes often internalize them and adopt self-
deprecating thoughts and attitudes ("self-stigma"), a phenomenon that has been
documented in individuals with ID for many decades (Ali et al., 2012).
1.3 X-Linked Intellectual Disability (XLID)
By definition, X-linked ID follows an X-linked pattern of inheritance, whether or
not a specific X-linked genetic cause has been identified. Alternatively, it is ID that is
5
caused by mutation of an X-linked gene, with or without a family history. Depending on
the underlying etiology, an X-linked family history may present with affected males only;
with both males and females affected, equally or differentially; or with only females
affected, due to male lethality. XLID may be syndromic (ID plus additional features),
non-syndromic (ID only), or neuromuscular (for instance, associated with
Duchenne/Becker muscular dystrophy). Approximately 160 XLID syndromes have been
described; however, the majority of XLID is non-syndromic (Stevenson, Schwartz &
Rogers 2012; Lubs, Stevenson & Schwartz, 2012). It is estimated that ~10% of genes on
the X chromosome, or at least 120 genes, may contribute to XLID; over 100 of these
have been identified to date (Lubs, Stevenson & Schwartz et al., 2012).
1.4 Selected Features Often Associated with Intellectual Disability
1.4.1 Abnormal head size.
The biological function of the cranium (brain vault of the skull) is to enclose and
protect the brain within it. Like a motorcycle helmet, this function is best served when
the fit is neither too loose nor too tight. The dimensions of the cranium are therefore
determined by the volume of the brain. Measurement of the occipito-frontal
circumference (OFC) is a useful clinical tool for estimating whether an individual's brain
volume falls within the expected range for their age and sex. Head size in ID may be
smaller (microcephaly) or larger (macrocephaly) than expected. In general, a relative
head size that changes over time (that is, an increasing or decreasing OFC percentile) is
more worrisome than an OFC that remains stable in terms of percentile. It should be
noted that a recent meta-analysis of worldwide human growth data has demonstrated that
OFC means can vary significantly according to geographical, national or ethnic
6
backgrounds (Natale & Rajagopalan, 2014). The authors concluded that universal use of
the World Health Organization (WHO) OFC standards may lead to inappropriate
characterization of young children as having micro- or macrocephaly.
Microcephaly, its causes, evaluation and implications have been thoroughly
discussed in a recent review (Woods & Parker, 2013). Primary microcephaly is often
defined as an OFC at least two standard deviations smaller than the mean at birth (and
often detected prenatally). Some would argue that three standard deviations is a more
appropriate cutoff, and that head shape should be taken into consideration as well (Woods
& Parker, 2013). In primary microcephaly, the fetal brain does not grow to typical size,
therefore the cranium also remains small. Brain architecture may be essentially normal
or may show underdevelopment and/or abnormal formation of specific structures. The
causes of primary microcephaly are many (Woods & Parker, 2013) and include failure of
neurogenesis due to insults such as single gene defects (e.g., autosomal recessive primary
microcephaly); chromosomal imbalance (e.g., Trisomy 21 or 7q11.23 deletion a.k.a.
Williams syndrome); or infection (e.g., cytomegalovirus (CMV) or Toxoplasmosis). It
may also arise from physical damage such as hypoxia/ischemia or toxicity due to
uncontrolled maternal PKU or other metabolic defects. Individuals with primary
microcephaly will usually have some degree of intellectual disability and developmental
delay, ranging from mild to severe.
Secondary, acquired or progressive microcephaly occurs when the brain (and
head) fails to grow adequately during infancy and childhood. Head circumference may
be small to normal at birth, but eventually becomes significantly smaller than average.
The slowing or cessation of postnatal brain growth can be caused by any factor, intrinsic
7
or extrinsic, that interferes with proliferation and maintenance of neurons (Woods &
Parker, 2013).
Macrocephaly, by contrast, refers to an OFC that is greater than two (or three; see
above) standard deviations larger than average, suggesting a larger-than-average brain
size. This is not necessarily due to an increased amount of brain tissue, but may be due to
enlargement of the ventricles and accumulation of fluid within the brain
(ventriculomegaly or hydrocephalus), which in itself can be medically problematic.
Macrocephaly may or may not be seen with autism spectrum disorders, (Barnard-Brak,
Sulak, & Hatz, 2011; Grandgeorge, Lemonnier, & Jallot, 2013), which are often but not
always associated with intellectual deficits. Macrocephaly is a feature of many genetic
conditions, with or without associated ID, but may also be a benign familial trait.
1.4.2 Seizures.
Seizures are involuntary, abnormal electrical events in the brain that alter the
movement, senses and/or consciousness of the individual experiencing the seizure.
Although the acute seizure activity is usually not continuous, individuals with seizure
disorders demonstrate abnormal brain wave patterns by electroencephalogram (EEG)
even when not undergoing a (recognizable) seizure. There is an extensive list of seizure
disorder classifications according to such criteria as physical manifestations, area of the
brain affected, precipitating events, etc. (Berg et al., 2010; Shorvon, 2011); however all
seizures result from an alteration of the normal electrical discharge pattern(s) of the brain.
Seizures are very common with ID disorders, an unsurprising finding given that both
result from disruption of the normal neuronal network. Persons of normal intellect may
8
also have seizure disorders. Unfortunately, seizures themselves can result in damage to
the brain and acquired ID.
1.4.3 Autism spectrum disorder.
Autism spectrum disorder (ASD) encompasses a range of conditions that share
the features of impaired social relationships, impaired language and communication, and
repetitive behaviors and/or narrow range of interests (Miles, McCathren, Stichter &
Shinawi, 2013). Signs and symptoms are often apparent in early childhood or infancy.
Features may develop gradually after an initially "normal" period of development, and in
some cases (30%) may involve regression, or loss of developmental milestones. ASD
may be syndromic ("complex") or non-syndromic ("essential"), but involves intellectual
disability in 50-75% of cases. Seizure disorders are a common co-morbidity, occurring in
about 25% of affected individuals. Up to 75% of people with ASD experience lifelong
disability associated with the diagnosis. Even those with average intellectual ability often
have trouble living independently as adults (Farley et al., 2009).
The prevalence of ASD in the United States has increased rapidly in recent years.
The Autism and Developmental Disabilities Monitoring (ADDM) Network within the
Centers for Disease Control and Prevention (CDC) periodically generates reports on ASD
prevalence, based on data about 8-year-old children at selected surveillance sites around
the country (Centers for Disease Control and Prevention, 2014). In 2000 and 2002, the
ADDM Network-reported ASD prevalence was approximately 1 in 150 children. In
2006, the prevalence was 1 in 110, and in 2008, ASD was found in 1 in 88 children.
On March 28, 2014, the ADDM Network reported that, as of 2010, 1 in 68
children in the United States had been diagnosed with ASD (ADDM Network, 2014).

9
This figure varied considerably according to demographic characteristics. Consistent
with prior data, males (1 in 42) were affected 4 to 5 times more commonly than females
(1 in 189). Intellectual disability was reported in 31% of children, with another 23%
falling in the borderline range (IQ 70-85). These rates are lower than previously
reported, continuing the previous decade's trend of decreasing association of ID with
ASD. It follows that the increased prevalence of ASD is composed substantially of
individuals with average or higher intellectual ability. Females were more likely than
males to have ASD with associated ID (36% of affected females vs. 30% of males).
Caucasian (non-Hispanic) children were much more likely to be diagnosed with ASD
than either Hispanic or African American children, and were less likely to have
associated ID. ASD with ID was most frequent in African-American children. There
was less demographic stratification among children with ASD and ID than in those with
ASD alone. Regional prevalence varied also, from 1 in 175 in Alabama to 1 in 45 in
New Jersey. The ADDM Network postulated that at least some of the demographic and
temporal variation in prevalence is due to factors such as variable diagnostic practices
and geographical migration driven by access to services.
1.5 Genetic Testing for Intellectual Disability
1.5.1 Genetic testing methods and intellectual disability.
The ability to perform genetic testing for ID was established in 1959 with the
recognition that cells from individuals with Down syndrome contained 47 chromosomes
(rather than 46) by cytogenetic or karyotype analysis (Lejeune, Gauthier, & Turpin,
1959). Cytogenetic analysis is able to detect large-scale alterations in genomic dosage or
structure, as in the above-mentioned case of Down syndrome (the presence of an extra

10
entire chromosome 21 or significant portion thereof) or Fragile X syndrome where the
causative trinucleotide expansion changes the appearance of the X chromosome under
certain cell culture conditions, creating a "fragile" site (Lubs, 1969). Fragile X repeat
expansions are now assessed using molecular methods: polymerase chain reaction (PCR)
amplification of repeat regions and/or Southern blot protocols. Up to 15% of individuals
with ID may have genomic aberrations that are cytogenetically detectable (Leonard &
Wen, 2002). Although different preparations may affect the resolution of karyotyping,
generally changes must encompass a minimum nucleotide size of approximately 5-10
megabases (Mb; one million nucleotide bases) to be visible by classical cytogenetic
techniques. Interphase fluorescence in situ hybridization (FISH) may increase the
resolution, with the ability to detect changes at the level of 100s of kilobases (kb; one
thousand nucleotide bases) (Vorsanova, Yurov, & Iourov, 2010). This resolution is still
at the whole-gene/several gene level in many cases. More recently, array-based
techniques such as comparative genomic hybridization (or aCGH) have been employed to
recognize chromosomal microdeletions and microduplications that are not visible by
cytogenetic methods. While aCGH may identify putative pathogenic variants in an
additional 15% of patients with ID over those whose underlying genetic etiologies are
identified by the classical cytogenetic techniques, microarray studies have led to the
discovery of an enormous degree of copy number variation between individual genomes,
much of which is of unclear significance (Bui, Vetro, Zuffardi, & Shaffer, 2011). For
instance, a recent study of aCGH in individuals with ID uncovered sixteen
microduplications or microdeletions in twelve patients, only five of which were de novo
and presumably pathogenic (Zrnova, Vranova, Slamova, Gaillyova, & Kuglik, 2011).
11
Resolution of microarray-based analysis may be as fine as several kilobases, dependent
upon the specific microarray platform design. Some arrays are designed to assess the
presence or absence of specific mutations only, including single-nucleotide changes.
These are often carrier screening panels relying on foreknowledge of, and tiling of,
probes for anticipated mutations; they do not assay any changes not specifically tiled on
the array. All of these methods have clinical utility, but are incapable of detecting
unanticipated changes at the single- or oligonucleotide level that may deleteriously alter
gene function.
Thus, when hunting for causative mutations, full gene sequencing is often the
technique most likely to yield results. There is a current expectation in the medical
community that, due to the rapid advancement of technology and decreasing cost, whole-
genome (or at least whole-exome) sequencing will soon become a routine, standard-of-
care medical test (Brunham & Hayden, 2012; Drmanac, 2012). Such genome-wide
sequencing will inevitably uncover thousands of variants, pathogenic or otherwise. The
subsequent data analysis, data storage, genetic counseling and follow-up resource
requirements, as well as ethical considerations regarding reporting of incidental or
uncertain findings, are astronomical and currently impractical for most applications. A
viable compromise is to perform full-gene or full-exome sequencing on a condition-
specific gene set. This approach has the benefit of simultaneously reducing the data
management burden and possible genetic counseling complexities while maintaining a
relatively high mutation identification rate. Recently published studies have applied this
strategy of gene panel sequencing to, for instance, childhood cancer (Plon et al., 2011);

12
epilepsy (Lemke et al., 2012); hereditary hearing loss (Baek et al., 2012); and
mitochondrial disease (Calvo et al., 2012).
1.5.2 X-linked intellectual disability gene panel tests.
Current estimates suggest that > 10% of all ID affecting males may be due to X-
linked genetic causes (Gecz, Shoubridge, & Corbett, 2009; Ropers, 2008). Genetic loci
contributing to ID are significantly over-represented on the X chromosome compared
with the autosomes (Lubs et al., 2012). In addition, X-linked genes are more likely to be
highly expressed in brain than autosomal genes (Nguyen & Disteche, 2006). Therefore,
XLID genes may be a reasonable place to look when searching for a genetic cause for ID,
even when there is no clear family history with X-linked inheritance pattern. City of
Hope Molecular Diagnostic Laboratory currently offers a Sanger sequencing panel of 8
XLID genes (City of Hope Molecular Diagnostic Laboratory, 2014). A handful of
commercial laboratories are currently offering XLID NextGen sequencing panels: Ambry
Genetics (81 genes, Ambry Genetics, 2014); the University of Chicago Genetic Services
(75 genes, the University of Chicago Genetic Services, 2014); Emory Genetics
Laboratory (92 genes, Emory Genetics Laboratory, 2014); and Greenwood Genetic
Center (GGC) (90 genes, GGC, 2014).
1.5.3 Greenwood Genetic Center X-linked intellectual disability panel.
The Greenwood Genetic Center is a not-for-profit clinical and diagnostic genetics
services provider based in Greenwood, SC. Genetic testing services are available for a
wide variety of conditions, including intellectual disability. In 2010 GGC began offering
a next-generation sequencing panel test of 92 genes associated with X-linked intellectual
disability, developed in conjunction with Emory Genetics Laboratory. Since the panel's
13
inception, GGC has revised its reporting practices to conform with updated information
regarding the involvement of specific genes in XLID. Current GGC literature states that
the panel comprises 90 XLID genes; however, results from only 89 genes were being
reported at the time of this study (M. Friez, personal communication, February 28, 2014).
These genes are located throughout the length of the X chromosome and include genes
associated with both well-defined syndromes and non-syndromic ID.
Coding exons and flanking intronic sequences of the genes within the XLID panel
are amplified and sequenced using next-generation sequencing (NGS) methods. The
results are then subjected to bioinformatic analysis (M. Friez, personal communication,
May 16, 2013). Laboratory results are reviewed by at least two Directors, and identified
variants are confirmed by Sanger sequencing. If necessary, sequence analysis of variants
of unknown significance (VUS) is carried out on samples from appropriate family
members (parents or siblings when available) to help distinguish pathogenic and benign
variants. The testing process, including bioinformatics analysis, takes approximately
three months to complete.
A checklist of clinical features is included as part of the test ordering
documentation. Ordering physicians are asked to supply a pedigree and photographs of
the affected individual. Cases submitted with complete clinical information, including
photographs, are eligible for assessment by the GGC Intellectual Disability Evaluation
and Advice System (IDEAS) team, an international panel of experts in clinical genetics.
Of the first 100 cases submitted for XLID panel analysis, over 50% did not include
clinical information. Only 22 of 100 cases were provided with sufficient clinical
information, including photographs, to be eligible for clinical review by the IDEAS team.
14
To date, the proportion of samples provided with complete clinical information remains
at about 20% (M. Friez, personal communication, April 4, 2013).
1.6 Selected X-linked Intellectual Disability Genes
1.6.1 FMR1: Fragile X syndrome and related disorders
Fragile X syndrome is the most common inherited cause of intellectual disability,
with an incidence of about 1 in 3600 to 1 in 4000 males, and 1 in 4000 to 1 in 6000
females (National Fragile X Foundation, 2014). Males with Fragile X syndrome have
recognizable physical characteristics, including a long, narrow face; large and prominent
ears; high arched palate; connective tissue abnormalities such as hyperextensible joints
and mitral valve prolapse; and macroorchidism (Gallagher & Hallahan, 2012; Saul &
Tarleton, 2012). Intellectual function is usually in the moderate to severe disability
range. Cognitively, individuals with Fragile X often fall within the autism spectrum and
have a characteristic intellectual-psychological profile that includes executive and
memory deficits; attention deficits; obsessive tendencies; anxiety, aggression and social
avoidance. Females with Fragile X syndrome have a similar, but usually less severe,
phenotype, with only ~25% of carrier females having IQ < 70 (Gallagher & Hallahan,
2012; Hagerman et al., 1992).
The gene responsible for Fragile X syndrome, FMR1, is located at Xq27.3. The
gene product, Fragile X Mental Retardation Protein (FMRP), is an RNA-binding protein
involved in translational regulation of many other proteins (Wang, Bray, & Warren,
2012). The Fragile X locus was originally located, and named, due to the appearance of a
"fragile" site on affected chromosomes under certain cell culture conditions (Lubs, 1969).
This locus was later found to contain the FMR1 gene (Verkerk et al., 1991). The
15
promoter region of the FMR1 gene contains a tract of CGG trinucleotide repeats, the
length of which is highly variable. With an increasing number of repeats, the allele
becomes more unstable and vulnerable to slippage during replication, leading to
expansion (Fu et al., 1991). Interestingly, this instability is primarily manifested in
oogenesis, therefore alleles may expand when passed from female carriers but are
unlikely to expand when transmitted by a male carrier. Fully affected individuals have an
allele size of more than 200, and sometimes many hundreds, of repeats. This significant
expansion in the repeat tract triggers abnormal hypermethylation of the affected allele,
shutting down gene expression and depriving the cell of FMRP. Loss of FMRP and the
resultant misexpression of multiple proteins in neurons leads to improper synapse
formation. This is thought to be directly responsible for the intellectual deficits seen with
Fragile X syndrome.
Tracts of 55-200 CGG repeats are known as premutations. These unstable alleles
carry a risk of expansion with each female generation that is correlated with the number
of repeats; the larger the allele, the greater the chance of expansion to a full mutation. In
unaffected individuals, the number of CGG repeats ranges up to about 54, however
between 45-54 repeats is considered a "gray zone" that is at risk for slight expansion.
This expansion may create a premutation allele, but not a full mutation. The chance of
affected children for a "gray zone" allele carrier is therefore very low, but her
grandchildren may be at risk if her daughter inherits a premutation allele.
In addition to the classic Fragile X syndrome, pre- and full-mutation alleles of
FMR1 can lead to several other disorders. Up to 20% of female premutation carriers
experience primary ovarian insufficiency or POI, a condition that causes early ovarian
16
failure/menopause and can lead to infertility (Hundscheid, Braat, Kiemeney, Smits, &
Thomas, 2001; Allingham-Hawkins et al., 1999; Conway, Hettiarachchi, Murray, &
Jacobs, 1995). POI is not associated with full mutation alleles. Female premutation
carriers may also experience anxiety or major depressive disorders (Roberts et al., 2009)
and other problems such as thyroid disease and fibromyalgia (Rodriguez-Revenga et al.,
2009). Male or female premutation carriers are at risk for Fragile X-associated Tremor
Ataxia syndrome (FXTAS), an adult-onset neurodegenerative condition involving both
neuromuscular and cognitive decline (Coffey et al., 2008; Hagerman et al., 2001).
Because of the association of autism spectrum features with Fragile X syndrome, Fragile
X remains a first-tier genetic test for individuals with autistic features as well as those
with ID.
1.6.2 ARX
A detailed review of ARX genotypes and phenotypes has recently been published
(Shoubridge, Fullston, & Gecz, 2010). XLID due to ARX mutation ranges from mild to
severe (Stromme, Mangelsdorf, Scheffer, & Gecz, 2002) and is most often syndromic,
although ID may be isolated in some cases. When syndromic, ARX-related neurological
features include seizures (including infantile spasms), autism, dysarthria (motor speech
disorder) and dystonia (involuntary muscle contractions) (Shoubridge et al., 2010).
When physical malformations are present, they are limited to the brain (lissencephaly,
hydranencephaly and agenesis of the corpus callosum) and genitalia (Kato et al., 2004).
Chronic diarrhea has also been reported in severely affected individuals (Kato et al.,
2004). Named syndromes associated with ARX mutations include West syndrome (X-
linked infantile spasms) (Kato, Das, Petras, Sawaishi, & Dobyns, 2003) and Proud
17
syndrome (X-linked intellectual disability, agenesis of the corpus callosum, and abnormal
genitalia) also known as X-linked Lissencephaly Abnormal Genitalia syndrome or XLAG
(Kitamura et al., 2002; Proud, Levine, & Carpenter, 1992).
Mutations in the ARX gene have been found in up to 7.5% of families
demonstrating an apparent XLID (Shoubridge et al., 2010; de Brouwer et al., 2007).
Almost every mutation class has been reported; however, by far the most common is a
recurring, 24-base pair duplication that increases the gene's second polyalanine tract from
12 to 20 alanine residues. This duplication may cause syndromic or non-syndromic ID,
tending toward the milder end of the spectrum, but demonstrates significant phenotypic
variability both within and between families (Turner, Partington, Kerr, Mangelsdorf, &
Gecz, 2002). In general, however, ARX genotype-phenotype correlation is fairly
consistent (Olivetti & Noebels, 2012). Female carriers of ARX mutations range from
completely asymptomatic (often associated with mutations causing milder phenotypes in
males) to significantly affected (Bettella et al., 2013; Bonneau et al., 2002; Kato et al.,
2004; Proud et al., 1992; Scheffer et al., 2002).
1.6.3 DMD
DMD is the largest gene in the human genome, spanning 2.4 megabases of
genomic sequence on Xp21.2. DMD encodes the protein dystrophin, a component of a
multiprotein complex responsible for linking the muscle cell cytoskeleton to the
extracellular matrix, thereby stabilizing the cell against contraction-induced damage;
hence, the dystrophinopathies are primarily muscular disorders. Incidence of
dystrophinopathies is estimated at 1:3500 - 1:6000 male births (National Center for
Biotechnology Information (NCBI), 2014; Flanigan, 2012). Affected males are normal at

18
birth, but begin to experience muscle degeneration and weakness in childhood, eventually
losing the ability to walk or perform self-care. Cardiac and respiratory muscles
degenerate as well, leading to death most commonly from cardiorespiratory failure.
Disease severity is related to residual quantity and function of dystrophin; Becker type
(BMD) displays later onset and slower progression associated with reduced dystrophin,
while Duchenne type (DMD) has earlier onset, more rapid progression and (near)
complete absence of dystrophin. Females may also express a DMD/BMD phenotype,
due to various phenomena that expose DMD mutations, such as skewed X-inactivation;
uniparental disomy (UPD) X; compound heterozygosity for DMD mutations; and
monosomy X (Turner syndrome) (Darras, Miller & Urion, 2011). Approximately 8-18%
of carrier females eventually develop cardiomyopathy (Hoogerwaard et al., 1999). Rare
families display X-linked cardiomyopathy only in both males and females, associated
with specific mutations in the DMD gene (Neri et al., 2007).
DMD gene mutations, including those responsible for BMD, are frequently
deletions (60-70% of mutations) but also include point and other mutations distributed
throughout the entire coding region (Dent et al., 2005; Flanigan et al., 2009). In general,
deletions that maintain the reading frame allow production of a shortened, but partially
functional, dystrophin molecule and milder phenotype (Monaco, Bertelson, Liechti-
Gallati, Moser, & Kunkel, 1988). Only one DMD founder mutation has been reported
(Flanigan, Dunn, von Niederhausern, Howard, et al., 2009). Consistent with its large
gene size, DMD has a high forward mutation rate, and 30% of Duchenne and 10% of
BMD mutations occur de novo. Because of the high frequency of pathogenic deletions
(and duplications) in DMD, first-line testing when a dystrophinopathy is suspected is
19
multiplex ligation-dependent probe amplification or MLPA. This test gauges the
presence or absence of specific exons according to whether (PCR-based) amplification is
achieved. Second-tier testing for dystrophinopathies is sequence-based analysis for point
mutations or small insertions/deletions not detectable by MLPA.
The DMD gene contains 79 exons and undergoes alternative splicing to generate
many dystrophin isoforms, some of which are brain-specific. Although the primary
feature of dystrophinopathies is muscle weakness and degeneration, up to one-third of
boys with DMD mutations also display some degree of intellectual disability. Since the
combination of intellectual and motor delays (i.e., global delay) is not uncommon in
young children, it may not immediately be apparent that these signs in a toddler boy
indicate the onset of a dystrophinopathy. A DMD mutation causing familial ID with no
muscle weakness has recently been reported (de Brouwer et al., 2013). This in-frame
deletion of a single amino acid affects the brain-specific dystrophin isoform Dp71. For
these reasons, DMD is included in some XLID gene panels, with the understanding that
only about 10-35% of pathogenic DMD mutations are point/small sequence changes
(Darras et al., 2011). However, NextGen sequencing may still identify larger deletions
because of failure to amplify or reduced read density compared to other exons or genes.
Due to the large size of the gene, sequence variants that are benign or of uncertain
significance are common (Flanigan, Dunn, von Niederhausern, Soltanzadeh, et al., 2009),
creating challenges for interpretation of sequence-based results.
1.6.4 ATRX
ATRX is the causative gene in alpha-thalassemia mental retardation X-linked
(ATR-X) syndrome (Gibbons, Picketts, & Higgs, 1995), which consists of severe

20
intellectual disability, facial, skeletal and urogenital abnormalities and variable, mild
alpha-thalassamia (Gibbons, Brueton, et al., 1995; McPherson, Clemens, Gibbons, &
Higgs, 1995). Incidence of ATRX spectrum disorders is not known. ATRX phenotypes
occur along a continuum that includes mild, non-syndromic ID in the least-affected
individuals (Guerrini et al., 2000; Yntema et al., 2002). Clinical features are rarely seen
in female carriers, nearly all of whom (>95%) demonstrate highly skewed X-inactivation
(XI) patterns (Stevenson, 2010). Reports of affected females demonstrating random XI
(Wada, Sugie, Fukushima, & Saitoh, 2005) or highly skewed inactivation of the non-
mutation-bearing X (Badens et al., 2006) suggest that the skewed XI in carrier females is
protective. The ATRX protein is involved in chromatin remodeling processes, including
DNA replication and gene expression, and has been shown to play a role in certain
cancers. Abnormal chromatin regulation in the absence of ATRX function leads to
dysregulation of multiple genes and pathways (Clynes & Gibbons, 2013; Clynes, Higgs,
& Gibbons, 2013). This, then, provides a plausible selective disadvantage for cells with
active, ATRX mutation-bearing X chromosomes and an explanation for the highly-
skewed XI in unaffected female carriers (Migeon, 2007).
ATRX is a relatively large gene, at 350 kilobases of genomic sequence.
Mutations are found in the zinc finger (exons 7-9) and helicase (exons 17-20) domains in
about 90% of cases.
1.6.5 CASK
Unlike many forms of XLID, CASK-related ID is seen more often in females than
in males. The CASK phenotype classically includes significant to severe ID
accompanied by brain (including optic) malformations, marked microcephaly (onset
21
prenatally or within the first year of life) and distinctive facial features (Moog et al.,
2011; Moog, Uyanik & Kutsche, 2013). Brain imaging consistently shows
pontocerebellar hypoplasia with dilated fourth ventricle. There is reduced gyration in the
cerebral cortex of some, but not all patients. When affected, the male phenotype is
variable ID with or without congenital nystagmus, cerebellar hypoplasia and micro- or
macrocephaly (Hackett et al., 2010; Piluso et al., 2009; Tarpey et al., 2009). CASK
mutations may also be responsible for a subset of FG syndrome, comprising
developmental delay, agenesis of the corpus callosum, macrocephaly, hypotonia,
digestive disturbances and characteristic personality (Piluso et al., 2009).
Genotype-phenotype correlation studies have indicated that CASK mutations
causing phenotypes in females tend to be null/inactivating and male lethal. Male viable
mutations are generally missense and splicing mutations that are expected to be
hypomorphic and may be asymptomatic or penetrant in carrier females (Hackett et al.,
2010; Najm et al., 2008). Mutations causing nystagmus are clustered at the C-terminal of
the protein (Hackett et al., 2010). The CASK protein is a ubiquitous serine protein kinase
that is highly expressed in fetal brain, consistent with the phenotypes of ID and brain
malformation.
1.6.6 PQBP1
PQBP1 encodes a polyglutamine-binding protein that is thought to play a role in
transcriptional and splicing regulation. Mutations in PQBP1 have been identified in
individuals/families with a variety of named syndromes, including Sutherland-Haan,
Hamel, Renpenning, Porteous, and Golabi-Ito-Hall, as well as periventricular heterotopia;
these can now be grouped under "Renpenning spectrum" disorders (Germanaud et al.,
22
2011; Gerrard & Renpenning, 1974; Kalscheuer et al., 2003; Kleefstra et al., 2004;
Kunde et al., 2011; Lubs et al., 2006; Stevenson et al., 2005; Sutherland, Gedeon, Haan,
Woodroffe, & Mulley, 1988). Incidence/prevalence figures are not known. Common
features within the Renpenning spectrum include variable intellectual disability, severe
microcephaly, craniofacial dysmorphism, velar dysfunction, sparse hair, short stature,
lean body habitus, selective muscular atrophy and genital anomalies. However, there is
variability in presentation within families, and between families with identical mutations
(Kalscheuer et al., 2003). Some families demonstrate congenital heart defects, anal
stenosis/atresia, spastic diplegia, hypermetropia, strabismus, hearing loss and/or other
anomalies, while in others, ID is the only phenotype. Autism and
neuropsychological/behavioral problems are common. Features may be stable or
progressive. Female carriers are mostly of normal intelligence, with random XI
(Kalscheuer et al., 2003) (one notable exception reported by Fichera et al., 2005), but
may show a slightly reduced head circumference (Germanaud et al., 2011).
The most common mutations seen in PQBP1 are deletions and duplications of AG
dinucleotides within an (AG)6 tract in exon 4 (Germanaud et al., 2011; Kalscheuer et al.,
2003). These generate frameshifts, leading to premature termination of the protein.
PQBP1 transcripts containing premature STOP codons likely undergo nonsense-mediated
decay, resulting in reduction or absence of PQBP1 protein (Kalscheuer et al., 2003).
Mutant PQBP1 protein has also been shown to be mislocalized throughout the cell rather
than confined to the nucleus (Kalscheuer et al., 2003). Other mutations, including other
deletions and nonsense changes, also lead to premature termination.
23
1.6.7 L1CAM
L1CAM at Xq28 is the gene underlying L1 syndrome spectrum disorders (Legius,
Kaepernick, Higgins, & Glover, 1994; Schrander-Stumpel & Vos, 2010). Phenotypic
features are variable between and within families and include X-linked hydrocephalus
with or without stenosis of the aqueduct of Sylvius, seizures; ID, speech delay,
hypotonia, spastic paraplegia, agenesis of the corpus callosum and adducted thumbs (Vos
et al., 2010). Hirschsprung disease has been reported in individuals with L1 syndrome,
but it is not clear whether this finding is coincidental or influenced by the L1CAM
mutation. ID with L1CAM mutations can range from mild to severe. Brain MRI may be
normal or may reveal subclinical hydrocephalus or other malformations. Approximately
5% of female carriers display mild features of L1 syndrome but are rarely reported to be
severely affected (Kaepernick, Legius, Higgins, & Kapur, 1994; Vos et al., 2010).
L1CAM mutations are almost always single- or oligonucleotide variants detectable by
sequence analysis, and occur de novo about 7% of the time (Vos & Hofstra, 2010).
Mutations that cause premature truncation of the L1CAM protein are associated with a
greater likelihood of death in early childhood compared to missense mutations (Vos et
al., 2010).
1.6.8 KDM5C
KDM5C (also known as JAR1D1C and SMCX) at Xp11.22 encodes lysine (K)-
specific demethylase 5C, a ubiquitously expressed protein involved in chromatin
remodeling through the removal of methyl groups from lysine 4 of histone H3 (Iwase et
al., 2007; Tahiliani et al., 2007). KDM5C was identified as a cause of X-linked
intellectual disability in 2005 and has since been shown to play a role in survival of
neurons and dendritic development (Iwase et al., 2007; Jensen et al., 2005). Loss of
24
DNA methylation has been demonstrated at multiple loci in individuals with KDM5C
mutations (Grafodatskaya et al., 2013), and its depletion via RNA interference results in
de-repression of multiple neuronal target genes (Grafodatskaya et al., 2013; Tahiliani et
al., 2007). Interestingly, downregulation of KDM5C has been proposed as a potential
therapeutic approach in Huntington's disease, to reverse the overexpression of neuronal
genes triggered by mutant huntingtin (Vashishtha et al., 2013).
Like many other XLID genes, KDM5C mutations may lead to syndromic or non-
syndromic forms of ID. Estimates of the KDM5C mutation frequency in XLID families
range from 0.6% to 2.8% (Goncalves et al., 2014; Jensen et al., 2005). When syndromic,
associated features include variable ID, speech delay, short stature, dysmorphic facial
features, genital anomalies, altered muscle tone, ataxia, spastic paraplegia and aggressive
behavior (Goncalves et al., 2014; Jensen et al., 2005; Ounap et al., 2012). Females may
be affected as well as males, at least in part because KDM5C is one of several X
chromosome genes that escape inactivation and are more highly expressed in females
than in males (Johnston et al., 2008; Ounap et al., 2012).
25
Chapter 2
Phenotypes and Variants in Cases Submitted for X-Linked Intellectual Disability
(XLID) Gene Panel Testing1
2.1 Abstract
Intellectual disability (ID) refers to reduced cognitive function, apparent before
the age of 18, that negatively affects a person's learning and adaptive capacity.
Approximately 1-3% of the population is affected with ID, males more than females, and
most in the mild-to-moderate range. ID creates financial, logistical and psychosocial
challenges for affected persons and their families and caregivers. It is estimated that up to
50% of ID has a genetic cause. Molecular genetic diagnosis may help in obtaining
services and has important implications for family members, but can be elusive. Genes
causing ID are known to be over-represented on the X chromosome. Over 160 X-linked
intellectual disability (XLID) syndromes and > 100 XLID genes have been identified to
date. Greenwood Genetic Center (GGC) offers a next-generation sequencing panel of
approximately 90 XLID genes. The diagnostic potential offered by large gene panels is
offset by the challenges of interpreting variants of uncertain significance (VUS). In this
study, molecular and clinical data from 592 cases submitted for XLID panel testing were
evaluated for patterns of phenotype and genotype, in order to further the understanding of
XLID. We found a low pathogenic hit rate, a high VUS-only rate and a general absence
1 Hill-Harfe, K., Ramsey, T.B. Jr., Rogers, R.C., Walker, M. and M.J. Friez. To be submitted to American Journal of Medical Genetics.
26
of statistically significant phenotypic patterns. These results highlight the need for
appropriate patient selection, full and accurate phenotype reporting and open sharing of
information in order to interpret and learn from the results of genetic testing.
2.2 Introduction
Intellectual Disability (ID) is defined as reduced intellectual capacity that is
apparent before the age of 18 years, and which creates significant limitations on the
individual's ability to learn, understand, communicate and adapt (American Association
on Intellectual and Developmental Disabilities, AAIDD, 2013). Intellectual capacity is
commonly reported in terms of an Intelligence Quotient, or IQ score. Average IQ is
defined as a score of 100. ID is diagnosed when an individual's IQ falls > 2 standard
deviations below the age-appropriate mean (Tirosh & Jaffe, 2011). ID is considered to
begin at IQ of 70-75 and below, and can be characterized as mild, moderate, severe or
profound, with measurable decreases in the individual's functional capacity with
increasing ID severity. Approximately 1-3% of the population is affected with ID, most
in the mild-to-moderate range. Prevalence of ID is 30-40% higher in males, perhaps
reflecting the influence of X-linked genes on brain development and function (Leonard &
Wen, 2002; Nguyen & Disteche, 2006).
ID may exist as part of a recognizable, consistent constellation of intellectual,
physical and/or functional anomalies due to a single underlying etiology, in which case it
is considered syndromic ID. Common examples include Down syndrome, Fragile X
syndrome and untreated Phenylketonuria (PKU). Non-syndromic ID may be brought to
attention by the child's failure to develop along a typical time course or the loss of
developmental milestones in the absence of other significant findings.
27
By definition, individuals with ID face difficulties in conducting the tasks of daily
living. In addition to their intellectual challenges, they may have significant medical and
behavioral problems that must be managed. Financial and logistical responsibility for
providing care and services falls primarily on families, which can place enormous
lifelong strain on caregivers. In addition to the financial and logistical burdens borne by
individuals with ID and their families, there are social burdens as well. Intellectual
impairment remains one of the disabilities that is least understood and accepted in many
modern cultures (Scior, 2011). The lack of awareness can lead to negative attitudes about
people with ID, manifested in such ways as bullying, violent/hate crimes, discrimination,
avoidance, lack of inclusion and stigmatization (Ali et al., 2012; Scior, 2011; Werner et
al., 2012). Stigmatization may be directed not just toward individuals with ID, but
toward their families, friends and associates as well, known as "courtesy" or "affiliate"
stigma (Ali et al., 2012). Tragically, affected individuals exposed to such negative
attitudes often internalize them and adopt self-deprecating thoughts and attitudes ("self-
stigma"), a phenomenon that has been documented in individuals with ID for many
decades (Ali et al., 2012).
The availability of state-funded services and assistance for individuals with ID
can fluctuate considerably with changing economic climate. Having a specific molecular
diagnosis may help families obtain needed services. Molecular diagnosis can also help
guide medical management, for instance, by allowing monitoring for known
complications, and provides a means for informed family planning decisions by family
members. An explanation for the child's disability, however, can by itself provide benefit
28
to the family by reducing uncertainty and frustration and allowing future planning
(Lewis, Skirton, & Jones, 2010; Rosenthal, Biesecker, & Biesecker, 2001).
While some reports state that only 20% of all ID has an identifiable cause (Rauch
et al., 2006), others estimate that genetic factors may contribute in up to 85% of all cases
(Curry et al., 1997). Over 100 genes implicated in ID are located on the X chromosome,
accounting in part for the greater incidence of ID in males than in females. The advent of
next-generation (NextGen) sequencing technologies has allowed simultaneous analysis of
large groups of genes more quickly and at lower cost than more traditional Sanger
(dideoxy-) sequencing. Within the last few years, several laboratories have begun
offering NextGen X-linked intellectual disability panels, including Greenwood Genetic
Center (GGC).
We hypothesized that analysis of the clinical and molecular data from cases
submitted for GGC XLID panel testing might yield important insights into the genetic
etiologies and phenotypic patterns of XLID, as well as the overall success of the XLID
panel as a diagnostic tool.
2.3 Materials and Methods
2.3.1 Data collection and curation.
GGC maintains a MEDGIS (Medical Genetics Information System; PSA
Computer Consultants, Winston Salem, NC) database to track and store information on
all patients and samples submitted for analysis. MEDGIS can be queried to retrieve
information based on user-specified search criteria. For this study, MEDGIS was queried
for all samples submitted for clinical testing via the GGC XLID panel from its inception
through June 30, 2013. Extracted data was transferred to an Excel spreadsheet for ease of

29
manipulation. Following generation of the Excel file, 10 samples were chosen at random
and the information in the spreadsheet for those samples was verified against the
MEDGIS record, in order to check for data transfer errors. Cases were then reviewed
individually to make corrections and clarifications and to obtain data not retrieved in the
initial inquiry. During this process, several samples or variants were found to be
inappropriate for inclusion and were excluded from the final data set. These included 7
cases with a prior diagnosis of muscular dystrophy (MD; 6 Duchenne/Becker and one
LAMA2-related) and one with clinically suspected MD; three cases for which the panel
was ordered but never run; one of a pair of affected full brothers who did not represent
independent cases; and seven variants in two genes (NXF5 and ZNF674) for which GGC
is no longer reporting data. In 6/7 cases with NXF5 or ZNF674 variants, the removed
variant was the only variant found, resulting in reclassification of the case from "VUS" to
"No Variant."
2.3.2 Deidentification of data.
Following data curation, study identification numbers were assigned and personal
identifiers were removed from the data set as follows. Patient data in the Excel
spreadsheet was sorted alphabetically by patient's last/family name. In a new column, the
RANDBETWEEN Excel function was used to generate a random number for each of the
patients. The entire data set was then subjected to a 2-tier sort, first by the random
number column and second, by the patients' GGC sample identifiers (Lab ID), to remove
sequential alphabetical or chronological ordering from the list. The re-ordered samples
were then assigned sequential Study Identification (Study ID) numbers. The columns
containing the Study ID, Lab ID and patient name were copied into a new, password-

30
protected Excel workbook to generate a Study Sample Key. Finally, the columns
containing identifying information were removed from the working dataset to create a
deidentified data set for analysis.
2.3.3 Data preparation and statistical analysis.
The data set was prepared for statistical analysis using Microsoft Excel 2008
version 12.2.3 for Mac (Excel). Each patient/case was assigned to a single row. Data
categories, including demographic, phenotypic, genotypic and family studies information,
were assigned to columns. Phenotype information was parsed into the primary categories
of: intellectual disability/developmental disability (ID/DD); autism; seizures;
(craniofacial) dysmorphism; microcephaly; macrocephaly; integumentary (encompassing
skin, hair, nails and teeth); skeletal; stature and/or habitus; heart; central nervous system
(CNS); kidney; genital; hearing; and eyes (structural and/or functional). Additional
columns were created to reflect combinations of phenotypes, for instance, "Any
Urogenital" to reflect kidney, genital or both, or "Any Physical Anomaly" to include any
physical phenotype reported. Each case was marked "Y" in a category if the phenotype
was reported, and "N" if the phenotype was either specifically denied or was not reported.
In one case, the phenotype was given as "multiple congenital anomalies" with no specific
phenotypes reported; this case was marked "Y" for "Any Physical Anomaly" and "N" in
all other categories.
XLID panel variants were classified according to the molecular nature of the
variant and its predicted pathogenicity. Molecular classifications were: synonymous;
missense; nonsense; frameshift (small insertions or deletions leading to a change in
protein reading frame); deletion (larger deletions, including those in intronic regions);
31
insertion (larger insertions or duplications, regardless of whether reading frame was
retained); and regulatory (mutations affecting one or more nucleotides in intronic or
regulatory regions, potentially affecting splicing or translation initiation). Variants
reported by GGC as "pathogenic" or "likely pathogenic" at the time of XLID panel
analysis were considered pathogenic for the purposes of this analysis. All others were
considered variants of uncertain significance (VUS).
Data analysis was performed using Excel and IBM's Statistical Package for Social
Sciences version 22.0 (SPSS). Frequency statistics were generated using both Excel and
SPSS. SPSS was used to test associations between data subsets with chi square analysis.
2.4 Results
2.4.1 Phenotype analysis.
Descriptive statistics of the entire XLID data set and the IDEAS and non-IDEAS
subsets are presented in Table 2.1, Table 2.2 and Table 2.3, respectively. After curation,
there were a total of 592 cases, comprised of 562 male (94.9%) and 30 female (5.1%).
The most common phenotypes reported were ID/DD (80.9%); dysmorphism (35.5%);
autism (29.4%); seizures (22.3%); microcephaly (12.8%); skeletal anomalies (12.2%);
and macrocephaly (10.1%). All other phenotypic categories were reported in less than
10% of cases. In 15 cases (2.5%), one or more physical anomalies were reported, but
ID/DD was not. In 7 cases (1.2%), autism was the only reported phenotype. There was
no phenotypic information provided for 82 cases (13.9%).
The IDEAS set comprised 130 cases, 125 male (96.2%) and five female (3.8%).
Over 99% (129/130) were reported to have ID/DD. The single male case not reported to
have ID/DD was an infant with multiple physical anomalies. Other common phenotypes

32
were dysmorphism (64.6%); autism (41.5%); seizures (31.5%); microcephaly (20.8%);
skeletal anomalies (20.0%); macrocephaly (17.7%); genital anomalies (17.7%) and heart
defects (13.1%). All other phenotypic categories were reported in less than 10% of the
IDEAS cases.
Within the non-IDEAS cases, there were 437 male (94.6%) and 25 female (5.4%)
cases. Phenotype frequencies in this data subset were as follows: ID/DD 75.8%;
dysmorphism 27.3%; autism 26.0%; seizures 19.7%; microcephaly 10.6%; skeletal
10.0% and all other categories < 10% each.
In order to identify phenotypic patterns, chi square analysis was employed to test
associations between phenotypes and combinations of phenotypes within the full (Table
2.4) and IDEAS-only (Table 2.5) data sets. Within the full data set, the majority of
associations examined were not statistically significant, and many failed the criteria for
valid chi square analysis, because one or more cells had an Expected count of less than
five. Among those that were both valid and statistically significant, 28 of 29 were
positive associations. The single negative association was between autism and
microcephaly (p = 0.025). Among the 28 positive associations, 22 involved ID/DD,
including a greater likelihood of ID/DD reported in males than in females (82.2% vs.
56.7%, p = 0.001). Five positive associations involved seizures and physical anomaly
categories. The final positive association was between autism and macrocephaly (p <
0.001).
In addition to associations between phenotypes, we looked at whether there was
any association between the presence of a pathogenic variant and specific phenotypes,
and whether the number of VUS (categorized as VUS Load: 0, low (1-2 VUS) or high (3
33
or more VUS) was associated with any phenotypes. No valid, statistically significant
associations were found.
Within the IDEAS set, only two associations both met the criteria for analytic
validity and returned a statistically significant result. These were a negative association
between autism and microcephaly (p = 0.002) and a negative association between autism
and any reported anomaly of head size or shape (p = 0.035). Autism and macrocephaly
were not found to be significantly associated within the IDEAS data subset (p = 0.50).
2.4.2 Pathogenic variants.
Table 2.6 provides a summary of the pathogenic variants identified within our
data set. There were 25 male cases (hit rate 4.4%) and three female cases (hit rate 10%)
found to have a total of 28 pathogenic variants on XLID panel analysis. This yielded an
overall hit rate of 4.7%. Within the IDEAS subset, pathogenic variants were identified in
five males (4.0%) and one female (20.0%), giving a combined hit rate of 4.6%. The 28
pathogenic variants were found in 18 genes, or 20.2% of the 89 XLID panel genes for
which GGC is currently reporting results. Multiple cases were found to have pathogenic
variants in ARX (five cases) and ATRX (three cases). ARHGEF9, L1CAM, OPHN1 and
PQBP1 each had two pathogenic variants, while the remaining 12 genes yielded one
pathogenic variant each. In 15 of the 28 cases, the pathogenic variant was the only
variant found. The remaining 13 cases had between one and four VUS in addition to the
pathogenic variant.
34
2.4.3 Variants of uncertain significance.
In addition to the 13 cases with both pathogenic variants and VUS, 339 cases
without pathogenic variants were found to have one or more VUS, giving a VUS-only
rate of 57.3%. Sixty-two (18.3%) had synonymous variants only, while 277 (81.7%; or
46.7% of all cases) had one or more non-synonymous variants. The total number of VUS
per case ranged from one to 10, however the majority of cases had only one (185 cases;
54.6%) or two (102 cases; 30.1%) VUS. VUS were found in 85 of 89 reportable genes
on the panel. Sixty-seven genes (75.2%) yielded VUS only. All 18 genes for which
pathogenic variants were found also yielded one or more VUS. As expected, the genes
with the largest cDNA sizes, such as HUWE1 (13.1 kb), DMD (11.1 kb), FLNA (7.9 kb),
and ATRX (7.5 kb) gave the highest number of variants.
Four genes- HSD17B10, NDP, PGK1 and EBE2A- showed no variants at all
within this set of cases. Two hundred twenty-five cases, or 38.0%, were found to have no
variants within the reportable genes on the XLID panel.
2.4.5 Family studies.
Family studies are often helpful when interpreting the pathogenicity of genetic
variants. When considering X-linked variants, maternal X-inactivation status may
provide additional clues, as unaffected female carriers of pathogenic mutations are
sometimes found to have a protective skewing of X-inactivation. We sought to determine
what proportion of the pathogenic variants and non-synonymous VUS in the full data set
were inherited from a parent. Among the 28 individuals bearing pathogenic variants,
parental inheritance studies were conducted for 15 (53.6%). The pathogenic variant was
maternally inherited in 10 cases (66.7%) and was de novo in five cases (33.3%),
35
including both female cases. Maternal X-inactivation studies were performed for four of
the 25 male cases with pathogenic variants (in ARHGEF9 (two cases), OPHN1 and
CASK); all four mothers showed random XI. The patient's own XI pattern was studied
for one female case with a de novo variant in SLC16A2, and her XI pattern was also
found to be random.
There were 277 cases with one or more non-synonymous VUS but no pathogenic
variants. Family studies were performed for 102 of these cases (36.8%), with a total of
166 non-synonymous VUS. Two cases (1.9%), were found to have a single de novo VUS
each, amounting to a 1.2% de novo rate among non-synonymous VUS. For one female
case, the VUS was found to be paternally inherited.
Maternal XI studies were performed for 36 cases with non-synonymous VUS but
no pathogenic variants. In 26/36 cases, family studies had also been performed, showing
maternal inheritance in 25/26. One VUS was de novo, with random maternal XI. Among
the cases with maternally inherited variants, XI was random in 11 mothers, moderately
skewed in eight mothers and highly skewed in six mothers. In the set of 10 cases for
which maternal XI studies, but not maternal inheritance studies, were performed, two
showed random XI, three had moderately skewed XI and five showed highly skewed XI.
All combined, maternal XI was random in 14/36 cases (38.8%), moderately skewed in
11/36 cases (30.6%) and highly skewed in 11/36 cases (30.6%). A list of the genes with
non-synonymous VUS found in cases with skewed maternal XI is presented in Table 2.8.
2.5 Discussion
The study presented here had two primary goals. The first was to look for
phenotypic patterns within the GGC XLID cases that might be useful in constructing

36
genotype-phenotype correlations, to increase our understanding of X-linked intellectual
disability. The second was to assess the utility of the current GGC XLID gene panel in
identifying the molecular etiology of intellectual disability.
We found that the rate of pathogenic variants was virtually identical between the
IDEAS group and the entire data set, at approximately 4.7%. This hit rate is substantially
lower than those reported for next-generation sequencing panels in other conditions, such
as familial hearing loss (62%) (Baek et al., 2012); hereditary retinal dystrophies (56%)
(Chen et al., 2013); epileptic disorders (48%) (Lemke et al., 2012); and infantile
mitochondrial disease (24%) (Calvo et al., 2012). Those studies differed from the current
study in important ways. First, the studies investigated small numbers (8-42) of selected
patients or families with well-defined clinical phenotypes, some including significant
family history of the condition under investigation. Second, the epilepsy and retinal
dystrophy studies examined panels of 265 and 189 genes, respectively, more than twice
as many genes as the GGC XLID panel, while the mitochondrial disease study examined
approximately 1000 genes.
We cannot exclude that there may be true pathogenic variants hiding among the
numerous VUS in our data set. In this study, almost 50% of cases (without pathogenic
variants) had one or more non-synonymous VUS with the potential to negatively impact
protein function or gene regulation. While it was beyond the scope of this study to re-
interpret VUS, it is likely that some of them are in fact pathogenic variants. Family
studies are often the most useful tool in assessing the potential pathogenicity of VUS,
however we found they were performed in less than 37% of cases with VUS. Nine XLID
genes are consistently associated with skewed XI in carrier females (R.C. Rogers,

37
personal communication April 4, 2014). We found 21 cases with non-synonymous VUS
and skewed maternal XI. Seven of these had variants in three genes (ACSL4, ATRX and
GRIA3) associated with skewed XI in female carriers, potentially adding to the weight of
evidence regarding their pathogenicity. Strikingly, six of the cases had VUS in ATRX
and highly skewed maternal XI. The seventh case had variants in both ACSL4 and
GRIA3 with moderately skewed maternal XI. Finally, while we did not find any
statistically significant association between the "load" of VUS and phenotypes within our
data set, the possibility remains that a multifactorial ID etiology may involve the additive
effects of several slightly deleterious variants, both X-linked and autosomal, that current
knowledge does not allow us to recognize.
With any gene panel test, the selection of which genes to assess is crucial to its
success. Diagnostic laboratories design gene panels based on literature reporting
causative associations between genes and phenotypes. However, the genetic landscape
for many conditions, including XLID, is constantly shifting. As more data become
available, it becomes clear that some variants and genes that were thought to be causative
are instead benign. Recently, Piton, Redin & Mandel (2013) published a re-assessment
of the roles of many X-linked genes in intellectual disability, based on large-scale exome
sequencing data. Their study specifically questioned the roles of 10 genes in XLID, and
called for additional data on another 15. Two of the genes considered highly
questionable (ZNF674 and NXF5) are already omitted from GGC's panel reporting. One
case in our study had a clearly deleterious (nonsense) mutation in ZNF41, also on the
highly questionable list. We chose to consider that change a VUS in this analysis. Our

38
finding that only 18 of 89 genes yielded high-confidence pathogenic variants may have
implications for future versions of the XLID panel.
The identification of phenotypic patterns is only possible if phenotypes are
actually reported. One might expect that patients for whom an intellectual disability gene
panel test is ordered would have ID/DD as a primary phenotype. Within the IDEAS set,
theoretically submitted with full phenotypic information, ID/DD was reported in nearly
100% of cases. When looking at only the non-IDEAS cases, however, the frequency of
reported ID/DD was reduced by almost 25%. The rank order of phenotype frequencies,
however, was nearly identical between the IDEAS and non-IDEAS groups. This
suggests that, when phenotypic information was provided, it tended to be equivalent,
regardless of whether the referring provider requested IDEAS panel review. Indeed,
despite specific guidelines for providing clinical information when requesting IDEAS
review, a recent analysis of the first 55 IDEAS cases demonstrated that, even in this
"best-case" scenario, phenotype reporting is consistently inconsistent (Hunter et al.,
2014).
It is no surprise, then, that statistically significant associations between
phenotypes were largely absent in this analysis. The strong positive correlation seen
between macrocephaly and autism in these patients provided reassuring evidence that,
when reported, phenotypes were reasonably accurate. The majority of significant
associations, however, were between the lack of ID/DD and the lack of other reported
phenotypes. In other words, an individual without reported ID/DD was highly likely (p <
0.001) to also have no other phenotypes reported, and this was true for nearly 14% of
cases.
39
The apparently low success rate of the GGC XLID panel begs the question of
whether a gene panel is the best approach for this condition, since its utility relies on
certain assumptions (in this case, X-linked etiology and the causative roles of the
included genes) that may not be valid. The higher hit rates seen when using larger gene
panels for other genetically heterogeneous conditions suggest that, if choosing a panel
approach, more genes may be better. A greater number of genes, however, inevitably
means a greater burden of uncertain variants and incidental findings that must be
interpreted and communicated. At some point the difference between analyzing a full
exome vs. a large gene panel, for instance 1000 genes as in the mitochondrial disease
study, becomes academic.
Full exome sequencing is increasingly common in clinical use, and will likely
become routine in the near future as technology improves and costs decrease. Indeed, the
current turnaround time and cost of clinical exome sequencing, for the proband alone or
proband plus parents (trio sequencing) are equivalent to those of XLID panel testing
(GGC, 2014; Iowa Institute of Human Genetics, 2014). Individuals with ID frequently
have no other phenotypic findings or family history to aid in clinical diagnosis. For these
patients, full exome sequencing may provide the most efficient method of molecular
diagnosis. One way to manage the burden of exome interpretation may be to create
virtual gene panels within the exome data. Analysis could proceed in a tiered fashion,
looking at the most likely gene candidates first, and only moving to additional analysis if
the previous group fails to provide an answer. This approach carries its own limitations.
Sequencing coverage is less robust with a full exome vs. selected genes, making it more
likely that a pathogenic variant may be missed. Full exome sequencing has the potential

40
to uncover medically actionable incidental findings, which may never come to light if
exome data is only accessed for specific genes relevant to the indication at hand. The
responsibilities and liabilities surrounding reporting of incidental findings are a current
matter of intense discussion among genetics professionals. However, selective reporting
of results as suggested for tiered exome reporting is in fact already in practice with the
GGC XLID panel with the omission of some genes found on the Piton et al. (2013)
highly questionable list.
It cannot be overstated that successful molecular diagnosis requires astute
matching of patient to test. In the hearing loss study (Baek et al., 2012), for instance,
their 8 chosen families had strong family histories showing autosomal dominant (AD)
inheritance of a simple, well-defined phenotype; that is, a clear genetic cause, as opposed
to a multifactorial, teratogenic, toxic or injurious etiology. In addition, their panel
included all of the known causative genes for hearing loss, plus some additional
candidate genes. Intellectual disability, by contrast, is enormously complex,
heterogeneous in both presentation and etiology. Over 400 ID genes have been
identified, roughly one-quarter of which lie on the X chromosome, but less than 10% of
ID is estimated to be X-linked. When assessing the success of the XLID panel, a targeted
parallel sequencing study of susceptibility genes in childhood cancer (Plon et al., 2011)
may provide a more valid comparison. Like (X-linked) ID/DD, the condition is
phenotypically and genetically heterogeneous, in many cases is multifactorial, and family
history may be uninformative. Even with strict inclusion criteria, their hit rate (in 45
genes) was just 13%.
41
Unless a family history unmistakably demonstrates X-linked inheritance, the
average case of non-syndromic ID is far more likely to have an autosomal etiology.
Hunter et al. (2014) noted that information on family history and prior genetic
evaluation(s) was often missing or incomplete in the early IDEAS cases, a circumstance
that has not improved over time for the XLID panel submissions in general (M. Friez,
personal communication, April 4, 2014). Further confounding the picture is the
phenotypic heterogeneity displayed by many XLID genes. One gene may cause both
syndromic and non-syndromic ID, which may or may not depend on the specific
mutation. Carrier females may or may not display a recognizable phenotype. With non-
syndromic ID, it is often simply not possible to match a patient to a specific genetic test,
and it is likely that many of the submitted cases have been through several tiers of testing
already. A large proportion of the XLID panel submissions may represent last-ditch
diagnostic efforts rather than genuinely suspected XLID; in other words, poor XLID
testing candidates. This returns us to the question of whether, if taking a shot in the dark
anyway, it might be better to aim at a larger target (i.e., the exome).
The limitations of this study are in fact its most relevant findings. Plainly put, if
progress is to be made in clarifying the genetics of intellectual disability, more
information is needed, both from the referring physicians and the genetics community as
a whole. Meaningful curation of variants requires complete, accurate and accessible
information about the patient, the patient's genotype and the gene(s) in question. Ideally,
the clinical and molecular evaluation of patients would proceed in a consistent,
systematic way, and all reporting would be standardized and freely accessible. This
concept is already firmly within the awareness of the genetics community, as the ability

42
to acquire genome-scale information has rapidly outpaced our ability to manage the
information. The trend is moving toward more open sharing of variant information, but
is not nearly universal, nor does the currently available molecular data necessarily
include any phenotypic information (for instance, the Exome Sequencing Project of the
National Heart, Lung and Blood Institute (NHLBI) in the National Institutes of Health
(NIH), available at http://evs.gs.washington.edu/EVS/). In this example, allele
frequencies in populations chosen for a specific condition (for instance, cardiovascular
disease) are reported, and it is left to the investigator to assume that other genetic
conditions are not present. The implementation of training and infrastructure to make
comprehensive large-scale genetic data sharing possible will require a significant long-
term commitment of funding, infrastructure and collaboration.
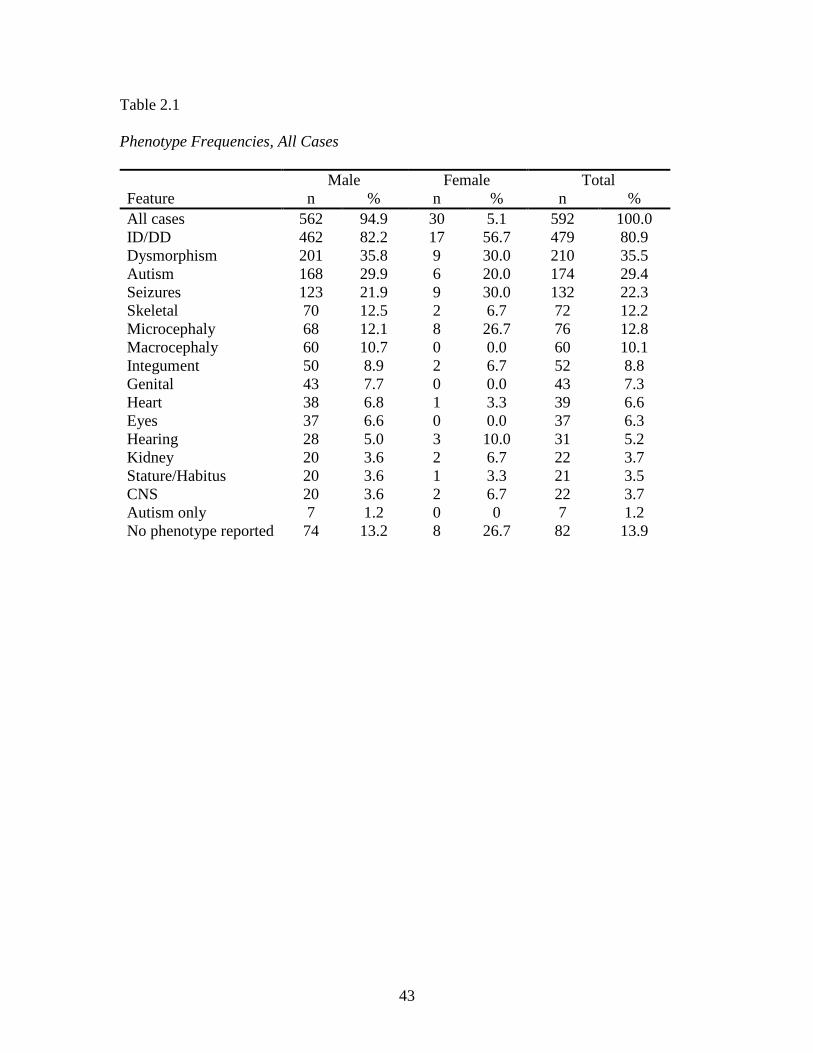
43
Table 2.1
Phenotype Frequencies, All Cases Male Female Total Feature n % n % n % All cases 562 94.9 30 5.1 592 100.0 ID/DD 462 82.2 17 56.7 479 80.9 Dysmorphism 201 35.8 9 30.0 210 35.5 Autism 168 29.9 6 20.0 174 29.4 Seizures 123 21.9 9 30.0 132 22.3 Skeletal 70 12.5 2 6.7 72 12.2 Microcephaly 68 12.1 8 26.7 76 12.8 Macrocephaly 60 10.7 0 0.0 60 10.1 Integument 50 8.9 2 6.7 52 8.8 Genital 43 7.7 0 0.0 43 7.3 Heart 38 6.8 1 3.3 39 6.6 Eyes 37 6.6 0 0.0 37 6.3 Hearing 28 5.0 3 10.0 31 5.2 Kidney 20 3.6 2 6.7 22 3.7 Stature/Habitus 20 3.6 1 3.3 21 3.5 CNS 20 3.6 2 6.7 22 3.7 Autism only 7 1.2 0 0 7 1.2 No phenotype reported 74 13.2 8 26.7 82 13.9
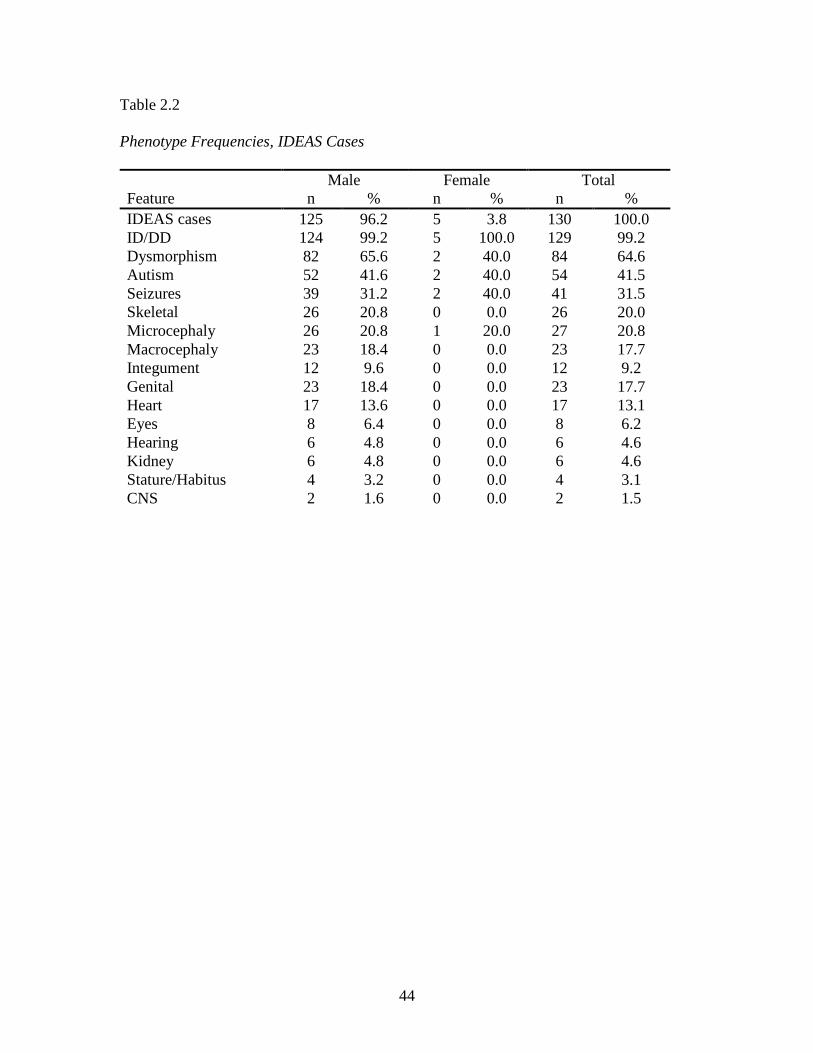
44
Table 2.2 Phenotype Frequencies, IDEAS Cases Male Female Total Feature n % n % n % IDEAS cases 125 96.2 5 3.8 130 100.0 ID/DD 124 99.2 5 100.0 129 99.2 Dysmorphism 82 65.6 2 40.0 84 64.6 Autism 52 41.6 2 40.0 54 41.5 Seizures 39 31.2 2 40.0 41 31.5 Skeletal 26 20.8 0 0.0 26 20.0 Microcephaly 26 20.8 1 20.0 27 20.8 Macrocephaly 23 18.4 0 0.0 23 17.7 Integument 12 9.6 0 0.0 12 9.2 Genital 23 18.4 0 0.0 23 17.7 Heart 17 13.6 0 0.0 17 13.1 Eyes 8 6.4 0 0.0 8 6.2 Hearing 6 4.8 0 0.0 6 4.6 Kidney 6 4.8 0 0.0 6 4.6 Stature/Habitus 4 3.2 0 0.0 4 3.1 CNS 2 1.6 0 0.0 2 1.5

45
Table 2.3
Phenotype Frequencies, Non-IDEAS Cases Male Female Total Feature n % n % n % non-IDEAS cases 437 94.6 25 5.4 462 100.0 ID/DD 338 77.3 12 48.0 350 75.8 Dysmorphism 119 27.2 7 28.0 126 27.3 Autism 116 26.5 4 16.0 120 26.0 Seizures 84 19.2 7 28.0 91 19.7 Skeletal 44 10.1 2 8.0 46 10.0 Microcephaly 42 9.6 7 28.0 49 10.6 Macrocephaly 37 8.5 0 0.0 37 8.0 Integument 38 8.7 2 8.0 40 8.7 Genital 20 4.6 0 0.0 20 4.3 Heart 21 4.8 1 4.0 22 4.8 Eyes 29 6.6 0 0.0 29 6.3 Hearing 22 5.0 3 12.0 25 5.4 Kidney 14 3.2 2 8.0 16 3.5 Stature/Habitus 16 3.7 1 4.0 17 3.7 CNS 18 4.1 2 8.0 20 4.3 Autism only 7 1.6 0 0 7 1.5 No phenotype reported 74 16.9 8 32.0 82 17.7
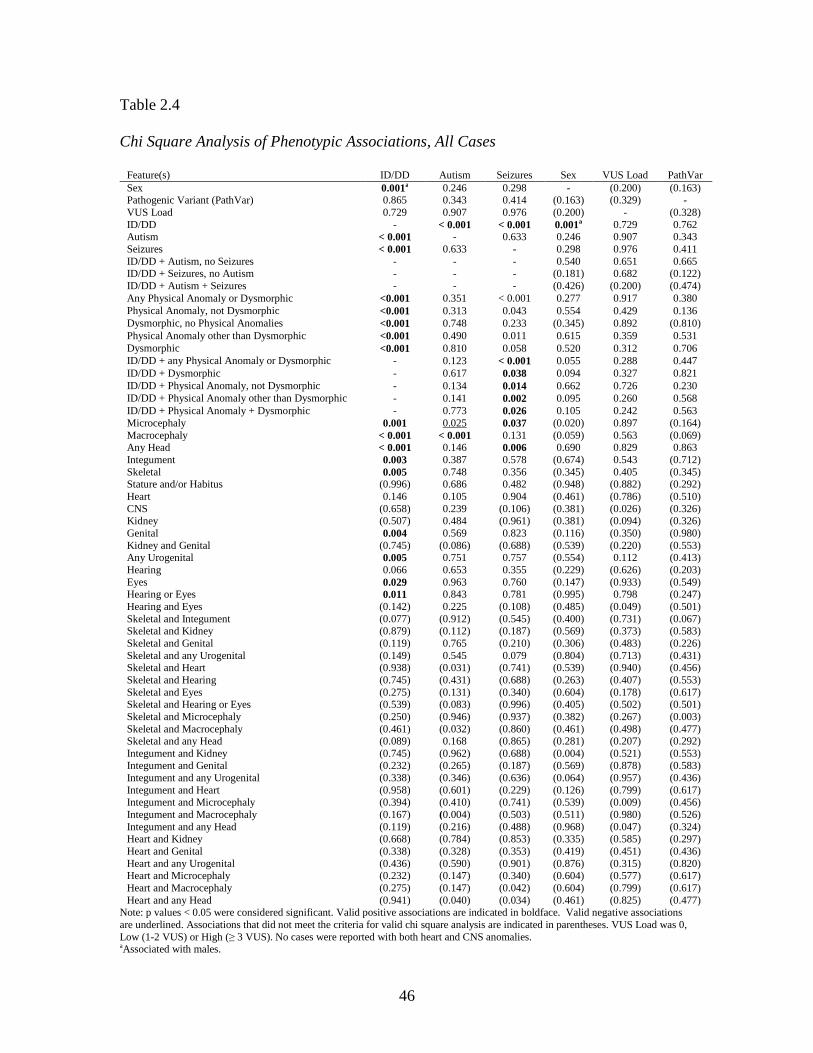
46
Table 2.4 Chi Square Analysis of Phenotypic Associations, All Cases
Feature(s) ID/DD Autism Seizures Sex VUS Load PathVar Sex 0.001a 0.246 0.298 - (0.200) (0.163) Pathogenic Variant (PathVar) 0.865 0.343 0.414 (0.163) (0.329) - VUS Load 0.729 0.907 0.976 (0.200) - (0.328) ID/DD - < 0.001 < 0.001 0.001a 0.729 0.762 Autism < 0.001 - 0.633 0.246 0.907 0.343 Seizures < 0.001 0.633 - 0.298 0.976 0.411 ID/DD + Autism, no Seizures - - - 0.540 0.651 0.665 ID/DD + Seizures, no Autism - - - (0.181) 0.682 (0.122) ID/DD + Autism + Seizures - - - (0.426) (0.200) (0.474) Any Physical Anomaly or Dysmorphic <0.001 0.351 < 0.001 0.277 0.917 0.380 Physical Anomaly, not Dysmorphic <0.001 0.313 0.043 0.554 0.429 0.136 Dysmorphic, no Physical Anomalies <0.001 0.748 0.233 (0.345) 0.892 (0.810) Physical Anomaly other than Dysmorphic <0.001 0.490 0.011 0.615 0.359 0.531 Dysmorphic <0.001 0.810 0.058 0.520 0.312 0.706 ID/DD + any Physical Anomaly or Dysmorphic - 0.123 < 0.001 0.055 0.288 0.447 ID/DD + Dysmorphic - 0.617 0.038 0.094 0.327 0.821 ID/DD + Physical Anomaly, not Dysmorphic - 0.134 0.014 0.662 0.726 0.230 ID/DD + Physical Anomaly other than Dysmorphic - 0.141 0.002 0.095 0.260 0.568 ID/DD + Physical Anomaly + Dysmorphic - 0.773 0.026 0.105 0.242 0.563 Microcephaly 0.001 0.025 0.037 (0.020) 0.897 (0.164) Macrocephaly < 0.001 < 0.001 0.131 (0.059) 0.563 (0.069) Any Head < 0.001 0.146 0.006 0.690 0.829 0.863 Integument 0.003 0.387 0.578 (0.674) 0.543 (0.712) Skeletal 0.005 0.748 0.356 (0.345) 0.405 (0.345) Stature and/or Habitus (0.996) 0.686 0.482 (0.948) (0.882) (0.292) Heart 0.146 0.105 0.904 (0.461) (0.786) (0.510) CNS (0.658) 0.239 (0.106) (0.381) (0.026) (0.326) Kidney (0.507) 0.484 (0.961) (0.381) (0.094) (0.326) Genital 0.004 0.569 0.823 (0.116) (0.350) (0.980) Kidney and Genital (0.745) (0.086) (0.688) (0.539) (0.220) (0.553) Any Urogenital 0.005 0.751 0.757 (0.554) 0.112 (0.413) Hearing 0.066 0.653 0.355 (0.229) (0.626) (0.203) Eyes 0.029 0.963 0.760 (0.147) (0.933) (0.549) Hearing or Eyes 0.011 0.843 0.781 (0.995) 0.798 (0.247) Hearing and Eyes (0.142) 0.225 (0.108) (0.485) (0.049) (0.501) Skeletal and Integument (0.077) (0.912) (0.545) (0.400) (0.731) (0.067) Skeletal and Kidney (0.879) (0.112) (0.187) (0.569) (0.373) (0.583) Skeletal and Genital (0.119) 0.765 (0.210) (0.306) (0.483) (0.226) Skeletal and any Urogenital (0.149) 0.545 0.079 (0.804) (0.713) (0.431) Skeletal and Heart (0.938) (0.031) (0.741) (0.539) (0.940) (0.456) Skeletal and Hearing (0.745) (0.431) (0.688) (0.263) (0.407) (0.553) Skeletal and Eyes (0.275) (0.131) (0.340) (0.604) (0.178) (0.617) Skeletal and Hearing or Eyes (0.539) (0.083) (0.996) (0.405) (0.502) (0.501) Skeletal and Microcephaly (0.250) (0.946) (0.937) (0.382) (0.267) (0.003) Skeletal and Macrocephaly (0.461) (0.032) (0.860) (0.461) (0.498) (0.477) Skeletal and any Head (0.089) 0.168 (0.865) (0.281) (0.207) (0.292) Integument and Kidney (0.745) (0.962) (0.688) (0.004) (0.521) (0.553) Integument and Genital (0.232) (0.265) (0.187) (0.569) (0.878) (0.583) Integument and any Urogenital (0.338) (0.346) (0.636) (0.064) (0.957) (0.436) Integument and Heart (0.958) (0.601) (0.229) (0.126) (0.799) (0.617) Integument and Microcephaly (0.394) (0.410) (0.741) (0.539) (0.009) (0.456) Integument and Macrocephaly (0.167) (0.004) (0.503) (0.511) (0.980) (0.526) Integument and any Head (0.119) (0.216) (0.488) (0.968) (0.047) (0.324) Heart and Kidney (0.668) (0.784) (0.853) (0.335) (0.585) (0.297) Heart and Genital (0.338) (0.328) (0.353) (0.419) (0.451) (0.436) Heart and any Urogenital (0.436) (0.590) (0.901) (0.876) (0.315) (0.820) Heart and Microcephaly (0.232) (0.147) (0.340) (0.604) (0.577) (0.617) Heart and Macrocephaly (0.275) (0.147) (0.042) (0.604) (0.799) (0.617) Heart and any Head (0.941) (0.040) (0.034) (0.461) (0.825) (0.477)
Note: p values < 0.05 were considered significant. Valid positive associations are indicated in boldface. Valid negative associations are underlined. Associations that did not meet the criteria for valid chi square analysis are indicated in parentheses. VUS Load was 0, Low (1-2 VUS) or High (≥ 3 VUS). No cases were reported with both heart and CNS anomalies. aAssociated with males.
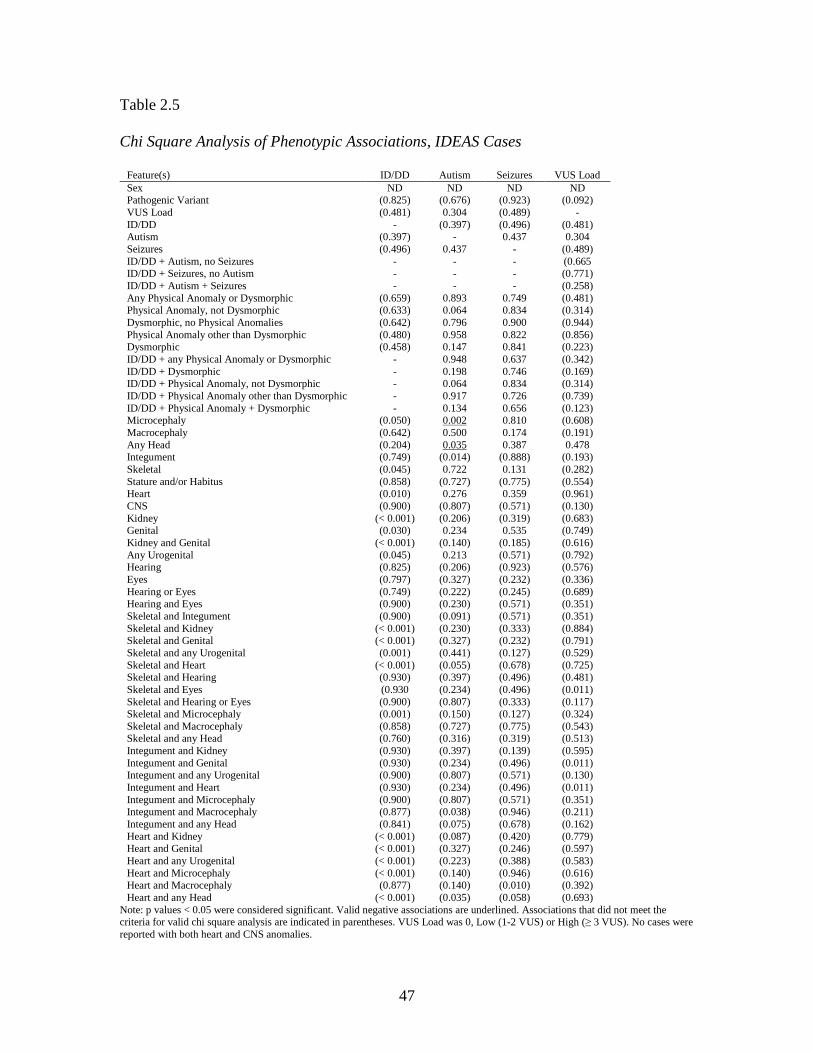
47
Table 2.5 Chi Square Analysis of Phenotypic Associations, IDEAS Cases
Feature(s) ID/DD Autism Seizures VUS Load Sex ND ND ND ND Pathogenic Variant (0.825) (0.676) (0.923) (0.092) VUS Load (0.481) 0.304 (0.489) - ID/DD - (0.397) (0.496) (0.481) Autism (0.397) - 0.437 0.304 Seizures (0.496) 0.437 - (0.489) ID/DD + Autism, no Seizures - - - (0.665 ID/DD + Seizures, no Autism - - - (0.771) ID/DD + Autism + Seizures - - - (0.258) Any Physical Anomaly or Dysmorphic (0.659) 0.893 0.749 (0.481) Physical Anomaly, not Dysmorphic (0.633) 0.064 0.834 (0.314) Dysmorphic, no Physical Anomalies (0.642) 0.796 0.900 (0.944) Physical Anomaly other than Dysmorphic (0.480) 0.958 0.822 (0.856) Dysmorphic (0.458) 0.147 0.841 (0.223) ID/DD + any Physical Anomaly or Dysmorphic - 0.948 0.637 (0.342) ID/DD + Dysmorphic - 0.198 0.746 (0.169) ID/DD + Physical Anomaly, not Dysmorphic - 0.064 0.834 (0.314) ID/DD + Physical Anomaly other than Dysmorphic - 0.917 0.726 (0.739) ID/DD + Physical Anomaly + Dysmorphic - 0.134 0.656 (0.123) Microcephaly (0.050) 0.002 0.810 (0.608) Macrocephaly (0.642) 0.500 0.174 (0.191) Any Head (0.204) 0.035 0.387 0.478 Integument (0.749) (0.014) (0.888) (0.193) Skeletal (0.045) 0.722 0.131 (0.282) Stature and/or Habitus (0.858) (0.727) (0.775) (0.554) Heart (0.010) 0.276 0.359 (0.961) CNS (0.900) (0.807) (0.571) (0.130) Kidney (< 0.001) (0.206) (0.319) (0.683) Genital (0.030) 0.234 0.535 (0.749) Kidney and Genital (< 0.001) (0.140) (0.185) (0.616) Any Urogenital (0.045) 0.213 (0.571) (0.792) Hearing (0.825) (0.206) (0.923) (0.576) Eyes (0.797) (0.327) (0.232) (0.336) Hearing or Eyes (0.749) (0.222) (0.245) (0.689) Hearing and Eyes (0.900) (0.230) (0.571) (0.351) Skeletal and Integument (0.900) (0.091) (0.571) (0.351) Skeletal and Kidney (< 0.001) (0.230) (0.333) (0.884) Skeletal and Genital (< 0.001) (0.327) (0.232) (0.791) Skeletal and any Urogenital (0.001) (0.441) (0.127) (0.529) Skeletal and Heart (< 0.001) (0.055) (0.678) (0.725) Skeletal and Hearing (0.930) (0.397) (0.496) (0.481) Skeletal and Eyes (0.930 (0.234) (0.496) (0.011) Skeletal and Hearing or Eyes (0.900) (0.807) (0.333) (0.117) Skeletal and Microcephaly (0.001) (0.150) (0.127) (0.324) Skeletal and Macrocephaly (0.858) (0.727) (0.775) (0.543) Skeletal and any Head (0.760) (0.316) (0.319) (0.513) Integument and Kidney (0.930) (0.397) (0.139) (0.595) Integument and Genital (0.930) (0.234) (0.496) (0.011) Integument and any Urogenital (0.900) (0.807) (0.571) (0.130) Integument and Heart (0.930) (0.234) (0.496) (0.011) Integument and Microcephaly (0.900) (0.807) (0.571) (0.351) Integument and Macrocephaly (0.877) (0.038) (0.946) (0.211) Integument and any Head (0.841) (0.075) (0.678) (0.162) Heart and Kidney (< 0.001) (0.087) (0.420) (0.779) Heart and Genital (< 0.001) (0.327) (0.246) (0.597) Heart and any Urogenital (< 0.001) (0.223) (0.388) (0.583) Heart and Microcephaly (< 0.001) (0.140) (0.946) (0.616) Heart and Macrocephaly (0.877) (0.140) (0.010) (0.392) Heart and any Head (< 0.001) (0.035) (0.058) (0.693)
Note: p values < 0.05 were considered significant. Valid negative associations are underlined. Associations that did not meet the criteria for valid chi square analysis are indicated in parentheses. VUS Load was 0, Low (1-2 VUS) or High (≥ 3 VUS). No cases were reported with both heart and CNS anomalies.

48
Table 2.6 Pathogenic Variants
Study ID Sex Gene Molecular Protein Class 534 M AP1S2 c.138C>A p.C46X N 227 M ARHGEF9 c.865C>T p.R289X N 354 M ARHGEF9 c.691_709del19 NS D 164 M ARX c.441_464dup24 NS I 508 M ARX c.315_335dup21 NS I 040 M ARX c.441_464dup24 NS I 024 M ARX c.441_464dup24 NS I 068 M ARX c.441_464dup24 NS I 080 M ATRX c.536A>G p.N179S M 082 M ATRX c.109C>T p.R37X N 372 M ATRX c.4654G>T p.V1552F M 472 M CASK c.1811T>A p.L604X N 324 M CUL4B c.857delT FS FS 244 M IDS c.1180+2T>C NS R 252 M KDM5C c.3125delG FS FS 135 F KIAA2022 c.964C>T p.R322X N 066 M L1CAM c.3531-12G>A NS R 598 M L1CAM c.1261G>A p.V421I M 527 M MAOA deleted NS D 006 M OPHN1 deletion includes exon 20 NS D 336 M OPHN1 c.1489C>T p.R497X N 170 F PDHA1 c.947dupC FS FS 197 M PQBP1 c.586C>T p.R196X N 239 M PQBP1 c.691G>A p.A231T M 355 M RPS6KA3 c.1492G>T p.G498X N 029 F SLC16A2 c.1A>T p.M1? R 328 M SLC9A6 c.1236+2T>A NS R 057 M UPF3B c.674_677delGAAA NS D
Note: M = male. F = female. NS = not specified. Class = mutation classification. N = nonsense. D = deletion. I = insertion. M = missense. FS = frameshift. R = regulatory.
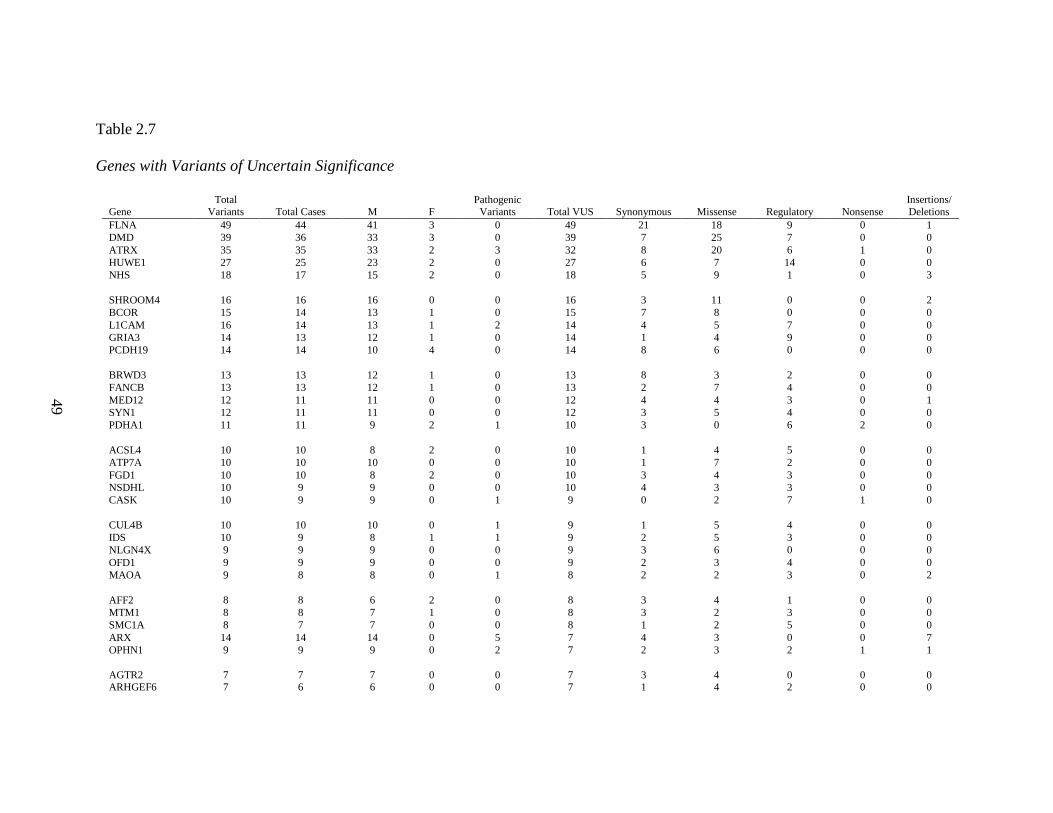
49
Table 2.7
Genes with Variants of Uncertain Significance
Gene Total
Variants Total Cases M F Pathogenic Variants Total VUS Synonymous Missense Regulatory Nonsense
Insertions/ Deletions
FLNA 49 44 41 3 0 49 21 18 9 0 1 DMD 39 36 33 3 0 39 7 25 7 0 0 ATRX 35 35 33 2 3 32 8 20 6 1 0 HUWE1 27 25 23 2 0 27 6 7 14 0 0 NHS 18 17 15 2 0 18 5 9 1 0 3 SHROOM4 16 16 16 0 0 16 3 11 0 0 2 BCOR 15 14 13 1 0 15 7 8 0 0 0 L1CAM 16 14 13 1 2 14 4 5 7 0 0 GRIA3 14 13 12 1 0 14 1 4 9 0 0 PCDH19 14 14 10 4 0 14 8 6 0 0 0 BRWD3 13 13 12 1 0 13 8 3 2 0 0 FANCB 13 13 12 1 0 13 2 7 4 0 0 MED12 12 11 11 0 0 12 4 4 3 0 1 SYN1 12 11 11 0 0 12 3 5 4 0 0 PDHA1 11 11 9 2 1 10 3 0 6 2 0 ACSL4 10 10 8 2 0 10 1 4 5 0 0 ATP7A 10 10 10 0 0 10 1 7 2 0 0 FGD1 10 10 8 2 0 10 3 4 3 0 0 NSDHL 10 9 9 0 0 10 4 3 3 0 0 CASK 10 9 9 0 1 9 0 2 7 1 0 CUL4B 10 10 10 0 1 9 1 5 4 0 0 IDS 10 9 8 1 1 9 2 5 3 0 0 NLGN4X 9 9 9 0 0 9 3 6 0 0 0 OFD1 9 9 9 0 0 9 2 3 4 0 0 MAOA 9 8 8 0 1 8 2 2 3 0 2 AFF2 8 8 6 2 0 8 3 4 1 0 0 MTM1 8 8 7 1 0 8 3 2 3 0 0 SMC1A 8 7 7 0 0 8 1 2 5 0 0 ARX 14 14 14 0 5 7 4 3 0 0 7 OPHN1 9 9 9 0 2 7 2 3 2 1 1 AGTR2 7 7 7 0 0 7 3 4 0 0 0 ARHGEF6 7 6 6 0 0 7 1 4 2 0 0
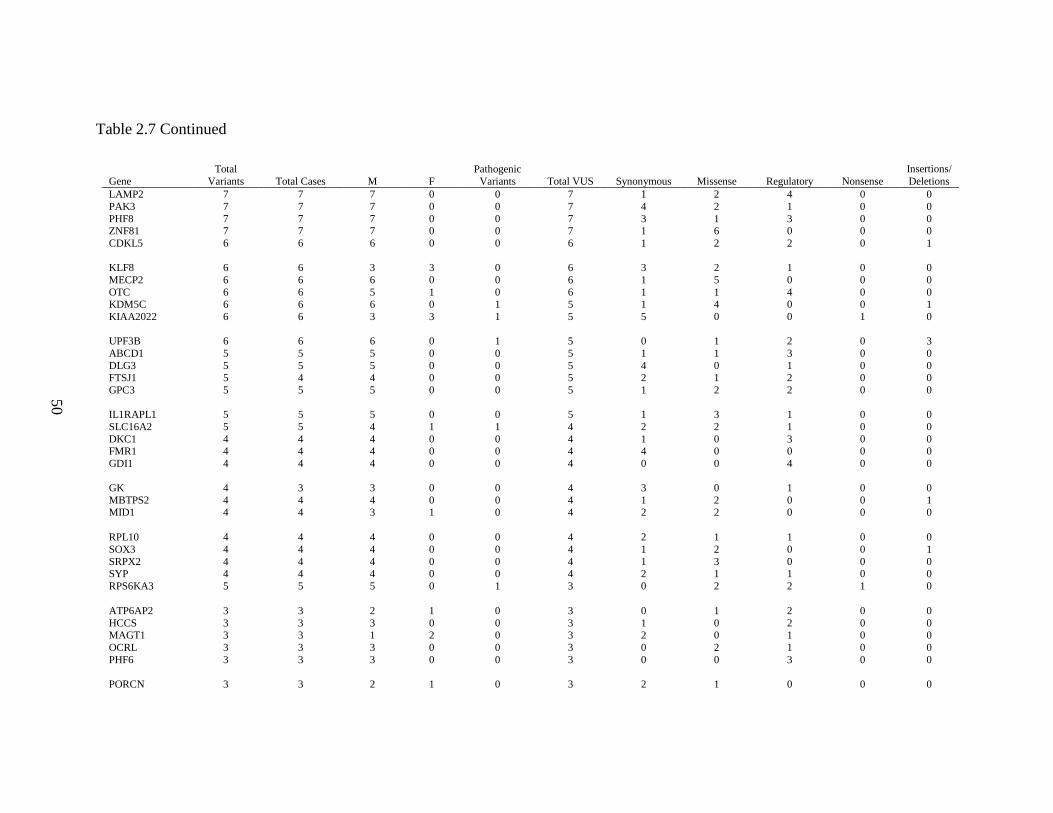
50
Table 2.7 Continued
Gene Total
Variants Total Cases M F Pathogenic Variants Total VUS Synonymous Missense Regulatory Nonsense
Insertions/ Deletions
LAMP2 7 7 7 0 0 7 1 2 4 0 0 PAK3 7 7 7 0 0 7 4 2 1 0 0 PHF8 7 7 7 0 0 7 3 1 3 0 0 ZNF81 7 7 7 0 0 7 1 6 0 0 0 CDKL5 6 6 6 0 0 6 1 2 2 0 1 KLF8 6 6 3 3 0 6 3 2 1 0 0 MECP2 6 6 6 0 0 6 1 5 0 0 0 OTC 6 6 5 1 0 6 1 1 4 0 0 KDM5C 6 6 6 0 1 5 1 4 0 0 1 KIAA2022 6 6 3 3 1 5 5 0 0 1 0 UPF3B 6 6 6 0 1 5 0 1 2 0 3 ABCD1 5 5 5 0 0 5 1 1 3 0 0 DLG3 5 5 5 0 0 5 4 0 1 0 0 FTSJ1 5 4 4 0 0 5 2 1 2 0 0 GPC3 5 5 5 0 0 5 1 2 2 0 0 IL1RAPL1 5 5 5 0 0 5 1 3 1 0 0 SLC16A2 5 5 4 1 1 4 2 2 1 0 0 DKC1 4 4 4 0 0 4 1 0 3 0 0 FMR1 4 4 4 0 0 4 4 0 0 0 0 GDI1 4 4 4 0 0 4 0 0 4 0 0 GK 4 3 3 0 0 4 3 0 1 0 0 MBTPS2 4 4 4 0 0 4 1 2 0 0 1 MID1 4 4 3 1 0 4 2 2 0 0 0 RPL10 4 4 4 0 0 4 2 1 1 0 0 SOX3 4 4 4 0 0 4 1 2 0 0 1 SRPX2 4 4 4 0 0 4 1 3 0 0 0 SYP 4 4 4 0 0 4 2 1 1 0 0 RPS6KA3 5 5 5 0 1 3 0 2 2 1 0 ATP6AP2 3 3 2 1 0 3 0 1 2 0 0 HCCS 3 3 3 0 0 3 1 0 2 0 0 MAGT1 3 3 1 2 0 3 2 0 1 0 0 OCRL 3 3 3 0 0 3 0 2 1 0 0 PHF6 3 3 3 0 0 3 0 0 3 0 0 PORCN 3 3 2 1 0 3 2 1 0 0 0
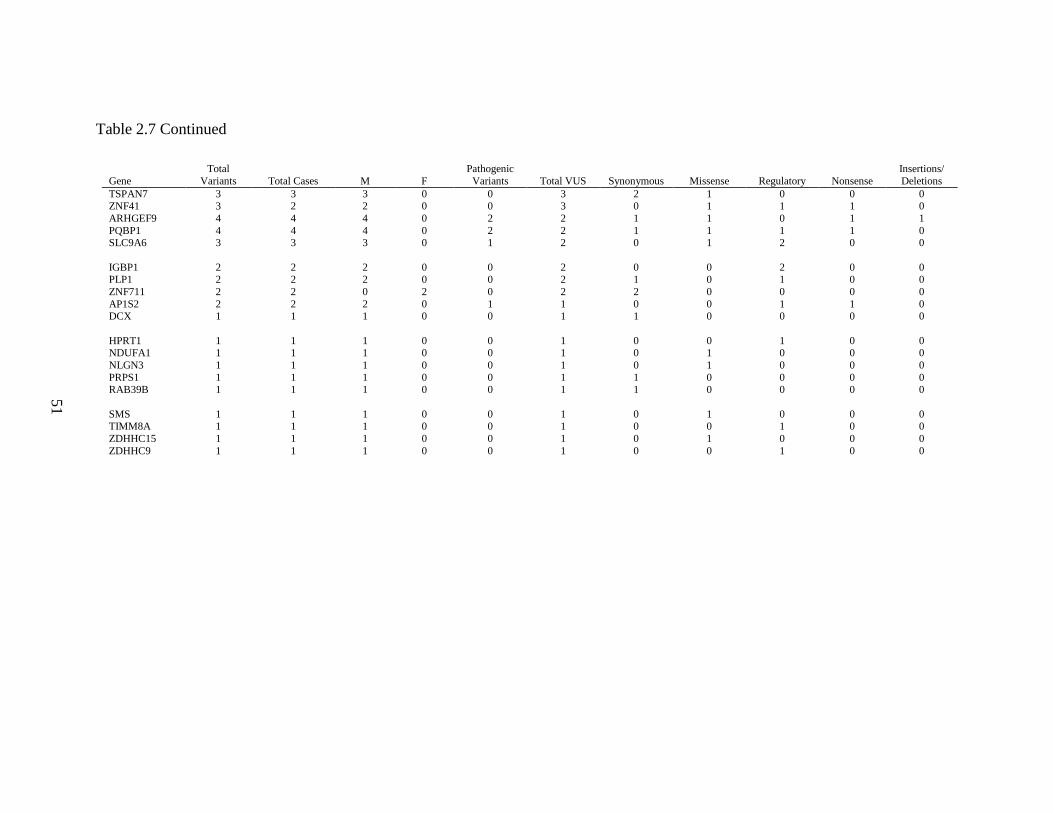
51
Table 2.7 Continued
Gene Total
Variants Total Cases M F Pathogenic Variants Total VUS Synonymous Missense Regulatory Nonsense
Insertions/ Deletions
TSPAN7 3 3 3 0 0 3 2 1 0 0 0 ZNF41 3 2 2 0 0 3 0 1 1 1 0 ARHGEF9 4 4 4 0 2 2 1 1 0 1 1 PQBP1 4 4 4 0 2 2 1 1 1 1 0 SLC9A6 3 3 3 0 1 2 0 1 2 0 0 IGBP1 2 2 2 0 0 2 0 0 2 0 0 PLP1 2 2 2 0 0 2 1 0 1 0 0 ZNF711 2 2 0 2 0 2 2 0 0 0 0 AP1S2 2 2 2 0 1 1 0 0 1 1 0 DCX 1 1 1 0 0 1 1 0 0 0 0 HPRT1 1 1 1 0 0 1 0 0 1 0 0 NDUFA1 1 1 1 0 0 1 0 1 0 0 0 NLGN3 1 1 1 0 0 1 0 1 0 0 0 PRPS1 1 1 1 0 0 1 1 0 0 0 0 RAB39B 1 1 1 0 0 1 1 0 0 0 0 SMS 1 1 1 0 0 1 0 1 0 0 0 TIMM8A 1 1 1 0 0 1 0 0 1 0 0 ZDHHC15 1 1 1 0 0 1 0 1 0 0 0 ZDHHC9 1 1 1 0 0 1 0 0 1 0 0
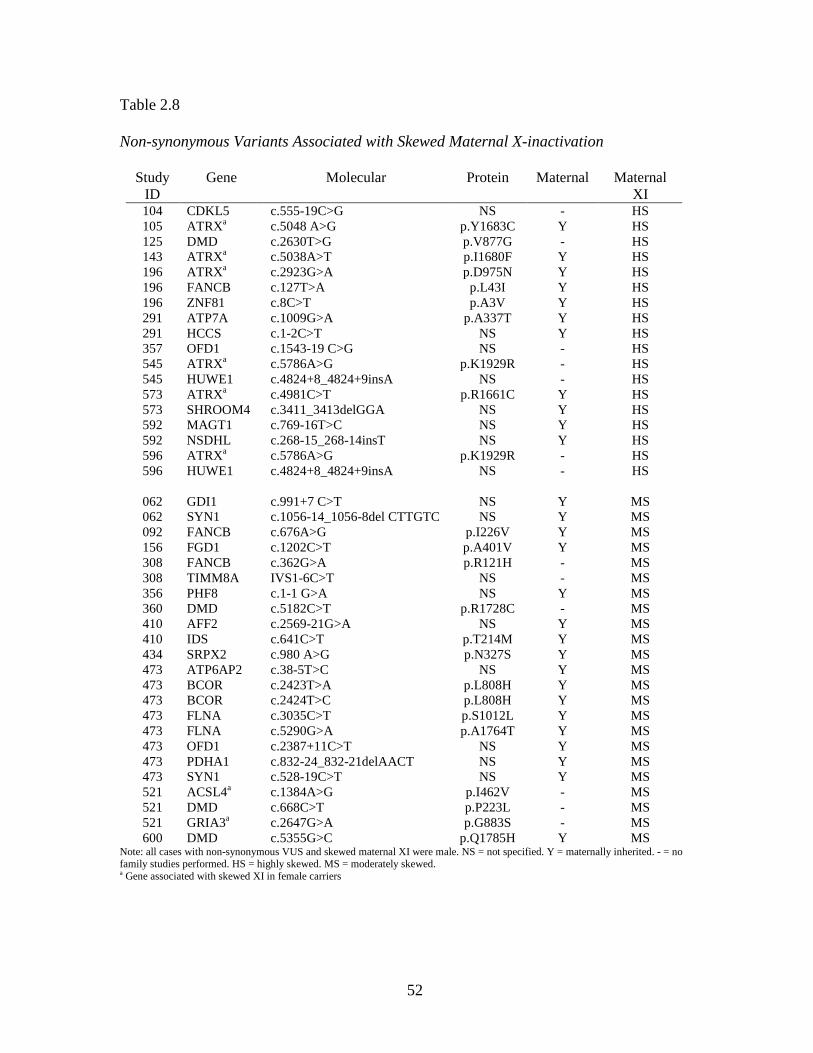
52
Table 2.8
Non-synonymous Variants Associated with Skewed Maternal X-inactivation
Study ID
Gene Molecular Protein Maternal Maternal XI
104 CDKL5 c.555-19C>G NS - HS 105 ATRXa c.5048 A>G p.Y1683C Y HS 125 DMD c.2630T>G p.V877G - HS 143 ATRXa c.5038A>T p.I1680F Y HS 196 ATRXa c.2923G>A p.D975N Y HS 196 FANCB c.127T>A p.L43I Y HS 196 ZNF81 c.8C>T p.A3V Y HS 291 ATP7A c.1009G>A p.A337T Y HS 291 HCCS c.1-2C>T NS Y HS 357 OFD1 c.1543-19 C>G NS - HS 545 ATRXa c.5786A>G p.K1929R - HS 545 HUWE1 c.4824+8_4824+9insA NS - HS 573 ATRXa c.4981C>T p.R1661C Y HS 573 SHROOM4 c.3411_3413delGGA NS Y HS 592 MAGT1 c.769-16T>C NS Y HS 592 NSDHL c.268-15_268-14insT NS Y HS 596 ATRXa c.5786A>G p.K1929R - HS 596 HUWE1 c.4824+8_4824+9insA NS - HS
062 GDI1 c.991+7 C>T NS Y MS 062 SYN1 c.1056-14_1056-8del CTTGTC NS Y MS 092 FANCB c.676A>G p.I226V Y MS 156 FGD1 c.1202C>T p.A401V Y MS 308 FANCB c.362G>A p.R121H - MS 308 TIMM8A IVS1-6C>T NS - MS 356 PHF8 c.1-1 G>A NS Y MS 360 DMD c.5182C>T p.R1728C - MS 410 AFF2 c.2569-21G>A NS Y MS 410 IDS c.641C>T p.T214M Y MS 434 SRPX2 c.980 A>G p.N327S Y MS 473 ATP6AP2 c.38-5T>C NS Y MS 473 BCOR c.2423T>A p.L808H Y MS 473 BCOR c.2424T>C p.L808H Y MS 473 FLNA c.3035C>T p.S1012L Y MS 473 FLNA c.5290G>A p.A1764T Y MS 473 OFD1 c.2387+11C>T NS Y MS 473 PDHA1 c.832-24_832-21delAACT NS Y MS 473 SYN1 c.528-19C>T NS Y MS 521 ACSL4a c.1384A>G p.I462V - MS 521 DMD c.668C>T p.P223L - MS 521 GRIA3a c.2647G>A p.G883S - MS 600 DMD c.5355G>C p.Q1785H Y MS
Note: all cases with non-synonymous VUS and skewed maternal XI were male. NS = not specified. Y = maternally inherited. - = no family studies performed. HS = highly skewed. MS = moderately skewed. a Gene associated with skewed XI in female carriers

53
Chapter 3: Conclusions
The limitations of this study are in fact its most relevant findings. Plainly put, if
progress is to be made in clarifying the genetics of intellectual disability, more
information is needed, both from the referring physicians and the genetics community as
a whole. Meaningful curation of variants requires complete, accurate and accessible
information about the patient, the patient's genotype and the gene(s) in question. Ideally,
the clinical and molecular evaluation of patients would proceed in a consistent,
systematic way, and all reporting would be standardized and freely accessible. This
concept is already firmly within the awareness of the genetics community, as the ability
to acquire genome-scale information has rapidly outpaced our ability to manage the
information. The trend is moving toward more open sharing of variant information, but
is not nearly universal, nor does the currently available molecular data necessarily
include any phenotypic information (for instance, the Exome Sequencing Project of the
National Heart, Lung and Blood Institute (NHLBI) in the National Institutes of Health
(NIH), available at http://evs.gs.washington.edu/EVS/). In this example, allele
frequencies in populations chosen for a specific condition (for instance, cardiovascular
disease) are reported, and it is left to the investigator to assume that other genetic
conditions are not present. The implementation of training and infrastructure to make
comprehensive large-scale genetic data sharing possible will require a significant long-
term commitment of funding, infrastructure and collaboration.
54
References
Ali, A., Hassiotis, A., Strydom, A., & King, M. (2012). Self stigma in people with intellectual disabilities and courtesy stigma in family carers: a systematic review. Research in Developmental Disabilities, 33(6), 2122-2140. doi: 10.1016/j.ridd.2012.06.013
Allingham-Hawkins, D. J., Babul-Hirji, R., Chitayat, D., Holden, J. J., Yang, K. T., Lee, C., . . . Vieri, F. (1999). Fragile X premutation is a significant risk factor for premature ovarian failure: the International Collaborative POF in Fragile X study--preliminary data. American Journal of Medical Genetics, 83(4), 322-325.
Ambry Genetics. (2014). X-linked Intellectual Disability. Retrieved April 14, 2014 from http://www.ambrygen.com/x-linked-intellectual-disability
American Association on Intellectual and Developmental Disabilities. (2014). Definition of Intellectual Disability. Retrieved April 14, 2014 from http://aaidd.org/intellectual-disability/definition#.U0xiPVz1pBU
Anderson, L, Larson, S A, & Wuorio, A. (2011). 2010 FINDS National Survey. Family and Individual Needs for Disability Supports, Technical Report Part 1:
Caregiver Survey. Available from http://www.thearc.org/document.doc?id=3673
Autism and Developmental Disabilities Monitoring Network. (2014). Prevalence of Autism Spectrum Disorder Among Children Aged 8 years-11 Sites, United States, 2010. Available from http://www.cdc.gov/mmwr/pdf/ss/ss6302.pdf
Badens, C., Martini, N., Courrier, S., DesPortes, V., Touraine, R., Levy, N., & Edery, P. (2006). ATRX syndrome in a girl with a heterozygous mutation in the ATRX Zn finger domain and a totally skewed X-inactivation pattern. American Journal of Medical Genetics. Part A, 140(20), 2212-2215. doi: 10.1002/ajmg.a.31400
Baek, J. I., Oh, S. K., Kim, D. B., Choi, S. Y., Kim, U. K., Lee, K. Y., & Lee, S. H. (2012). Targeted massive parallel sequencing: the effective detection of novel

55
causative mutations associated with hearing loss in small families. Orphanet Journal of Rare Diseases, 7, 60. doi: 10.1186/1750-1172-7-60
Barnard-Brak, L., Sulak, T., & Hatz, J. K. (2011). Macrocephaly in children with autism spectrum disorders. Pediatric Neurology, 44(2), 97-100. doi: 10.1016/j.pediatrneurol.2010.09.011
Berg, A. T., Berkovic, S. F., Brodie, M. J., Buchhalter, J., Cross, J. H., van Emde Boas, W., . . . Scheffer, I. E. (2010). Revised terminology and concepts for organization of seizures and epilepsies: report of the ILAE Commission on Classification and Terminology, 2005-2009. Epilepsia, 51(4), 676-685. doi: 10.1111/j.1528-1167.2010.02522.x
Bettella, E., Di Rosa, G., Polli, R., Leonardi, E., Tortorella, G., Sartori, S., & Murgia, A. (2013). Early-onset epileptic encephalopathy in a girl carrying a truncating mutation of the ARX gene: rethinking the ARX phenotype in females. Clinical Genetics, 84(1), 82-85. doi: 10.1111/cge.12034
Bittles, A. H., Petterson, B. A., Sullivan, S. G., Hussain, R., Glasson, E. J., & Montgomery, P. D. (2002). The influence of intellectual disability on life expectancy. Journals of Gerontology. Series A: Biological Sciences and Medical Sciences, 57(7), M470-472.
Bonneau, D., Toutain, A., Laquerriere, A., Marret, S., Saugier-Veber, P., Barthez, M. A., . . . Gelot, A. (2002). X-linked lissencephaly with absent corpus callosum and ambiguous genitalia (XLAG): clinical, magnetic resonance imaging, and neuropathological findings. Annals of Neurology, 51(3), 340-349.
Braddock, D, Hemp, R, Rizzolo, MC, Haffer, L, Tanis, ES, & Wu, J. (2011). State of the States in Developmental Disabilities: 2011. Washington, DC: American Association on Intellectual and Developmental Disabilities.
Brunham, L. R., & Hayden, M. R. (2012). Medicine. Whole-genome sequencing: the new standard of care? Science, 336(6085), 1112-1113. doi: 10.1126/science.1220967
Bui, T. H., Vetro, A., Zuffardi, O., & Shaffer, L. G. (2011). Current controversies in prenatal diagnosis 3: is conventional chromosome analysis necessary in the post-array CGH era? Prenatal Diagnosis, 31(3), 235-243. doi: 10.1002/pd.2722

56
Calvo, S. E., Compton, A. G., Hershman, S. G., Lim, S. C., Lieber, D. S., Tucker, E. J., . . . Mootha, V. K. (2012). Molecular diagnosis of infantile mitochondrial disease with targeted next-generation sequencing. Science Translational Medicine, 4(118), 118ra110. doi: 10.1126/scitranslmed.3003310
Centers for Disease Control and Prevention. (2014). Autism spectrum disorder (ASD). Retrieved April 14, 2014 from http://www.cdc.gov/ncbddd/autism/data.html
Chen, X., Zhao, K., Sheng, X., Li, Y., Gao, X., Zhang, X., . . . Zhao, C. (2013). Targeted sequencing of 179 genes associated with hereditary retinal dystrophies and 10 candidate genes identifies novel and known mutations in patients with various retinal diseases. Investigative Ophthalmology and Visual Science, 54(3), 2186-2197. doi: 10.1167/iovs.12-10967
City of Hope Molecular Diagnostic Laboratory. (2014). Non-Syndromic X-Linked Mental Retardation Mutation Analysis. Retrieved April 14, 2014 from http://www.cityofhope.org/XLMR_panel
Clynes, D., & Gibbons, R. J. (2013). ATRX and the replication of structured DNA. Current Opinion in Genetics and Development, 23(3), 289-294. doi: 10.1016/j.gde.2013.01.005
Clynes, D., Higgs, D. R., & Gibbons, R. J. (2013). The chromatin remodeller ATRX: a repeat offender in human disease. Trends in Biochemical Sciences, 38(9), 461-466. doi: 10.1016/j.tibs.2013.06.011
Coffey, S. M., Cook, K., Tartaglia, N., Tassone, F., Nguyen, D. V., Pan, R., . . . Hagerman, R. J. (2008). Expanded clinical phenotype of women with the FMR1 premutation. American Journal of Medical Genetics. Part A, 146A(8), 1009-1016. doi: 10.1002/ajmg.a.32060
Conway, G. S., Hettiarachchi, S., Murray, A., & Jacobs, P. A. (1995). Fragile X premutations in familial premature ovarian failure. Lancet, 346(8970), 309-310.
Coppus, A. M. (2013). People with intellectual disability: what do we know about adulthood and life expectancy? Developmental Disabilities Research Reviews, 18(1), 6-16. doi: 10.1002/ddrr.1123
Curry, C. J., Stevenson, R. E., Aughton, D., Byrne, J., Carey, J. C., Cassidy, S., . . . Opitz, J. (1997). Evaluation of mental retardation: recommendations of a Consensus

57
Conference: American College of Medical Genetics. American Journal of Medical Genetics, 72(4), 468-477.
Darras, B.T., Miller, D.T. & Urion, D.K. (2011). Dystrophinopathies. NCBI Bookshelf: GeneReviews®. Available from: http://www.ncbi.nlm.nih.gov/books/NBK1119/
de Brouwer, A. P., Nabuurs, S. B., Verhaart, I. E., Oudakker, A. R., Hordijk, R., Yntema, H. G., . . . Kleefstra, T. (2013). A 3-base pair deletion, c.9711_9713del, in DMD results in intellectual disability without muscular dystrophy. European Journal of Human Genetics. doi: 10.1038/ejhg.2013.169
de Brouwer, A. P., Yntema, H. G., Kleefstra, T., Lugtenberg, D., Oudakker, A. R., de Vries, B. B., . . . Hamel, B. C. (2007). Mutation frequencies of X-linked mental retardation genes in families from the EuroMRX consortium. Human Mutation, 28(2), 207-208. doi: 10.1002/humu.9482
Dent, K. M., Dunn, D. M., von Niederhausern, A. C., Aoyagi, A. T., Kerr, L., Bromberg,
M. B., . . . Flanigan, K. M. (2005). Improved molecular diagnosis of
dystrophinopathies in an unselected clinical cohort. American Journal of
Medical Genetics. Part A, 134(3), 295-298. doi: 10.1002/ajmg.a.30617
Dillenburger, K, & McKerr, L. (2011). ‘How long are we able to go on?’ Issues faced by older family caregivers of adults with disabilities. British Journal of Learning Disabilities, 39(1), 29-38. doi: 10.1111/j.1468-3156.2010.00613.x
Drmanac, R. (2012). Medicine. The ultimate genetic test. Science, 336(6085), 1110-1112. doi: 10.1126/science.1221037
Emerson, E. (2012). Deprivation, ethnicity and the prevalence of intellectual and developmental disabilities. Journal of Epidemiology and Community Health, 66(3), 218-224. doi: 10.1136/jech.2010.111773
Emory Genetics Laboratory. (2014). X-linked Intellectual Disability: Gene Sequencing and Deletion/Duplication Panel. Retrieved April 14, 2014 from http://genetics.emory.edu/egl/tests/view.php?testid=4216
Farley, M. A., McMahon, W. M., Fombonne, E., Jenson, W. R., Miller, J., Gardner, M., . . . Coon, H. (2009). Twenty-year outcome for individuals with autism and average or near-average cognitive abilities. Autism Res, 2(2), 109-118. doi: 10.1002/aur.69
58
Fichera, M., Falco, M., Lo Giudice, M., Castiglia, L., Guarnaccia, V., Cali, F., . . . Avola, E. (2005). Skewed X-inactivation in a family with mental retardation and PQBP1 gene mutation. Clinical Genetics, 67(5), 446-447. doi: 10.1111/j.1399-0004.2005.00436.x
Flanigan, K. M. (2012). The muscular dystrophies. Seminars in Neurology, 32(3), 255-263. doi: 10.1055/s-0032-1329199
Flanigan, K. M., Dunn, D. M., von Niederhausern, A., Howard, M. T., Mendell, J., Connolly, A., . . . Weiss, R. B. (2009). DMD Trp3X nonsense mutation associated with a founder effect in North American families with mild Becker muscular dystrophy. Neuromuscular Disorders, 19(11), 743-748. doi: 10.1016/j.nmd.2009.08.010
Flanigan, K. M., Dunn, D. M., von Niederhausern, A., Soltanzadeh, P., Gappmaier, E., Howard, M. T., . . . Weiss, R. B. (2009). Mutational spectrum of DMD mutations in dystrophinopathy patients: application of modern diagnostic techniques to a large cohort. Human Mutation, 30(12), 1657-1666. doi: 10.1002/humu.21114
Fu, Y. H., Kuhl, D. P., Pizzuti, A., Pieretti, M., Sutcliffe, J. S., Richards, S., . . . Caskey, C. T. (1991). Variation of the CGG repeat at the fragile X site results in genetic instability: resolution of the Sherman paradox. Cell, 67(6), 1047-1058.
Gallagher, A., & Hallahan, B. (2012). Fragile X-associated disorders: a clinical overview. Journal of Neurology, 259(3), 401-413. doi: 10.1007/s00415-011-6161-3
Gecz, J., Shoubridge, C., & Corbett, M. (2009). The genetic landscape of intellectual disability arising from chromosome X. Trends in Genetics, 25(7), 308-316. doi: 10.1016/j.tig.2009.05.002
Germanaud, D., Rossi, M., Bussy, G., Gerard, D., Hertz-Pannier, L., Blanchet, P., . . . des Portes, V. (2011). The Renpenning syndrome spectrum: new clinical insights supported by 13 new PQBP1-mutated males. Clinical Genetics, 79(3), 225-235. doi: 10.1111/j.1399-0004.2010.01551.x
Gerrard, J. W., & Renpenning, H. J. (1974). Letter: Sex-linked mental retardation. Lancet, 1(7870), 1346.
Gibbons, R. J., Brueton, L., Buckle, V. J., Burn, J., Clayton-Smith, J., Davison, B. C., . . . Kingston, H. M. (1995). Clinical and hematologic aspects of the X-linked alpha-

59
thalassemia/mental retardation syndrome (ATR-X). American Journal of Medical Genetics, 55(3), 288-299. doi: 10.1002/ajmg.1320550309
Gibbons, R. J., Picketts, D. J., & Higgs, D. R. (1995). Syndromal mental retardation due to mutations in a regulator of gene expression. Human Molecular Genetics, 4 Spec No, 1705-1709.
Goncalves, T. F., Goncalves, A. P., Fintelman Rodrigues, N., Dos Santos, J. M., Goncalves Pimentel, M. M., & Santos-Reboucas, C. B. (2014). KDM5C mutational screening among males with intellectual disability suggestive of X-Linked inheritance and review of the literature. European Journal of Medical Genetics. doi: 10.1016/j.ejmg.2014.02.011
Grafodatskaya, D., Chung, B. H., Butcher, D. T., Turinsky, A. L., Goodman, S. J., Choufani, S., . . . Weksberg, R. (2013). Multilocus loss of DNA methylation in individuals with mutations in the histone H3 lysine 4 demethylase KDM5C. BMC Medical Genomics, 6, 1. doi: 10.1186/1755-8794-6-1
Grandgeorge, M., Lemonnier, E., & Jallot, N. (2013). Autism spectrum disorders: head circumference and body length at birth are both relative. Acta Paediatrica, 102(9), 901-907. doi: 10.1111/apa.12264
Greenwood Genetic Center. (2014). X-linked Intellectual Disability (XLID). Retrieved April 14, 2014 from http://www.ggc.org/diagnostic/tests-costs/test-finder/test-finder.html?id=242
Guerrini, R., Shanahan, J. L., Carrozzo, R., Bonanni, P., Higgs, D. R., & Gibbons, R. J. (2000). A nonsense mutation of the ATRX gene causing mild mental retardation and epilepsy. Annals of Neurology, 47(1), 117-121.
Hackett, A., Tarpey, P. S., Licata, A., Cox, J., Whibley, A., Boyle, J., . . . Abidi, F. E. (2010). CASK mutations are frequent in males and cause X-linked nystagmus and variable XLMR phenotypes. European Journal of Human Genetics, 18(5), 544-552. doi: 10.1038/ejhg.2009.220
Hagerman, R. J., Jackson, C., Amiri, K., Silverman, A. C., O'Connor, R., & Sobesky, W. (1992). Girls with fragile X syndrome: physical and neurocognitive status and outcome. Pediatrics, 89(3), 395-400.
60
Hagerman, R. J., Leehey, M., Heinrichs, W., Tassone, F., Wilson, R., Hills, J., . . . Hagerman, P. J. (2001). Intention tremor, parkinsonism, and generalized brain atrophy in male carriers of fragile X. Neurology, 57(1), 127-130.
Hoogerwaard, E. M., van der Wouw, P. A., Wilde, A. A., Bakker, E., Ippel, P. F., Oosterwijk, J. C., . . . de Visser, M. (1999). Cardiac involvement in carriers of Duchenne and Becker muscular dystrophy. Neuromuscular Disorders, 9(5), 347-351.
Hundscheid, R. D., Braat, D. D., Kiemeney, L. A., Smits, A. P., & Thomas, C. M. (2001). Increased serum FSH in female fragile X premutation carriers with either regular menstrual cycles or on oral contraceptives. Human Reproduction, 16(3), 457-462.
Hunter, A. G., Graham, J. M., Jr., Neri, G., Rogers, R. C., Stevenson, R. E., Turner, G., & Friez, M. J. (2014). The intellectual disabilities evaluation and advice system (IDEAS): Outcome of the first 55 cases. American Journal of Medical Genetics. Part A. doi: 10.1002/ajmg.a.36456
Iowa Institute of Human Genetics. (2014). Whole Exome Sequencing. Retrieved April 17, 2014 from https://www.medicine.uiowa.edu/humangenetics/wholeexome/
Iwase, S., Lan, F., Bayliss, P., de la Torre-Ubieta, L., Huarte, M., Qi, H. H., . . . Shi, Y. (2007). The X-linked mental retardation gene SMCX/JARID1C defines a family of histone H3 lysine 4 demethylases. Cell, 128(6), 1077-1088. doi: 10.1016/j.cell.2007.02.017
Jensen, L. R., Amende, M., Gurok, U., Moser, B., Gimmel, V., Tzschach, A., . . . Lenzner, S. (2005). Mutations in the JARID1C gene, which is involved in transcriptional regulation and chromatin remodeling, cause X-linked mental retardation. American Journal of Human Genetics, 76(2), 227-236. doi: 10.1086/427563
Johnston, C. M., Lovell, F. L., Leongamornlert, D. A., Stranger, B. E., Dermitzakis, E. T., & Ross, M. T. (2008). Large-scale population study of human cell lines indicates that dosage compensation is virtually complete. PLoS Genetics, 4(1), e9. doi: 10.1371/journal.pgen.0040009
Kaepernick, L., Legius, E., Higgins, J., & Kapur, S. (1994). Clinical aspects of the MASA syndrome in a large family, including expressing females. Clinical Genetics, 45(4), 181-185.
61
Kalscheuer, V. M., Freude, K., Musante, L., Jensen, L. R., Yntema, H. G., Gecz, J., . . . Ropers, H. H. (2003). Mutations in the polyglutamine binding protein 1 gene cause X-linked mental retardation. Nature Genetics, 35(4), 313-315. doi: 10.1038/ng1264
Kato, M., Das, S., Petras, K., Kitamura, K., Morohashi, K., Abuelo, D. N., . . . Dobyns, W. B. (2004). Mutations of ARX are associated with striking pleiotropy and consistent genotype-phenotype correlation. Human Mutation, 23(2), 147-159. doi: 10.1002/humu.10310
Kato, M., Das, S., Petras, K., Sawaishi, Y., & Dobyns, W. B. (2003). Polyalanine expansion of ARX associated with cryptogenic West syndrome. Neurology, 61(2), 267-276.
Kitamura, K., Yanazawa, M., Sugiyama, N., Miura, H., Iizuka-Kogo, A., Kusaka, M., . . . Morohashi, K. (2002). Mutation of ARX causes abnormal development of forebrain and testes in mice and X-linked lissencephaly with abnormal genitalia in humans. Nature Genetics, 32(3), 359-369. doi: 10.1038/ng1009
Kleefstra, T., Franken, C. E., Arens, Y. H., Ramakers, G. J., Yntema, H. G., Sistermans, E. A., . . . Hamel, B. C. (2004). Genotype-phenotype studies in three families with mutations in the polyglutamine-binding protein 1 gene (PQBP1). Clinical Genetics, 66(4), 318-326. doi: 10.1111/j.1399-0004.2004.00308.x
Kunde, S. A., Musante, L., Grimme, A., Fischer, U., Muller, E., Wanker, E. E., & Kalscheuer, V. M. (2011). The X-chromosome-linked intellectual disability protein PQBP1 is a component of neuronal RNA granules and regulates the appearance of stress granules. Human Molecular Genetics, 20(24), 4916-4931. doi: 10.1093/hmg/ddr430
Legius, E., Kaepernick, L., Higgins, J. V., & Glover, T. W. (1994). Fine mapping of X-linked clasped thumb and mental retardation (MASA syndrome) in Xq28. Clinical Genetics, 45(4), 165-168.
Lejeune, J., Gauthier, M., & Turpin, R. (1959). [Human chromosomes in tissue cultures]. Comptes Rendus Hebdomadaires des Seances de l'Academie des Sciences, 248(4), 602-603.
Lemke, J. R., Riesch, E., Scheurenbrand, T., Schubach, M., Wilhelm, C., Steiner, I., . . . Biskup, S. (2012). Targeted next generation sequencing as a diagnostic tool in

62
epileptic disorders. Epilepsia, 53(8), 1387-1398. doi: 10.1111/j.1528-1167.2012.03516.x
Leonard, H., & Wen, X. (2002). The epidemiology of mental retardation: challenges and opportunities in the new millennium. Mental Retardation and Developmental Disabilities Research Reviews, 8(3), 117-134. doi: 10.1002/mrdd.10031
Lewis, C., Skirton, H., & Jones, R. (2010). Living without a diagnosis: the parental experience. Genetic Testing and Molecular Biomarkers, 14(6), 807-815. doi: 10.1089/gtmb.2010.0061
Lubs, H. A. (1969). A marker X chromosome. American Journal of Human Genetics, 21(3), 231-244.
Lubs, H., Abidi, F. E., Echeverri, R., Holloway, L., Meindl, A., Stevenson, R. E., & Schwartz, C. E. (2006). Golabi-Ito-Hall syndrome results from a missense mutation in the WW domain of the PQBP1 gene. Journal of Medical Genetics, 43(6), e30. doi: 10.1136/jmg.2005.037556
Lubs, H. A., Stevenson, R. E., & Schwartz, C. E. (2012). Fragile X and X-linked intellectual disability: four decades of discovery. American Journal of Human Genetics, 90(4), 579-590. doi: 10.1016/j.ajhg.2012.02.018
McPherson, E. W., Clemens, M. M., Gibbons, R. J., & Higgs, D. R. (1995). X-linked alpha-thalassemia/mental retardation (ATR-X) syndrome: a new kindred with severe genital anomalies and mild hematologic expression. American Journal of Medical Genetics, 55(3), 302-306. doi: 10.1002/ajmg.1320550311
Migeon, B. R. (2007). Why females are mosaics, X-chromosome inactivation, and sex differences in disease. Gender Medicine, 4(2), 97-105.
Miles, J. H., McCathren, R. B., Stichter, J., & Shinawi, M. (2010). Autism Spectrum Disorders. NCBI Bookshelf: GeneReviews®. Available from: http://www.ncbi.nlm.nih.gov/books/NBK1442/
Monaco, A. P., Bertelson, C. J., Liechti-Gallati, S., Moser, H., & Kunkel, L. M. (1988). An explanation for the phenotypic differences between patients bearing partial deletions of the DMD locus. Genomics, 2(1), 90-95.
63
Moog, U., Kutsche, K., Kortum, F., Chilian, B., Bierhals, T., Apeshiotis, N., . . . Uyanik, G. (2011). Phenotypic spectrum associated with CASK loss-of-function mutations. Journal of Medical Genetics, 48(11), 741-751. doi: 10.1136/jmedgenet-2011-100218
Moog, U., Uyanik, G., Kutsche, K. (2013). CASK-Related Disorders. NCBI Bookshelf: GeneReviews®. Available from: http://www.ncbi.nlm.nih.gov/books/NBK169825/
Najm, J., Horn, D., Wimplinger, I., Golden, J. A., Chizhikov, V. V., Sudi, J., . . . Kutsche, K. (2008). Mutations of CASK cause an X-linked brain malformation phenotype with microcephaly and hypoplasia of the brainstem and cerebellum. Nature Genetics, 40(9), 1065-1067. doi: 10.1038/ng.194
Natale, V., & Rajagopalan, A. (2014). Worldwide variation in human growth and the World Health Organization growth standards: a systematic review. BMJ Open, 4(1), e003735. doi: 10.1136/bmjopen-2013-003735
National Center for Biotechnology Information. (2014). DMD dystrophin [Homo sapiens (human)]. Retrieved April 14, 2014 from http://www.ncbi.nlm.nih.gov/gene/1756
National Fragile X Foundation. (2014). Prevalence. Retrieved on January 7, 2014 from http://www.fragilex.org/fragile-x-associated-disorders/prevalence/
Neri, M., Torelli, S., Brown, S., Ugo, I., Sabatelli, P., Merlini, L., . . . Muntoni, F. (2007). Dystrophin levels as low as 30% are sufficient to avoid muscular dystrophy in the human. Neuromuscular Disorders, 17(11-12), 913-918. doi: 10.1016/j.nmd.2007.07.005
Nguyen, D. K., & Disteche, C. M. (2006). High expression of the mammalian X chromosome in brain. Brain Research, 1126(1), 46-49. doi: 10.1016/j.brainres.2006.08.053
Olivetti, P. R., & Noebels, J. L. (2012). Interneuron, interrupted: molecular pathogenesis of ARX mutations and X-linked infantile spasms. Current Opinion in Neurobiology, 22(5), 859-865. doi: 10.1016/j.conb.2012.04.006
Ounap, K., Puusepp-Benazzouz, H., Peters, M., Vaher, U., Rein, R., Proos, A., . . . Reimand, T. (2012). A novel c.2T > C mutation of the KDM5C/JARID1C gene in

64
one large family with X-linked intellectual disability. European Journal of Medical Genetics, 55(3), 178-184. doi: 10.1016/j.ejmg.2012.01.004
Parish, S. L., Rose, R. A., & Swaine, J. G. (2010). Financial well-being of US parents caring for co-resident children and adults with developmental disabilities: an age cohort analysis. Journal of Intellectual & Developmental Disability, 35(4), 235-243. doi: 10.3109/13668250.2010.519331
Piluso, G., D'Amico, F., Saccone, V., Bismuto, E., Rotundo, I. L., Di Domenico, M., . . . Nigro, V. (2009). A missense mutation in CASK causes FG syndrome in an Italian family. American Journal of Human Genetics, 84(2), 162-177. doi: 10.1016/j.ajhg.2008.12.018
Piton, A., Redin, C., & Mandel, J. L. (2013). XLID-causing mutations and associated genes challenged in light of data from large-scale human exome sequencing. American Journal of Human Genetics, 93(2), 368-383. doi: 10.1016/j.ajhg.2013.06.013
Plon, S. E., Wheeler, D. A., Strong, L. C., Tomlinson, G. E., Pirics, M., Meng, Q., . . . Gibbs, R. A. (2011). Identification of genetic susceptibility to childhood cancer through analysis of genes in parallel. Cancer Genetics, 204(1), 19-25. doi: 10.1016/j.cancergencyto.2010.11.001
Pollack, H. A. (2011). Health policy and the community safety net for individuals with intellectual disability. Dev Disabil Res Rev, 17(1), 44-51. doi: 10.1002/ddrr.138
Proud, V. K., Levine, C., & Carpenter, N. J. (1992). New X-linked syndrome with seizures, acquired micrencephaly, and agenesis of the corpus callosum. American Journal of Medical Genetics, 43(1-2), 458-466.
Rauch, A., Hoyer, J., Guth, S., Zweier, C., Kraus, C., Becker, C., . . . Trautmann, U. (2006). Diagnostic yield of various genetic approaches in patients with unexplained developmental delay or mental retardation. American Journal of Medical Genetics. Part A, 140(19), 2063-2074. doi: 10.1002/ajmg.a.31416
Roberts, J. E., Bailey, D. B., Jr., Mankowski, J., Ford, A., Sideris, J., Weisenfeld, L. A., . . . Golden, R. N. (2009). Mood and anxiety disorders in females with the FMR1 premutation. American Journal of Medical Genetics. Part B: Neuropsychiatric Genetics, 150B(1), 130-139. doi: 10.1002/ajmg.b.30786
65
Rodriguez-Revenga, L., Madrigal, I., Pagonabarraga, J., Xuncla, M., Badenas, C., Kulisevsky, J., . . . Mila, M. (2009). Penetrance of FMR1 premutation associated pathologies in fragile X syndrome families. European Journal of Human Genetics, 17(10), 1359-1362. doi: 10.1038/ejhg.2009.51
Ropers, H. H. (2008). Genetics of intellectual disability. Current Opinion in Genetics and Development, 18(3), 241-250. doi: 10.1016/j.gde.2008.07.008
Rosenthal, E. T., Biesecker, L. G., & Biesecker, B. B. (2001). Parental attitudes toward a diagnosis in children with unidentified multiple congenital anomaly syndromes. American Journal of Medical Genetics, 103(2), 106-114.
Rowbotham, M., Cuskelly, M., & Carroll, A. (2011). Sustainable caregiving? Demands upon and resources of female carers of adults with intellectual disability. Journal of Women and Aging, 23(2), 129-148. doi: 10.1080/08952841.2011.561141
Saul, R. A. & Tarleton, J. C. (2012). FMR1-Related Disorders. NCBI Bookshelf: GeneReviews®. Available from: http://www.ncbi.nlm.nih.gov/books/NBK1384/
Scheffer, I. E., Wallace, R. H., Phillips, F. L., Hewson, P., Reardon, K., Parasivam, G., . . . Mulley, J. C. (2002). X-linked myoclonic epilepsy with spasticity and intellectual disability: mutation in the homeobox gene ARX. Neurology, 59(3), 348-356.
Schrander-Stumpel, C. & Vos, Y. J. (2010). L1 Syndrome. NCBI Bookshelf: GeneReviews®. Available from: http://www.ncbi.nlm.nih.gov/books/NBK1484/
Scior, K. (2011). Public awareness, attitudes and beliefs regarding intellectual disability: a systematic review. Research in Developmental Disabilities, 32(6), 2164-2182. doi: 10.1016/j.ridd.2011.07.005
Shorvon, S. D. (2011). The etiologic classification of epilepsy. Epilepsia, 52(6), 1052-1057. doi: 10.1111/j.1528-1167.2011.03041.x
Shoubridge, C., Fullston, T., & Gecz, J. (2010). ARX spectrum disorders: making inroads into the molecular pathology. Human Mutation, 31(8), 889-900. doi: 10.1002/humu.21288
66
Stevenson, R.E. (2010). Alpha-Thalassemia X-Linked Intellectual Disability Syndrome. NCBI Bookshelf: GeneReviews®. Available from: http://www.ncbi.nlm.nih.gov/books/NBK1449/
Stevenson, R. E., Bennett, C. W., Abidi, F., Kleefstra, T., Porteous, M., Simensen, R. J., . . . Schwartz, C. E. (2005). Renpenning syndrome comes into focus. American Journal of Medical Genetics. Part A, 134(4), 415-421. doi: 10.1002/ajmg.a.30664
Stevenson, R. E., Schwartz, C. E., & Rogers, R. C. (2012). Atlas of X-linked intellectual
disability syndromes (2nd ed.). Oxford ; New York: Oxford University Press
Stromme, P., Mangelsdorf, M. E., Scheffer, I. E., & Gecz, J. (2002). Infantile spasms, dystonia, and other X-linked phenotypes caused by mutations in Aristaless related homeobox gene, ARX. Brain and Development, 24(5), 266-268.
Strydom, A., Romeo, R., Perez-Achiaga, N., Livingston, G., King, M., Knapp, M., & Hassiotis, A. (2010). Service use and cost of mental disorder in older adults with intellectual disability. British Journal of Psychiatry, 196(2), 133-138. doi: 10.1192/bjp.bp.108.060939
Sutherland, G. R., Gedeon, A. K., Haan, E. A., Woodroffe, P., & Mulley, J. C. (1988). Linkage studies with the gene for an X-linked syndrome of mental retardation, microcephaly and spastic diplegia (MRX2). American Journal of Medical Genetics, 30(1-2), 493-508.
Tahiliani, M., Mei, P., Fang, R., Leonor, T., Rutenberg, M., Shimizu, F., . . . Shi, Y. (2007). The histone H3K4 demethylase SMCX links REST target genes to X-linked mental retardation. Nature, 447(7144), 601-605. doi: 10.1038/nature05823
Tarpey, P. S., Smith, R., Pleasance, E., Whibley, A., Edkins, S., Hardy, C., . . . Stratton, M. R. (2009). A systematic, large-scale resequencing screen of X-chromosome coding exons in mental retardation. Nature Genetics, 41(5), 535-543. doi: 10.1038/ng.367
Tirosh, E., & Jaffe, M. (2011). Global developmental delay and mental retardation--a pediatric perspective. Developmental Disabilities Research Reviews, 17(2), 85-92. doi: 10.1002/ddrr.1103
Turner, G., Partington, M., Kerr, B., Mangelsdorf, M., & Gecz, J. (2002). Variable expression of mental retardation, autism, seizures, and dystonic hand movements
67
in two families with an identical ARX gene mutation. American Journal of Medical Genetics, 112(4), 405-411. doi: 10.1002/ajmg.10714
University of Chicago Genetic Services. (2014). X-Linked Non-Specific Intellectual Disability Panel. Retrieved April 14, 2014 from http://dnatesting.uchicago.edu/tests/341
Vashishtha, M., Ng, C. W., Yildirim, F., Gipson, T. A., Kratter, I. H., Bodai, L., . . . Thompson, L. M. (2013). Targeting H3K4 trimethylation in Huntington disease. Proceedings of the National Academy of Sciences of the United States of America, 110(32), E3027-3036. doi: 10.1073/pnas.1311323110
Verkerk, A. J., Pieretti, M., Sutcliffe, J. S., Fu, Y. H., Kuhl, D. P., Pizzuti, A., . . . Warren, S. T. (1991). Identification of a gene (FMR-1) containing a CGG repeat coincident with a breakpoint cluster region exhibiting length variation in fragile X syndrome. Cell, 65(5), 905-914.
Vorsanova, S. G., Yurov, Y. B., & Iourov, I. Y. (2010). Human interphase chromosomes: a review of available molecular cytogenetic technologies. Molecular Cytogenetics, 3, 1. doi: 10.1186/1755-8166-3-1
Vos, Y. J., de Walle, H. E., Bos, K. K., Stegeman, J. A., Ten Berge, A. M., Bruining, M., . . . Hofstra, R. M. (2010). Genotype-phenotype correlations in L1 syndrome: a guide for genetic counselling and mutation analysis. Journal of Medical Genetics, 47(3), 169-175. doi: 10.1136/jmg.2009.071688
Vos, Y. J., & Hofstra, R. M. (2010). An updated and upgraded L1CAM mutation database. Human Mutation, 31(1), E1102-1109. doi: 10.1002/humu.21172
Wada, T., Sugie, H., Fukushima, Y., & Saitoh, S. (2005). Non-skewed X-inactivation may cause mental retardation in a female carrier of X-linked alpha-thalassemia/mental retardation syndrome (ATR-X): X-inactivation study of nine female carriers of ATR-X. American Journal of Medical Genetics. Part A, 138(1), 18-20. doi: 10.1002/ajmg.a.30901
Wang, T., Bray, S. M., & Warren, S. T. (2012). New perspectives on the biology of fragile X syndrome. Current Opinion in Genetics and Development, 22(3), 256-263. doi: 10.1016/j.gde.2012.02.002

68
Werner, S., Corrigan, P., Ditchman, N., & Sokol, K. (2012). Stigma and intellectual disability: a review of related measures and future directions. Research in Developmental Disabilities, 33(2), 748-765. doi: 10.1016/j.ridd.2011.10.009
Woods, C. G., & Parker, A. (2013). Investigating microcephaly. Archives of Disease in Childhood, 98(9), 707-713. doi: 10.1136/archdischild-2012-302882
Yang, Q., Rasmussen, S. A., & Friedman, J. M. (2002). Mortality associated with Down's syndrome in the USA from 1983 to 1997: a population-based study. Lancet, 359(9311), 1019-1025.
Yntema, H. G., Poppelaars, F. A., Derksen, E., Oudakker, A. R., van Roosmalen, T., Jacobs, A., . . . van Bokhoven, H. (2002). Expanding phenotype of XNP mutations: mild to moderate mental retardation. American Journal of Medical Genetics, 110(3), 243-247. doi: 10.1002/ajmg.10446
Zrnova, E., Vranova, V., Slamova, I., Gaillyova, R., & Kuglik, P. (2011). Analysis of chromosomal aberrations in patients with mental retardation using the array-CGH technique: a single Czech centre experience. Folia Biologica (Praha), 57(5), 206-215.

69
Appendix A: X-linked Intellectual Disability Panel Variants
Table A.1
X-linked Intellectual Disability Panel Variants
Study ID Sex Gene Molecular Protein Class Interpretation 070 M ABCD1 c.1634+12 C>T NS R VUS 446 M ABCD1 c.1489-6delC NS R VUS 450 M ABCD1 c.108G>A p.V36V S VUS 456 M ABCD1 c.1489-6delC NS R VUS 225 M ABCD1 c.1429G>A p.E477K M VUS
070 M ACSL4 c.308G>C p.S103T M VUS 109 M ACSL4 c.929+3 A>G NS R VUS 122 M ACSL4 c.1978+11 A>G NS R VUS 152 M ACSL4 c.1821-10 G>A NS R VUS 193 F ACSL4 c.1448A>G p.Y483C M VUS
257 M ACSL4 c.82A>G p.I28V M VUS 298 M ACSL4 c.1054-9T>A NS R VUS 521 M ACSL4 c.1384A>G p.I462V M VUS 529 M ACSL4 c.72C>T p.A24A S VUS 553 F ACSL4 c.1514-7T>C NS R VUS
133 M AFF2 c.3088A>C p.I1030L M VUS 222 M AFF2 c.3268T>A p.F1090I M VUS 250 F AFF2 c.3837 A>G het p.T1279T S VUS 362 F AFF2 c.3701C>G p.T1234S M VUS 365 M AFF2 c.180T>C p.Y60Y S VUS
410 M AFF2 c.2569-21G>A NS R VUS 575 M AFF2 c.496 C>T p.P166S M VUS 490 M AFF2 c.294A>G p.P98P S VUS 233 M AGTR2 c.402delT p.F134F S VUS 304 M AGTR2 c.127C>T p.H43Y M VUS
220 M AP1S2 c.289-10delT NS R VUS 534 M AP1S2 c.138C>A p.C46X N P 144 M ARHGEF6 c.2331+9G>C NS R VUS 200 M ARHGEF6 c.2051C>T p.S684F M VUS 200 M ARHGEF6 c.334+7C>T NS R VUS
500 M ARHGEF6 c.540A>G p.S180S S VUS 509 M ARHGEF6 c.2093T>C p.I698T M VUS 224 M ARHGEF6 c.1483 A>G p.K495E M VUS 283 M ARHGEF6 c.2309G>A p.S770N M VUS 119 M ARHGEF9 c.1094G>A p.R365H M VUS
227 M ARHGEF9 c.865C>T p.R289X N P 354 M ARHGEF9 c.691_709del19 NS D P 570 M ARHGEF9 c.30C>T p.I10I S VUS 018 M ARX c.1318_1320 dup GGC NS I VUS 053 M ARX c.665_670dupGCACCG NS I VUS
088 M ARX c.303A>G p.A101A S VUS 164 M ARX c.441_464dup24 NS I P 196 M ARX c.1671G>A p.T557T S VUS 267 M ARX c.904G>A p.A302T M VUS 508 M ARX c.315_335dup21 NS I P
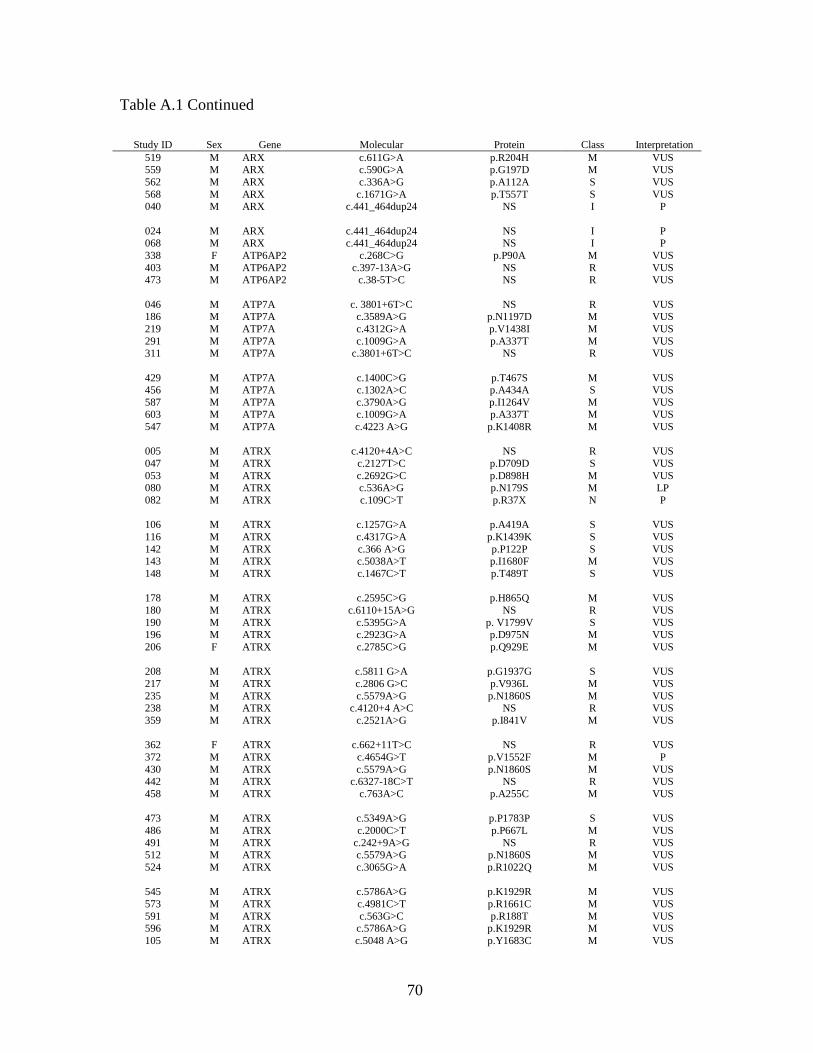
70
Table A.1 Continued
Study ID Sex Gene Molecular Protein Class Interpretation 519 M ARX c.611G>A p.R204H M VUS 559 M ARX c.590G>A p.G197D M VUS 562 M ARX c.336A>G p.A112A S VUS 568 M ARX c.1671G>A p.T557T S VUS 040 M ARX c.441_464dup24 NS I P
024 M ARX c.441_464dup24 NS I P 068 M ARX c.441_464dup24 NS I P 338 F ATP6AP2 c.268C>G p.P90A M VUS 403 M ATP6AP2 c.397-13A>G NS R VUS 473 M ATP6AP2 c.38-5T>C NS R VUS
046 M ATP7A c. 3801+6T>C NS R VUS 186 M ATP7A c.3589A>G p.N1197D M VUS 219 M ATP7A c.4312G>A p.V1438I M VUS 291 M ATP7A c.1009G>A p.A337T M VUS 311 M ATP7A c.3801+6T>C NS R VUS
429 M ATP7A c.1400C>G p.T467S M VUS 456 M ATP7A c.1302A>C p.A434A S VUS 587 M ATP7A c.3790A>G p.I1264V M VUS 603 M ATP7A c.1009G>A p.A337T M VUS 547 M ATP7A c.4223 A>G p.K1408R M VUS
005 M ATRX c.4120+4A>C NS R VUS 047 M ATRX c.2127T>C p.D709D S VUS 053 M ATRX c.2692G>C p.D898H M VUS 080 M ATRX c.536A>G p.N179S M LP 082 M ATRX c.109C>T p.R37X N P
106 M ATRX c.1257G>A p.A419A S VUS 116 M ATRX c.4317G>A p.K1439K S VUS 142 M ATRX c.366 A>G p.P122P S VUS 143 M ATRX c.5038A>T p.I1680F M VUS 148 M ATRX c.1467C>T p.T489T S VUS
178 M ATRX c.2595C>G p.H865Q M VUS 180 M ATRX c.6110+15A>G NS R VUS 190 M ATRX c.5395G>A p. V1799V S VUS 196 M ATRX c.2923G>A p.D975N M VUS 206 F ATRX c.2785C>G p.Q929E M VUS
208 M ATRX c.5811 G>A p.G1937G S VUS 217 M ATRX c.2806 G>C p.V936L M VUS 235 M ATRX c.5579A>G p.N1860S M VUS 238 M ATRX c.4120+4 A>C NS R VUS 359 M ATRX c.2521A>G p.I841V M VUS
362 F ATRX c.662+11T>C NS R VUS 372 M ATRX c.4654G>T p.V1552F M P 430 M ATRX c.5579A>G p.N1860S M VUS 442 M ATRX c.6327-18C>T NS R VUS 458 M ATRX c.763A>C p.A255C M VUS
473 M ATRX c.5349A>G p.P1783P S VUS 486 M ATRX c.2000C>T p.P667L M VUS 491 M ATRX c.242+9A>G NS R VUS 512 M ATRX c.5579A>G p.N1860S M VUS 524 M ATRX c.3065G>A p.R1022Q M VUS
545 M ATRX c.5786A>G p.K1929R M VUS 573 M ATRX c.4981C>T p.R1661C M VUS 591 M ATRX c.563G>C p.R188T M VUS 596 M ATRX c.5786A>G p.K1929R M VUS 105 M ATRX c.5048 A>G p.Y1683C M VUS
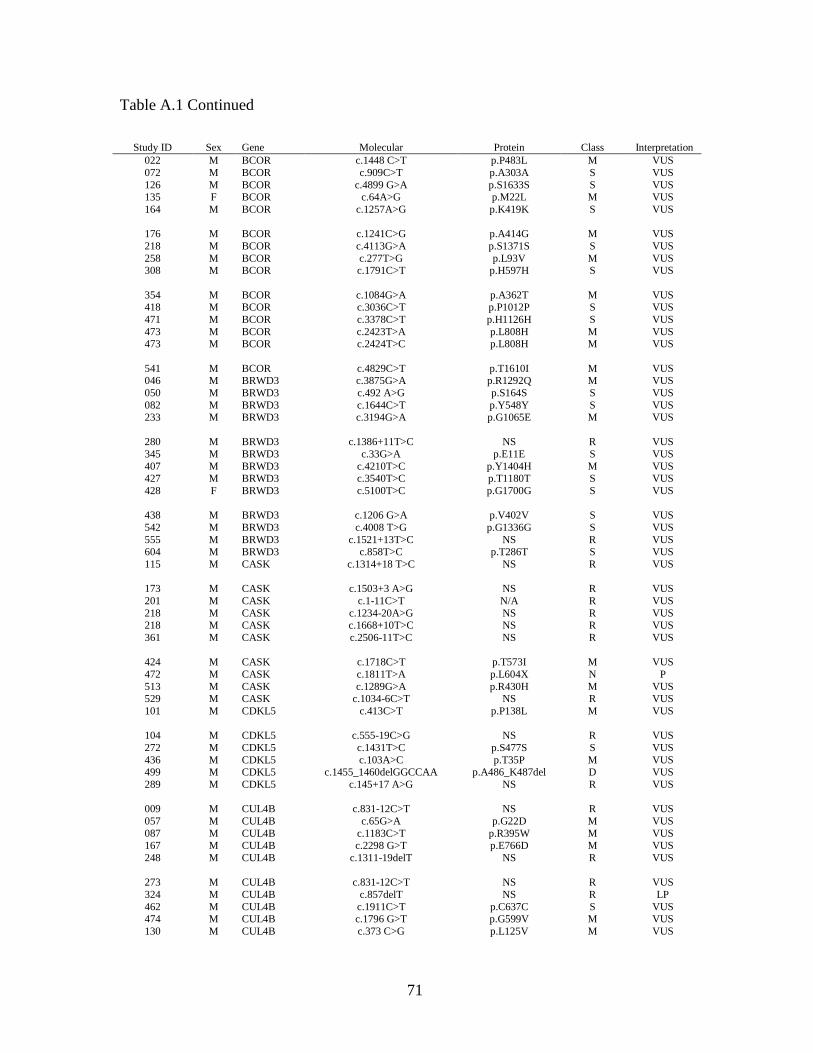
71
Table A.1 Continued
Study ID Sex Gene Molecular Protein Class Interpretation 022 M BCOR c.1448 C>T p.P483L M VUS 072 M BCOR c.909C>T p.A303A S VUS 126 M BCOR c.4899 G>A p.S1633S S VUS 135 F BCOR c.64A>G p.M22L M VUS 164 M BCOR c.1257A>G p.K419K S VUS
176 M BCOR c.1241C>G p.A414G M VUS 218 M BCOR c.4113G>A p.S1371S S VUS 258 M BCOR c.277T>G p.L93V M VUS 308 M BCOR c.1791C>T p.H597H S VUS
354 M BCOR c.1084G>A p.A362T M VUS 418 M BCOR c.3036C>T p.P1012P S VUS 471 M BCOR c.3378C>T p.H1126H S VUS 473 M BCOR c.2423T>A p.L808H M VUS 473 M BCOR c.2424T>C p.L808H M VUS
541 M BCOR c.4829C>T p.T1610I M VUS 046 M BRWD3 c.3875G>A p.R1292Q M VUS 050 M BRWD3 c.492 A>G p.S164S S VUS 082 M BRWD3 c.1644C>T p.Y548Y S VUS 233 M BRWD3 c.3194G>A p.G1065E M VUS
280 M BRWD3 c.1386+11T>C NS R VUS 345 M BRWD3 c.33G>A p.E11E S VUS 407 M BRWD3 c.4210T>C p.Y1404H M VUS 427 M BRWD3 c.3540T>C p.T1180T S VUS 428 F BRWD3 c.5100T>C p.G1700G S VUS
438 M BRWD3 c.1206 G>A p.V402V S VUS 542 M BRWD3 c.4008 T>G p.G1336G S VUS 555 M BRWD3 c.1521+13T>C NS R VUS 604 M BRWD3 c.858T>C p.T286T S VUS 115 M CASK c.1314+18 T>C NS R VUS
173 M CASK c.1503+3 A>G NS R VUS 201 M CASK c.1-11C>T N/A R VUS 218 M CASK c.1234-20A>G NS R VUS 218 M CASK c.1668+10T>C NS R VUS 361 M CASK c.2506-11T>C NS R VUS
424 M CASK c.1718C>T p.T573I M VUS 472 M CASK c.1811T>A p.L604X N P 513 M CASK c.1289G>A p.R430H M VUS 529 M CASK c.1034-6C>T NS R VUS 101 M CDKL5 c.413C>T p.P138L M VUS
104 M CDKL5 c.555-19C>G NS R VUS 272 M CDKL5 c.1431T>C p.S477S S VUS 436 M CDKL5 c.103A>C p.T35P M VUS 499 M CDKL5 c.1455_1460delGGCCAA p.A486_K487del D VUS 289 M CDKL5 c.145+17 A>G NS R VUS
009 M CUL4B c.831-12C>T NS R VUS 057 M CUL4B c.65G>A p.G22D M VUS 087 M CUL4B c.1183C>T p.R395W M VUS 167 M CUL4B c.2298 G>T p.E766D M VUS 248 M CUL4B c.1311-19delT NS R VUS
273 M CUL4B c.831-12C>T NS R VUS 324 M CUL4B c.857delT NS R LP 462 M CUL4B c.1911C>T p.C637C S VUS 474 M CUL4B c.1796 G>T p.G599V M VUS 130 M CUL4B c.373 C>G p.L125V M VUS
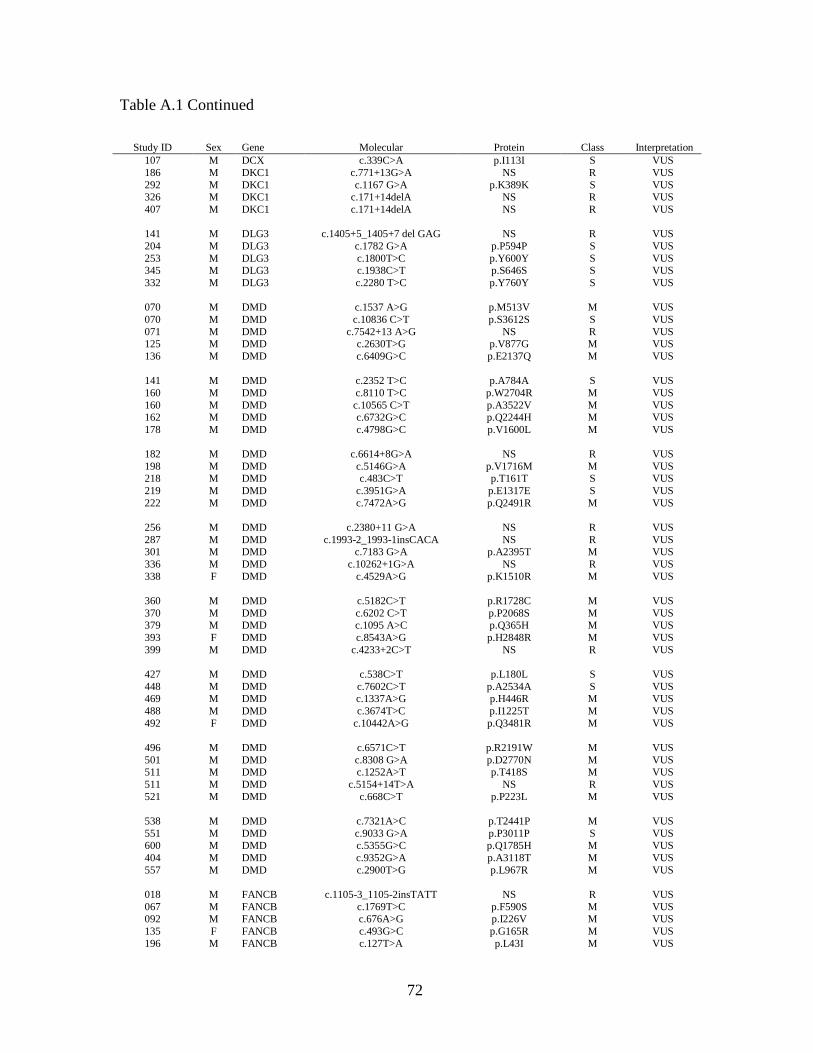
72
Table A.1 Continued
Study ID Sex Gene Molecular Protein Class Interpretation 107 M DCX c.339C>A p.I113I S VUS 186 M DKC1 c.771+13G>A NS R VUS 292 M DKC1 c.1167 G>A p.K389K S VUS 326 M DKC1 c.171+14delA NS R VUS 407 M DKC1 c.171+14delA NS R VUS
141 M DLG3 c.1405+5_1405+7 del GAG NS R VUS 204 M DLG3 c.1782 G>A p.P594P S VUS 253 M DLG3 c.1800T>C p.Y600Y S VUS 345 M DLG3 c.1938C>T p.S646S S VUS 332 M DLG3 c.2280 T>C p.Y760Y S VUS
070 M DMD c.1537 A>G p.M513V M VUS 070 M DMD c.10836 C>T p.S3612S S VUS 071 M DMD c.7542+13 A>G NS R VUS 125 M DMD c.2630T>G p.V877G M VUS 136 M DMD c.6409G>C p.E2137Q M VUS
141 M DMD c.2352 T>C p.A784A S VUS 160 M DMD c.8110 T>C p.W2704R M VUS 160 M DMD c.10565 C>T p.A3522V M VUS 162 M DMD c.6732G>C p.Q2244H M VUS 178 M DMD c.4798G>C p.V1600L M VUS
182 M DMD c.6614+8G>A NS R VUS 198 M DMD c.5146G>A p.V1716M M VUS 218 M DMD c.483C>T p.T161T S VUS 219 M DMD c.3951G>A p.E1317E S VUS 222 M DMD c.7472A>G p.Q2491R M VUS
256 M DMD c.2380+11 G>A NS R VUS 287 M DMD c.1993-2_1993-1insCACA NS R VUS 301 M DMD c.7183 G>A p.A2395T M VUS 336 M DMD c.10262+1G>A NS R VUS 338 F DMD c.4529A>G p.K1510R M VUS
360 M DMD c.5182C>T p.R1728C M VUS 370 M DMD c.6202 C>T p.P2068S M VUS 379 M DMD c.1095 A>C p.Q365H M VUS 393 F DMD c.8543A>G p.H2848R M VUS 399 M DMD c.4233+2C>T NS R VUS
427 M DMD c.538C>T p.L180L S VUS 448 M DMD c.7602C>T p.A2534A S VUS 469 M DMD c.1337A>G p.H446R M VUS 488 M DMD c.3674T>C p.I1225T M VUS 492 F DMD c.10442A>G p.Q3481R M VUS
496 M DMD c.6571C>T p.R2191W M VUS 501 M DMD c.8308 G>A p.D2770N M VUS 511 M DMD c.1252A>T p.T418S M VUS 511 M DMD c.5154+14T>A NS R VUS 521 M DMD c.668C>T p.P223L M VUS
538 M DMD c.7321A>C p.T2441P M VUS 551 M DMD c.9033 G>A p.P3011P S VUS 600 M DMD c.5355G>C p.Q1785H M VUS 404 M DMD c.9352G>A p.A3118T M VUS 557 M DMD c.2900T>G p.L967R M VUS
018 M FANCB c.1105-3_1105-2insTATT NS R VUS 067 M FANCB c.1769T>C p.F590S M VUS 092 M FANCB c.676A>G p.I226V M VUS 135 F FANCB c.493G>C p.G165R M VUS 196 M FANCB c.127T>A p.L43I M VUS
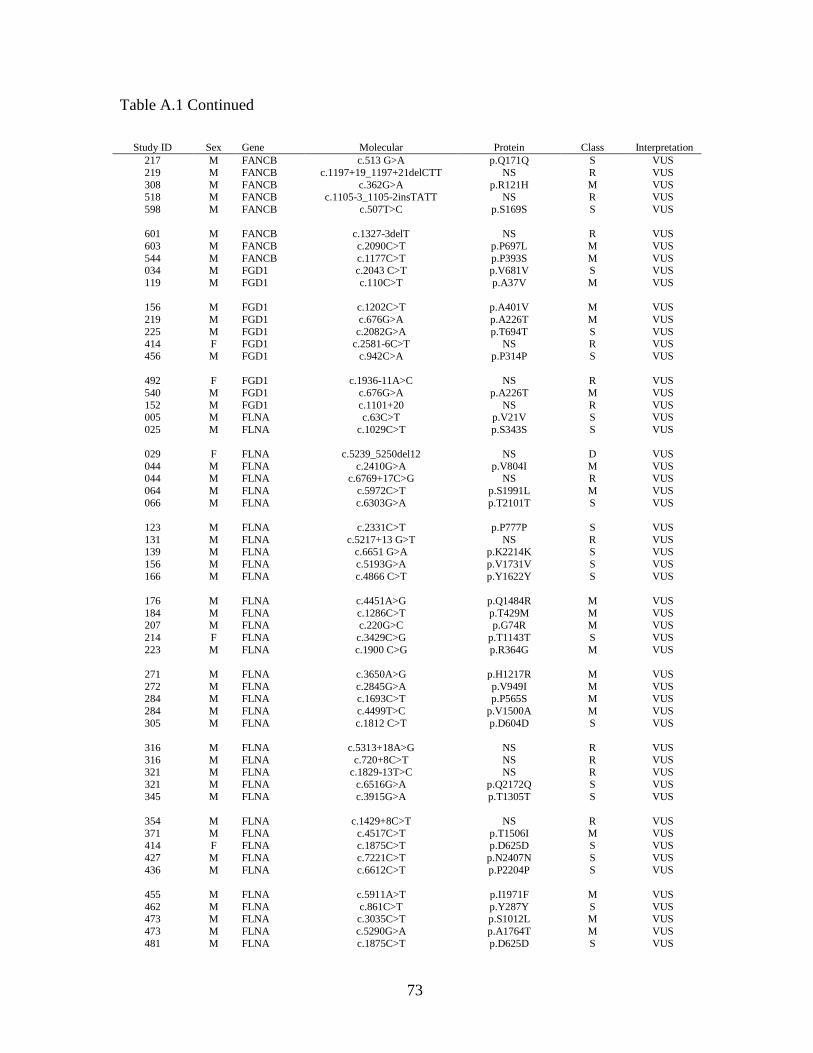
73
Table A.1 Continued
Study ID Sex Gene Molecular Protein Class Interpretation 217 M FANCB c.513 G>A p.Q171Q S VUS 219 M FANCB c.1197+19_1197+21delCTT NS R VUS 308 M FANCB c.362G>A p.R121H M VUS 518 M FANCB c.1105-3_1105-2insTATT NS R VUS 598 M FANCB c.507T>C p.S169S S VUS
601 M FANCB c.1327-3delT NS R VUS 603 M FANCB c.2090C>T p.P697L M VUS 544 M FANCB c.1177C>T p.P393S M VUS 034 M FGD1 c.2043 C>T p.V681V S VUS 119 M FGD1 c.110C>T p.A37V M VUS
156 M FGD1 c.1202C>T p.A401V M VUS 219 M FGD1 c.676G>A p.A226T M VUS 225 M FGD1 c.2082G>A p.T694T S VUS 414 F FGD1 c.2581-6C>T NS R VUS 456 M FGD1 c.942C>A p.P314P S VUS
492 F FGD1 c.1936-11A>C NS R VUS 540 M FGD1 c.676G>A p.A226T M VUS 152 M FGD1 c.1101+20 NS R VUS 005 M FLNA c.63C>T p.V21V S VUS 025 M FLNA c.1029C>T p.S343S S VUS
029 F FLNA c.5239_5250del12 NS D VUS 044 M FLNA c.2410G>A p.V804I M VUS 044 M FLNA c.6769+17C>G NS R VUS 064 M FLNA c.5972C>T p.S1991L M VUS 066 M FLNA c.6303G>A p.T2101T S VUS
123 M FLNA c.2331C>T p.P777P S VUS 131 M FLNA c.5217+13 G>T NS R VUS 139 M FLNA c.6651 G>A p.K2214K S VUS 156 M FLNA c.5193G>A p.V1731V S VUS 166 M FLNA c.4866 C>T p.Y1622Y S VUS
176 M FLNA c.4451A>G p.Q1484R M VUS 184 M FLNA c.1286C>T p.T429M M VUS 207 M FLNA c.220G>C p.G74R M VUS 214 F FLNA c.3429C>G p.T1143T S VUS 223 M FLNA c.1900 C>G p.R364G M VUS
271 M FLNA c.3650A>G p.H1217R M VUS 272 M FLNA c.2845G>A p.V949I M VUS 284 M FLNA c.1693C>T p.P565S M VUS 284 M FLNA c.4499T>C p.V1500A M VUS 305 M FLNA c.1812 C>T p.D604D S VUS
316 M FLNA c.5313+18A>G NS R VUS 316 M FLNA c.720+8C>T NS R VUS 321 M FLNA c.1829-13T>C NS R VUS 321 M FLNA c.6516G>A p.Q2172Q S VUS 345 M FLNA c.3915G>A p.T1305T S VUS
354 M FLNA c.1429+8C>T NS R VUS 371 M FLNA c.4517C>T p.T1506I M VUS 414 F FLNA c.1875C>T p.D625D S VUS 427 M FLNA c.7221C>T p.N2407N S VUS 436 M FLNA c.6612C>T p.P2204P S VUS
455 M FLNA c.5911A>T p.I1971F M VUS 462 M FLNA c.861C>T p.Y287Y S VUS 473 M FLNA c.3035C>T p.S1012L M VUS 473 M FLNA c.5290G>A p.A1764T M VUS 481 M FLNA c.1875C>T p.D625D S VUS

74
Table A.1 Continued
Study ID Sex Gene Molecular Protein Class Interpretation 485 M FLNA c.4598+8G>C NS R VUS 532 M FLNA c.6412 G>T p.G2138C M VUS 546 M FLNA c.622+16G>A NS R VUS 550 M FLNA c.6408C>T p.G2136G S VUS 560 M FLNA c.3876 C>T p.H1292H S VUS
563 M FLNA c.6412G>T p.G2138C M VUS 579 M FLNA c.1608C>T p.G536G S VUS 585 M FLNA c.7351 G>A p.V2451I M VUS 224 M FLNA c.5392 A>C p.T1798P M VUS 351 M FLNA c.1716 C>T p.T572T S VUS
353 M FLNA c.5687-12 G>A NS R VUS 431 M FLNA c.6651G>A p.K2217K S VUS 345 M FMR1 c.1857C>T p.D619D S VUS 350 M FMR1 c.1813C>T p.L605L S VUS 354 M FMR1 c.1695T>C p.N565N S VUS
442 M FMR1 c.309C>T p.Y103Y S VUS 003 M FTSJ1 c.984+8C>T NS R VUS 003 M FTSJ1 c.362-20C>T NS R VUS 043 M FTSJ1 c.219T>C p.A73A S VUS 117 M FTSJ1 c.831G>A p.T277T S VUS
552 M FTSJ1 c.349G>A p.G117R M VUS 062 M GDI1 c.991+7 C>T NS R VUS 104 M GDI1 c.587+15G>T NS R VUS 331 M GDI1 c.154-20T>A NS R VUS 381 M GDI1 c.1191+12 G>A NS R VUS
372 M GK c.877-12delT NS R VUS 459 M GK c.1479 G>A p.A493A S VUS 592 M GK c.1575T>C p.S525S S VUS 592 M GK c.501C>T p.A167A S VUS 053 M GPC3 c.1426A>T p.M476L M VUS
065 M GPC3 c.1574-7_1574-4delTTGA NS R VUS 363 M GPC3 c.1680C>T p.S560S S VUS 494 M GPC3 c.1285G>A p.V429M M VUS 533 M GPC3 c.1167-8T>C NS R VUS 038 M GRIA3 c.1501-8T>A NS R VUS
170 F GRIA3 c.1501-13dupT NS R VUS 195 M GRIA3 c.1-17T>C NS R VUS 195 M GRIA3 c.-2_-1insG NS R VUS 221 M GRIA3 c.-16T>C NS R VUS 222 M GRIA3 1878-3T>C NS R VUS
314 M GRIA3 c.1501-13_1501-12insT NS R VUS 317 M GRIA3 c.1852C>A p.Q618K M VUS 426 M GRIA3 c.1501-8T>A NS R VUS 442 M GRIA3 c.1181G>A p.R394Q M VUS 521 M GRIA3 c.2647G>A p.G883S M VUS
535 M GRIA3 c.2097C>T p.Y699Y S VUS 552 M GRIA3 c.1878-3T>C NS R VUS 555 M GRIA3 c.419A>G p.Q140R M VUS 018 M HCCS c.608+13 G>A NS R VUS 291 M HCCS c.1-2C>T NS R VUS
364 M HCCS c.654 C>T p.C218C S VUS 336 M HPRT1 c.384+19A>G NS R VUS 001 F HUWE1 c.7338+15C>T NS R VUS 005 M HUWE1 c.6914A>G p.D2305G M VUS 059 M HUWE1 c.10621A>G p.T3541A M VUS

75
Table A.1 Continued
Study ID Sex Gene Molecular Protein Class Interpretation 122 M HUWE1 c.5885-8T>C NS R VUS 140 M HUWE1 c.5716+5G>A NS R VUS 140 M HUWE1 c.6031-4T>A NS R VUS 144 M HUWE1 c.694-8dupT NS R VUS 161 M HUWE1 c.9817 C>T p.H3273Y M VUS
162 M HUWE1 c.3966G>A p.L1322L S VUS 186 M HUWE1 c.5091A>G p.G1697G S VUS 194 M HUWE1 c.12860C>T p.S4287F M VUS 234 M HUWE1 c.144+18C>T NS R VUS 245 M HUWE1 c.5716+15C>T NS R VUS
270 M HUWE1 c.8298A>G p.Q2766Q S VUS 278 M HUWE1 c.6031-4T>A NS R VUS 278 M HUWE1 c.5716+5G>A NS R VUS 304 M HUWE1 c.5885-8T>C NS R VUS 370 M HUWE1 c.3624 G>C p.K1208N M VUS
421 M HUWE1 c.3966G>A p.L1322L S VUS 431 M HUWE1 c.7662G>A p.T2554T S VUS 445 M HUWE1 c.646-18 T>C NS R VUS 492 F HUWE1 c.12364C>T p.R4122C M VUS 523 M HUWE1 c.1673-12 A>C NS R VUS
545 M HUWE1 c.4824+8_4824+9insA NS R VUS 592 M HUWE1 c.3912A>G p.T1304T S VUS 596 M HUWE1 c.4824+8_4824+9insA NS R VUS 604 M HUWE1 c.3433G>A p.E1145K M VUS 193 F IDS c.1159G>A p.A387T M VUS
244 M IDS c.1180+2T>C NS R LP 292 M IDS c.23G>T p.R8L M VUS 410 M IDS c.641C>T p.T214M M VUS 433 M IDS c.1222C>T p.P408S M VUS 458 M IDS c.123C>G p.L41L S VUS
458 M IDS c.126C>T p.I42I S VUS 530 M IDS c.1222C>T p.P408S M VUS 535 M IDS c.1181-13C>T NS R VUS 568 M IDS c.1181-13C>T NS R VUS 311 M IGBP1 c.872-3T>C NS R VUS
329 M IGBP1 c.-18 G>C NS R VUS 241 M IL1RAPL1 c.1927A>G p.I643V M VUS 282 M IL1RAPL1 c.1490G>A p.R497Q M VUS 436 M IL1RAPL1 c.1136A>G p.K379R M VUS 483 M IL1RAPL1 c.1202-6_1202-5insT NS R VUS
555 M IL1RAPL1 c.1605G>T p.T535T S VUS 013 M JARID1C c.1607G>T p.G536V M VUS 384 M JARID1C c.3778G>T p.A1260S M VUS 190 M KDM5C c.1203C>T p. A401A S VUS 252 M KDM5C c.3125delG NS FS P
588 M KDM5C c.2726G>A p.R909Q M VUS 605 M KDM5C c.3755G>A p.R1252H M VUS 135 F KIAA2022 c.964C>T p.R322X N P 183 F KIAA2022 c.1983 C>T p.H661H S VUS 360 M KIAA2022 c.813A>G p.E271E S VUS
362 F KIAA2022 c.637A>C p.R213R S VUS 565 M KIAA2022 c.2088C>T p.G696G S VUS 418 M KIAA2022 c.3756C>T p.S1252S S VUS 135 F KLF8 c.322A>G p.I108V M VUS 225 M KLF8 c.411T>G p.T137T S VUS
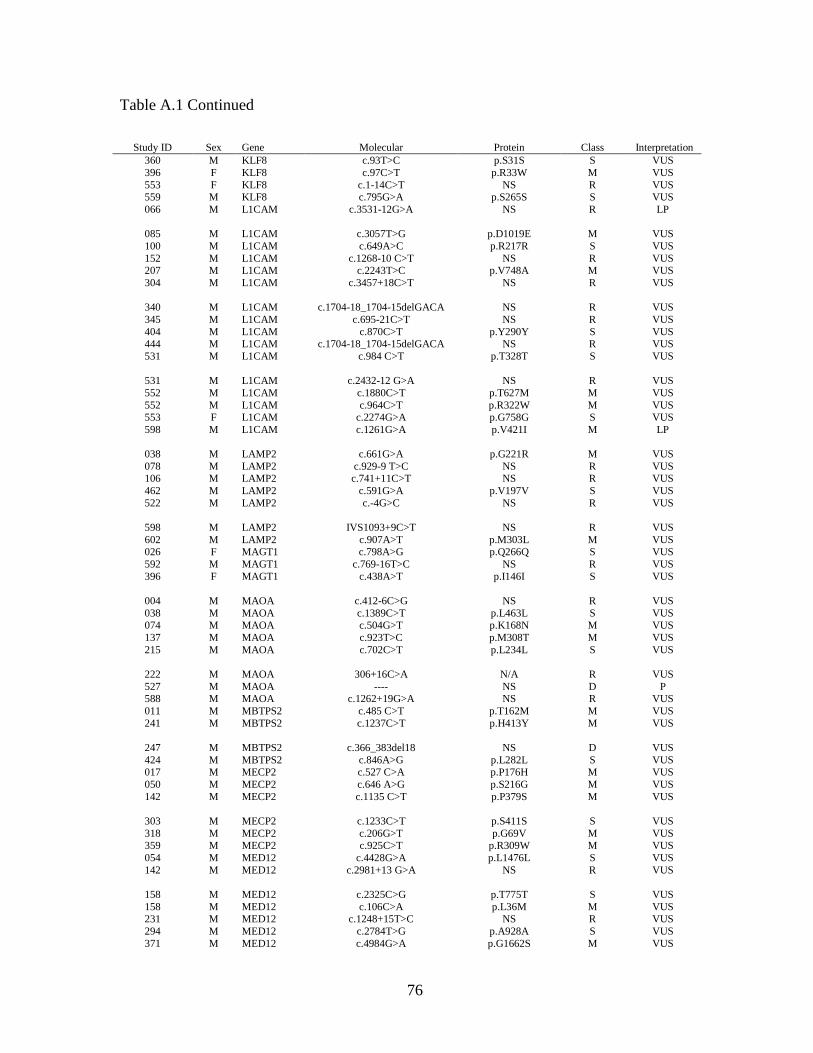
76
Table A.1 Continued
Study ID Sex Gene Molecular Protein Class Interpretation 360 M KLF8 c.93T>C p.S31S S VUS 396 F KLF8 c.97C>T p.R33W M VUS 553 F KLF8 c.1-14C>T NS R VUS 559 M KLF8 c.795G>A p.S265S S VUS 066 M L1CAM c.3531-12G>A NS R LP
085 M L1CAM c.3057T>G p.D1019E M VUS 100 M L1CAM c.649A>C p.R217R S VUS 152 M L1CAM c.1268-10 C>T NS R VUS 207 M L1CAM c.2243T>C p.V748A M VUS 304 M L1CAM c.3457+18C>T NS R VUS
340 M L1CAM c.1704-18_1704-15delGACA NS R VUS 345 M L1CAM c.695-21C>T NS R VUS 404 M L1CAM c.870C>T p.Y290Y S VUS 444 M L1CAM c.1704-18_1704-15delGACA NS R VUS 531 M L1CAM c.984 C>T p.T328T S VUS
531 M L1CAM c.2432-12 G>A NS R VUS 552 M L1CAM c.1880C>T p.T627M M VUS 552 M L1CAM c.964C>T p.R322W M VUS 553 F L1CAM c.2274G>A p.G758G S VUS 598 M L1CAM c.1261G>A p.V421I M LP
038 M LAMP2 c.661G>A p.G221R M VUS 078 M LAMP2 c.929-9 T>C NS R VUS 106 M LAMP2 c.741+11C>T NS R VUS 462 M LAMP2 c.591G>A p.V197V S VUS 522 M LAMP2 c.-4G>C NS R VUS
598 M LAMP2 IVS1093+9C>T NS R VUS 602 M LAMP2 c.907A>T p.M303L M VUS 026 F MAGT1 c.798A>G p.Q266Q S VUS 592 M MAGT1 c.769-16T>C NS R VUS 396 F MAGT1 c.438A>T p.I146I S VUS
004 M MAOA c.412-6C>G NS R VUS 038 M MAOA c.1389C>T p.L463L S VUS 074 M MAOA c.504G>T p.K168N M VUS 137 M MAOA c.923T>C p.M308T M VUS 215 M MAOA c.702C>T p.L234L S VUS
222 M MAOA 306+16C>A N/A R VUS 527 M MAOA ---- NS D P 588 M MAOA c.1262+19G>A NS R VUS 011 M MBTPS2 c.485 C>T p.T162M M VUS 241 M MBTPS2 c.1237C>T p.H413Y M VUS
247 M MBTPS2 c.366_383del18 NS D VUS 424 M MBTPS2 c.846A>G p.L282L S VUS 017 M MECP2 c.527 C>A p.P176H M VUS 050 M MECP2 c.646 A>G p.S216G M VUS 142 M MECP2 c.1135 C>T p.P379S M VUS
303 M MECP2 c.1233C>T p.S411S S VUS 318 M MECP2 c.206G>T p.G69V M VUS 359 M MECP2 c.925C>T p.R309W M VUS 054 M MED12 c.4428G>A p.L1476L S VUS 142 M MED12 c.2981+13 G>A NS R VUS
158 M MED12 c.2325C>G p.T775T S VUS 158 M MED12 c.106C>A p.L36M M VUS 231 M MED12 c.1248+15T>C NS R VUS 294 M MED12 c.2784T>G p.A928A S VUS 371 M MED12 c.4984G>A p.G1662S M VUS
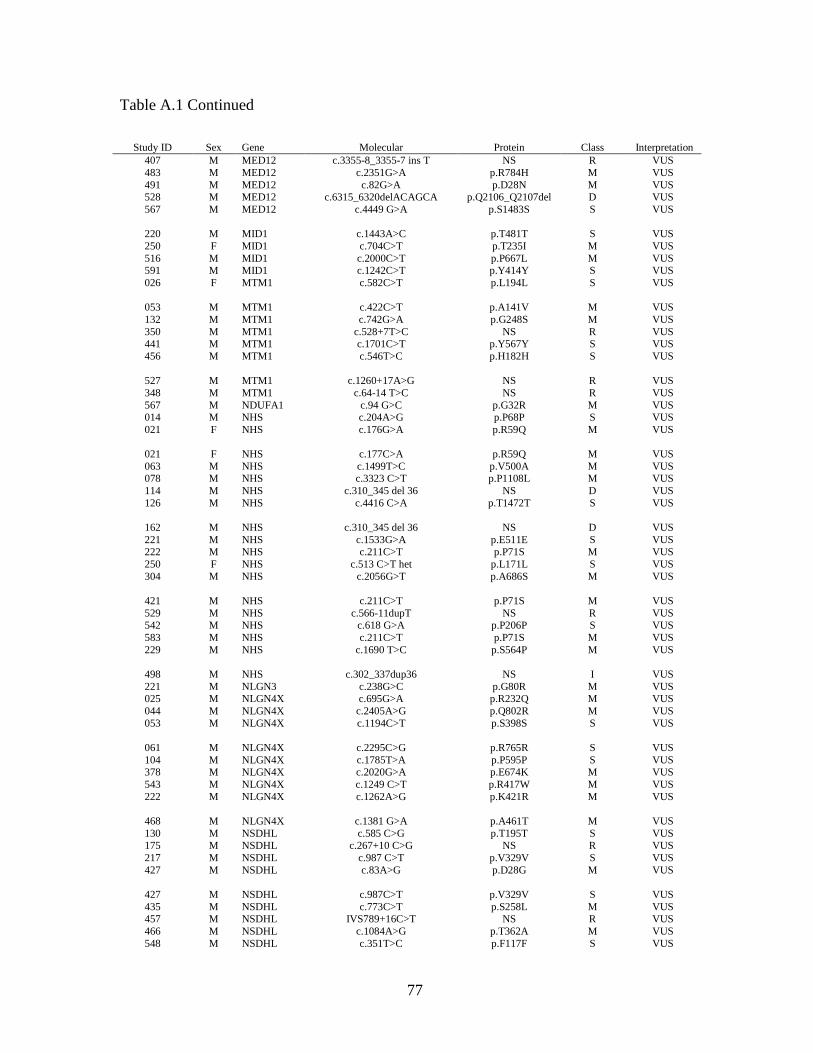
77
Table A.1 Continued
Study ID Sex Gene Molecular Protein Class Interpretation 407 M MED12 c.3355-8_3355-7 ins T NS R VUS 483 M MED12 c.2351G>A p.R784H M VUS 491 M MED12 c.82G>A p.D28N M VUS 528 M MED12 c.6315_6320delACAGCA p.Q2106_Q2107del D VUS 567 M MED12 c.4449 G>A p.S1483S S VUS
220 M MID1 c.1443A>C p.T481T S VUS 250 F MID1 c.704C>T p.T235I M VUS 516 M MID1 c.2000C>T p.P667L M VUS 591 M MID1 c.1242C>T p.Y414Y S VUS 026 F MTM1 c.582C>T p.L194L S VUS
053 M MTM1 c.422C>T p.A141V M VUS 132 M MTM1 c.742G>A p.G248S M VUS 350 M MTM1 c.528+7T>C NS R VUS 441 M MTM1 c.1701C>T p.Y567Y S VUS 456 M MTM1 c.546T>C p.H182H S VUS
527 M MTM1 c.1260+17A>G NS R VUS 348 M MTM1 c.64-14 T>C NS R VUS 567 M NDUFA1 c.94 G>C p.G32R M VUS 014 M NHS c.204A>G p.P68P S VUS 021 F NHS c.176G>A p.R59Q M VUS
021 F NHS c.177C>A p.R59Q M VUS 063 M NHS c.1499T>C p.V500A M VUS 078 M NHS c.3323 C>T p.P1108L M VUS 114 M NHS c.310_345 del 36 NS D VUS 126 M NHS c.4416 C>A p.T1472T S VUS
162 M NHS c.310_345 del 36 NS D VUS 221 M NHS c.1533G>A p.E511E S VUS 222 M NHS c.211C>T p.P71S M VUS 250 F NHS c.513 C>T het p.L171L S VUS 304 M NHS c.2056G>T p.A686S M VUS
421 M NHS c.211C>T p.P71S M VUS 529 M NHS c.566-11dupT NS R VUS 542 M NHS c.618 G>A p.P206P S VUS 583 M NHS c.211C>T p.P71S M VUS 229 M NHS c.1690 T>C p.S564P M VUS
498 M NHS c.302_337dup36 NS I VUS 221 M NLGN3 c.238G>C p.G80R M VUS 025 M NLGN4X c.695G>A p.R232Q M VUS 044 M NLGN4X c.2405A>G p.Q802R M VUS 053 M NLGN4X c.1194C>T p.S398S S VUS
061 M NLGN4X c.2295C>G p.R765R S VUS 104 M NLGN4X c.1785T>A p.P595P S VUS 378 M NLGN4X c.2020G>A p.E674K M VUS 543 M NLGN4X c.1249 C>T p.R417W M VUS 222 M NLGN4X c.1262A>G p.K421R M VUS
468 M NLGN4X c.1381 G>A p.A461T M VUS 130 M NSDHL c.585 C>G p.T195T S VUS 175 M NSDHL c.267+10 C>G NS R VUS 217 M NSDHL c.987 C>T p.V329V S VUS 427 M NSDHL c.83A>G p.D28G M VUS
427 M NSDHL c.987C>T p.V329V S VUS 435 M NSDHL c.773C>T p.S258L M VUS 457 M NSDHL IVS789+16C>T NS R VUS 466 M NSDHL c.1084A>G p.T362A M VUS 548 M NSDHL c.351T>C p.F117F S VUS
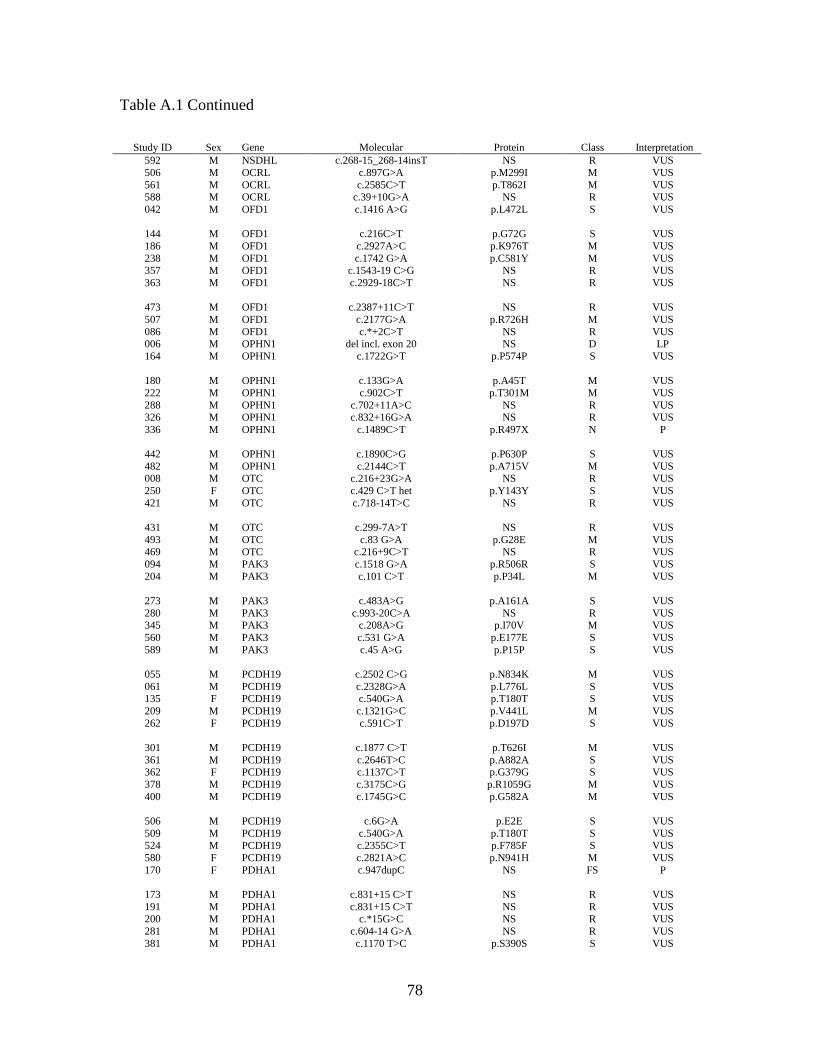
78
Table A.1 Continued
Study ID Sex Gene Molecular Protein Class Interpretation 592 M NSDHL c.268-15_268-14insT NS R VUS 506 M OCRL c.897G>A p.M299I M VUS 561 M OCRL c.2585C>T p.T862I M VUS 588 M OCRL c.39+10G>A NS R VUS 042 M OFD1 c.1416 A>G p.L472L S VUS
144 M OFD1 c.216C>T p.G72G S VUS 186 M OFD1 c.2927A>C p.K976T M VUS 238 M OFD1 c.1742 G>A p.C581Y M VUS 357 M OFD1 c.1543-19 C>G NS R VUS 363 M OFD1 c.2929-18C>T NS R VUS
473 M OFD1 c.2387+11C>T NS R VUS 507 M OFD1 c.2177G>A p.R726H M VUS 086 M OFD1 c.*+2C>T NS R VUS 006 M OPHN1 del incl. exon 20 NS D LP 164 M OPHN1 c.1722G>T p.P574P S VUS
180 M OPHN1 c.133G>A p.A45T M VUS 222 M OPHN1 c.902C>T p.T301M M VUS 288 M OPHN1 c.702+11A>C NS R VUS 326 M OPHN1 c.832+16G>A NS R VUS 336 M OPHN1 c.1489C>T p.R497X N P
442 M OPHN1 c.1890C>G p.P630P S VUS 482 M OPHN1 c.2144C>T p.A715V M VUS 008 M OTC c.216+23G>A NS R VUS 250 F OTC c.429 C>T het p.Y143Y S VUS 421 M OTC c.718-14T>C NS R VUS
431 M OTC c.299-7A>T NS R VUS 493 M OTC c.83 G>A p.G28E M VUS 469 M OTC c.216+9C>T NS R VUS 094 M PAK3 c.1518 G>A p.R506R S VUS 204 M PAK3 c.101 C>T p.P34L M VUS
273 M PAK3 c.483A>G p.A161A S VUS 280 M PAK3 c.993-20C>A NS R VUS 345 M PAK3 c.208A>G p.I70V M VUS 560 M PAK3 c.531 G>A p.E177E S VUS 589 M PAK3 c.45 A>G p.P15P S VUS
055 M PCDH19 c.2502 C>G p.N834K M VUS 061 M PCDH19 c.2328G>A p.L776L S VUS 135 F PCDH19 c.540G>A p.T180T S VUS 209 M PCDH19 c.1321G>C p.V441L M VUS 262 F PCDH19 c.591C>T p.D197D S VUS
301 M PCDH19 c.1877 C>T p.T626I M VUS 361 M PCDH19 c.2646T>C p.A882A S VUS 362 F PCDH19 c.1137C>T p.G379G S VUS 378 M PCDH19 c.3175C>G p.R1059G M VUS 400 M PCDH19 c.1745G>C p.G582A M VUS
506 M PCDH19 c.6G>A p.E2E S VUS 509 M PCDH19 c.540G>A p.T180T S VUS 524 M PCDH19 c.2355C>T p.F785F S VUS 580 F PCDH19 c.2821A>C p.N941H M VUS 170 F PDHA1 c.947dupC NS FS P
173 M PDHA1 c.831+15 C>T NS R VUS 191 M PDHA1 c.831+15 C>T NS R VUS 200 M PDHA1 c.*15G>C NS R VUS 281 M PDHA1 c.604-14 G>A NS R VUS 381 M PDHA1 c.1170 T>C p.S390S S VUS
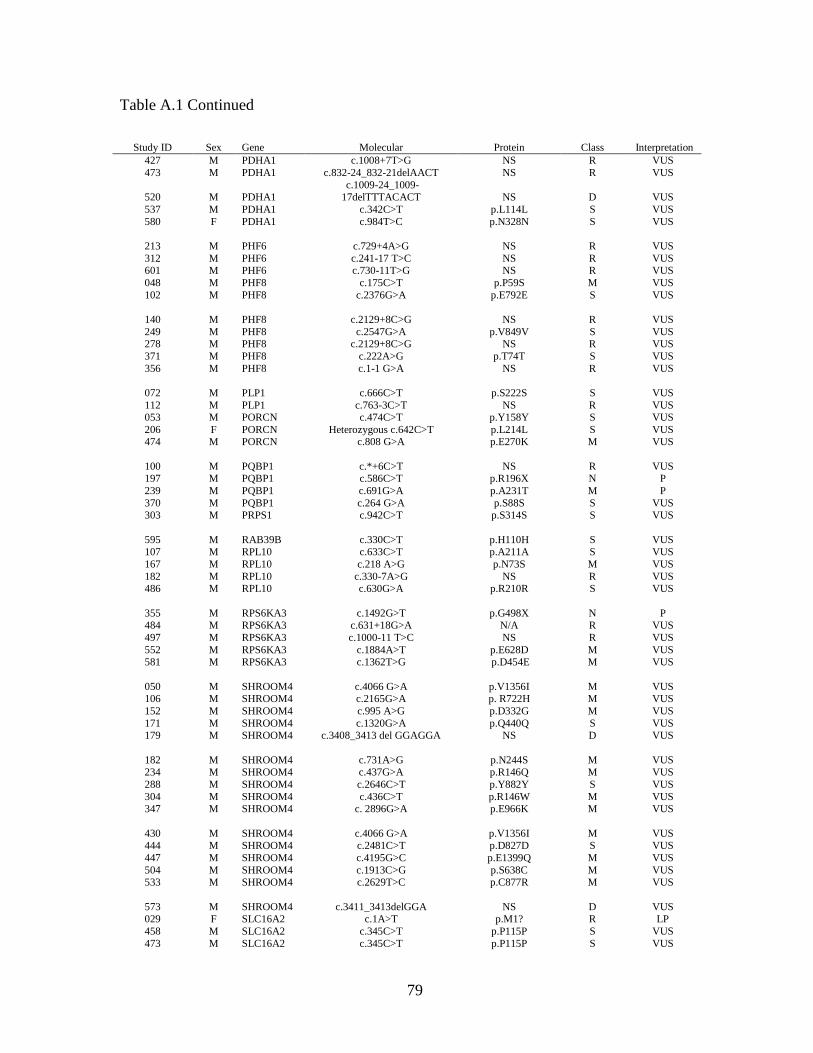
79
Table A.1 Continued
Study ID Sex Gene Molecular Protein Class Interpretation 427 M PDHA1 c.1008+7T>G NS R VUS 473 M PDHA1 c.832-24_832-21delAACT NS R VUS
520 M PDHA1 c.1009-24_1009-17delTTTACACT NS D VUS
537 M PDHA1 c.342C>T p.L114L S VUS 580 F PDHA1 c.984T>C p.N328N S VUS
213 M PHF6 c.729+4A>G NS R VUS 312 M PHF6 c.241-17 T>C NS R VUS 601 M PHF6 c.730-11T>G NS R VUS 048 M PHF8 c.175C>T p.P59S M VUS 102 M PHF8 c.2376G>A p.E792E S VUS
140 M PHF8 c.2129+8C>G NS R VUS 249 M PHF8 c.2547G>A p.V849V S VUS 278 M PHF8 c.2129+8C>G NS R VUS 371 M PHF8 c.222A>G p.T74T S VUS 356 M PHF8 c.1-1 G>A NS R VUS
072 M PLP1 c.666C>T p.S222S S VUS 112 M PLP1 c.763-3C>T NS R VUS 053 M PORCN c.474C>T p.Y158Y S VUS 206 F PORCN Heterozygous c.642C>T p.L214L S VUS 474 M PORCN c.808 G>A p.E270K M VUS
100 M PQBP1 c.*+6C>T NS R VUS 197 M PQBP1 c.586C>T p.R196X N P 239 M PQBP1 c.691G>A p.A231T M P 370 M PQBP1 c.264 G>A p.S88S S VUS 303 M PRPS1 c.942C>T p.S314S S VUS
595 M RAB39B c.330C>T p.H110H S VUS 107 M RPL10 c.633C>T p.A211A S VUS 167 M RPL10 c.218 A>G p.N73S M VUS 182 M RPL10 c.330-7A>G NS R VUS 486 M RPL10 c.630G>A p.R210R S VUS
355 M RPS6KA3 c.1492G>T p.G498X N P 484 M RPS6KA3 c.631+18G>A N/A R VUS 497 M RPS6KA3 c.1000-11 T>C NS R VUS 552 M RPS6KA3 c.1884A>T p.E628D M VUS 581 M RPS6KA3 c.1362T>G p.D454E M VUS
050 M SHROOM4 c.4066 G>A p.V1356I M VUS 106 M SHROOM4 c.2165G>A p. R722H M VUS 152 M SHROOM4 c.995 A>G p.D332G M VUS 171 M SHROOM4 c.1320G>A p.Q440Q S VUS 179 M SHROOM4 c.3408_3413 del GGAGGA NS D VUS
182 M SHROOM4 c.731A>G p.N244S M VUS 234 M SHROOM4 c.437G>A p.R146Q M VUS 288 M SHROOM4 c.2646C>T p.Y882Y S VUS 304 M SHROOM4 c.436C>T p.R146W M VUS 347 M SHROOM4 c. 2896G>A p.E966K M VUS
430 M SHROOM4 c.4066 G>A p.V1356I M VUS 444 M SHROOM4 c.2481C>T p.D827D S VUS 447 M SHROOM4 c.4195G>C p.E1399Q M VUS 504 M SHROOM4 c.1913C>G p.S638C M VUS 533 M SHROOM4 c.2629T>C p.C877R M VUS
573 M SHROOM4 c.3411_3413delGGA NS D VUS 029 F SLC16A2 c.1A>T p.M1? R LP 458 M SLC16A2 c.345C>T p.P115P S VUS 473 M SLC16A2 c.345C>T p.P115P S VUS
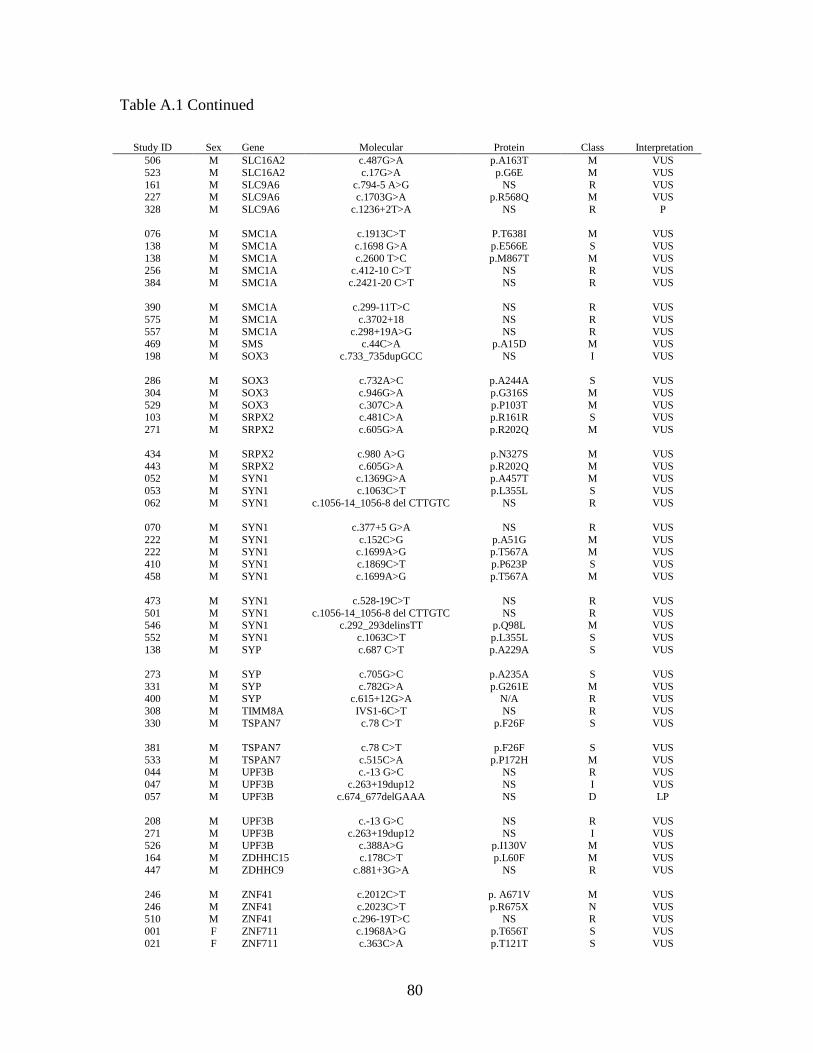
80
Table A.1 Continued
Study ID Sex Gene Molecular Protein Class Interpretation 506 M SLC16A2 c.487G>A p.A163T M VUS 523 M SLC16A2 c.17G>A p.G6E M VUS 161 M SLC9A6 c.794-5 A>G NS R VUS 227 M SLC9A6 c.1703G>A p.R568Q M VUS 328 M SLC9A6 c.1236+2T>A NS R P
076 M SMC1A c.1913C>T P.T638I M VUS 138 M SMC1A c.1698 G>A p.E566E S VUS 138 M SMC1A c.2600 T>C p.M867T M VUS 256 M SMC1A c.412-10 C>T NS R VUS 384 M SMC1A c.2421-20 C>T NS R VUS
390 M SMC1A c.299-11T>C NS R VUS 575 M SMC1A c.3702+18 NS R VUS 557 M SMC1A c.298+19A>G NS R VUS 469 M SMS c.44C>A p.A15D M VUS 198 M SOX3 c.733_735dupGCC NS I VUS
286 M SOX3 c.732A>C p.A244A S VUS 304 M SOX3 c.946G>A p.G316S M VUS 529 M SOX3 c.307C>A p.P103T M VUS 103 M SRPX2 c.481C>A p.R161R S VUS 271 M SRPX2 c.605G>A p.R202Q M VUS
434 M SRPX2 c.980 A>G p.N327S M VUS 443 M SRPX2 c.605G>A p.R202Q M VUS 052 M SYN1 c.1369G>A p.A457T M VUS 053 M SYN1 c.1063C>T p.L355L S VUS 062 M SYN1 c.1056-14_1056-8 del CTTGTC NS R VUS
070 M SYN1 c.377+5 G>A NS R VUS 222 M SYN1 c.152C>G p.A51G M VUS 222 M SYN1 c.1699A>G p.T567A M VUS 410 M SYN1 c.1869C>T p.P623P S VUS 458 M SYN1 c.1699A>G p.T567A M VUS
473 M SYN1 c.528-19C>T NS R VUS 501 M SYN1 c.1056-14_1056-8 del CTTGTC NS R VUS 546 M SYN1 c.292_293delinsTT p.Q98L M VUS 552 M SYN1 c.1063C>T p.L355L S VUS 138 M SYP c.687 C>T p.A229A S VUS
273 M SYP c.705G>C p.A235A S VUS 331 M SYP c.782G>A p.G261E M VUS 400 M SYP c.615+12G>A N/A R VUS 308 M TIMM8A IVS1-6C>T NS R VUS 330 M TSPAN7 c.78 C>T p.F26F S VUS
381 M TSPAN7 c.78 C>T p.F26F S VUS 533 M TSPAN7 c.515C>A p.P172H M VUS 044 M UPF3B c.-13 G>C NS R VUS 047 M UPF3B c.263+19dup12 NS I VUS 057 M UPF3B c.674_677delGAAA NS D LP
208 M UPF3B c.-13 G>C NS R VUS 271 M UPF3B c.263+19dup12 NS I VUS 526 M UPF3B c.388A>G p.I130V M VUS 164 M ZDHHC15 c.178C>T p.L60F M VUS 447 M ZDHHC9 c.881+3G>A NS R VUS
246 M ZNF41 c.2012C>T p. A671V M VUS 246 M ZNF41 c.2023C>T p.R675X N VUS 510 M ZNF41 c.296-19T>C NS R VUS 001 F ZNF711 c.1968A>G p.T656T S VUS 021 F ZNF711 c.363C>A p.T121T S VUS

81
Table A.1 Continued
Study ID Sex Gene Molecular Protein Class Interpretation 056 M ZNF81 c.828T>G p.C276W M VUS 171 M ZNF81 c.18C>T p.D6D S VUS 172 M ZNF81 c.554C>T p.S185L M VUS 196 M ZNF81 c.8C>T p.A3V M VUS 219 M ZNF81 c.1495A>G p.I499V M VUS
499 M ZNF81 c.290G>C p.G97A M VUS 572 M ZNF81 c.554C>T p.S185L M VUS


