HYDROLOGICAL IMPACTS OF LANDUSE CHANGE IN THE HILLSIDES OF
COLOMBIA : THE IMPACT OFPATTERN ON PROCESS
Mark Mulligan* and Jorge Rubiano†* Department of Geography, King’s College London, Strand, LONDON, WC2R 2LS.
[email protected]† Hillsides Agroecosystems Project, CIAT, A.A. 6713, Cali, Colombia

The HERB project
• Hydrology, Ecology and Regional Biodiversity of tropicalMontane forest
• Collaborators : CIAT, Instituto “Alexander von Humboldt”(Min. Env.), University of Cauca, Fundacion ProSelva
• Two scales of working (a) experimental catchments (25mres.) (b) Colombia-wide (1 Km res.)
• Concerted research efforts:• 1995-1996 - Rio Ñambi, Nariño, Colombia• 1997-present - Reserva Tambito, Cauca, Colombia
The Tambito Experimental Catchments• 1374-2894 masl, 5.5 by 4.1 Km , 1424 Ha.
– 861 Ha. Primary, 527 Ha. Secondary and 36 Ha. Pasture (1996).
• Paired Catchments– of Palo Verde (Primary) and Tambito (Secondary and Pasture).
Slopes, altitudes, soils and geologies similar.
• GIS Data :– 25m DEM, historic land use data (LANDSAT TM,1989 and
manual survey,1996)
• Monitoring network:– 3 hydrological/meteorological plots– 7 tipping bucket raingauges throughout catchment– various throughfall, stemflow, occult precipitation and soil erosion
traps– 100s of soil and litter samples from throughout catchment
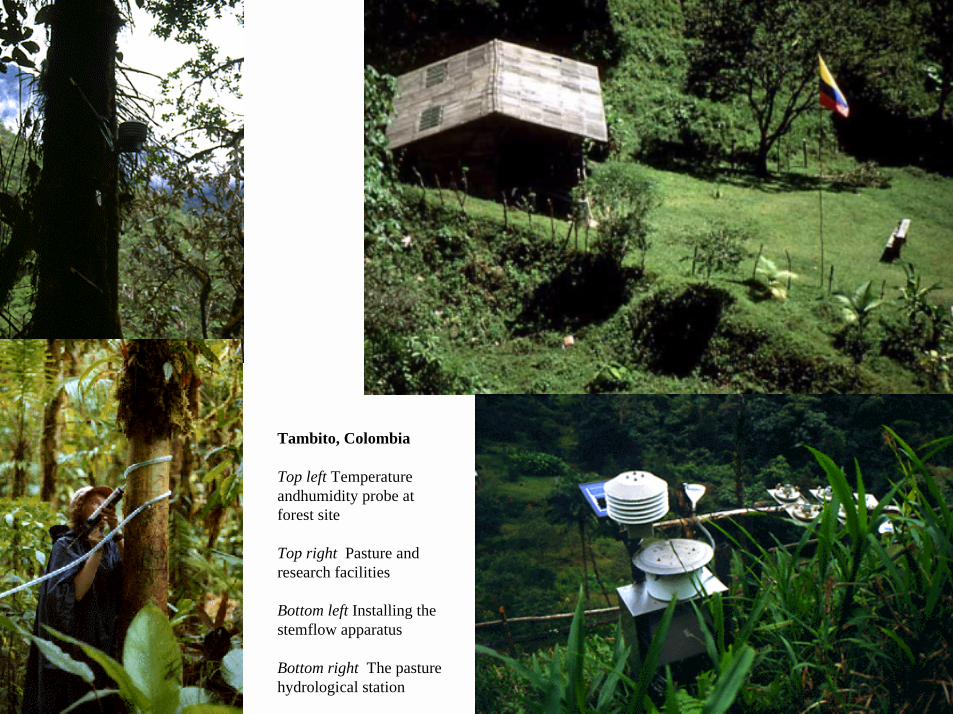
Tambito, Colombia
Top left Temperatureandhumidity probe atforest site
Top right Pasture andresearch facilities
Bottom left Installing thestemflow apparatus
Bottom right The pasturehydrological station
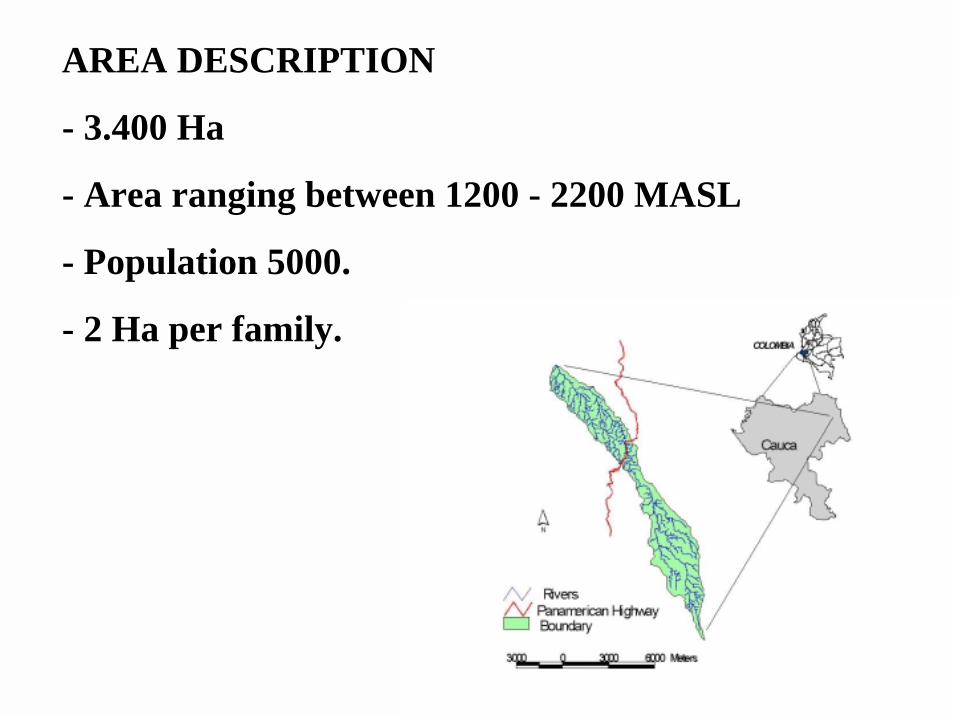
AREA DESCRIPTION
- 3.400 Ha
- Area ranging between 1200 - 2200 MASL
- Population 5000.
- 2 Ha per family.
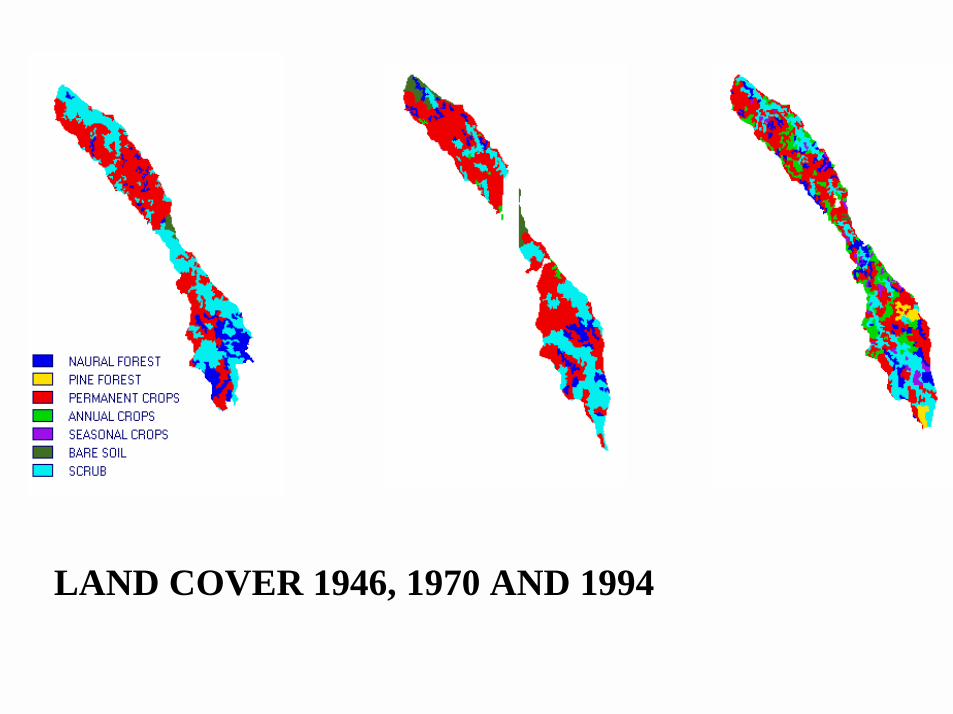
LAND COVER 1946, 1970 AND 1994
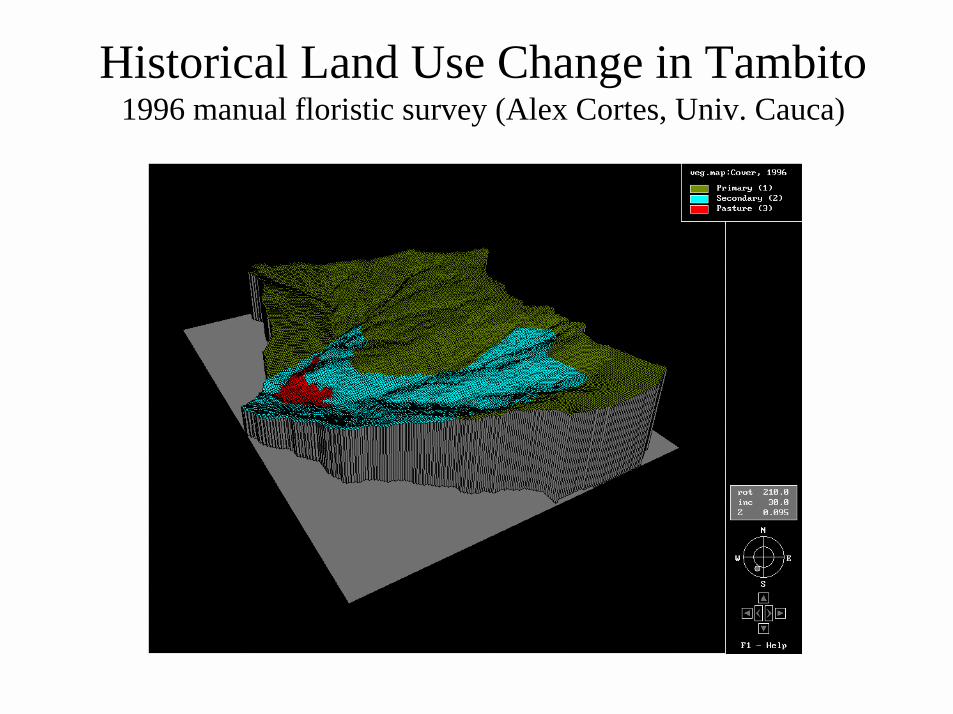
Historical Land Use Change in Tambito1996 manual floristic survey (Alex Cortes, Univ. Cauca)
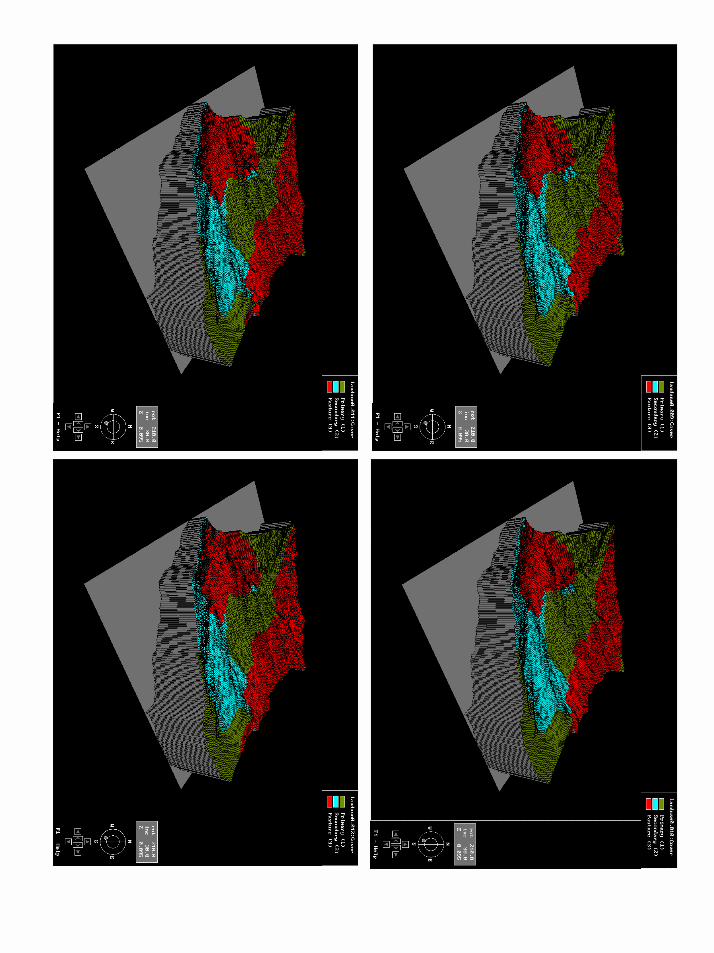
A Simple Cellular Model for Land UseChange at the Agricultural Frontier
• Models conversion of forest to pasture only• Requires only DEM, original land use, roads and rivers• Assumes that conversion spreads out from:
– (a) rivers– (b) roads– (c) agricultural frontiers
• Also assumes that the resistance to spread α sin(slope)• Does not model rate of deforestation just form.• Applicable to mountain environments at the agriculture-
forest frontier without complex patterns of ownership.• Replicates but simplifies observed pattern of change

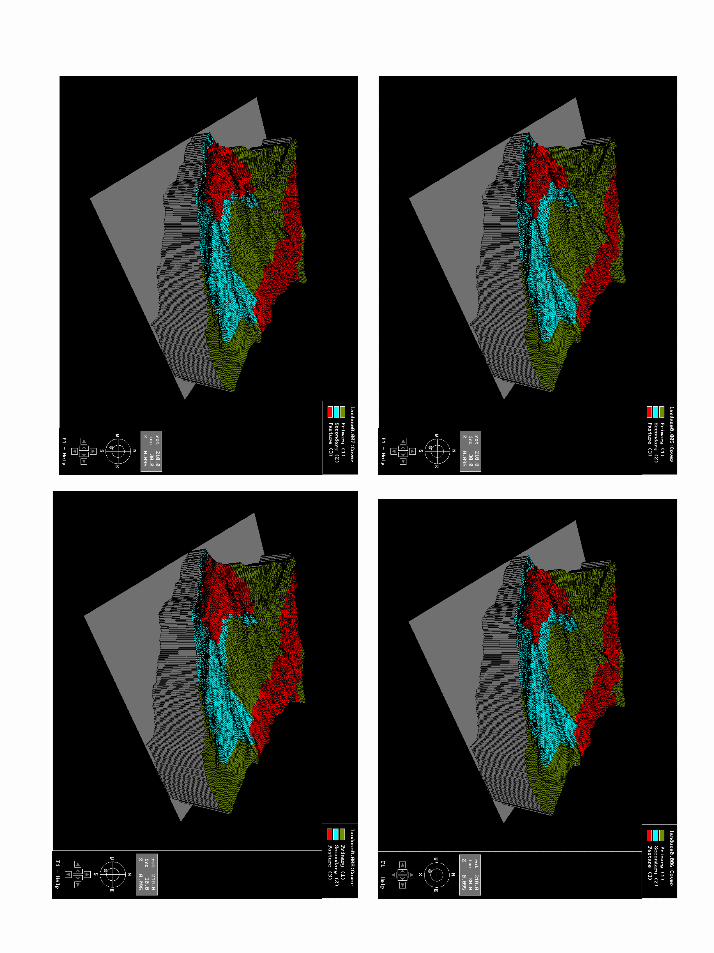
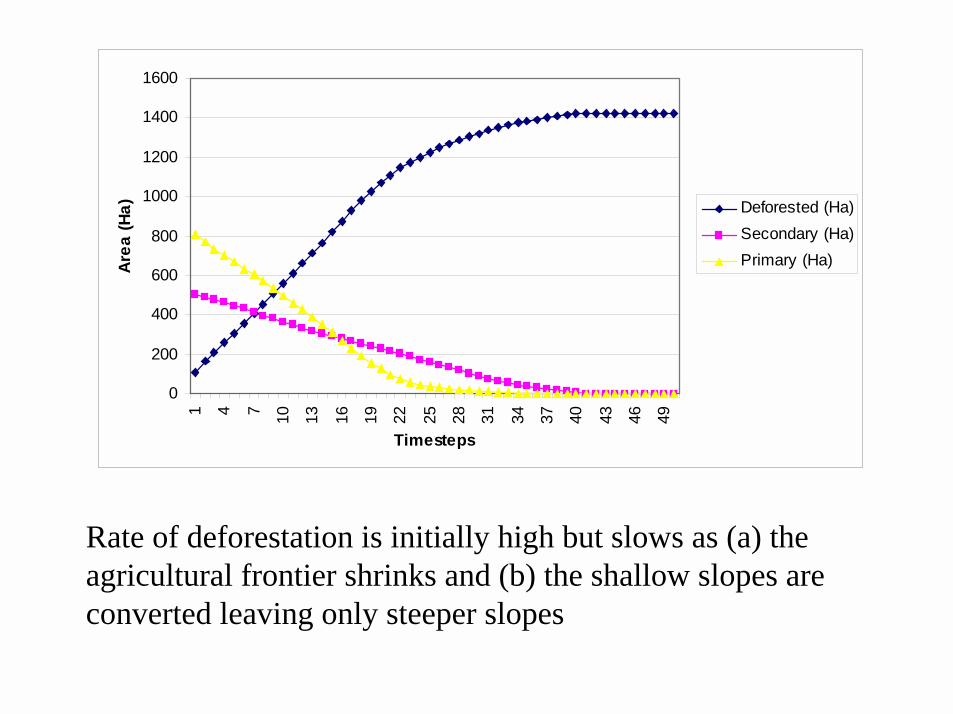
Rate of deforestation is initially high but slows as (a) theagricultural frontier shrinks and (b) the shallow slopes areconverted leaving only steeper slopes
0
200
400
600
800
1000
1200
1400
1600
1 4 7 10 13 16 19 22 25 28 31 34 37 40 43 46 49
Timesteps
Area
(Ha) Deforested (Ha)
Secondary (Ha)Primary (Ha)
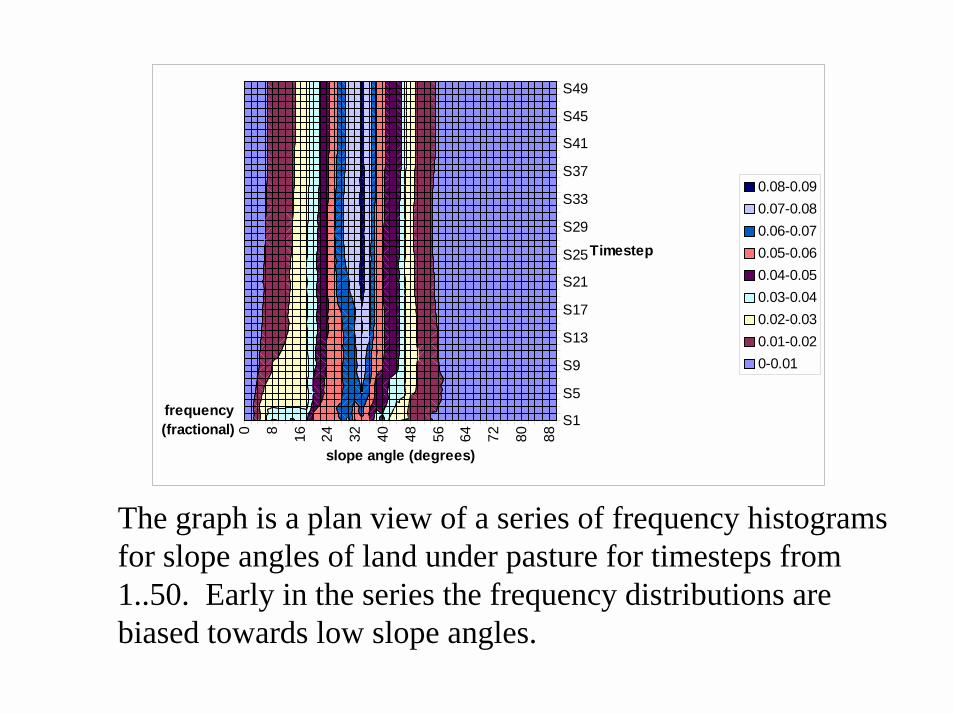
The graph is a plan view of a series of frequency histogramsfor slope angles of land under pasture for timesteps from1..50. Early in the series the frequency distributions arebiased towards low slope angles.
0 8 16 24 32 40 48 56 64 72 80 88
S1
S5
S9
S13
S17
S21
S25
S29
S33
S37
S41
S45
S49
frequency (fractional)
slope angle (degrees)
Timestep
0.08-0.090.07-0.080.06-0.070.05-0.060.04-0.050.03-0.040.02-0.030.01-0.020-0.01

The graph is a plan view of a series of frequency histogramsfor elevations of land under pasture for timesteps from 1..50.
Early and late in the series the frequency distributions arebiased towards low elevations.
1300
1475
1650
1825
2000
2175
2350
2525
2700
2875
S1S5S9S13S17S21S25S29S33S37S41S45
Frequency (fractional)
Altitude (m)
Timesteps
0.125-0.15
0.1-0.125
0.075-0.1
0.05-0.075
0.025-0.05
0-0.025

Modelling the HydrologicalImpact
• Dynamic GISmodel built using PCRASTER• Spatially distributed
– rainfall, solar, net and PAR radiation– land cover parameters– soil texture, thickness and bulk density
• Processes– interception– infiltration and overland flow, routed downslope– soil evaporation, transpiration, interception loss– recharge, throughflow, soil moisture– plant growth and partitioning– soil erosion
– See Mulligan and Rubiano (forthcoming)

Hydrological Patterns
Total evapotranspiration (mm/hr), effective rainfall (mm/hr),runoff (mm/hr) and soil moisture (m3water/m3soil) for 1400
hrs 22nd January 1998.
Experiment
• Take each of the 50 iterations of the LUCmodel as a land use scenario
• Run the hydro model for the same month ofmeteorological data (January 1998) for eachof the land use scenarios
• Compare the hydrological behaviour of thecatchment for each of the land use scenarios
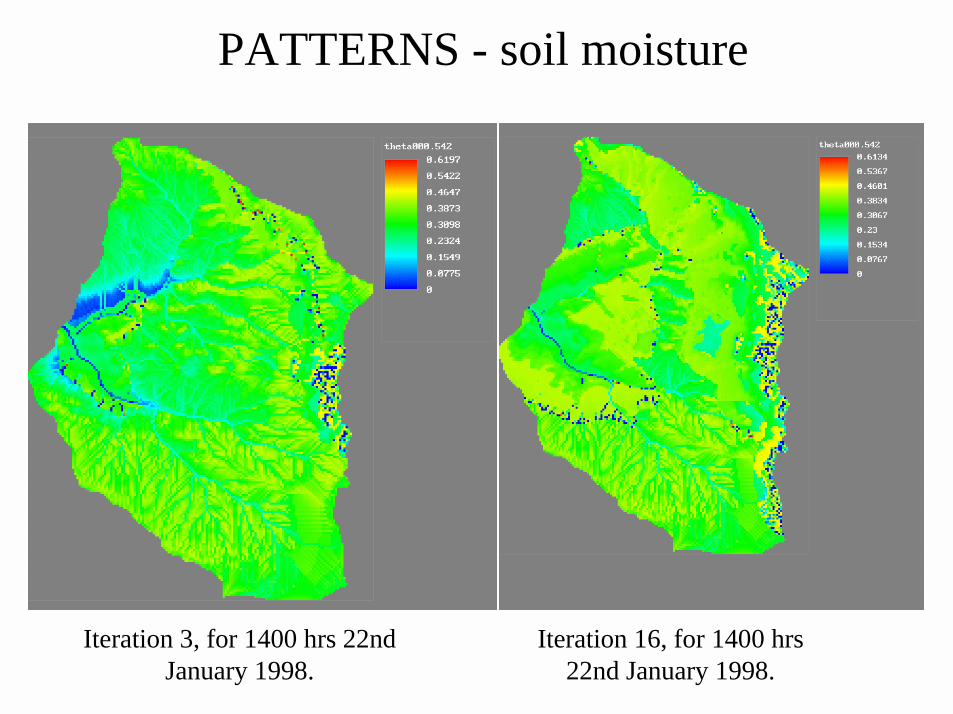
PATTERNS - soil moisture
Iteration 3, for 1400 hrs 22ndJanuary 1998.
Iteration 16, for 1400 hrs22nd January 1998.
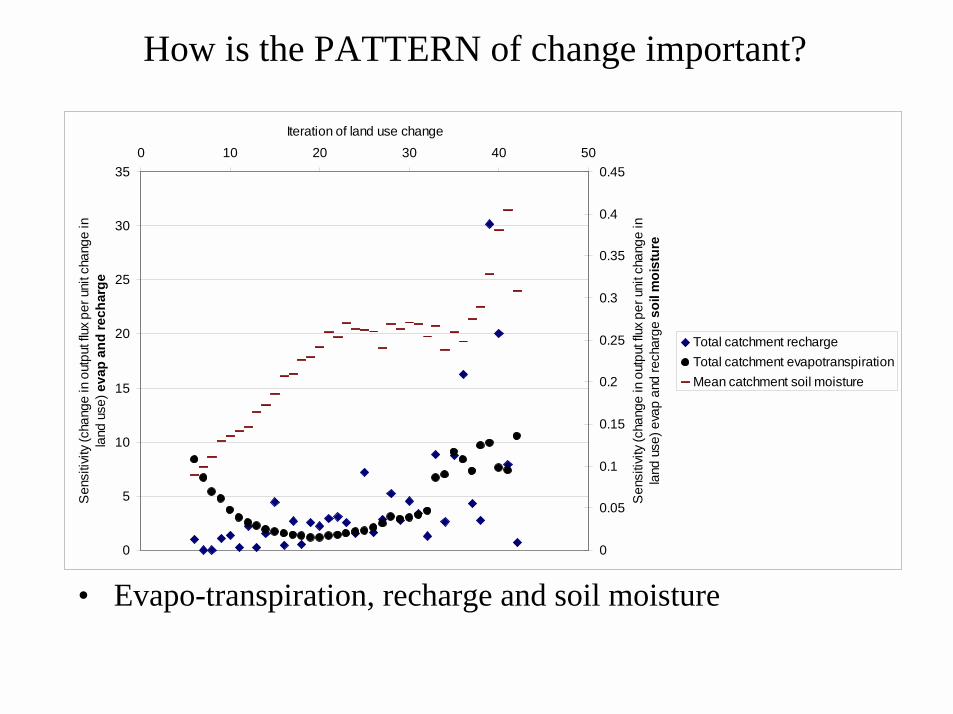
How is the PATTERN of change important?
• Evapo-transpiration, recharge and soil moisture0
5
10
15
20
25
30
350 10 20 30 40 50
Iteration of land use change
Sen
sitiv
ity (c
hang
e in
out
put f
lux
per u
nit c
hang
e in
la
nd u
se) e
vap
and
rech
arge
0
0.05
0.1
0.15
0.2
0.25
0.3
0.35
0.4
0.45
Sen
sitiv
ity (c
hang
e in
out
put f
lux
per u
nit c
hang
e in
la
nd u
se) e
vap
and
rech
arge
soi
l moi
stur
e
Total catchment rechargeTotal catchment evapotranspirationMean catchment soil moisture
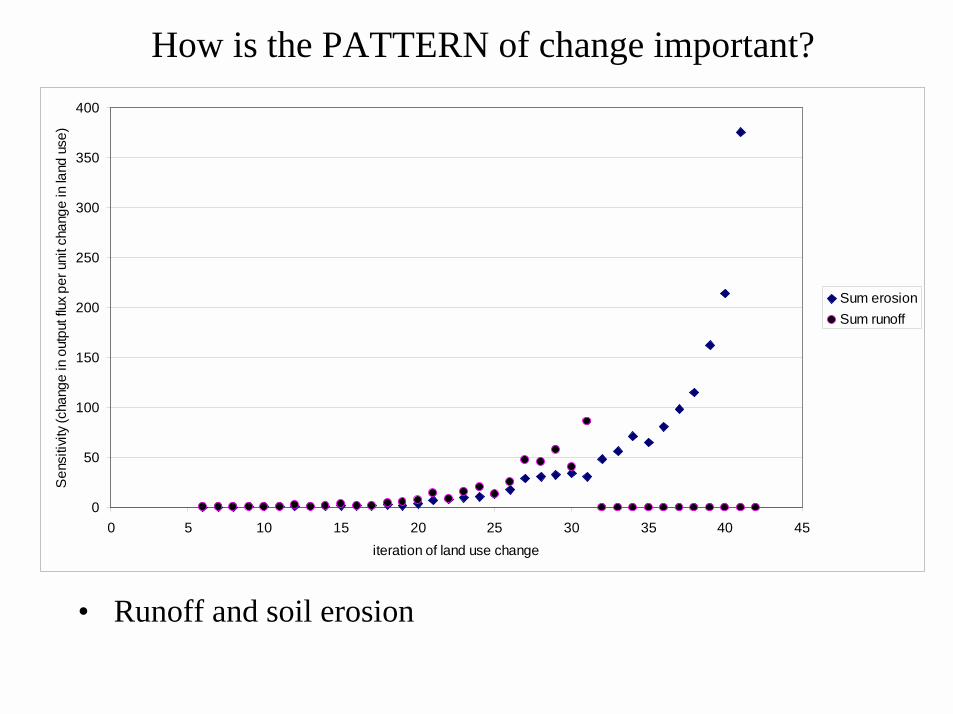
How is the PATTERN of change important?
• Runoff and soil erosion
0
50
100
150
200
250
300
350
400
0 5 10 15 20 25 30 35 40 45iteration of land use change
Sen
sitiv
ity (c
hang
e in
out
put f
lux
per u
nit c
hang
e in
land
use
)
Sum erosionSum runoff
Hydrological Projects
• Mauricio Rincon-Romero - Modelling LandscapeSensitivity to Land Use Change
• Jorge Rubiano - Hydrological Impact of Land Use Change: a cellular model based on RS data
• Andrew Jarvis - Monitoring and Modelling OccultPrecipitation at the Plot Scale
• Juliana Gonzalez - Monitoring and Modelling OccultPrecipitation at the Catchment Scale


