Exploring the Benefits of Becoming a TigerGraph Partner
April 21, 2021
| GRAPHAISUMMIT.COM | #GRAPHAISUMMIT
About Us
2
David RonaldProduct Marketing DirectorTigerGraph
Michael ShalerVice President of PartnershipsTigerGraph
| GRAPHAISUMMIT.COM | #GRAPHAISUMMIT
Executive Summary
• Graph analytics is a sea change for data-driven organizations
• The graph analytics marketplace is growing at 100% YoY
• TigerGraph is a leader in graph analytics
• TigerGraph is solving important data challenges in AI / ML
• TigerGraph is a software company, not a services one
3

| GRAPHAISUMMIT.COM | #GRAPHAISUMMIT
TigerGraph is Transforming Data and Analytics
Continuous graph-based feature generation & training
Learn from Connected Data
AI-based Customer 360 for entity resolution, recommendation engine, fraud detection
10-100x faster than current solutions
Analyze Connected Data
Supply chain planning: 3 weeks to 45 minutes
Fraud Detection: batch to real-time for 300M calls/day
Friction-free scale out from GB to TB to PB with lowest cost of ownership
Connect Datasets and Pipelines
Customer 360 connecting 200+ datasets and pipelines
Identity graph connecting 50+ data pipelines
Item 360 for eCommerce across 100+ datasets
Advanced Analytics
Amplified Machine Learning
Distributed Graph Database
Fortune 50 Retailer
4
| GRAPHAISUMMIT.COM | #GRAPHAISUMMIT
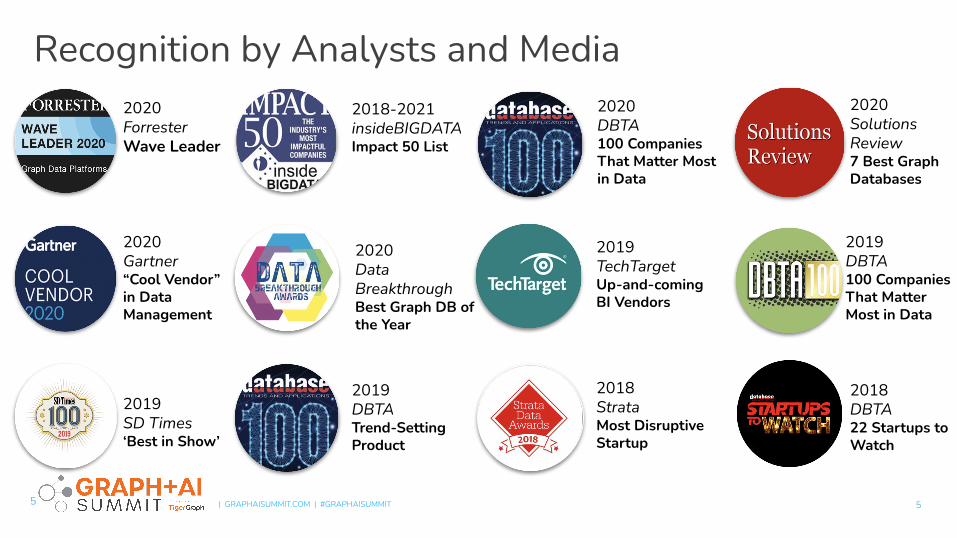
Recognition by Analysts and Media
5
2018 DBTA22 Startups to Watch
2018 StrataMost Disruptive Startup
2019 DBTATrend-Setting Product
2019 SD Times‘Best in Show’
2019 DBTA100 Companies That Matter Most in Data
2020Solutions Review7 Best Graph Databases
2019 TechTargetUp-and-coming BI Vendors
2020DBTA100 Companies That Matter Most in Data
2020Data BreakthroughBest Graph DB of the Year
2018-2021insideBIGDATAImpact 50 List
2020Gartner“Cool Vendor” in Data Management
2020ForresterWave Leader
5

| GRAPHAISUMMIT.COM | #GRAPHAISUMMIT
By 2025, graph technologies will be used in 80% of data and analytics innovations, up from 10% in 2021, facilitating rapid decision making
across the enterprise.
Source: Gartner, Top Trends in Data and Analytics for 2021, 16 February 2021
6
| GRAPHAISUMMIT.COM | #GRAPHAISUMMIT 7
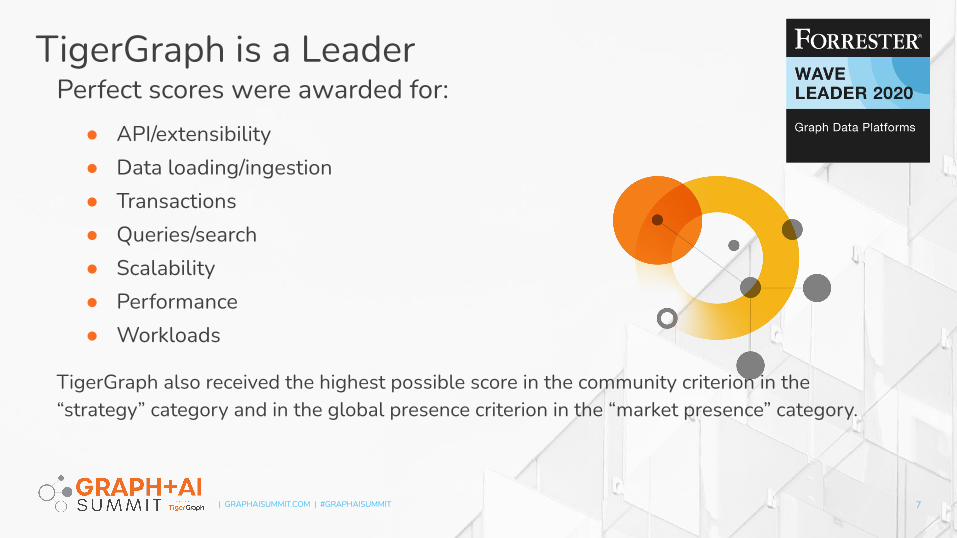
Perfect scores were awarded for:● API/extensibility● Data loading/ingestion● Transactions● Queries/search● Scalability● Performance● Workloads
TigerGraph also received the highest possible score in the community criterion in the “strategy” category and in the global presence criterion in the “market presence” category.
TigerGraph is a Leader
| GRAPHAISUMMIT.COM | #GRAPHAISUMMIT
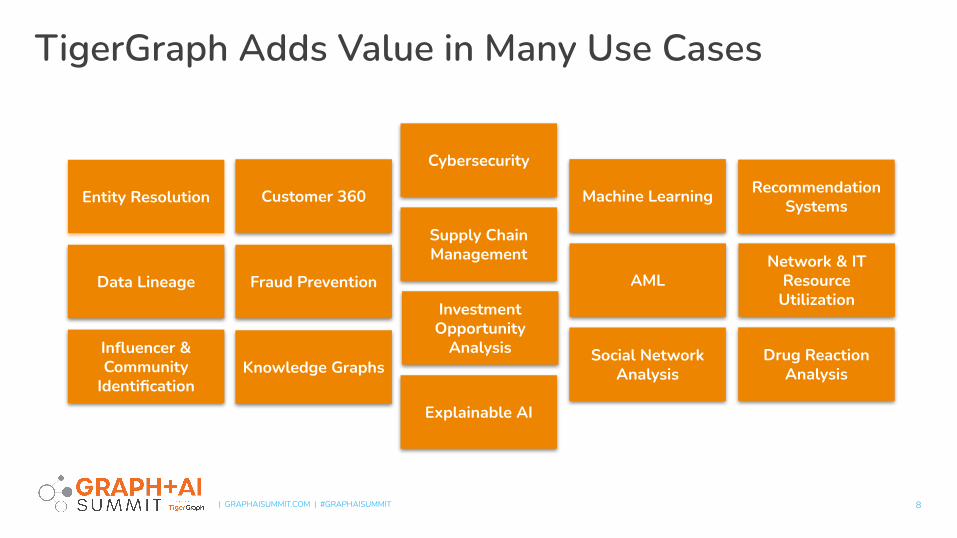
TigerGraph Adds Value in Many Use Cases
8
Entity Resolution Customer 360
Cybersecurity
Machine Learning Recommendation Systems
Data Lineage Fraud Prevention
Supply Chain Management
AML
Network & IT
Resource Utilization
Influencer & Community
IdentificationKnowledge Graphs
Explainable AI
Social Network Analysis
Drug Reaction Analysis
Investment Opportunity
Analysis

| GRAPHAISUMMIT.COM | #GRAPHAISUMMIT
How Customers Use TigerGraph
Find similar users/customers
Recommend next best action
Find most influential users/customers
Detect connected users (communities)
Uncover hidden connections
Who are the patients that are going through a particular type of journey that results in an adverse health outcome?
Is the Is the new credit card applicant or transaction connected to known fraudsters?
Can I run a real-time credit score algorithm and recommend an offer based on the customer’s credit profile & need?
Which users are driving higher usage or adoption of my product or service?
What is average spend over time across a community of connected users (fin. services, airlines, healthcare, retail..)?
9

| GRAPHAISUMMIT.COM | #GRAPHAISUMMIT
Example: Driving Business Value in 3 StepsStep 1:
Entity ResolutionStep 2:
Relationship Analysis Step 3:
Insights and Actions
Link IDs to create a unified identity
Connect & analyze the internal and external datasets for user behavior● Marketing Campaigns● Viewership History● Promotional Responses● Engagement Activity● Purchase History● And More
Find similar users/customers
Recommend next best action
Find most influential users/customers
Detect connected users (communities)
Uncover hidden connections
10
| GRAPHAISUMMIT.COM | #GRAPHAISUMMIT
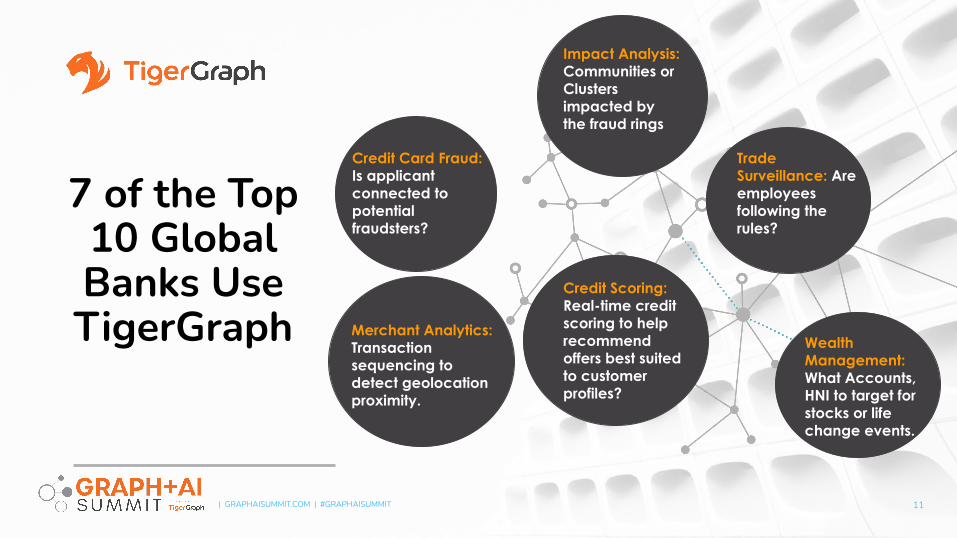
7 of the Top 10 Global Banks Use TigerGraph Merchant Analytics:
Transaction sequencing to detect geolocation proximity.
Credit Card Fraud: Is applicant connected to potential fraudsters?
Trade Surveillance: Are employees following the rules?
Impact Analysis: Communities or Clusters impacted by the fraud rings
Credit Scoring: Real-time credit scoring to help recommend offers best suited to customer profiles?
Wealth Management: What Accounts, HNI to target for stocks or life change events.
11
| GRAPHAISUMMIT.COM | #GRAPHAISUMMIT
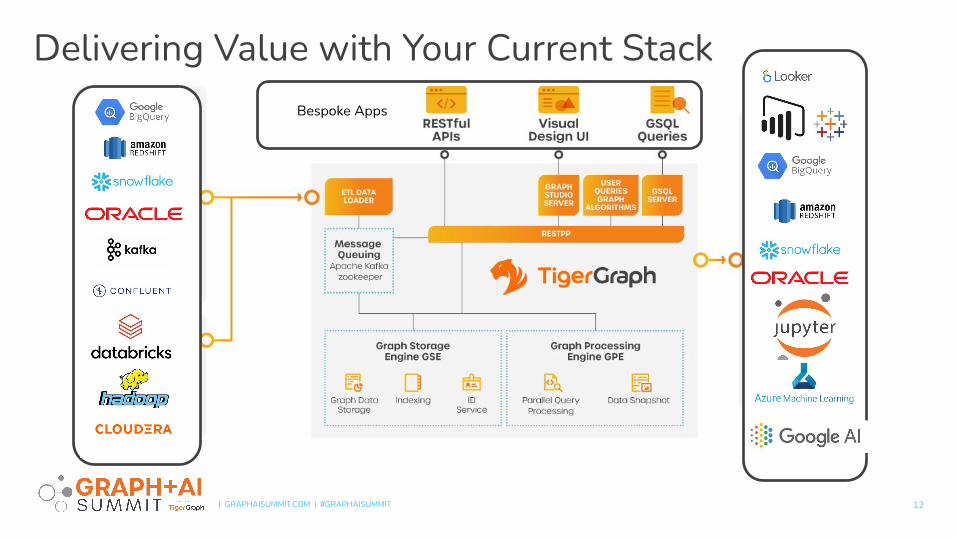
Delivering Value with Your Current StackBespoke Apps
12
| GRAPHAISUMMIT.COM | #GRAPHAISUMMIT
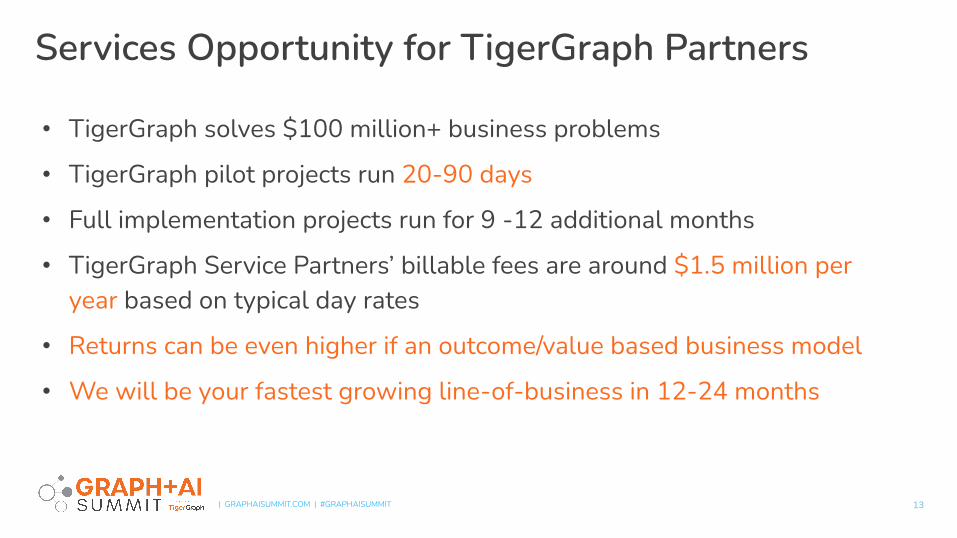
Services Opportunity for TigerGraph Partners
• TigerGraph solves $100 million+ business problems
• TigerGraph pilot projects run 20-90 days
• Full implementation projects run for 9 -12 additional months
• TigerGraph Service Partners’ billable fees are around $1.5 million per year based on typical day rates
• Returns can be even higher if an outcome/value based business model
• We will be your fastest growing line-of-business in 12-24 months
13

| GRAPHAISUMMIT.COM | #GRAPHAISUMMIT
TigerGraph Platform and Toolkit: Creating Solution Opportunities
Services Offerings Value Range
Strategic Advisory $2M or more
Data Strategy $500K to $4M
Data Science/ Data Pipeline Engineering
$500K to $2M
Backend Integration $500K to $4M
Frontend Visualization $250K to $500K
ML/AI Customization $500K to $2M
Solution Areas Client Transformation Potential Value Range
Sales Optimization
Customer 360 for Market Insights: Influencers, Black Swans, and the Golden Record
$1M to $5M
Fraud Prevention Intercepting Fraud, Waste, and Abuse: Every Industry Can Do Better with Graph Analytics
$2M to $10M
Supply Chain Digital Twin
Insight Across All Phases of the Supply Chain: Coming Back Stronger and Faster
$2M to $10M
Gartner: “Graph analysis is possibly the single most effective competitive differentiator for organizations pursuing data-driven operations and decisions after the design of data capture.”
As an emerging technology, graph analytics represents a software, services, and solutions opportunity of unique scale, differentiation, and potential customer transformation.
14

| GRAPHAISUMMIT.COM | #GRAPHAISUMMIT
Services Value Proposition – Breaking Down Roles and Responsibilities
Mobilise Governance
Structure
Project Management
Build Data Pipelines
Set up Graph Schema
Training
Business Case & Value Tracking
Comms Model Office and Adoption
Integration BuildData Transformation
Load Data into Graph
Build Graph Queries + APIs
Customise Client Strategic Visualisation Tool
Business Requirements
Programme Mission/Objective Governance Execution
Stakeholder Coordination
Customise Graph Visual UI
Change Mgmt Planning
Architecture & Capability Blueprint
E2E TestFunctional Test & SIT
Go Live Readiness + Execution
TigerGraph
SI
Setup & Design Build Test and Deploy
Exec Steering
Project Management
Business Analysis
Data Engineering
Graph Setup
Test & Go Live
Change Management
Client
Provision Servers
Data Governance Structure
15
| GRAPHAISUMMIT.COM | #GRAPHAISUMMIT
TigerGraph Enablement Program
16
| GRAPHAISUMMIT.COM | #GRAPHAISUMMIT
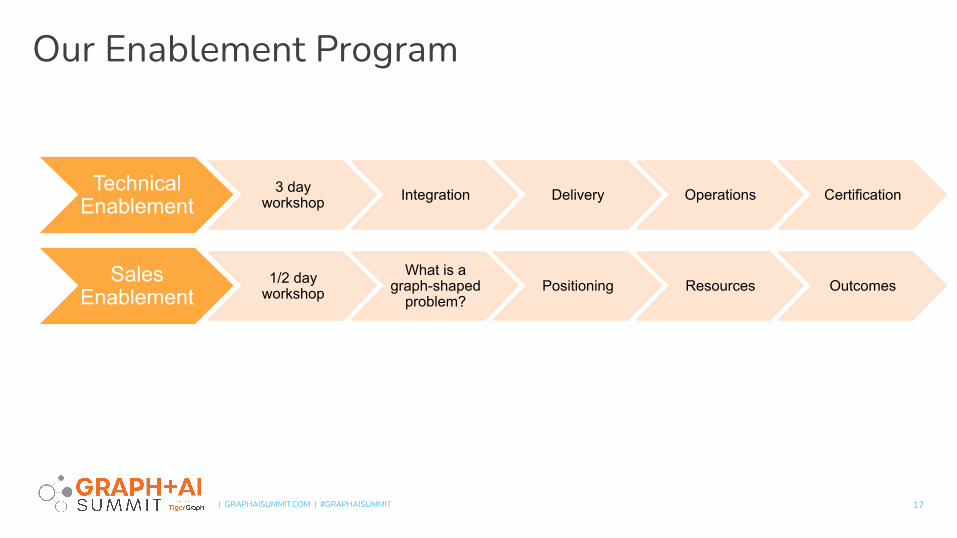
Our Enablement Program
Technical Enablement
3 day workshop Integration Delivery Operations Certification
Sales Enablement
1/2 day workshop
What is a graph-shaped
problem?Positioning Resources Outcomes
17
| GRAPHAISUMMIT.COM | #GRAPHAISUMMIT
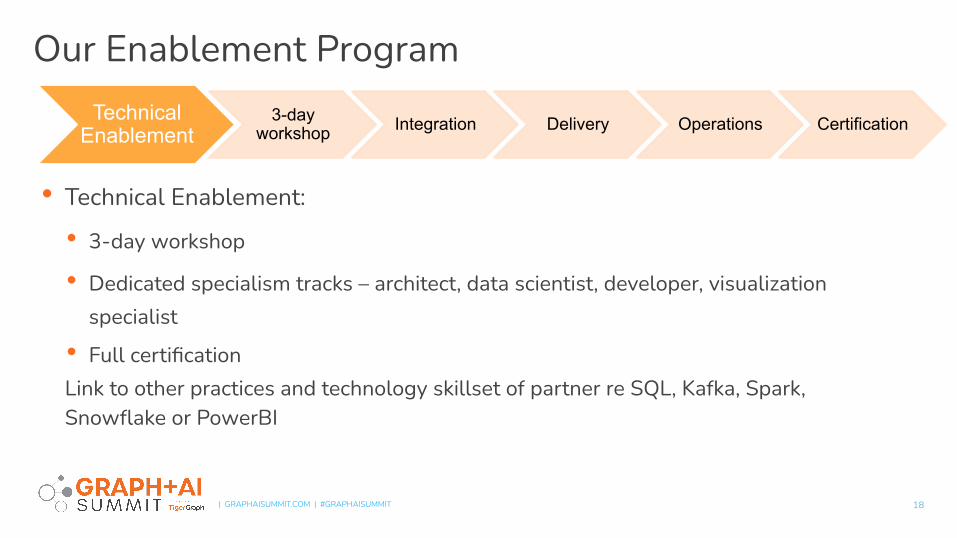
Our Enablement Program
• Technical Enablement:
• 3-day workshop
• Dedicated specialism tracks – architect, data scientist, developer, visualization specialist
• Full certificationLink to other practices and technology skillset of partner re SQL, Kafka, Spark, Snowflake or PowerBI
Technical Enablement
3-day workshop Integration Delivery Operations Certification
18

| GRAPHAISUMMIT.COM | #GRAPHAISUMMIT
Our Enablement Program
• Sales Enablement:
• Half day workshop
• Sales positioning
• Sales engineer training
• Use cases
• Engagement
Sales Enablement
½-day workshop
What is a graph-shaped
problem?Positioning Resources Outcomes
19
| GRAPHAISUMMIT.COM | #GRAPHAISUMMIT
Our Enablement Program
• Additional sessions:
• Marketing planning
• Service delivery and project planning workshop
• Commercial account mapping
20

| GRAPHAISUMMIT.COM | #GRAPHAISUMMIT
Implementation Professional Services Engagements
Customisation Query building
Dashboard building
Support User Training
9 – 12 month 5 – 10 resources engagement
Repeat with next
Use Case
Scoping work
Strategy Consultancy Engagements running in parallel
21
| GRAPHAISUMMIT.COM | #GRAPHAISUMMIT
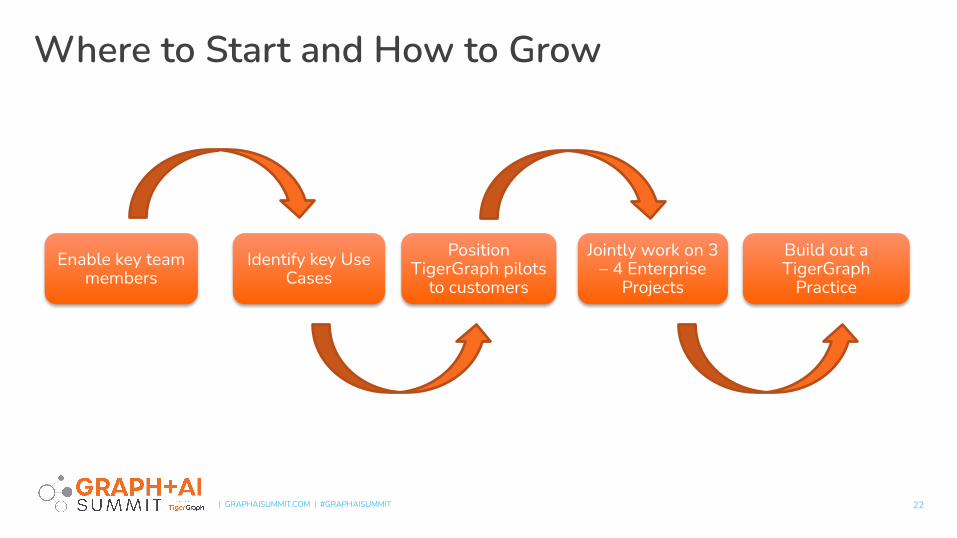
Where to Start and How to Grow
Enable key team members
Identify key Use Cases
Position TigerGraph pilots
to customers
Jointly work on 3 – 4 Enterprise
Projects
Build out a TigerGraph
Practice
22

| GRAPHAISUMMIT.COM | #GRAPHAISUMMIT
To Graph or Not to Graph? That Is Not the Question —
You Will Graph.
Source: Gartner, Graph Steps Onto the Main Stage of Data and Analytics: A Gartner Trend Insight Report, 2020
23

| GRAPHAISUMMIT.COM | #GRAPHAISUMMIT
Thank You
24
David RonaldProduct Marketing [email protected]
Michael ShalerVice President of [email protected]

Thank You
25


