
Ozone Production Efficiency in the Baltimore/Washington
Urban Plume
Presentation by Linda Hembeck
Co-Authors: Christopher Loughner, Timothy Vinziguerra, Timothy Canty, Russell Dickerson, and Ross Salawitch
13th Annual CMAS Conference October 28th, 2014
Content
Motivation
Background
Ozone Production Efficiency (OPE) in CMAQ and DISCOVER-AQ 2011 Maryland data using BEIS or MEGAN for biogenic emissions
Comparisons of trace gas species between model output and data
Summary
2
Motivation
Elevated levels of tropospheric ozone have a negative impact on human health and crops
Comparison of measured and modeled surface O3 is where we begin and end, but accurate representation of surface O3 precursors is vitally important, especially for meaningful guide to policy
Ozone production efficiency (OPE) provides a mechanism for quantitatively assessing air quality representation of key components of the photochemical evolution of urban plumes
3
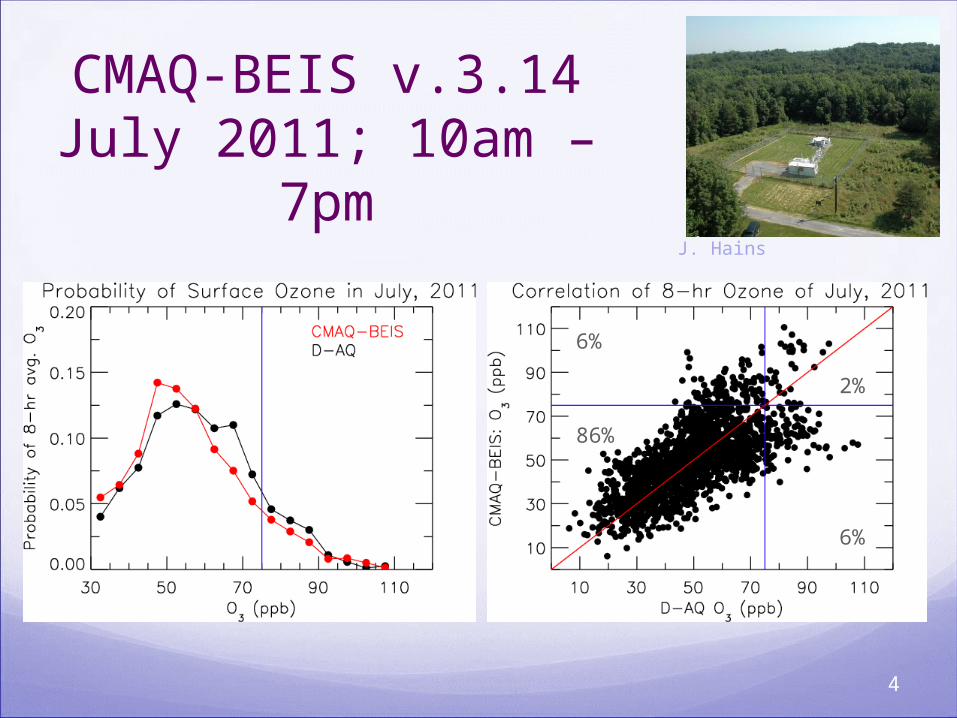
CMAQ-BEIS v.3.14July 2011; 10am – 7pm
J. Hains
86%
2%
6%
6%
4
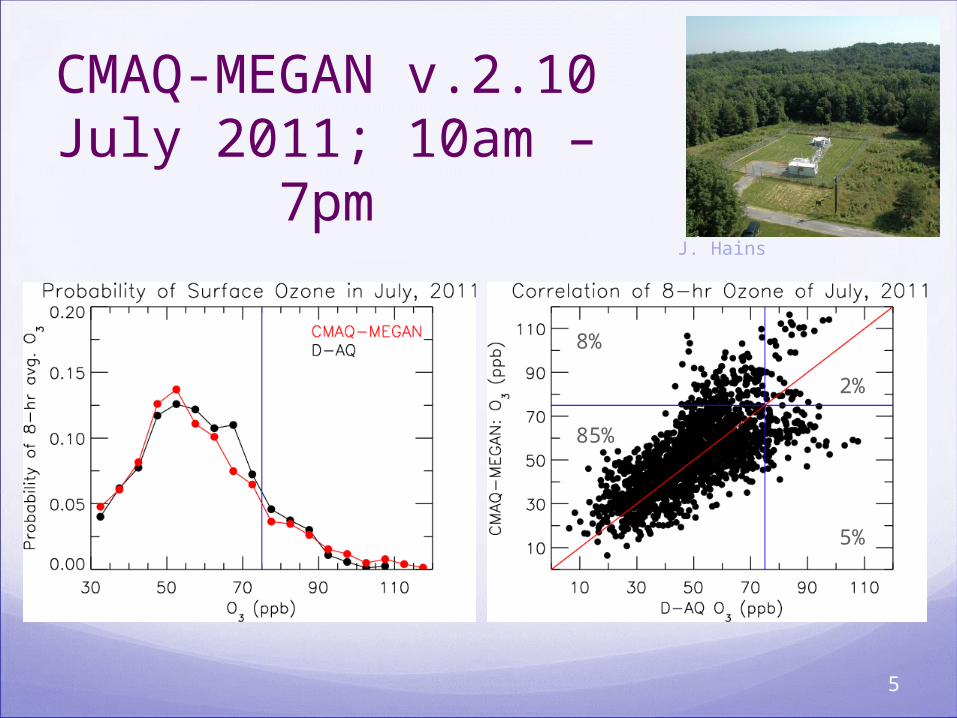
CMAQ-MEGAN v.2.10July 2011; 10am – 7pm
J. Hains
85%
2%
5%
8%
5
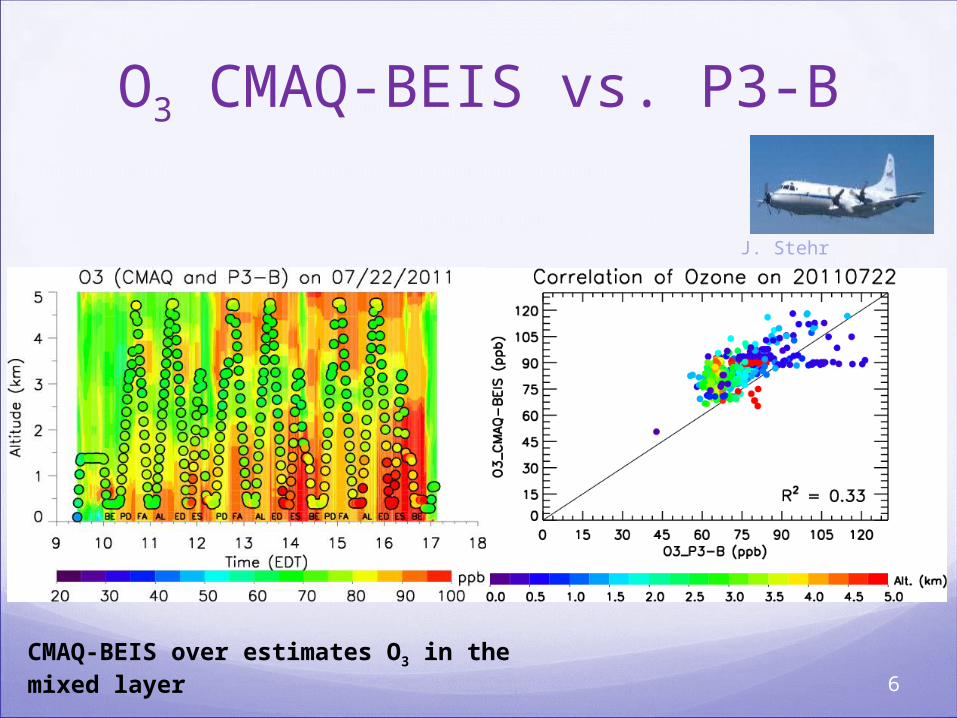
O3 CMAQ-BEIS vs. P3-B
CMAQ-BEIS over estimates O3 in the mixed layer
J. Stehr
6
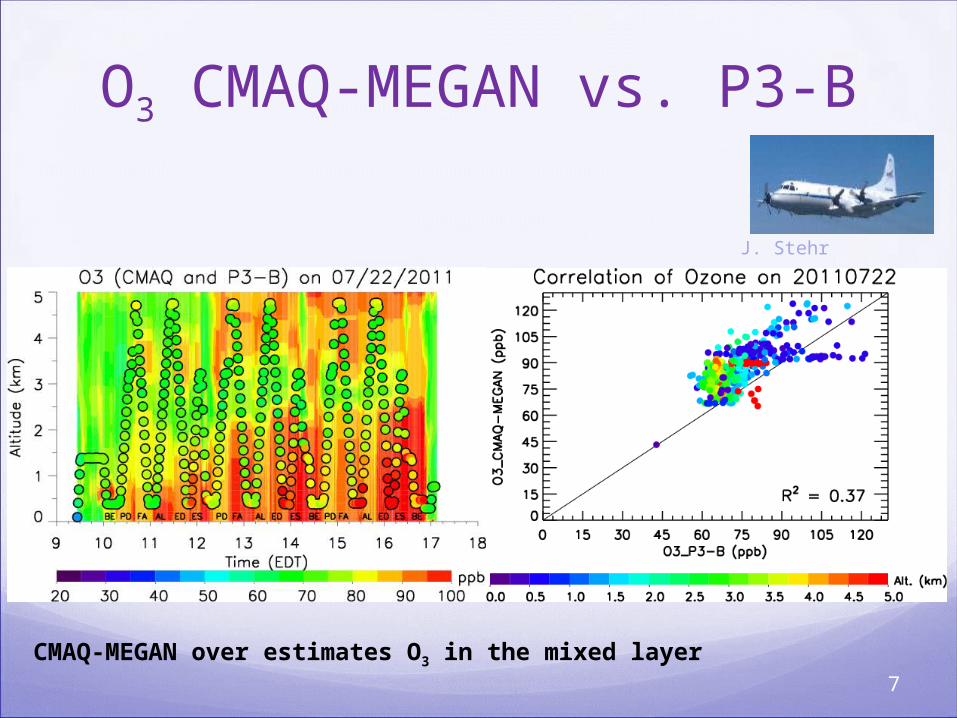
O3 CMAQ-MEGAN vs. P3-B
CMAQ-MEGAN over estimates O3 in the mixed layer
J. Stehr
7
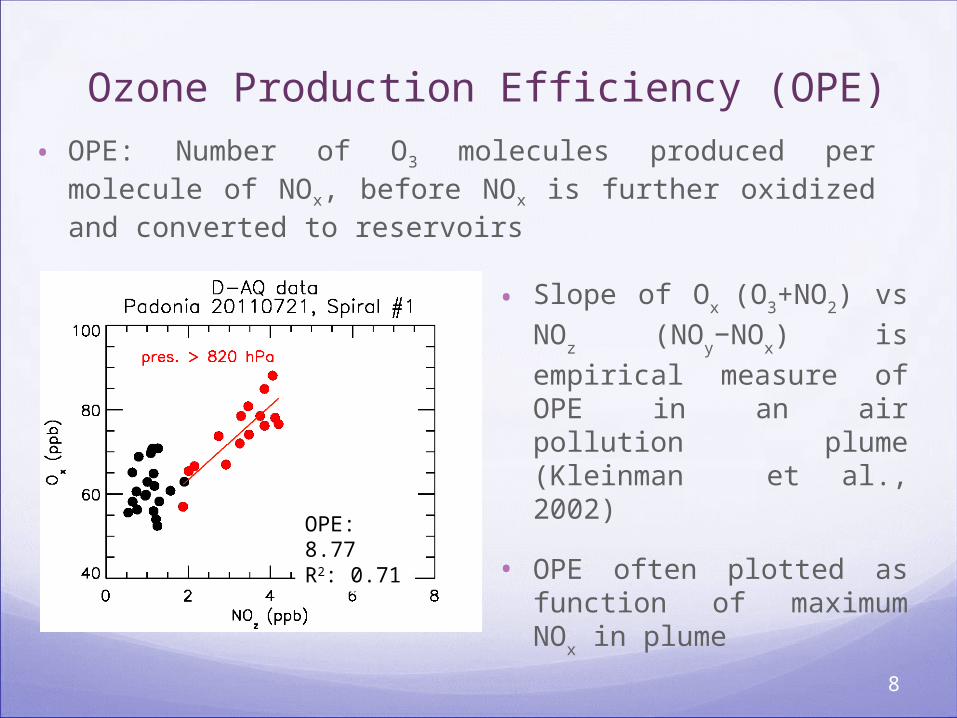
Ozone Production Efficiency (OPE)• OPE: Number of O3 molecules produced per molecule of NOx,
before NOx is further oxidized and converted to reservoirs
• Slope of Ox
(O3+NO
2) vs NO
z
(NOy−NO
x) is empirical
measure of OPE in an air pollution plume (Kleinman et al., 2002)
• OPE often plotted as function of maximum NO
x in plume
8
OPE: 8.77R2: 0.71
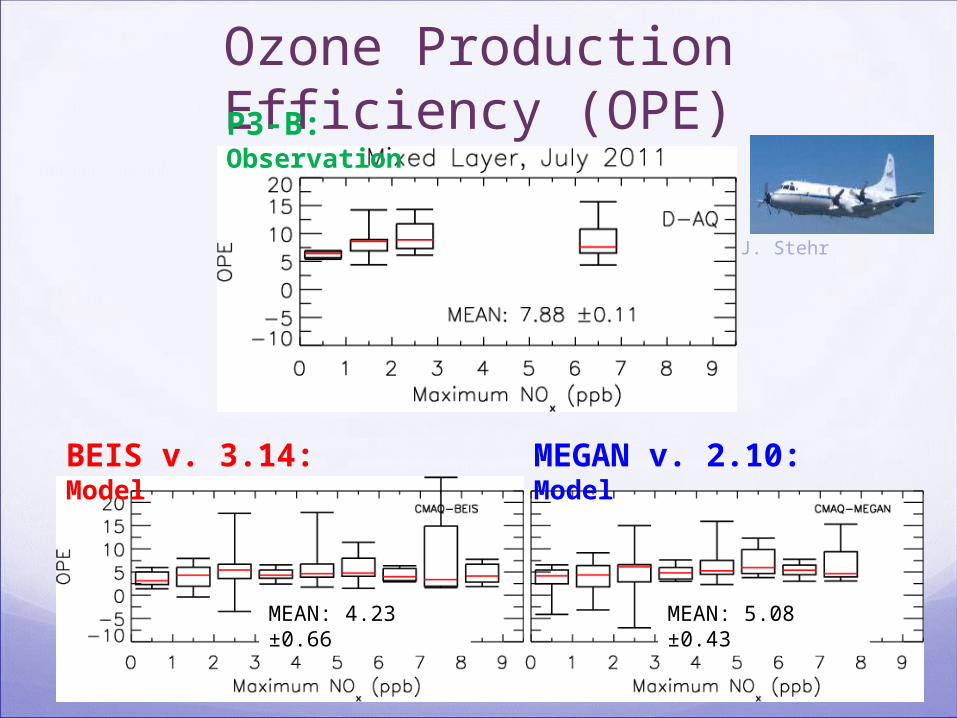
Ozone Production Efficiency (OPE)
BEIS v. 3.14: Model MEGAN v. 2.10: Model
P3-B: Observation
J. Stehr
9
MEAN: 4.23 ±0.66 MEAN: 5.08 ±0.43
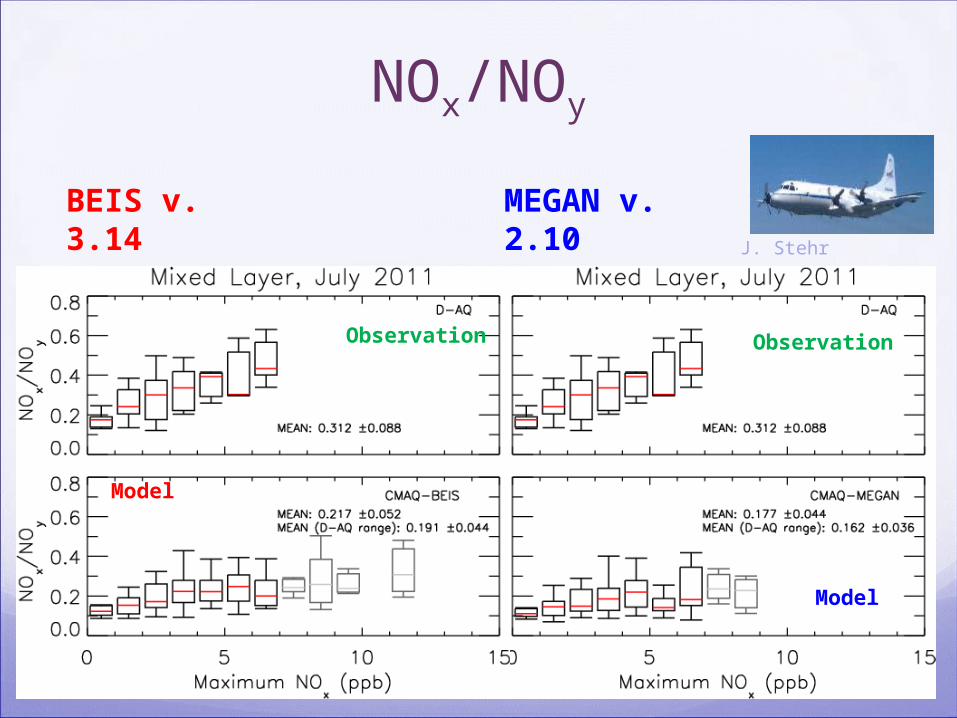
NOx/NOy
BEIS v. 3.14 MEGAN v. 2.10J. Stehr
10
Observation Observation
Model
Model
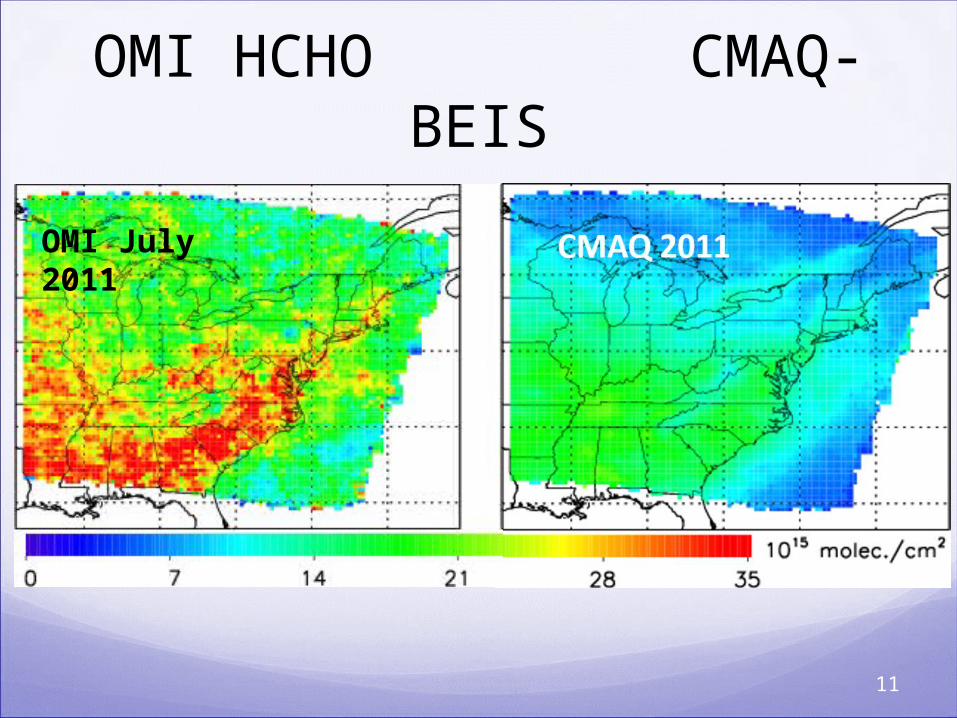
OMI HCHO CMAQ-BEIS
Slide in progress….will show comparison of OMI HCHO to CMAQ-BEIS and CMAQ-MEGANThis slide will support the findings from CMAQ comparisons to D-AQ data
11
OMI July 2011
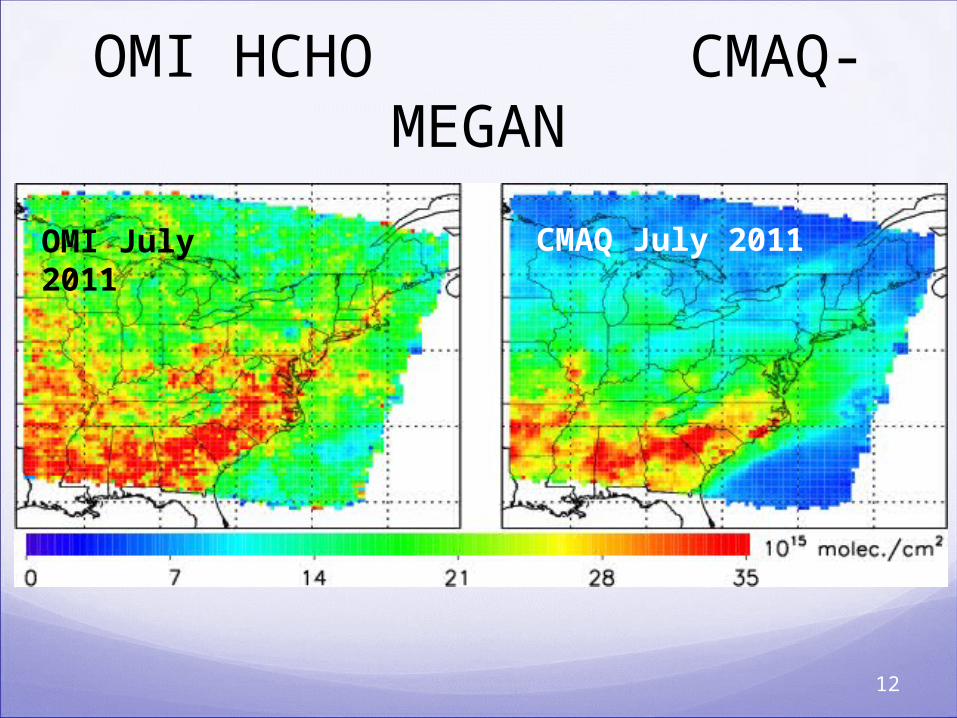
OMI HCHO CMAQ-MEGAN
Slide in progress….will show comparison of OMI HCHO to CMAQ-BEIS and CMAQ-MEGANThis slide will support the findings from CMAQ comparisons to D-AQ data
12
OMI July 2011 CMAQ July 2011
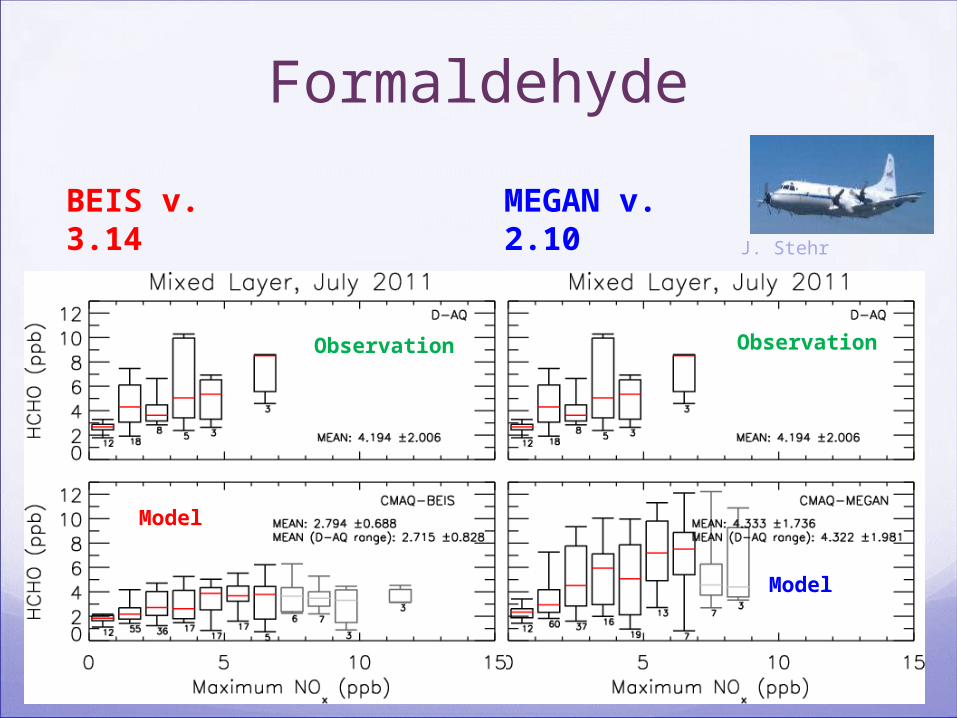
Formaldehyde
BEIS v. 3.14 MEGAN v. 2.10J. Stehr
13
Observation Observation
Model
Model
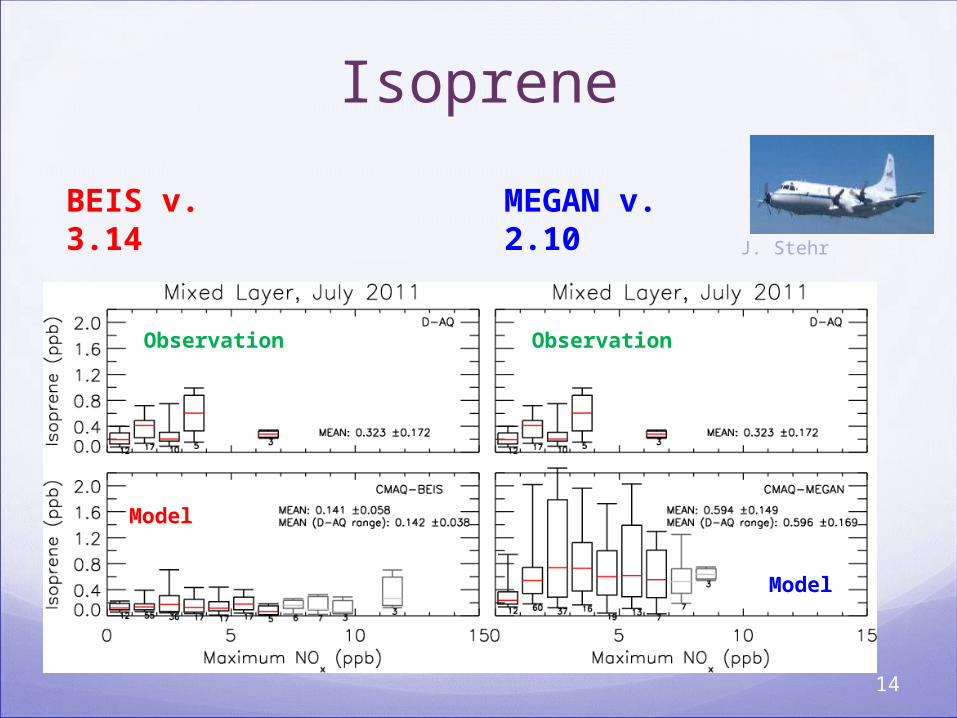
Isoprene
BEIS v. 3.14 MEGAN v. 2.10J. Stehr
14
Observation Observation
Model
Model
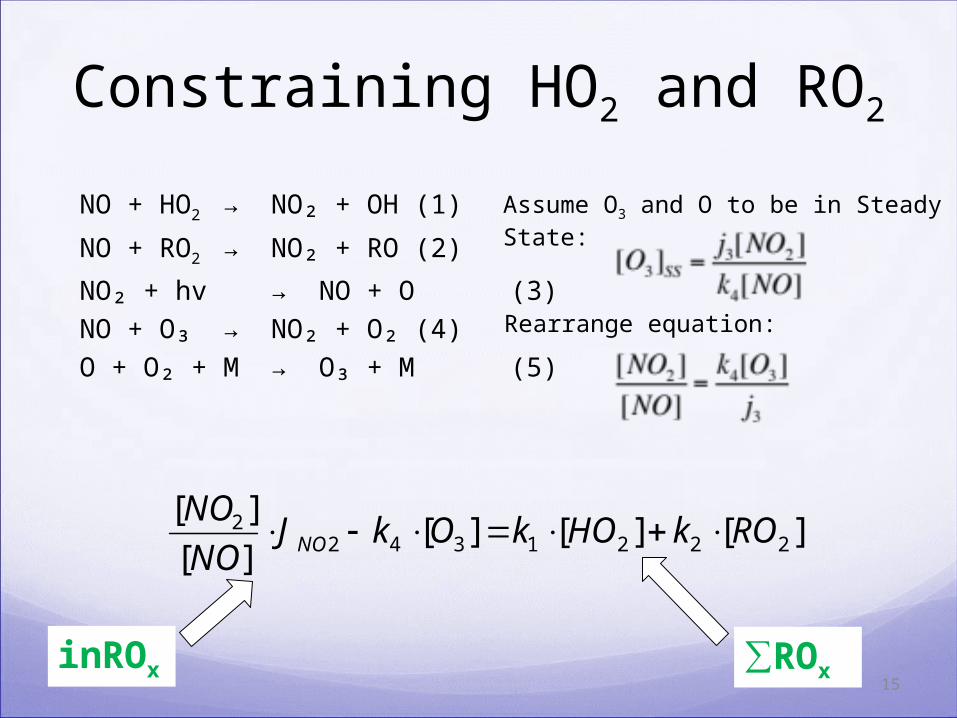
Constraining HO2 and RO2
15
NO + HO2 → NO₂ + OH (1)
NO + RO2 → NO₂ + RO (2)
NO₂ + hv → NO + O (3)
NO + O₃ → NO₂ + O₂ (4)
O + O₂ + M → O₃ + M (5)
Assume O3 and O to be in Steady State:
Rearrange equation:
][][][][
][2221342
2 ROkHOkOkJNO
NONO
inROx ∑ROx
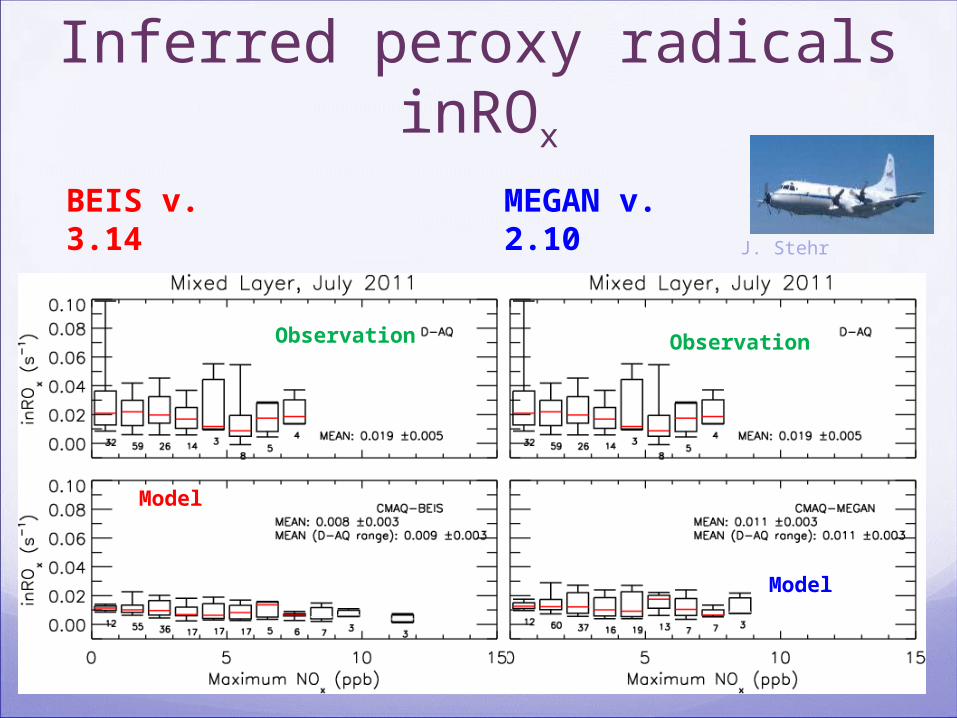
Inferred peroxy radicals inROx
BEIS v. 3.14 MEGAN v. 2.10J. Stehr
16
Observation Observation
Model
Model
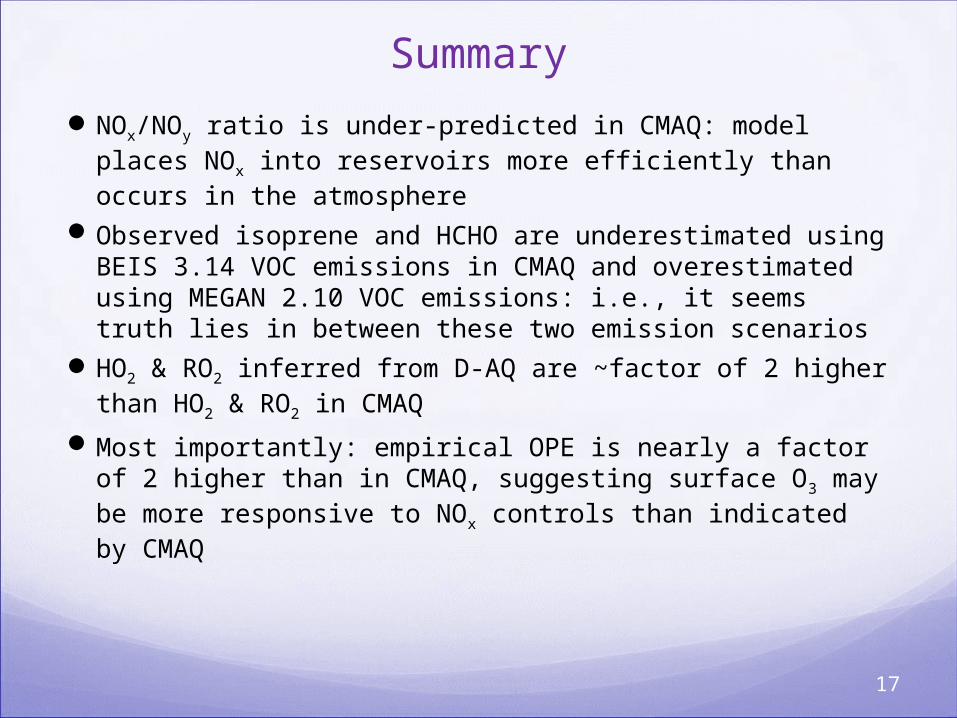
Summary
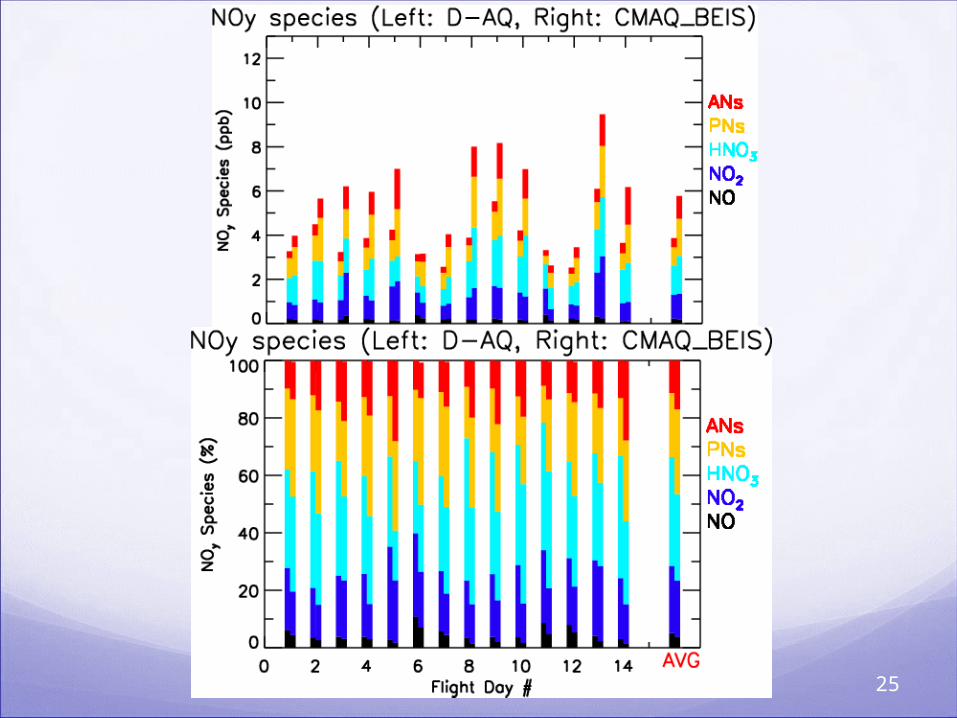
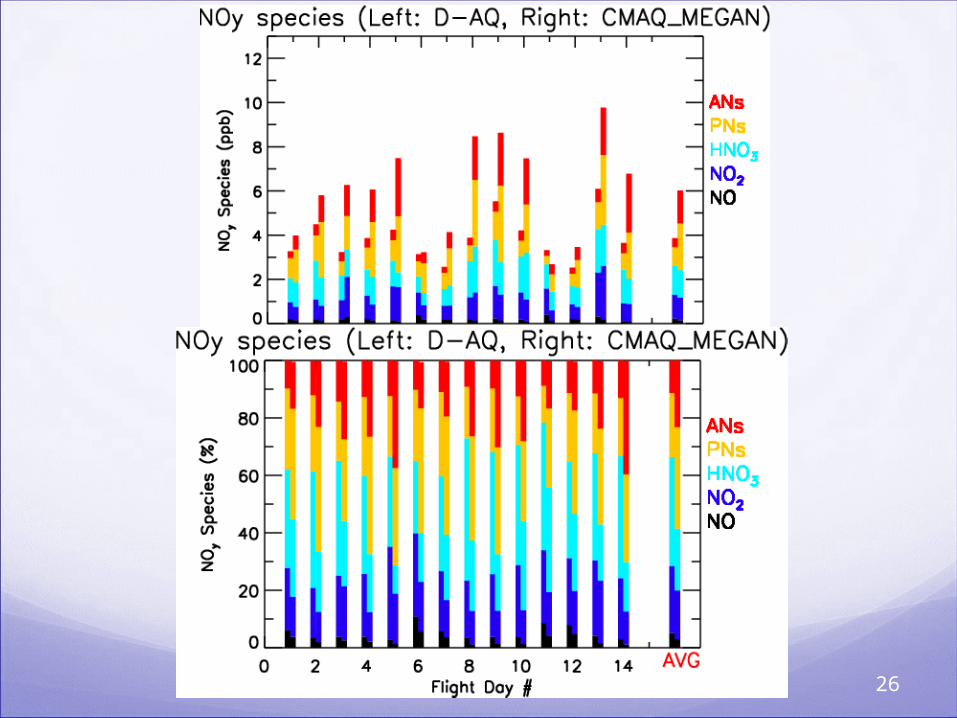
NOx/NOy ratio is under-predicted in CMAQ: model places NOx into reservoirs more efficiently than occurs in the atmosphere
Observed isoprene and HCHO are underestimated using BEIS 3.14 VOC emissions in CMAQ and overestimated using MEGAN 2.10 VOC emissions: i.e., it seems truth lies in between these two emission scenarios
HO2 & RO2 inferred from D-AQ are ~factor of 2 higher than HO2 & RO2 in CMAQ
Most importantly: empirical OPE is nearly a factor of 2 higher than in CMAQ, suggesting surface O3 may be more responsive to NOx controls than indicated by CMAQ
17
Work in Progress
Assess model performance with a 50% reduction of mobile NOx emissions (Anderson et al. 2014): preliminary results show however most of the problems persist
Use a more explicit chemical mechanism for NTR such as introduced by Donna Schwede on Monday
Implement the new BEIS mentioned during this conference into CMAQ
Assess differences between this work, based on CB05, and CMAQ runs based on CB06
18

Questions?
19

Backup
20
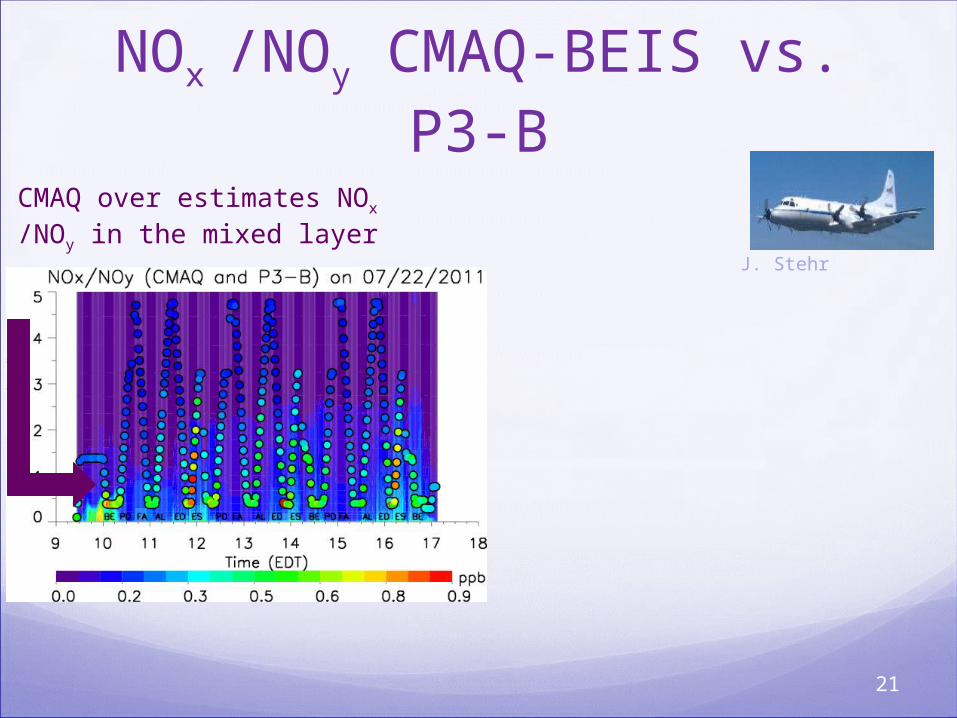
NOx /NOy CMAQ-BEIS vs. P3-B
J. Stehr
CMAQ over estimates NOx /NOy in the mixed layer
21
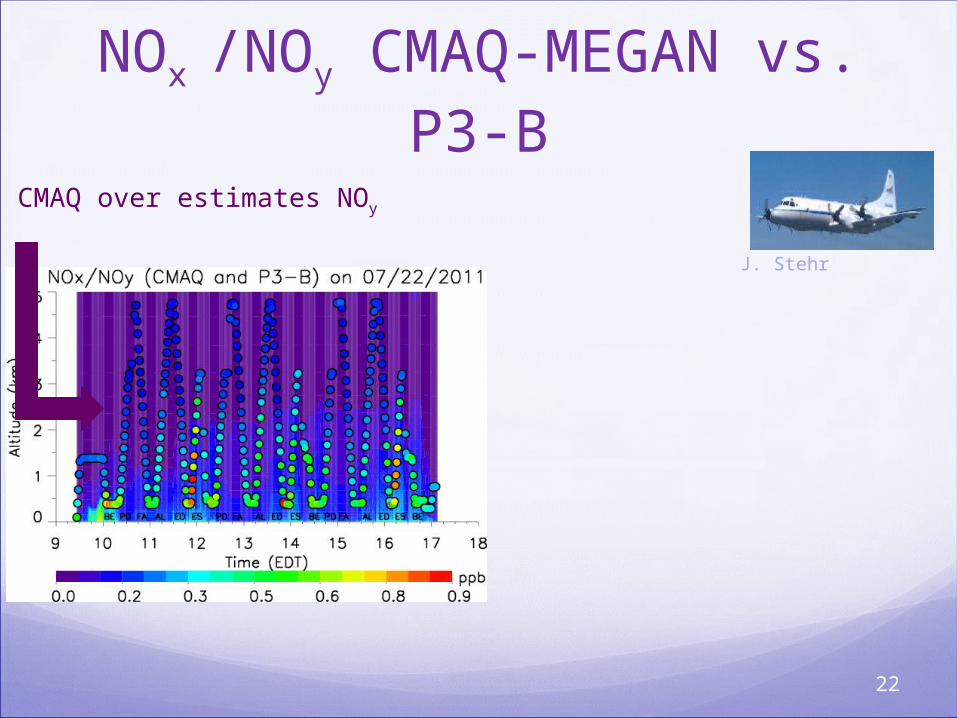
NOx /NOy CMAQ-MEGAN vs. P3-B
J. Stehr
CMAQ over estimates NOy
22

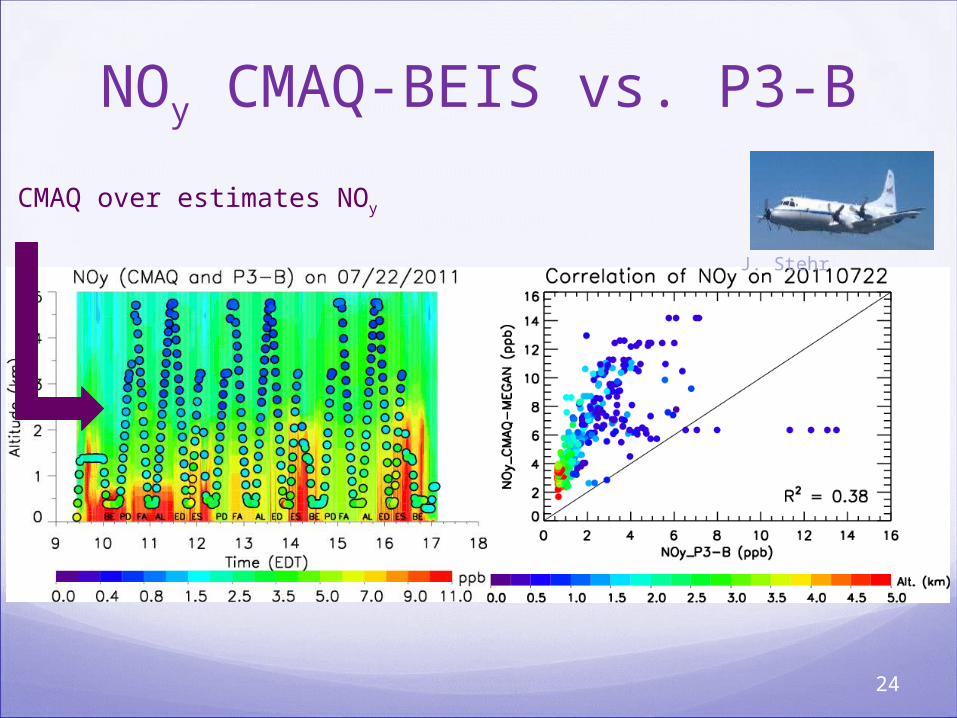
NOy CMAQ-BEIS vs. P3-B
J. Stehr
CMAQ over estimates NOy
23
NOy CMAQ-BEIS vs. P3-B
J. Stehr
CMAQ over estimates NOy
24
25
26


