© 2016. Published by The Company of Biologists Ltd.
Oxygen-dependence of upper thermal limits in fishes
Rasmus Ern1, Tommy Norin2,†, A. Kurt Gamperl2, Andrew J. Esbaugh1
1The University of Texas at Austin, Marine Science Institute, USA.
2Department of Ocean Sciences, Memorial University of Newfoundland, St. John’s, NL, Canada.
†Current affiliation: Institute of Biodiversity, Animal Health & Comparative Medicine, University
of Glasgow, Graham Kerr Building, Glasgow, United Kingdom.
Corresponding author
Rasmus Ern
Email: [email protected]
Key Words
Aerobic scope, Critical oxygen tension (𝑃𝑐𝑟𝑖𝑡), Critical thermal maximum (𝐶𝑇𝑚𝑎𝑥), Hypoxia,
Oxygen limit for thermal tolerance (𝑃𝐶𝑇𝑚𝑎𝑥), Temperature.
Summary statement
Based on measurements of critical thermal maximum temperatures in marine fishes under hypoxia,
this study provides a novel metric (𝑃𝐶𝑇𝑚𝑎𝑥) for assessing the oxygen sensitivity of upper thermal
limits in water-breathing ectotherms.
Jour
nal o
f Exp
erim
enta
l Bio
logy
• A
dvan
ce a
rtic
le
http://jeb.biologists.org/lookup/doi/10.1242/jeb.143495Access the most recent version at J Exp Biol Advance Online Articles. First posted online on 2 September 2016 as doi:10.1242/jeb.143495http://jeb.biologists.org/lookup/doi/10.1242/jeb.143495Access the most recent version at
First posted online on 2 September 2016 as 10.1242/jeb.143495
ABSTRACT
Temperature-induced limitations on the capacity of the cardiorespiratory system to transport
oxygen from the environment to the tissues, manifested as a reduced aerobic scope (maximum-
minus standard metabolic rate), have been proposed as the principal determinant of the upper
thermal limits of fishes and other water-breathing ectotherms. Consequently, the upper thermal
niche boundaries of these animals are expected to be highly sensitive to aquatic hypoxia and other
environmental stressors that constrain their cardiorespiratory performance. However, the
generality of this dogma has recently been questioned, as some species have been shown to
maintain aerobic scope at thermal extremes. Here, we experimentally tested whether reduced
oxygen availability due to aquatic hypoxia would decrease the upper thermal limits (i.e., the critical
thermal maximum; 𝐶𝑇𝑚𝑎𝑥) of the estuarine red drum (Sciaenops ocellatus) and the marine
lumpfish (Cyclopterus lumpus). In both species, 𝐶𝑇𝑚𝑎𝑥 was independent of oxygen availability
over a wide range of oxygen levels despite substantial reductions in aerobic scope (i.e., > 72%).
These data show that the upper thermal limits of water-breathing ectotherms are not always linked
to the capacity for oxygen transport. Consequently, we propose a novel metric for classifying
oxygen-dependence of thermal tolerance; the oxygen limit for thermal tolerance (𝑃𝐶𝑇𝑚𝑎𝑥), which
is the water oxygen tension (𝑃𝑤𝑂2) where an organism’s 𝐶𝑇𝑚𝑎𝑥 starts to decline. We suggest that
this metric can be used for assessing the oxygen sensitivity of upper thermal limits in water-
breathing ectotherms, and the susceptibility of their upper thermal niche boundaries to
environmental hypoxia.
Jour
nal o
f Exp
erim
enta
l Bio
logy
• A
dvan
ce a
rtic
le
INTRODUCTION
Marine ectotherms largely occupy the extent of latitudes tolerable within their thermal limits
(Sunday et al., 2012), and are therefore, expected to shift their latitudinal distribution ranges
poleward with climate warming (Pörtner, 2014b; Sunday et al., 2012). The critical thermal
maximum (𝐶𝑇𝑚𝑎𝑥), typically determined as the temperature at which animals exhibit a loss of
equilibrium (LOE) (Beitinger et al. 2000), defines the upper limit of a species’ fundamental
thermal niche and is the temperature where animal function ceases due to the collapse of one or
more vital physiological functions (Pörtner, 2010).
Oxygen supply capacity refers to the maximum ability of the cardiorespiratory system to
supply oxygen to the tissues by increasing ventilation, cardiac output, and blood oxygen carrying
capacity. Over the last two decades, laboratory studies have reported reduced heart and ventilation
rates, diminished cardiac output and blood oxygen content, and an accumulation of anaerobic
metabolites in water-breathing ectotherms exposed to acute temperature increases that approach
their upper thermal limits (Frederich and Pörtner, 2000; Mark et al., 2002; Melzner et al., 2006;
Wittmann et al., 2008). This led to the hypothesis that fishes and other water-breathing ectotherms,
at temperatures approaching their 𝐶𝑇𝑚𝑎𝑥, are unable to maintain sufficient oxygen supply for basic
metabolism due to temperature-induced cardiorespiratory constraints. The temperature where
animals become reliant on unsustainable anaerobic metabolism for vital physiological functions is
termed the critical temperature (𝑇𝑐𝑟𝑖𝑡) (Farrell et al., 2009; Pörtner, 2010). Above 𝑇𝑐𝑟𝑖𝑡, extreme
hypoxemia develops and the time until terminal ATP-deficiency (i.e., 𝐶𝑇𝑚𝑎𝑥) becomes
progressively shorter with increased warming (Pörtner, 2010). In species where the upper thermal
limits are determined by insufficient oxygen supply for vital physiological functions, any reduction
in oxygen availability should reduce both 𝑇𝑐𝑟𝑖𝑡 and 𝐶𝑇𝑚𝑎𝑥. The upper thermal limits of these
species can, thus, be described as oxygen-dependent.
In fishes, reduced cardiorespiratory performance and oxygen supply capacity at supra-optimal
temperatures have been correlated with reductions in population abundance (Johansen et al., 2015;
Pörtner and Knust, 2007) and migration performance (Eliason et al., 2011). It has also been
suggested that oxygen-dependent upper thermal limits identified in the laboratory represent those
in the field (Giomi et al., 2014; Pörtner and Knust, 2007). However, the link between oxygen
supply capacity and upper thermal limits has recently been questioned, as other studies have
reported that aerobic scope (AS; the difference between the maximum metabolic rate, MMR, and
Jour
nal o
f Exp
erim
enta
l Bio
logy
• A
dvan
ce a
rtic
le

the standard metabolic rate, SMR) and cardiorespiratory performance are maintained in a number
of fish and crustacean species experiencing ecologically-relevant thermal extremes (Brijs et al.,
2015; Clark et al., 2013a; Ern et al., 2015; Ern et al., 2014 ; Grans et al., 2014; Healy and Schulte,
2012; Jost et al., 2012; Norin et al., 2014). It has, therefore, been suggested that some species
possess a more thermally resistant cardiorespiratory system (Ern et al., 2014; Jost et al., 2012), and
that insufficient tissue oxygen supply is not the primary determinant of upper thermal limits in all
water-breathing ectotherms (Brijs et al., 2015; Wang et al., 2014).
Thermal tolerance can be described as the capacity to maintain the performance of a single
physiological function (e.g., heart rate) or a group of related functions (e.g., cardiorespiratory
oxygen transport) when temperatures change. Whereas, thermal limits describe the temperatures
where the performance of such functions begins to decline, or is reduced to zero. 𝐶𝑇𝑚𝑎𝑥 is a widely
used metric for evaluating the thermal tolerance and thermal limits of animals (Terblanche et al.,
2011 and references within), but involves an acute increase in temperature, representative of
relatively few aquatic environments (e.g., shallow tropical estuaries, tide pools, desert streams).
Furthermore, because the performance capacity of physiological functions are influenced by both
the rate of temperature change and the duration of exposure to new temperatures, the ecological
relevance of such measurements must take into account these two parameters (e.g., Somero, 2010;
Terblanche et al. 2011; Farrell, 2016); especially if the rates of change greatly exceed those
encountered by the species in the wild. Nonetheless, 𝐶𝑇𝑚𝑎𝑥 and an organism’s thermal breadth
(𝐶𝑇𝑚𝑎𝑥 − 𝐶𝑇𝑚𝑖𝑛) have been applied widely in both experimental studies and meta-analyses on the
impacts of climate warming on aquatic ectotherms, including in predictions of their global
(re)distribution (e.g., Sunday et al., 2011; Sunday et al., 2012; Magozzi and Calosi, 2015; Vinagre
et al., 2016). Investigating the oxygen-dependence of thermal tolerance using 𝐶𝑇𝑚𝑎𝑥 is, therefore,
highly relevant for continued research efforts aimed at understanding how climate change will
impact ecological physiology and species’ distributions. This is especially true as accelerated
climate change not only involves increasing (and more extreme) temperatures, but also an increase
in the frequency and severity of aquatic hypoxia (Altieri and Gedan, 2015; Diaz and Rosenberg,
2008). This latter condition is likely to play a key role in shaping the distribution of species if their
upper thermal limits are oxygen-dependent.
From a physiological perspective, aquatic hypoxia can be defined as any water oxygen tension
(𝑃𝑤𝑂2) that reduces MMR and AS, with the critical oxygen tension (𝑃𝑐𝑟𝑖𝑡) characterised as the
Jour
nal o
f Exp
erim
enta
l Bio
logy
• A
dvan
ce a
rtic
le
𝑃𝑤𝑂2 where AS is zero and any further reductions in 𝑃𝑤𝑂2 result in a proportional decrease in the
rate of oxygen consumption below that required to sustain baseline metabolism (i.e., SMR) (Farrell
and Richards, 2009). Thus, in species with oxygen-dependent upper thermal limits, the 𝑇𝑐𝑟𝑖𝑡 should
be reduced at any level of hypoxia that causes a significant reduction in MMR and, thus, AS (Fig.
1A, B). Because upper thermal limits of these species are caused by terminal ATP-deficiency,
𝐶𝑇𝑚𝑎𝑥 should also decline accordingly. However, in species where the upper thermal limits in
normoxia are not determined by insufficient oxygen supply, a portion of AS would remain at
𝐶𝑇𝑚𝑎𝑥 in normoxia (Fig. 1C) and no change in 𝐶𝑇𝑚𝑎𝑥 would be expected upon exposure to
progressive hypoxia until the 𝑃𝑤𝑂2 where MMR is reduced down to SMR, and AS reaches zero
(Fig. 1D). In such a case, the upper thermal limits in normoxia can be described as oxygen-
independent.
To investigate whether acute upper thermal tolerance (i.e., 𝐶𝑇𝑚𝑎𝑥 ) in fishes is determined by
insufficient oxygen supply capacity, we actively constrained AS by lowering water oxygen
availability (i.e., induced hypoxia), and then measured 𝐶𝑇𝑚𝑎𝑥 at a wide range of water oxygen
tensions (𝑃𝑤𝑂2), from normoxia to severe hypoxia. This allowed us to investigate if, or when, the
fish’s upper thermal limit (i.e., 𝐶𝑇𝑚𝑎𝑥) became oxygen-dependent. We used two fish species with
different thermal niches and ecologies; the athletic, free-swimming, eurythermal red drum
(Sciaenops ocellatus; approximate natural temperature range, 15-26°C) and the more sluggish,
cold-water lumpfish (Cyclopterus lumpus; approximate natural temperature range, 3-11°C)
(Aquamaps.org, 2015).
Jour
nal o
f Exp
erim
enta
l Bio
logy
• A
dvan
ce a
rtic
le
MATERIALS AND METHODS
Animals and maintenance
Red drum (Sciaenops ocellatus) were reared at 22±1°C (salinity 35±1 ppt) at the University of
Texas at Austin, Marine Science Institute (Port Aransas, Texas, USA), whereas lumpfish
(Cyclopterus lumpus) were reared at 10±1°C (salinity 32±1 ppt) at the Ocean Sciences Centre,
Memorial University of Newfoundland (St. John’s, Newfoundland, Canada). Both species were
fed with pelleted food every day, but were fasted for 24 h prior to experiments to avoid the
metabolic effects of digestion on respirometry measurements. Individual fish were used only once
in the experiments described below (i.e., no fish were tested more than once).
Experimental procedures were performed in accordance with policies of the Institutional
Animal Care and Use Committee of the University of Texas at Austin (red drum) and the Animal
Care Committee of Memorial University of Newfoundland (lumpfish; protocol no. 15-88-KG).
Studies on lumpfish also followed the guidelines of the Canadian Council on Animal Care.
Respirometry
Metabolic rates were estimated from rates of oxygen consumption (��O2) as measured using fiber-
optic oxygen sensors, meters and software (Pyro Science GmbH, Aachen, Germany or Loligo
Systems, Tjele, Denmark), and intermittent-flow respirometry (Clark et al., 2013a; Steffensen,
1989). ��O2 was calculated according to:
��O2=
−δ[𝑂2] × (𝑉𝑐ℎ𝑎𝑚𝑏𝑒𝑟 – 𝑉𝑓)
𝐵𝑀,
where ��O2 is oxygen consumption rate (mg O2 h
-1 kg-1), δ[𝑂2] is the slope of the decline in water
oxygen concentration (mg L-1 h-1) during the closed period of the intermittent respirometry cycle,
𝑉𝑐ℎ𝑎𝑚𝑏𝑒𝑟 is the volume of the respirometer (L), 𝑉𝑓 is the volume of the fish (i.e., it was assumed
that the fish had a density of 1 L kg-1), and BM is the fish’s body mass in kg. Respirometry chamber
volumes were 0.40 L for lumpfish and 1.20 L for red drum. Both the standard metabolic rate (SMR)
and the maximum metabolic rate (MMR) of lumpfish and red drum were measured, and the aerobic
scope (AS) of both species was calculated as MMR − SMR.
Jour
nal o
f Exp
erim
enta
l Bio
logy
• A
dvan
ce a
rtic
le
Standard metabolic rate (SMR) and critical oxygen tension (𝑷𝒄𝒓𝒊𝒕)
SMR and 𝑃𝑐𝑟𝑖𝑡 were measured at 10 and 16°C for lumpfish and at 24 and 30°C for red drum (N =
8 for each temperature and species). For each experimental group, the fish were placed inside
respirometry chambers submerged in a tank with a flow-through supply of fully aerated seawater
at 10°C for the lumpfish or 24°C for the red drum (the starting temperature for red drum was
slightly higher than their acclimation temperature due to limited capacity for cooling in the
experimental setup), and allowed 24 hours to settle inside the respirometry chambers. For the 10°C
(lumpfish) and 24°C (red drum) groups, ��O2 recordings were started immediately after the settling
period. For the 16°C (lumpfish) and 30°C (red drum) groups, water temperature was gradually
increased to these temperatures after the settling period, at a rate of 2°C h-1, upon which ��O2
recordings were initiated. ��𝑂2 recordings were then continued for 12-17.5 h, which produced 95-
100 (lumpfish) or 160-200 (red drum) individual ��𝑂2 measurements. For lumpfish the durations
of each intermittent measurement cycle (flush/wait/measure) were (in seconds) 300/120/240 and
300/60/180 at 10 and 16°C, respectively, and for red drum were 90/30/120 and 120/30/120 at 24
and 30°C, respectively. Oxygen levels in the respirometry chambers did not fall below 90% air-
saturation during ��O2 measurements. SMR was determined by first taking the mean of the lowest
10% of ��𝑂2 measurements over the 12-17.5 h respirometry period, excluding outliers that were
±2 s.d. from the mean (no more than two data points were identified as outliers for any fish), and
finally calculating the mean of the remaining ��𝑂2 measurements (Clark et al., 2013a). This method
ensured that only ��𝑂2 measurements recorded when the fish were quiescent were included in the
SMR calculations.
𝑃𝑐𝑟𝑖𝑡 measurements were made immediately following the determination of SMR, by turning
off the flush pumps and allowing the fish to consume the oxygen in the sealed respirometry
chambers, thereby gradually exposing them to increasing hypoxia. At a 𝑃𝑤𝑂2 of ~15 mmHg the
flush pumps were turned back on and the fish were returned to a recovery tank. The obtained ��O2
measurements were then plotted against the declining 𝑃𝑤𝑂2, and 𝑃𝑐𝑟𝑖𝑡 was calculated as the 𝑃𝑤𝑂2
where ��O2 first decreased below SMR. It should be noted that the ��O2
of the fish during the 𝑃𝑐𝑟𝑖𝑡
experiment was often elevated above SMR, due to spontaneous movements under hypoxia, and is
therefore, designated as routine metabolic rate (RMR) (see Fig. 2).
Jour
nal o
f Exp
erim
enta
l Bio
logy
• A
dvan
ce a
rtic
le
To account for background microbial respiration, ��O2 recordings were also made after removal
of the fish. ��O2 from bacterial respiration was not detectable in any of these background
measurements, likely due to the thorough cleaning of the respirometry equipment between
measurements.
Maximum metabolic rate (MMR) and aerobic scope (AS)
In separate experiments, MMR was measured at 10 and 16°C for lumpfish and 24 and 30°C for
red drum (N = 8 for each temperature and species) in both normoxia and in hypoxia (𝑃𝑤𝑂2 of 70-
76 mmHg; Table 1). For all measurements, the fish were placed in a circular experimental tank
(50 L) containing fully aerated seawater at 10°C (lumpfish) or 24°C (red drum) and left overnight.
The following morning, water temperature was either maintained at 10°C or 24°C or heated to
16°C (lumpfish) or 30°C (red drum) at a rate of 2°C h-1. The fish were then individually exercised
in normoxic water for 2 min (until exhaustion) by manual hand-chasing by the experimenter, and
immediately transferred to a respirometry chamber kept at the appropriate temperature and 𝑃𝑤𝑂2.
��O2 recordings commenced within 20 s after the cessation of chasing and MMR was determined
over a 2-min period during the first ��O2 recording, which was always the highest. The 𝑃𝑤𝑂2 (±
2.5 mmHg) in the tank containing the respirometry chambers was regulated using a solenoid
system that bubbled air or nitrogen into the water.
To calculate the percentage change in AS with changing 𝑃𝑤𝑂2, a 3-parameter power function
was fitted to MMR in normoxia and in hypoxia, SMR at 𝑃𝑐𝑟𝑖𝑡 and RMR below 𝑃𝑐𝑟𝑖𝑡. The
reductions in AS (from 0% in normoxia to 100% at 𝑃𝑐𝑟𝑖𝑡) were then calculated as the difference
between the corresponding MMR on the regression line and SMR in normoxia (cf. Fig. 2A, B, D,
E). Given that MMR was not measured at oxygen levels between ~50% and 100% air-saturation,
the calculated change in AS with 𝑃𝑤𝑂2 does not account for a potential ‘zone of hypoxia
insensitivity’ near 100% air-saturation, where MMR may have been unaffected by mild reductions
in dissolved oxygen. Consequently, the values of AS at high 𝑃𝑤𝑂2 may be subject to a slight
underestimate, which diminishes as 𝑃𝑤𝑂2 approaches 𝑃𝑐𝑟𝑖𝑡.
Jour
nal o
f Exp
erim
enta
l Bio
logy
• A
dvan
ce a
rtic
le
Critical thermal maximum (𝑪𝑻𝒎𝒂𝒙) and the oxygen limit for thermal tolerance (𝑷𝑪𝑻𝒎𝒂𝒙)
Finally, in both species, 𝐶𝑇𝑚𝑎𝑥 , was measured in normoxia and at multiple levels of hypoxia (see
below; N = 8 in all groups). For all measurements, the fish were placed inside respirometry
chambers submerged in a 40 L tank containing fully aerated seawater at 10°C (lumpfish) or 24°C
(red drum) and left overnight. The following morning, 𝑃𝑤𝑂2 was either maintained at normoxia or
acutely reduced to 100, 80, 67, 60, 40, or 21 mmHg (lumpfish) or 76, 47, 35, 23, or 11 mmHg (red
drum) by bubbling the reservoir supplying water to the chambers with nitrogen. The reduction in
𝑃𝑤𝑂2 took 5-30 min depending on the target 𝑃𝑤𝑂2, and this level (± 2.5 mmHg) was maintained
during the entire 𝐶𝑇𝑚𝑎𝑥 measurement by use of the solenoid system. Once the target 𝑃𝑤𝑂2 was
reached, the water temperature was elevated continuously at a rate of 2°C h-1 until the fish
exhibited loss of equilibrium (LOE). The temperature where LOE occurred was taken as 𝐶𝑇𝑚𝑎𝑥.
Due to the morphology of the lumpfish (flattened ventral surface), these fish did not necessarily
fall over at the point of LOE, and were therefore, gently prodded with a cotton swab at regular
intervals as 𝐶𝑇𝑚𝑎𝑥 was approached. The temperature where the fish no longer righted themselves
after being gently prodded was taken as 𝐶𝑇𝑚𝑎𝑥 for this species. Once 𝐶𝑇𝑚𝑎𝑥 was reached for
individual fish, they were removed from their chambers and returned to a recovery tank. No fish
were used more than once.
Both 𝑃𝑐𝑟𝑖𝑡 and the hypoxia induced reduction in AS increased with temperature from 10 to
16°C (lumpfish) (Fig. 2A, B) and from 24 to 30°C (red drum) (Fig. 2D, E). Therefore, the
percentage changes in AS at the 𝑃𝑤𝑂2 levels where 𝐶𝑇𝑚𝑎𝑥 was measured (see Fig. 2C, F) were
calculated, as described above, from the ��𝑂2 data at 16°C (lumpfish) or 30°C (red drum).
Consequently, the calculated percentage changes in AS are minimal (conservative) estimates (i.e.,
𝐶𝑇𝑚𝑎𝑥 occurred at temperatures higher than those for which the changes in AS were calculated,
meaning that AS would have been reduced even more at those temperatures).
𝑃𝐶𝑇𝑚𝑎𝑥 was determined from the 𝐶𝑇𝑚𝑎𝑥 data by fitting a piecewise, two-segmented linear
regression through the 𝐶𝑇𝑚𝑎𝑥 values not significantly different from 𝐶𝑇𝑚𝑎𝑥 in normoxia, and the
𝐶𝑇𝑚𝑎𝑥 values significantly different from 𝐶𝑇𝑚𝑎𝑥 in normoxia (see Fig. 3).
Statistical analyses
Student's t-tests were used to examine the effect of temperature on MMR, SMR, AS and 𝑃𝑐𝑟𝑖𝑡, as
well as the effect of hypoxia on MMR. All P-values were corrected for multiple comparisons using
Jour
nal o
f Exp
erim
enta
l Bio
logy
• A
dvan
ce a
rtic
le
false discovery rate (FDR) correction. FDR cutoff values were 0.0383 and 0.00802 for lumpfish
and red drum, respectively. One-way analysis of variance was used to test the effect of 𝑃𝑤𝑂2 on
𝐶𝑇𝑚𝑎𝑥. All assumptions of these statistical tests were met. Statistical analyses were conducted
using SigmaPlot (Systat Software, Inc., Chicago, IL, USA), and the significance level for all tests
was P < 0.05.
RESULTS
MMR decreased significantly in both lumpfish and red drum when exposed to hypoxia (P < 0.001
for both species and temperatures), and as a result, AS fell with water oxygen tension (𝑃𝑤𝑂2), as
expected, until the critical oxygen tension (𝑃𝑐𝑟𝑖𝑡) where AS was zero (Fig. 2A, B, D, E). At the
higher temperatures (16 vs. 10°C for lumpfish, 30 vs. 24°C for red drum), tolerance to hypoxia
was reduced (i.e., 𝑃𝑐𝑟𝑖𝑡 was significantly increased; P = 0.038 for lumpfish and P = 0.008 for red
drum) and the hypoxia-induced decline in AS was more pronounced (Fig. 2B, E vs. Fig. 2A, D).
However, 𝐶𝑇𝑚𝑎𝑥 did not show a gradual decrease with falling 𝑃𝑤𝑂2 (Fig. 2C, F). For lumpfish,
𝐶𝑇𝑚𝑎𝑥 was maintained at 21.9–22.3°C down to a 𝑃𝑤𝑂2 of 80 mmHg (P > 0.05), at which point AS
was reduced by at least 72% (Fig. 2A, B, C). At a 𝑃𝑤𝑂2 of 67 mmHg, slightly above the 𝑃𝑐𝑟𝑖𝑡 at
16°C (63.8 mmHg), 𝐶𝑇𝑚𝑎𝑥 was significantly reduced to 20.9°C (P < 0.05 compared to 𝐶𝑇𝑚𝑎𝑥 in
normoxia), and this reduction continued with decreasing 𝑃𝑤𝑂2 (Fig. 2C). For red drum, a similar
pattern was observed, with no significant change in 𝐶𝑇𝑚𝑎𝑥 (36.1–36.5 °C) down to a 𝑃𝑤𝑂2 of 47
mmHg (P > 0.05), despite AS being reduced by at least 89% (Fig. 2D, E, F). In red drum, the first
sign of reduced 𝐶𝑇𝑚𝑎𝑥 occurred at 35 mmHg (P < 0.05 compared to 𝐶𝑇𝑚𝑎𝑥 in normoxia), slightly
below the 𝑃𝑐𝑟𝑖𝑡 at 30°C (38 mmHg).
The oxygen limit for thermal tolerance (𝑃𝐶𝑇𝑚𝑎𝑥), as calculated from the 𝐶𝑇𝑚𝑎𝑥 data, was 72.2
mmHg for lumpfish (Fig. 3A) and 35.8 mmHg for red drum (Fig. 3B). These values were
significantly different (P < 0.001).
All results, including fish body masses, are presented as means with associated standard errors
in Table 1.
Jour
nal o
f Exp
erim
enta
l Bio
logy
• A
dvan
ce a
rtic
le
DISCUSSION
This study tested the hypothesis that the upper thermal limits of fishes are determined by
insufficient oxygen supply for vital physiological functions and, therefore, affected by oxygen
availability. More specifically, we tested the assumption that the fish’s critical thermal maximum
(𝐶𝑇𝑚𝑎𝑥) cannot be maintained under aquatic hypoxia where oxygen supply capacity (i.e., AS) is
reduced (cf. Fig. 1A, B). Contrary to this assumption, we found that the 𝐶𝑇𝑚𝑎𝑥 of both lumpfish
and red drum was independent of oxygen availability over a wide range of water oxygen levels. In
fact, the AS of lumpfish and red drum could be reduced by more than 72% and 89%, respectively,
before 𝐶𝑇𝑚𝑎𝑥 was affected (Fig. 2). This shows that the upper thermal limits of water-breathing
ectothermic animals are not always determined by oxygen supply capacity (cf. Fig. 1C, D).
In our experimental approach, we initially verified that MMR and AS were constrained in both
lumpfish and red drum as water oxygen tension (𝑃𝑤𝑂2) was lowered at a constant temperature,
both within (10°C for lumpfish, 24°C for red drum) and slightly above (16°C for lumpfish, 30°C
for red drum) the species’ typical temperature range (Fig. 2A, B, D, E). This was simply a proof
of concept, as the constraining effect of hypoxia on AS is a well-known phenomenon in fishes
(Claireaux and Chabot, 2016; Claireaux et al., 2000; Farrell and Richards, 2009; Fry, 1971;
Lefrancois and Claireaux, 2003). We then defined 𝐶𝑇𝑚𝑎𝑥 at water oxygen levels ranging from air-
saturation (normoxia) to below the fish’s critical oxygen tension (𝑃𝑐𝑟𝑖𝑡). In determining 𝐶𝑇𝑚𝑎𝑥, we
employed a 2°C h-1 warming protocol, which approximates the maximum heating rate that fish
experience under natural conditions (Fangue et al., 2011; Gamperl et al., 2002; Loong et al., 2005).
This rate is also similar to the rate of temperature change (1 to 4°C h-1) used in other key studies
investigating the role of oxygen limitations on the thermal tolerance of ectotherms (Eliason et al.,
2011; Frederich and Pörtner, 2000; Giomi et al., 2014; Giomi and Pörtner, 2013; Melzner et al.,
2006; Wittmann et al., 2008).
In lumpfish, the first sign of a reduced 𝐶𝑇𝑚𝑎𝑥 occurred slightly above 𝑃𝑐𝑟𝑖𝑡 at 16°C, whereas
in red drum, 𝐶𝑇𝑚𝑎𝑥 was not reduced until slightly below 𝑃𝑐𝑟𝑖𝑡 at 30°C (Fig. 2C, F). Furthermore,
the 𝑃𝐶𝑇𝑚𝑎𝑥 of lumpfish was closer to normoxia than the 𝑃𝐶𝑇𝑚𝑎𝑥
of red drum. Although the two
species were acclimated to different temperatures, as befit the species, these data indicate that the
lumpfish retained less oxygen supply capacity at 𝐶𝑇𝑚𝑎𝑥 in normoxia when compared to red drum.
It has been suggested that species occupying a wide thermal range (niche) have been evolutionarily
selected for a more thermally resistant cardiorespiratory system (Ern et al., 2014; Jost et al., 2012).
Jour
nal o
f Exp
erim
enta
l Bio
logy
• A
dvan
ce a
rtic
le
The differences in oxygen supply capacity at 𝐶𝑇𝑚𝑎𝑥, observed here for lumpfish and red drum,
may therefore be related to the ecology of the two species. The red drum is an athletic, free-
swimming, eurythermal species inhabiting environments such as estuaries and coastal swamps that
can fluctuate greatly in temperature over short temporal scales, whereas the lumpfish is a relatively
sluggish, cold-water species with a more thermally stable niche (it lives in the coastal zone and in
the open ocean). Despite these differences, the 𝐶𝑇𝑚𝑎𝑥 of both lumpfish and red drum decreased
when 𝑃𝑤𝑂2 levels fell below 80 and 47 mmHg, respectively, in accordance with the theory that
survival below 𝑃𝑐𝑟𝑖𝑡 is determined by the capacity for anaerobic metabolism, and is, therefore,
time-limited.
Our findings add to a series of recent studies that have suggested that upper thermal limits in a
number of water-breathing ectotherms are not determined by insufficient oxygen supply capacity.
These studies, performed on a range of species, have found that AS is maintained in normoxia at
environmentally-relevant temperature extremes (Ern et al., 2015; Gräns et al., 2014; Norin et al.,
2014), or showed that experimentally induced anaemia (internal hypoxia) had very little effect on
𝐶𝑇𝑚𝑎𝑥 (Brijs et al., 2015; Wang et al., 2014). The present study bridges these earlier studies, and
confirms their findings, by showing an uncoupling of AS and 𝐶𝑇𝑚𝑎𝑥 when fish are exposed to
environmental (ambient) hypoxia. Our findings are also supported by previous studies which have
reported reduced 𝐶𝑇𝑚𝑎𝑥 under severe hypoxia (Weatherley, 1970; Rutledge & Beitinger, 1989;
Ellis et al., 2013; Healy & Schulte, 2012) and maintained 𝐶𝑇𝑚𝑎𝑥 under moderate hypoxia
(Weatherley, 1970; Ellis et al., 2013). However, direct comparisons with our results are difficult
because these studies either only measured 𝐶𝑇𝑚𝑎𝑥 at one (Rutledge & Beitinger, 1989; Healy &
Schulte, 2012) or two (Weatherley, 1970; Ellis et al., 2013) levels of hypoxia, applied extremely
high rates of temperature increase (18-90°C h-1) (Weatherley, 1970; Rutledge & Beitinger, 1989;
Healy & Schulte, 2012), allowed 𝑃𝑤𝑂2 to drift from normoxia to hypoxia during measurements
(Ellis et al., 2013), or were performed on an air-breathing species with surface access (Rutledge &
Beitinger, 1989).
Based on the species-specific dependence of 𝐶𝑇𝑚𝑎𝑥 on oxygen availability observed here (i.e.,
red drum were more resilient to hypoxia than lumpfish), we propose a novel metric for classifying
the oxygen-dependent thermal sensitivity of different species; the oxygen limit for thermal
tolerance (𝑃𝐶𝑇𝑚𝑎𝑥). By measuring 𝐶𝑇𝑚𝑎𝑥 at a range of 𝑃𝑤𝑂2 levels from normoxia to below 𝑃𝑐𝑟𝑖𝑡,
an oxygen-dependent breakpoint can be established where 𝐶𝑇𝑚𝑎𝑥 is significantly affected by
Jour
nal o
f Exp
erim
enta
l Bio
logy
• A
dvan
ce a
rtic
le
hypoxia (Fig. 3A, B). Since 𝑃𝐶𝑇𝑚𝑎𝑥 defines the 𝑃𝑤𝑂2 below which the upper thermal limits of
water-breathing ectotherms becomes constrained, the breadth of the thermal niche under hypoxic
conditions will increase with the distance between 𝑃𝐶𝑇𝑚𝑎𝑥 and the 𝑃𝑤𝑂2 where AS starts to be
reduced by hypoxia. If the latitudinal distribution ranges of marine fishes are shaped by their upper
thermal limits (Sunday et al., 2012), then populations of species exhibiting oxygen-independent
upper thermal limits at environmentally relevant 𝑃𝑤𝑂2 levels should be more resilient to the
occurrence of environmental hypoxia and oxygen-poor ‘dead’ zones within their thermal niche. In
addition to assessing the oxygen sensitivity of upper thermal limits in water-breathing ectotherms,
and the susceptibility of their upper thermal niche boundaries to environmental hypoxia, we also
suggest that the 𝑃𝐶𝑇𝑚𝑎𝑥 metric can be used to assess the effects of anthropogenic pollutants and
other climate change related stressors (e.g., acidification and salinity changes) on the hypoxia
sensitivity of upper thermal limits.
In conclusion, the 𝐶𝑇𝑚𝑎𝑥 of lumpfish and red drum was unaffected by hypoxia exposure down
to 𝑃𝑤𝑂2 levels of 80 and 47 mmHg, respectively, despite more than 72 and 89% reductions in AS.
Thus, constrained oxygen supply capacity did not affect the 𝐶𝑇𝑚𝑎𝑥 of these species under
conditions of reduced oxygen availability that are routinely encountered by many fishes in the
wild. However, increases in the frequency and severity of aquatic hypoxia may cause some species
to experience 𝑃𝑤𝑂2 levels sufficiently low for 𝐶𝑇𝑚𝑎𝑥 to be reduced. The proposed 𝑃𝐶𝑇𝑚𝑎𝑥 metric
can help identify such vulnerable species. In general, our results show that oxygen and upper
thermal limits are not intimately linked, thus reinforcing the idea that there are other important
physiological constraints that determine the upper thermal limits of fishes.
Jour
nal o
f Exp
erim
enta
l Bio
logy
• A
dvan
ce a
rtic
le
Abbreviations
��O2: Oxygen consumption rate (mg O2 h
-1 kg-1)
MMR: Maximum metabolic rate (mg O2 h-1 kg-1)
SMR: Standard metabolic rate (mg O2 h-1 kg-1)
RMR: Routine metabolic rate (mg O2 h-1 kg-1)
AS: Aerobic scope (MMR − SMR) (mg O2 h-1 kg-1)
𝐶𝑇𝑚𝑎𝑥: Critical thermal maximum (°C)
𝐶𝑇𝑚𝑖𝑛: Critical thermal minimum (°C)
𝑇𝑐𝑟𝑖𝑡: Critical temperature (°C)
𝑃𝑤𝑂2: Water oxygen tension (mmHg)
𝑃𝑐𝑟𝑖𝑡: Critical oxygen tension (mmHg)
𝑃𝐶𝑇𝑚𝑎𝑥: Oxygen limit for thermal tolerance (mmHg)
Jour
nal o
f Exp
erim
enta
l Bio
logy
• A
dvan
ce a
rtic
le
Acknowledgements
The authors thank Dr. Keng Pee Ang (Cooke Aquaculture Inc.) and Mr. Danny Boyce (JBARB,
MUN) for providing the lumpfish used in this study.
Competing interests
The author declares no competing or financial interests.
Author's contributions
R.E., T.N., and A.J.E. conceived the study. All authors participated in aspects of experimental
design. R.E. and T.N. performed the experiments and collected the data. R.E., T.N., and A.J.E.
analysed and interpreted the data. R.E. and T.N. co-wrote the initial draft, and A.J.E. and A.K.G.
provided significant input with regards to revising the paper. All authors gave final approval for
publication.
Funding
We gratefully acknowledge financial support from the Natural Science Foundation grant to A.J.E.
(EF 1315290), from the Natural Sciences and Engineering Research Council of Canada (NSERC)
to A.K.G, and from the Carlsberg Foundation to R.E. through their Internationalisation Fellowship
program (CF15-0321). T.N. gratefully acknowledges financial support from the Danish Council
for Independent Research during the writing of this paper (Individual Post-doctoral Grant and
Sapere Aude Research Talent Grant; DFF-4181-00297).
Jour
nal o
f Exp
erim
enta
l Bio
logy
• A
dvan
ce a
rtic
le
References
Altieri, A. H. and Gedan, K. B. (2015). Climate change and dead zones. Global Change Biol. 21,
1395-1406.
Aquamaps.org. (2015). http://www.aquamaps.org.
Beitinger, T. L., Bennett, W. A. and McCauley, R. W. (2000). Temperature tolerances of North
American freshwater fishes exposed to dynamic changes in temperature. Environ. Biol. Fishes.
58, 237-275.
Brijs, J., Jutfelt, F., Clark, T. D., Grans, A., Ekstrom, A. and Sandblom, E. (2015).
Experimental manipulations of tissue oxygen supply do not affect warming tolerance of
European perch. J. Exp. Biol. 218, 2448-2454.
Claireaux, G. and Chabot, D. (2016). Responses by fishes to environmental hypoxia: integration
through Fry’s concept of aerobic metabolic scope. J. Fish Biol. 88, 232–251.
Claireaux, G., Webber, D. M., Lagardere, J. P. and Kerr, S. R. (2000). Influence of water
temperature and oxygenation on the aerobic metabolic scope of Atlantic cod (Gadus morhua).
J. Sea. Res. 44, 257-265.
Clark, T. D., Sandblom, E. and Jutfelt, F. (2013a). Aerobic scope measurements of fishes in an
era of climate change: respirometry, relevance and recommendations. J. Exp. Biol. 216, 2771-
2782.
Diaz, R. J. and Rosenberg, R. (2008). Spreading dead zones and consequences for marine
ecosystems. Science 321, 926-929.
Eliason, E. J., Clark, T. D., Hague, M. J., Hanson, L. M., Gallagher, Z. S., Jeffries, K. M.,
Gale, M. K., Patterson, D. A., Hinch, S. G. and Farrell, A. P. (2011). Differences in thermal
tolerance among sockeye salmon populations. Science 332, 109-112.
Ellis, L. E., Sacobie, C. F. D., Kieffer, J. D. and Benfey, T. J. (2013). The effects of dissolved
oxygen and triploidy on critical thermal maximum in brook charr (Salvelinus fontinalis). Comp.
Biochem. Physiol. A. 166, 426-33.
Ern, R., Huong, D. T. T., Phuong, N. T., Madsen, P. T., Wang, T. and Bayley, M. (2015).
Some like it hot: Thermal tolerance and oxygen supply capacity in two eurythermal crustaceans.
Sci. Rep. 5, 10743.
Ern, R., Huong, D. T. T., Phuong, N. T., Wang, T. and Bayley, M. (2014 ). Oxygen delivery
does not limit thermal tolerance in a tropical eurythermal crustacean. J. Exp. Biol. 217, 809-814.
Jour
nal o
f Exp
erim
enta
l Bio
logy
• A
dvan
ce a
rtic
le
Fangue, N. A., Osborne, E. J., Todgham, A. E. and Schulte, P. M. (2011). The onset
temperature of the heat-shock response and whole-organism thermal tolerance are tightly
correlated in both laboratory-acclimated and field-acclimatized tidepool sculpins (Oligocottus
maculosus). Physiol. Biochem. Zool. 84, 341-352.
Farrell, A. P. (2016). Pragmatic perspectives on aerobic scope: peaking, plummeting, pejus and
apportioning. J. Fish Biol. 88, 322-343.
Farrell, A. P., Eliason, E. J., Sandblom, E. and Clark, T. D. (2009). Fish cardiorespiratory
physiology in an era of climate change. Can. J. Zool. 87, 835-851.
Farrell, A. P., Richards, J. G. (2009). Defining hypoxia: An integrative synthesis of the responses
of fish to hypoxia. In Fish physiology (eds. Farrell, A. P., Richards, J. G., Brauner, C. J.), pp.
487-503. London: Academic Press.
Frederich, M. and Pörtner, H.-O. (2000). Oxygen limitation of thermal tolerance defined by
cardiac and ventilatory performance in spider crab, Maja squinado. Am. J. Physiol. Regul. Integr.
Comp. Physiol. 279, R1531-R1538.
Fry, F. E. J. (1971). The effect of environmental factors on the physiology of fish. In Fish
physiology (eds. Hoar, W. S., Randall, D. J.), pp. 1-98. London: Academic Press.
Gamperl, A. K., Rodnick, K. J., Faust, H. A., Venn, E. C., Bennett, M. T., Crawshaw, L. I.,
Keeley, E. R., Powell, M. S. and Li, H. W. (2002). Metabolism, swimming performance, and
tissue biochemistry of high desert redband trout (Oncorhynchus mykiss ssp.): Evidence for
phenotypic differences in physiological function. Physiol. Biochem. Zool. 75, 413-431.
Giomi, F., Fusi, M., Barausse, A., Mostert, B., Pörtner, H.-O. and Cannicci, S. (2014).
Improved heat tolerance in air drives the recurrent evolution of air-breathing. Proc. R. Soc. Lond.
Ser. B. Biol. sci. 281.
Giomi, F. and Pörtner, H.-O. (2013). A role for haemolymph oxygen capacity in heat tolerance
of eurythermal crabs. Front. Physiol. 4, 110.
Grans, A., Jutfelt, F., Sandblom, E., Jonsson, E., Wiklander, K., Seth, H., Olsson, C., Dupont,
S., Ortega-Martinez, O., Einarsdottir, I. et al. (2014). Aerobic scope fails to explain the
detrimental effects on growth resulting from warming and elevated CO2 in Atlantic halibut. J.
Exp. Biol. 217, 711-717.
Jour
nal o
f Exp
erim
enta
l Bio
logy
• A
dvan
ce a
rtic
le
Healy, T. M. and Schulte, P. M. (2012). Thermal acclimation is not necessary to maintain a wide
thermal breadth of aerobic ccope in the common killifish (Fundulus heteroclitus). Physiol.
Biochem. Zool. 85, 107-119.
Johansen, J. L., Steffensen, J. F. and Jones, G. P. (2015). Winter temperatures decrease
swimming performance and limit distributions of tropical damselfishes. Conserv. Physiol. 3,
cov039.
Jost, J. A., Podolski, S. M. and Frederich, M. (2012). Enhancing thermal tolerance by
eliminating the pejus range: a comparative study with three decapod crustaceans. Mar. Ecol.
Prog. Ser. 444, 263-274.
Lefrancois, C. and Claireaux, G. (2003). Influence of ambient oxygenation and temperature on
metabolic scope and scope for heart rate in the common sole Solea solea. Mar. Ecol. Prog. Ser.
259, 273-284.
Loong, D., Butler, B., Burrows, D., Davies, A. and Faithful, J. (2005). Limnological assessment
and benchmarking of key sentinel wetlands in the burdekin catchment, north Queensland, Report
no 05/09. Townsville, Queensland: Australian Centre for Tropical Freshwater Research, James
Cook University.
Magozzi, S. and Calosi, P. (2015). Integrating metabolic performance, thermal tolerance, and
plasticity enables for more accurate predictions on species vulnerability to acute and chronic
effects of global warming. Global Change Biol. 21, 181-194.
Mark, F. C., Bock, C. and Pörtner, H.-O. (2002). Oxygen-limited thermal tolerance in Antarctic
fish investigated by MRI and P-31-MRS. Am. J. Physiol. Regul. Integr. Comp. Physiol. 283,
R1254-R1262.
Melzner, F., Bock, C. and Pörtner, H.-O. (2006). Temperature-dependent oxygen extraction
from the ventilatory current and the costs of ventilation in the cephalopod Sepia officinalis. J.
Comp. Physiol. B 176, 607-621.
Norin, T., Malte, H. and Clark, T. D. (2014). Aerobic scope does not predict the performance of
a tropical eurythermal fish at elevated temperatures. J. Exp. Biol. 217, 244-251.
Pörtner, H.-O. (2010). Oxygen- and capacity-limitation of thermal tolerance: a matrix for
integrating climate-related stressor effects in marine ecosystems. J. Exp. Biol. 213, 881-893.
Pörtner, H.-O. and Knust, R. (2007). Climate change affects marine fishes through the oxygen
limitation of thermal tolerance. Science 315, 95-97.
Jour
nal o
f Exp
erim
enta
l Bio
logy
• A
dvan
ce a
rtic
le
Pörtner, H.-O., D.M. Karl, P.W. Boyd,W.W.L. Cheung, S.E. Lluch-Cota, Y. Nojiri, D.N.
Schmidt, and P.O. Zavialov (2014b): Ocean systems. In: Climate Change 2014: Impacts,
Adaptation, and Vulnerability. Part A: Global and Sectoral Aspects. Contribution of Working
Group II to the Fifth Assessment Report of the Intergovernmental Panel on Climate Change
[Field, C.B., V.R. Barros, D.J. Dokken, K.J. Mach, M.D. Mastrandrea, T.E. Bilir, M. Chatterjee,
K.L. Ebi, Y.O. Estrada, R.C. Genova, B. Girma, E.S. Kissel, A.N. Levy, S. MacCracken, P.R.
Mastrandrea, and L.L.White (eds.)]. Cambridge University Press, Cambridge, United Kingdom
and New York, NY, USA, pp. 411-484.
Rutledge, C. J. and Beitinger, T. L. (1989). The effects of dissolved-oxygen and aquatic surface
respiration on the critical thermal maxima of 3 intermittent-stream fishes. Environ. Biol. Fish
24, 137-143.
Somero, G. N. (2010). The physiology of climate change: how potentials for acclimatization and
genetic adaptaition will determine ‘winners’ and ‘losers’. J. Exp. Biol. 213, 912-920.
Steffensen, J. F. (1989). Some errors in respirometry of aquatic breathers - how to avoid and
correct for them. Fish. Physiol. Biochem. 6, 49-59.
Sunday, J. M., Bates, A. E. and Dulvy, N. K. (2011). Global analysis of thermal tolerance and
latitude in ectotherms. Proc. R. Soc. B 278, 1823-1830.
Sunday, J. M., Bates, A. E. and Dulvy, N. K. (2012). Thermal tolerance and the global
redistribution of animals. Nat. Clim. Change 2, 686-690.
Terblanche, J. S., Hoffmann, A. A., Mitchell, K. A., Rako, L., le Roux, P. C. and Chown, S.
L. (2011). Ecologically relevant measures of tolerance to potentially lethal temperatures. J. Exp.
Biol. 214, 3713-3725.
Vinagre, C., Leal, I., Mendonça, V., Madeira, D., Narciso, L., Diniz, M. S. and Flores, A. A.
V. (2016). Vulnerability to climate warming and acclimation capacity of tropical and temperate
coastal organisms. Ecol. Indic. 62, 317-327.
Wang, T., Lefevre, S., Iversen, N. K., Findorf, I., Buchanan, R. and McKenzie, D. J. (2014).
Anaemia only causes a small reduction in the upper critical temperature of sea bass: is oxygen
delivery the limiting factor for tolerance of acute warming in fishes? J. Exp. Biol. 217, 4275-
4278.
Weatherley, A. H. (1970). Effects of superabundant oxygen on thermal tolerance of goldfish.
Biol. Bull. 139, 229.
Jour
nal o
f Exp
erim
enta
l Bio
logy
• A
dvan
ce a
rtic
le
Wittmann, A. C., Schroer, M., Bock, C., Steeger, H. U., Paul, R. J. and Pörtner, H.-O. (2008).
Indicators of oxygen- and capacity-limited thermal tolerance in the lugworm Arenicola marina.
Clim. Res. 37, 227-240.
Jour
nal o
f Exp
erim
enta
l Bio
logy
• A
dvan
ce a
rtic
le
Figures
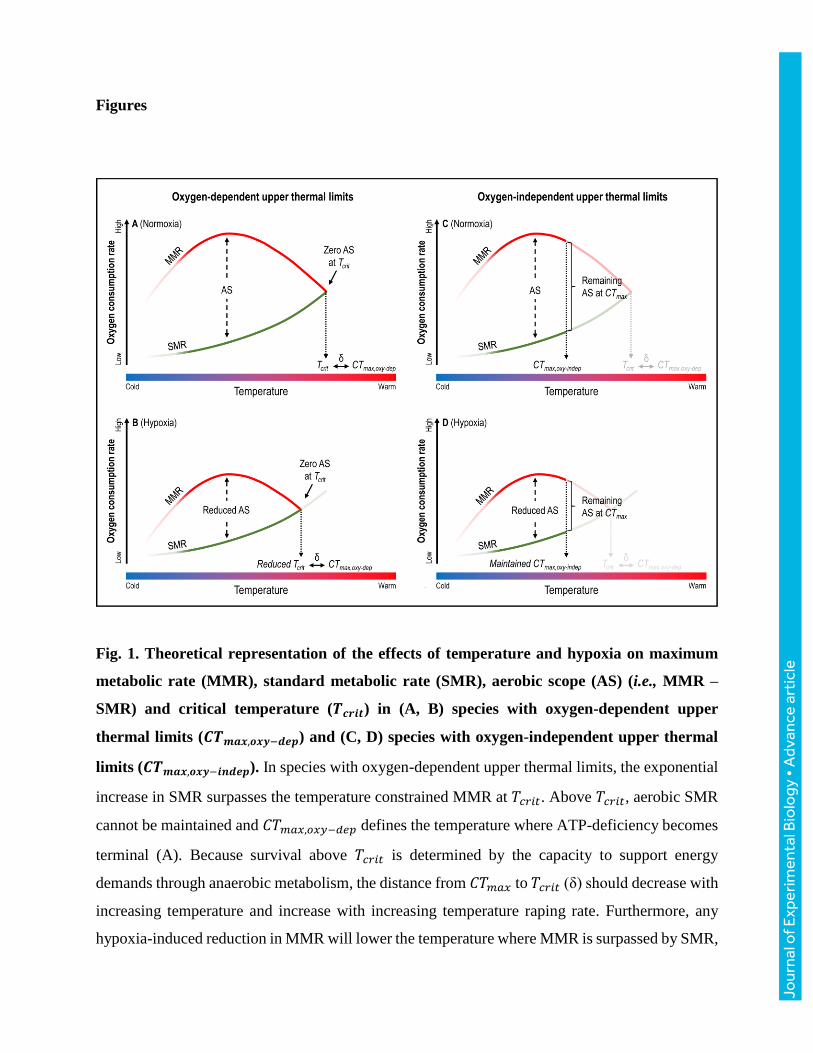
Fig. 1. Theoretical representation of the effects of temperature and hypoxia on maximum
metabolic rate (MMR), standard metabolic rate (SMR), aerobic scope (AS) (i.e., MMR –
SMR) and critical temperature (𝑻𝒄𝒓𝒊𝒕) in (A, B) species with oxygen-dependent upper
thermal limits (𝑪𝑻𝒎𝒂𝒙,𝒐𝒙𝒚−𝒅𝒆𝒑) and (C, D) species with oxygen-independent upper thermal
limits (𝑪𝑻𝒎𝒂𝒙,𝒐𝒙𝒚−𝒊𝒏𝒅𝒆𝒑). In species with oxygen-dependent upper thermal limits, the exponential
increase in SMR surpasses the temperature constrained MMR at 𝑇𝑐𝑟𝑖𝑡. Above 𝑇𝑐𝑟𝑖𝑡, aerobic SMR
cannot be maintained and 𝐶𝑇𝑚𝑎𝑥,𝑜𝑥𝑦−𝑑𝑒𝑝 defines the temperature where ATP-deficiency becomes
terminal (A). Because survival above 𝑇𝑐𝑟𝑖𝑡 is determined by the capacity to support energy
demands through anaerobic metabolism, the distance from 𝐶𝑇𝑚𝑎𝑥 to 𝑇𝑐𝑟𝑖𝑡 (δ) should decrease with
increasing temperature and increase with increasing temperature raping rate. Furthermore, any
hypoxia-induced reduction in MMR will lower the temperature where MMR is surpassed by SMR,
Jour
nal o
f Exp
erim
enta
l Bio
logy
• A
dvan
ce a
rtic
le
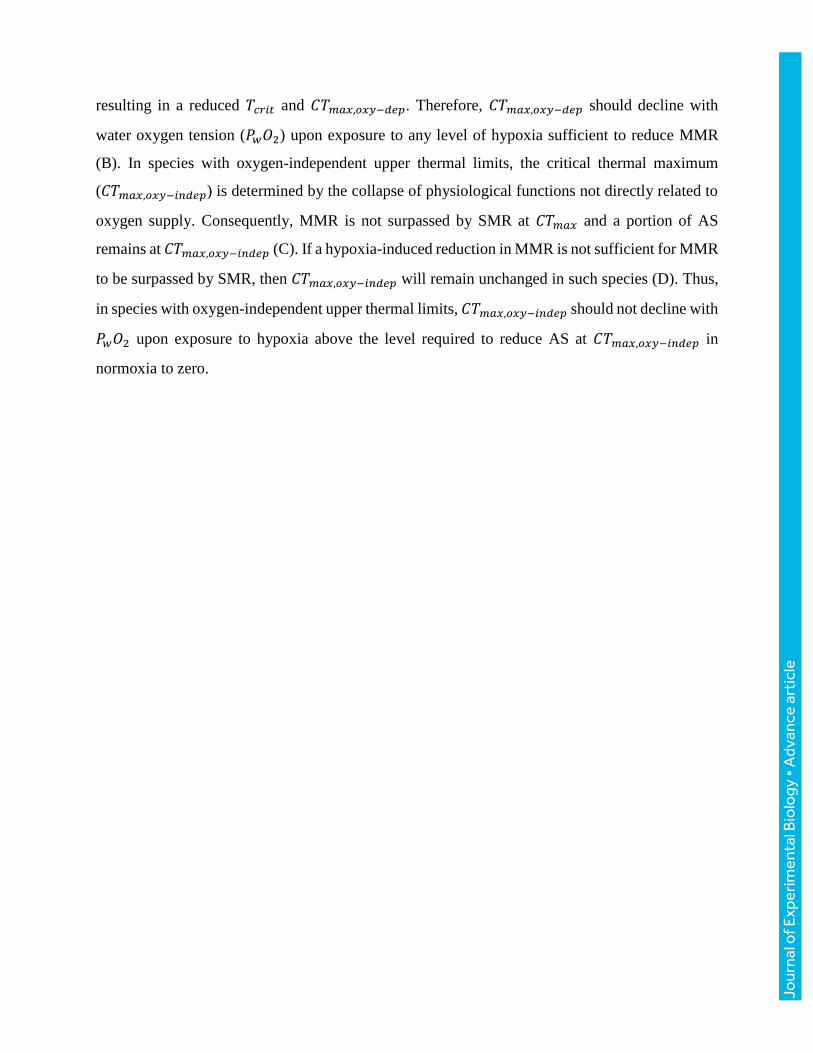
resulting in a reduced 𝑇𝑐𝑟𝑖𝑡 and 𝐶𝑇𝑚𝑎𝑥,𝑜𝑥𝑦−𝑑𝑒𝑝. Therefore, 𝐶𝑇𝑚𝑎𝑥,𝑜𝑥𝑦−𝑑𝑒𝑝 should decline with
water oxygen tension (𝑃𝑤𝑂2) upon exposure to any level of hypoxia sufficient to reduce MMR
(B). In species with oxygen-independent upper thermal limits, the critical thermal maximum
(𝐶𝑇𝑚𝑎𝑥,𝑜𝑥𝑦−𝑖𝑛𝑑𝑒𝑝) is determined by the collapse of physiological functions not directly related to
oxygen supply. Consequently, MMR is not surpassed by SMR at 𝐶𝑇𝑚𝑎𝑥 and a portion of AS
remains at 𝐶𝑇𝑚𝑎𝑥,𝑜𝑥𝑦−𝑖𝑛𝑑𝑒𝑝 (C). If a hypoxia-induced reduction in MMR is not sufficient for MMR
to be surpassed by SMR, then 𝐶𝑇𝑚𝑎𝑥,𝑜𝑥𝑦−𝑖𝑛𝑑𝑒𝑝 will remain unchanged in such species (D). Thus,
in species with oxygen-independent upper thermal limits, 𝐶𝑇𝑚𝑎𝑥,𝑜𝑥𝑦−𝑖𝑛𝑑𝑒𝑝 should not decline with
𝑃𝑤𝑂2 upon exposure to hypoxia above the level required to reduce AS at 𝐶𝑇𝑚𝑎𝑥,𝑜𝑥𝑦−𝑖𝑛𝑑𝑒𝑝 in
normoxia to zero.
Jour
nal o
f Exp
erim
enta
l Bio
logy
• A
dvan
ce a
rtic
le
Jour
nal o
f Exp
erim
enta
l Bio
logy
• A
dvan
ce a
rtic
le
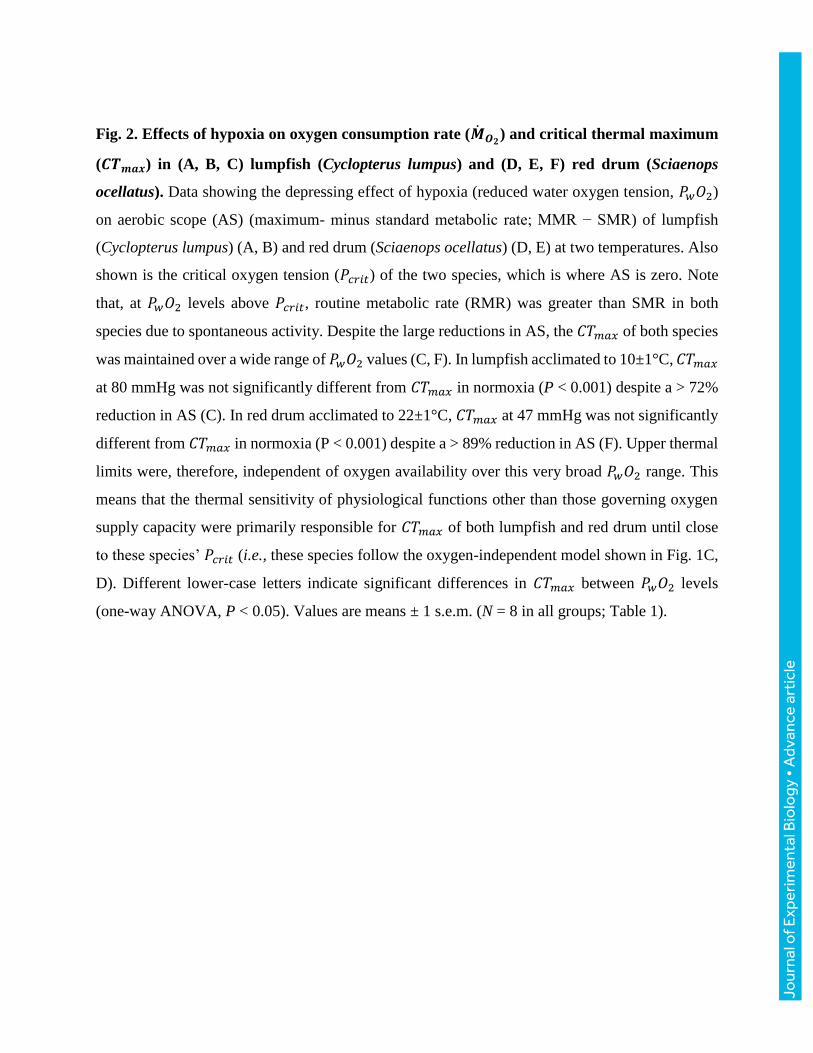
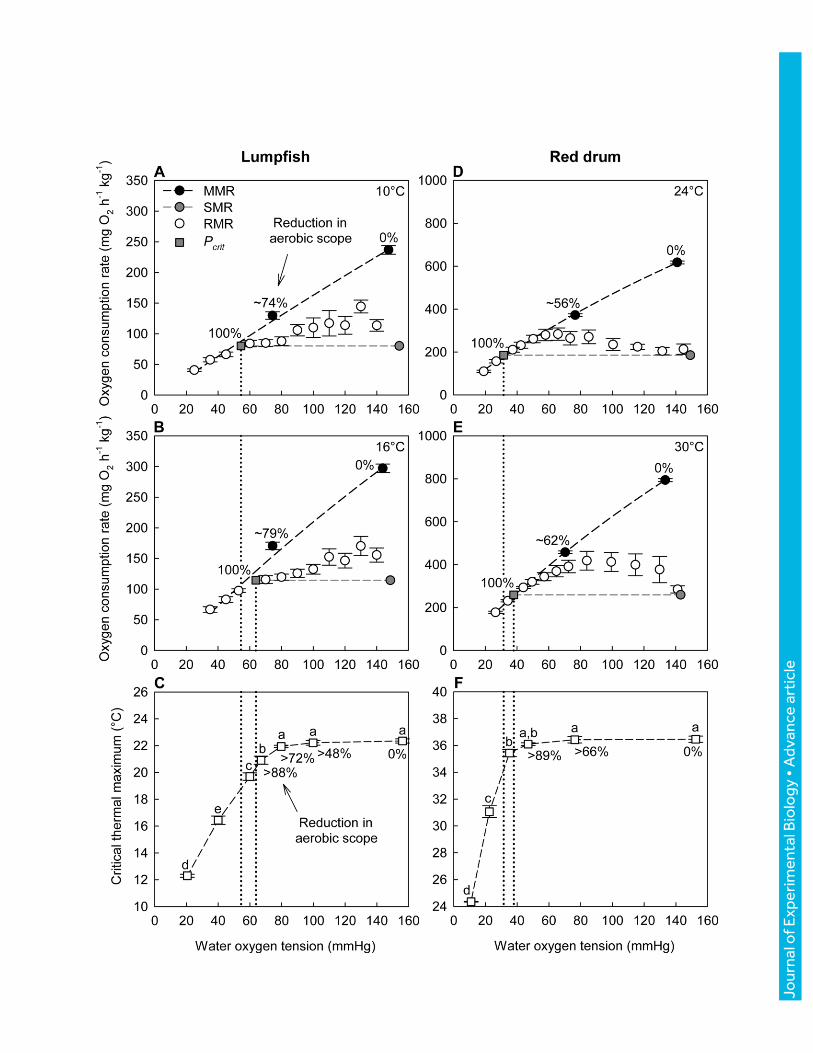
Fig. 2. Effects of hypoxia on oxygen consumption rate (��𝑶𝟐) and critical thermal maximum
(𝑪𝑻𝒎𝒂𝒙) in (A, B, C) lumpfish (Cyclopterus lumpus) and (D, E, F) red drum (Sciaenops
ocellatus). Data showing the depressing effect of hypoxia (reduced water oxygen tension, 𝑃𝑤𝑂2)
on aerobic scope (AS) (maximum- minus standard metabolic rate; MMR − SMR) of lumpfish
(Cyclopterus lumpus) (A, B) and red drum (Sciaenops ocellatus) (D, E) at two temperatures. Also
shown is the critical oxygen tension (𝑃𝑐𝑟𝑖𝑡) of the two species, which is where AS is zero. Note
that, at 𝑃𝑤𝑂2 levels above 𝑃𝑐𝑟𝑖𝑡, routine metabolic rate (RMR) was greater than SMR in both
species due to spontaneous activity. Despite the large reductions in AS, the 𝐶𝑇𝑚𝑎𝑥 of both species
was maintained over a wide range of 𝑃𝑤𝑂2 values (C, F). In lumpfish acclimated to 10±1°C, 𝐶𝑇𝑚𝑎𝑥
at 80 mmHg was not significantly different from 𝐶𝑇𝑚𝑎𝑥 in normoxia (P < 0.001) despite a > 72%
reduction in AS (C). In red drum acclimated to 22±1°C, 𝐶𝑇𝑚𝑎𝑥 at 47 mmHg was not significantly
different from 𝐶𝑇𝑚𝑎𝑥 in normoxia (P < 0.001) despite a > 89% reduction in AS (F). Upper thermal
limits were, therefore, independent of oxygen availability over this very broad 𝑃𝑤𝑂2 range. This
means that the thermal sensitivity of physiological functions other than those governing oxygen
supply capacity were primarily responsible for 𝐶𝑇𝑚𝑎𝑥 of both lumpfish and red drum until close
to these species’ 𝑃𝑐𝑟𝑖𝑡 (i.e., these species follow the oxygen-independent model shown in Fig. 1C,
D). Different lower-case letters indicate significant differences in 𝐶𝑇𝑚𝑎𝑥 between 𝑃𝑤𝑂2 levels
(one-way ANOVA, P < 0.05). Values are means ± 1 s.e.m. (N = 8 in all groups; Table 1).
Jour
nal o
f Exp
erim
enta
l Bio
logy
• A
dvan
ce a
rtic
le
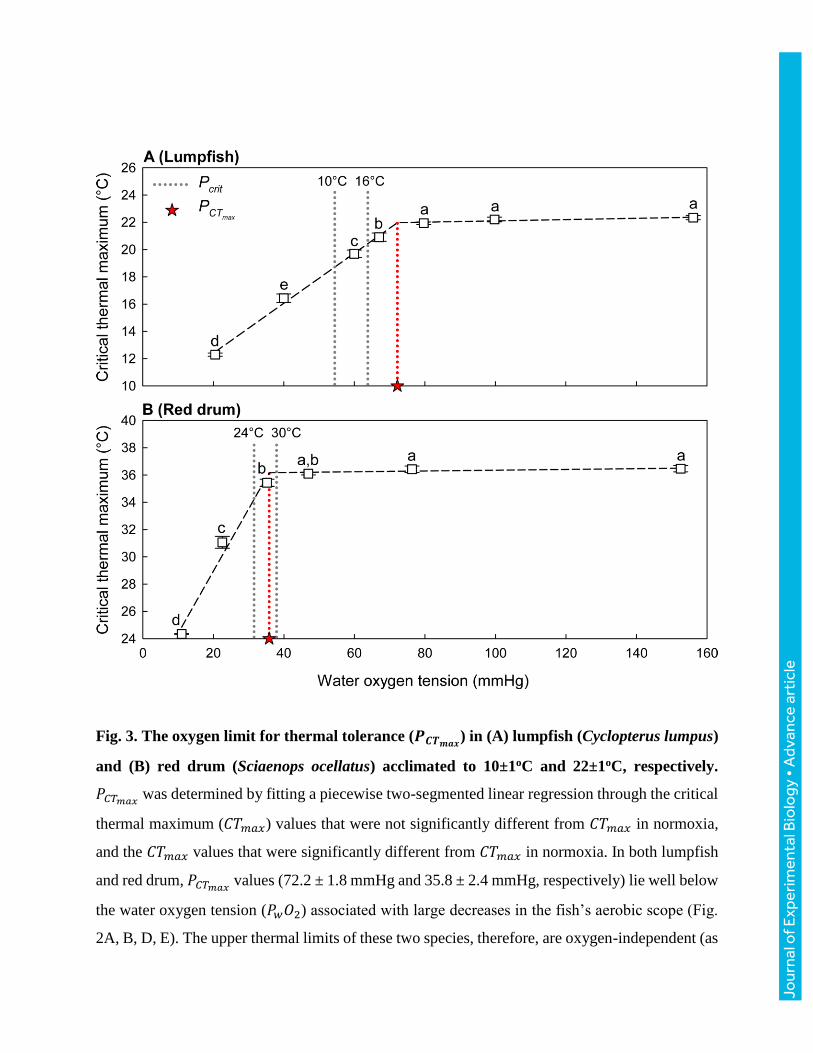
Fig. 3. The oxygen limit for thermal tolerance (𝑷𝑪𝑻𝒎𝒂𝒙) in (A) lumpfish (Cyclopterus lumpus)
and (B) red drum (Sciaenops ocellatus) acclimated to 10±1oC and 22±1oC, respectively.
𝑃𝐶𝑇𝑚𝑎𝑥 was determined by fitting a piecewise two-segmented linear regression through the critical
thermal maximum (𝐶𝑇𝑚𝑎𝑥) values that were not significantly different from 𝐶𝑇𝑚𝑎𝑥 in normoxia,
and the 𝐶𝑇𝑚𝑎𝑥 values that were significantly different from 𝐶𝑇𝑚𝑎𝑥 in normoxia. In both lumpfish
and red drum, 𝑃𝐶𝑇𝑚𝑎𝑥 values (72.2 ± 1.8 mmHg and 35.8 ± 2.4 mmHg, respectively) lie well below
the water oxygen tension (𝑃𝑤𝑂2) associated with large decreases in the fish’s aerobic scope (Fig.
2A, B, D, E). The upper thermal limits of these two species, therefore, are oxygen-independent (as
Jour
nal o
f Exp
erim
enta
l Bio
logy
• A
dvan
ce a
rtic
le

illustrated in Fig. 1C, D) across a wide range of environmental hypoxia. Different letters indicate
significant differences between 𝑃𝑤𝑂2 levels (one-way ANOVA, P < 0.05). Values are means ± 1
s.e.m. (N = 8 in all groups; Table 1). The critical oxygen tensions (𝑃𝑐𝑟𝑖𝑡) of lumpfish and red drum
(cf. Fig. 2) are included for reference.
Jour
nal o
f Exp
erim
enta
l Bio
logy
• A
dvan
ce a
rtic
le
Table
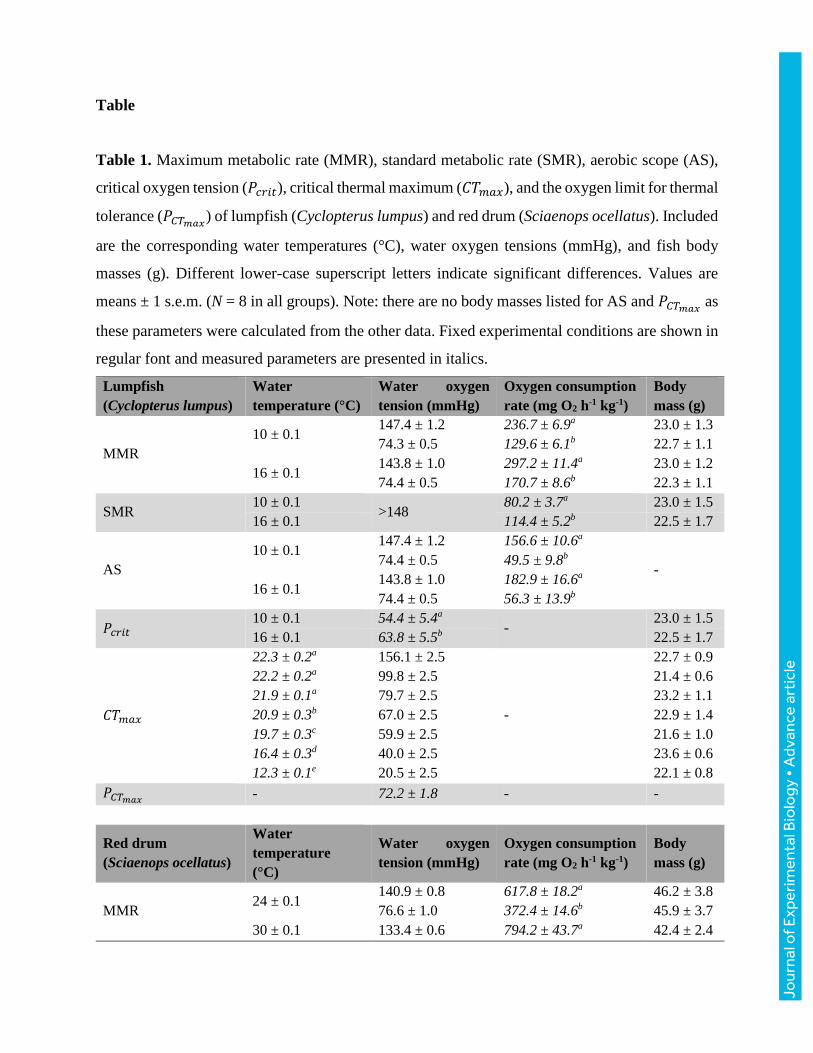
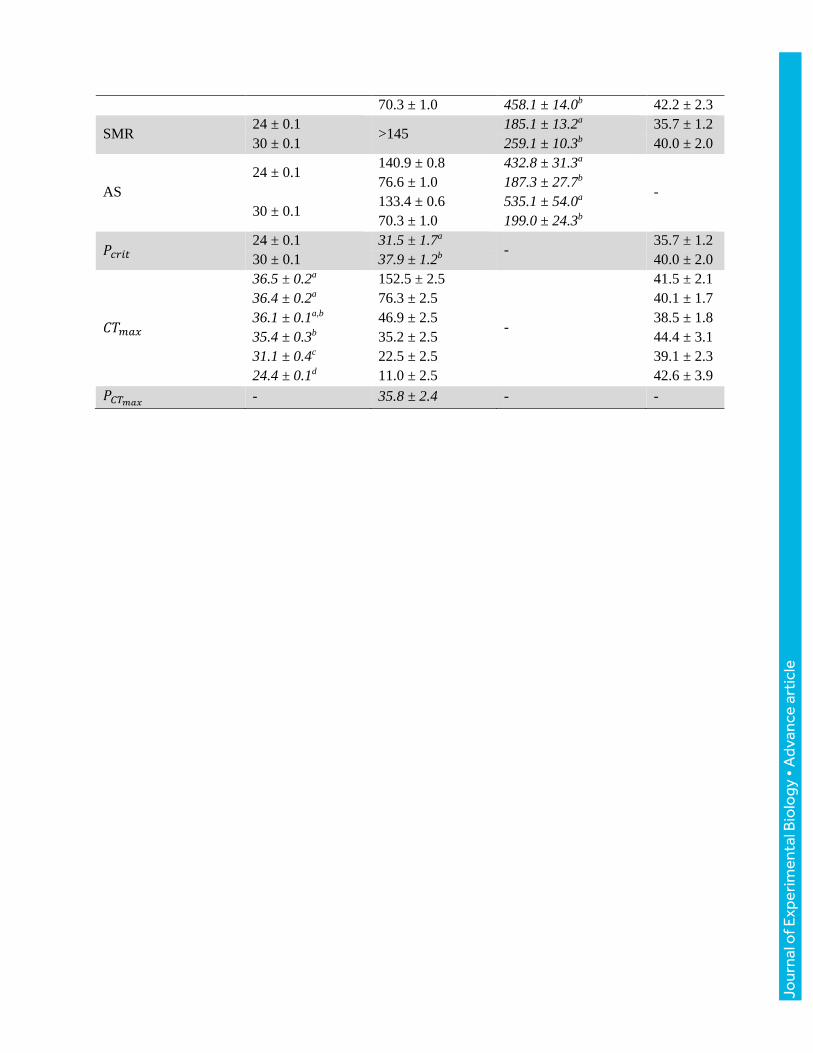
Table 1. Maximum metabolic rate (MMR), standard metabolic rate (SMR), aerobic scope (AS),
critical oxygen tension (𝑃𝑐𝑟𝑖𝑡), critical thermal maximum (𝐶𝑇𝑚𝑎𝑥), and the oxygen limit for thermal
tolerance (𝑃𝐶𝑇𝑚𝑎𝑥) of lumpfish (Cyclopterus lumpus) and red drum (Sciaenops ocellatus). Included
are the corresponding water temperatures (°C), water oxygen tensions (mmHg), and fish body
masses (g). Different lower-case superscript letters indicate significant differences. Values are
means ± 1 s.e.m. (N = 8 in all groups). Note: there are no body masses listed for AS and 𝑃𝐶𝑇𝑚𝑎𝑥 as
these parameters were calculated from the other data. Fixed experimental conditions are shown in
regular font and measured parameters are presented in italics.
Lumpfish
(Cyclopterus lumpus)
Water
temperature (°C)
Water oxygen
tension (mmHg)
Oxygen consumption
rate (mg O2 h-1 kg-1)
Body
mass (g)
MMR
10 ± 0.1 147.4 ± 1.2 236.7 ± 6.9a 23.0 ± 1.3
74.3 ± 0.5 129.6 ± 6.1b 22.7 ± 1.1
16 ± 0.1 143.8 ± 1.0 297.2 ± 11.4a 23.0 ± 1.2
74.4 ± 0.5 170.7 ± 8.6b 22.3 ± 1.1
SMR 10 ± 0.1
>148 80.2 ± 3.7a 23.0 ± 1.5
16 ± 0.1 114.4 ± 5.2b 22.5 ± 1.7
AS
10 ± 0.1 147.4 ± 1.2 156.6 ± 10.6a
- 74.4 ± 0.5 49.5 ± 9.8b
16 ± 0.1 143.8 ± 1.0 182.9 ± 16.6a
74.4 ± 0.5 56.3 ± 13.9b
𝑃𝑐𝑟𝑖𝑡 10 ± 0.1 54.4 ± 5.4a
- 23.0 ± 1.5
16 ± 0.1 63.8 ± 5.5b 22.5 ± 1.7
𝐶𝑇𝑚𝑎𝑥
22.3 ± 0.2a 156.1 ± 2.5
-
22.7 ± 0.9
22.2 ± 0.2a 99.8 ± 2.5 21.4 ± 0.6
21.9 ± 0.1a 79.7 ± 2.5 23.2 ± 1.1
20.9 ± 0.3b 67.0 ± 2.5 22.9 ± 1.4
19.7 ± 0.3c 59.9 ± 2.5 21.6 ± 1.0
16.4 ± 0.3d 40.0 ± 2.5 23.6 ± 0.6
12.3 ± 0.1e 20.5 ± 2.5 22.1 ± 0.8
𝑃𝐶𝑇𝑚𝑎𝑥 - 72.2 ± 1.8 - -
Red drum
(Sciaenops ocellatus)
Water
temperature
(°C)
Water oxygen
tension (mmHg)
Oxygen consumption
rate (mg O2 h-1 kg-1)
Body
mass (g)
MMR 24 ± 0.1
140.9 ± 0.8 617.8 ± 18.2a 46.2 ± 3.8
76.6 ± 1.0 372.4 ± 14.6b 45.9 ± 3.7
30 ± 0.1 133.4 ± 0.6 794.2 ± 43.7a 42.4 ± 2.4
Jour
nal o
f Exp
erim
enta
l Bio
logy
• A
dvan
ce a
rtic
le
70.3 ± 1.0 458.1 ± 14.0b 42.2 ± 2.3
SMR 24 ± 0.1
>145 185.1 ± 13.2a 35.7 ± 1.2
30 ± 0.1 259.1 ± 10.3b 40.0 ± 2.0
AS
24 ± 0.1 140.9 ± 0.8 432.8 ± 31.3a
- 76.6 ± 1.0 187.3 ± 27.7b
30 ± 0.1 133.4 ± 0.6 535.1 ± 54.0a
70.3 ± 1.0 199.0 ± 24.3b
𝑃𝑐𝑟𝑖𝑡 24 ± 0.1 31.5 ± 1.7a
- 35.7 ± 1.2
30 ± 0.1 37.9 ± 1.2b 40.0 ± 2.0
𝐶𝑇𝑚𝑎𝑥
36.5 ± 0.2a 152.5 ± 2.5
-
41.5 ± 2.1
36.4 ± 0.2a 76.3 ± 2.5 40.1 ± 1.7
36.1 ± 0.1a,b 46.9 ± 2.5 38.5 ± 1.8
35.4 ± 0.3b 35.2 ± 2.5 44.4 ± 3.1
31.1 ± 0.4c 22.5 ± 2.5 39.1 ± 2.3
24.4 ± 0.1d 11.0 ± 2.5 42.6 ± 3.9
𝑃𝐶𝑇𝑚𝑎𝑥 - 35.8 ± 2.4 - -
Jour
nal o
f Exp
erim
enta
l Bio
logy
• A
dvan
ce a
rtic
le


