
Overview of IDEAS modellingIntegrated Dynamic Environmental Assessment System
Presenters:
John Dymond Anthony Cole
Oscar Montes de Oca Munguia(Landcare Research)
Ben Knight (Cawthron Institute)

Triple bottom-line approach
Economy Society
Environment
spatial land and marine sector activity (gross
output and gross margin)
watercarbon
nitrogensediment
pollutants
spatial mass-energy flows
spatial demographicssettlementsland ownership
jobs

IDEAS helps facilitate catchment planning
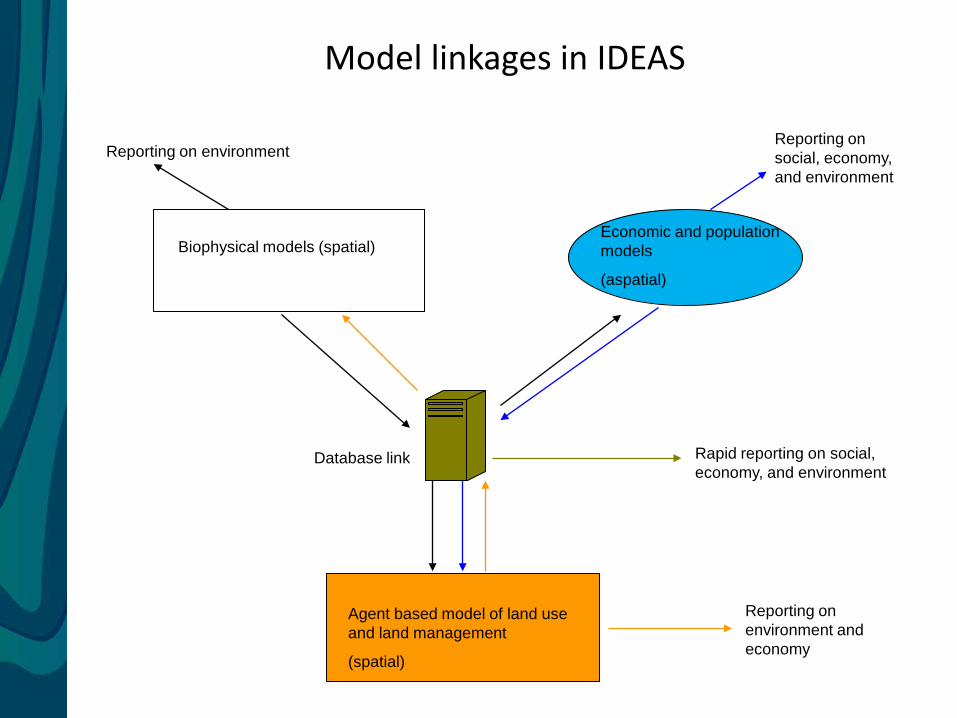
Biophysical models (spatial)Economic and population models
(aspatial)
Agent based model of land use and land management
(spatial)
Rapid reporting on social, economy, and environment
Reporting on social, economy, and environment
Reporting on environment and economy
Model linkages in IDEAS
Database link
Reporting on environment
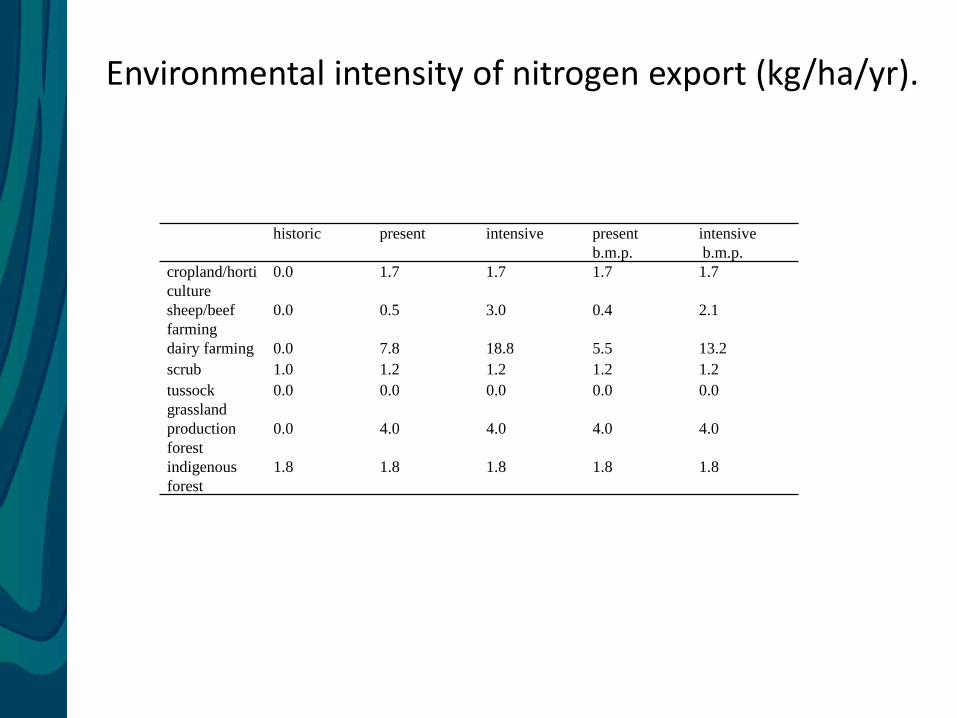
historic present intensive present b.m.p.
intensiveb.m.p.
cropland/horticulture
0.0 1.7 1.7 1.7 1.7
sheep/beef farming
0.0 0.5 3.0 0.4 2.1
dairy farming 0.0 7.8 18.8 5.5 13.2scrub 1.0 1.2 1.2 1.2 1.2tussock grassland
0.0 0.0 0.0 0.0 0.0
production forest
0.0 4.0 4.0 4.0 4.0
indigenous forest
1.8 1.8 1.8 1.8 1.8
Environmental intensity of nitrogen export (kg/ha/yr).

Natural – Present – Intensive land use scenarios

Intensive land usesocio-economic outcomes
Socio_economic performance
0
500000
1000000
1500000
2000000
2500000
3000000
Agricultural job numbers(FTE*1000)
Gross output ($100/yr) -land and marine
Marine job numbers(FTE*1000)
Gross margin ($100/yr) -land and marine
historic
present
intensive

Intensive land useenvironmental outcomes
-1000000.0
-500000.0
0.0
500000.0
1000000.0
1500000.0
Low flow -max. water
take -(l/minute)
Nitrogen load in river (kg/yr)
Sediment yield (tonnes/yr)
Area of natural ecosystems
(ha)
Carbon sink rate (t/yr) -land and marine
Net nitrogen yield to marine
(kg/yr)
E.coli/100litres exceeded 5%
of time
Trout numbers (no/1000 km)
Environmental performance
historicpresentintensive

Best management practice
Socio-economic performance
0
200000
400000
600000
800000
1000000
1200000
1400000
Agricultural job numbers(FTE*1000)
Gross output ($100/yr) - landand marine
Marine job numbers(FTE*1000)
Gross margin ($100/yr) - landand marine
historicpresentbmp_present

Best management practice
0.0
100000.0
200000.0
300000.0
400000.0
500000.0
600000.0
Low flow -max. water
take -(l/minute)
Nitrogen load in river (kg/yr)
Sediment yield (tonnes/yr)
Area of natural ecosystems
(ha)
Carbon sink rate (t/yr) -land and marine
Net nitrogen yield to marine
(kg/yr)
E.coli/100litres exceeded 5%
of time
Trout numbers (no/1000 km)
Environmental performance
historic
present
bmp_present


Catchment futures modelling
What development scenarios for the Motueka catchment
environment - economy - social system are sustainable?
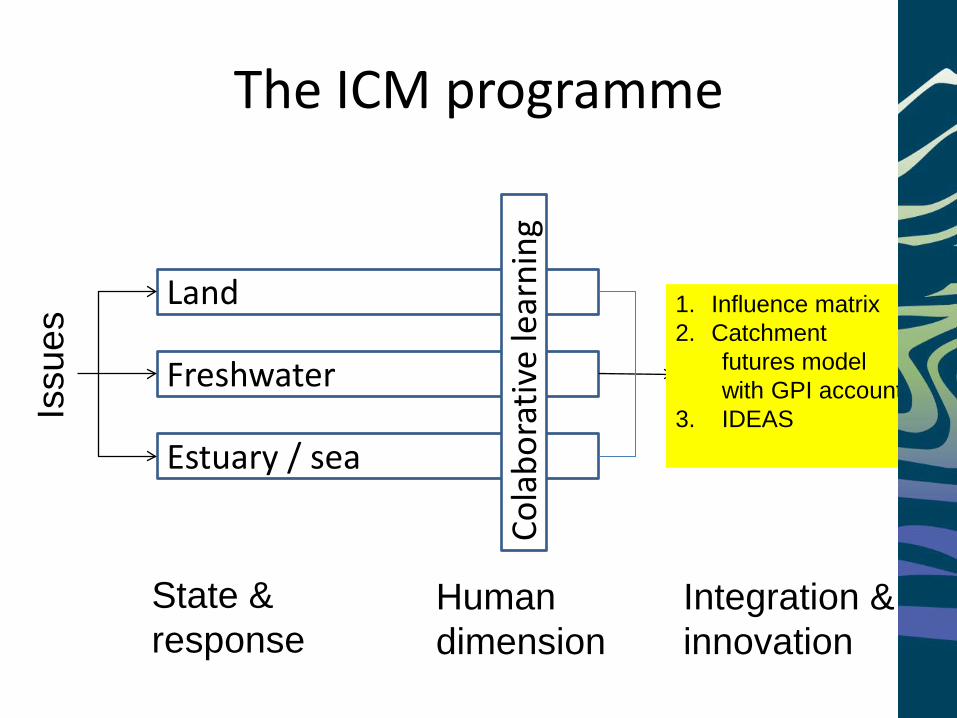
The ICM programme
Land
Freshwater
Estuary / sea
Cola
bora
tive
lear
ning
Issu
es
State &response
Humandimension
Integration &innovation
1. Influence matrix2. Catchment
futures modelwith GPI accounts
3. IDEAS

The ICM programme
Land
Freshwater
Estuary / sea
Cola
bora
tive
lear
ning
Issu
es
State &response
Humandimension
Integration &innovation
1. Influence matrix2. Catchment
futures modelwith GPI accounts
3. IDEAS

Catchment futures modelling results
• Only one line of evidence (sustainability)
• Business-as-usual run is not sustainable– Indicators (illustrate)
• Question – what does sustainable catchment development look like?

Contents
• Motueka catchment futures• Origin of the model• The business-as-usual model run• Social indicators• Conclusions• Conclusions – building a sustainable
scenario• Supporting material – if required

Motueka catchment futures model
What is it?

This futures model
• Mathematical description
• Holistic
• Model parts are interconnected
• Run model scenarios (explore system change)
• Sustainability accounting tool

Origin of the model
Why did we build this?

Where did this all start?
• Motueka Community Reference Group (CRG)
• Influence matrix project– Catchment development goals (esp.
sustainability)
– Preferred developmental factors
• The futures model was the next step

Goal identification
“The residents of the Motueka Catchment want to manage their Catchment so as to ensure they continue to enjoy a safe place to play and live, its pristine character and beauty, its identity, economic and ecological balance, its economic viability for business development, its exceptional climate, biological, community and landscape diversity & coastal integrity”
Motueka community reference group (6/5/02)

EcoLink Re-designing Resources
Murray Sustainable (spreadsheet Pathways (NCC/TDC)prototype)
Waikato project Waikato(MatLab/Stella) Case study
Gary (Data sets) PhD Consultancy Futures model
Mattihas (Demographic) TDC/NCC
Ron Colman (GPI)/Vicky/Whatarangi Takapuwahia
Sustainable Ecosystems(Canberra) Goulburn Broken
Influence Matrix ICM/GRC
ICM iMatrix Pop Economy Labour Market EcoServ GPI (Nelson EDA)
Mediated Ecosystem iMatrix Transdisciplinarity Kaupapa/tikanga Genuine progress GIS Modelling Services accounting indicators
Desktop Mediated Participatory Mediated Collaborative Desktop (Teaching)modelling modelling modelling modelling modelling modelling Communication to
Time

The business-as-usual model run
What have we discovered?

Let’s assume business-as-usual growth
• Our key question – “are we on track?”
• Focus on emerging tensions

How much economic growth?
Motueka consumption GCP500 M
350 M
200 M1 6 11 16 21 26
Time (Year)

Estimating genuine progress
Motueka GPI400 M
250 M
100 M1 6 11 16 21 26
Time (Year)

> economic growth ≠ wellbeing improvements (social / ecological)
Motueka GCP/GPI550 M550 M
100 M100 M
1 6 11 16 21 26Time (Year)
400 M
250 M
100 M
Consumption GCPGenuine progress indicator
GCP
GPI
Motueka GCP/GPI

Balance of trade/capita
Motueka_total_BOT/capita-8,000
-9,000
-10,0001 6 11 16 21 26
Time (Year)Cat
chm
ent
impo
rts –
expo
rts (
$)

Direct material & energy flows
Industry and household

The basic model concept
MotuekaCatchment
social-economicsystem
Mass
Energy
Pollutants
WasteEnergy
Motueka catchment ecosystems
People, energycommodities, pollutants
Direct effectsDirect effects
Indirect effects

Direct material flows (industry)
Indic 10 – CO2 (t) Indic 11 – N2O (kg) Indic 12 – CH4 (kg)
Indic 4 – SW (t) 3,700
1,5001 11 21
Time (Year)
175,000
45,0001 11 21Time (Year)
17,000
4,0001 11 21Time (Year)
70,000
17,0001 11 21Time (Year)
GHG emissions
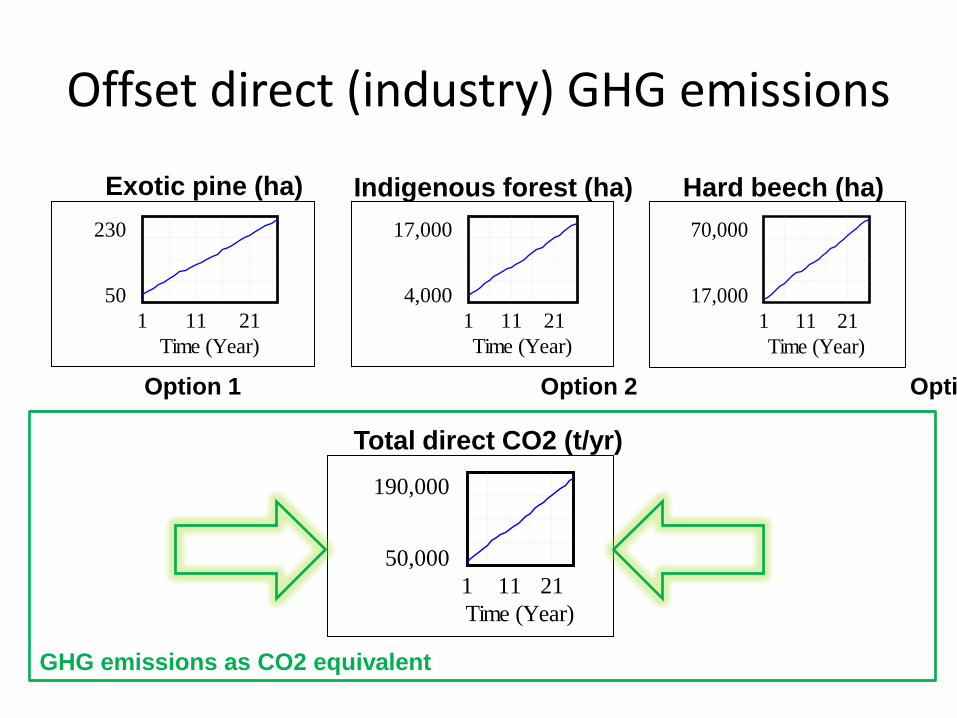
Offset direct (industry) GHG emissions
70,000
17,0001 11 21Time (Year)
17,000
4,0001 11 21Time (Year)
230
501 11 21
Time (Year)
190,000
50,0001 11 21Time (Year)
Exotic pine (ha) Indigenous forest (ha) Hard beech (ha)
Total direct CO2 (t/yr)
Option 1 Option 2 Opti
GHG emissions as CO2 equivalent

Direct material flows (Household)
19,500
12,0001 11 21Time (Year)
3,600
2,2001 11 21
Time (Year)
40,000
25,0001 11 21Time (Year)
3,500
2,2001 11 21
Time (Year)
Indic 22 – CO2 (t) Indic 23 – N2O (kg) Indic 24 – CH4 (kg)
Indic 16 – SW (t) GHG emissions

Offset direct (house) GHG emissions
54
311 11 21
Time (Year)
40
251 11 21
Time (Year)
37
221 11 21
Time (Year)
45,000
23,0001 11 21Time (Year)
Exotic pine (ha) Indigenous forest (ha) Hard beech (ha)
Total direct CO2 (t/yr)
Option 1 Option 2 Optio
GHG emissions as CO2 equivalent

Direct energy use (industry) GJ/yr
850,000
540,000
230,0001 6 11 16 21 26
Time (Year)
GJ
of e
nerg
y

Direct energy use (household) GJ/yr
200,000
162,000
124,0001 6 11 16 21 26
Time (Year)
GJ
of e
nerg
y

Indirect material & energy flows
Industry and household

The basic model concept
MotuekaCatchment
social-economicsystem
Mass
Energy
Pollutants
WasteEnergy
Motueka catchment ecosystems
People, energycommodities, pollutants
Direct effectsDirect effects
Indirect effects

Indirect
• Direct cause and effect is mediated by contributory intermediate steps (i.e. a chain of events)
• These should be measured
• Typically account for ca. 90% of the effect
• An embodied effect– Everything we purchase has embodied water,
energy, GHG emissions etc

Indirect material flows (industry)
15 M
10 M1 11 21
Time (Year)
380 M
260 M1 11 21
Time (Year)
190 M
127 M1 11 21
Time (Year)
850,000
550,0001 11 21Time (Year)
Indic 1 - Energy (GJ) Indic 3 – Water take (M3) Indic 4 – Water disc (M3)
Indic 7 – CO2 (t)
GHG emissions

Offset indirect (industry) GHG emissions
230
501 11 21
Time (Year)
Exotic pine (ha) Indigenous forest (ha) Hard beech (ha)
Total direct CO2 (t/yr)
750
4501 11 21
Time (Year)
720
4501 11 21
Time (Year)
850,000
550,0001 11 21Time (Year)
Option 1 Option 2 Opti
GHG emissions as CO2 equivalent

Indirect material flows (Household)
Indic 1 - Energy (GJ) Indic 3 – Water take (M3) Indic 4 – Water disc (M3)
Indic 7 – CO2 (t)
1.9 M
1.1 M1 11 21
Time (Year)
24,000
15,0001 11 21Time (Year)
20,000
12,0001 11 21Time (Year)
85,000
50,0001 11 21Time (Year)
GHG emissions

Offset indirect (household) GHG emissions
Exotic pine (ha) Indigenous forest (ha) Hard beech (ha)
Total direct CO2 (t/yr)
230
501 11 21
Time (Year)
750
4501 11 21
Time (Year)
720
4501 11 21
Time (Year)Option 1 Option 2 Opti
GHG emissions as CO2 equivalent
45,000
23,0001 11 21Time (Year)

Summary
• Direct offset (industry) 17-70,000 ha/yr• Direct offset (household) 70-80 ha/yr• Indirect offset (industry) 720-750 ha/yr• Indirect offset (household ) 70-80 ha/yr
• Total offset range (yr) 17,860 – 70,910 ha/yr• Time (horizon) 2001 - 2025

Sum of annual GHG offset
0
200,000
400,000
600,000
800,000
1,000,000
1,200,000
Sum
of f
ores
t pla
nted
(Ha.
)
Time (years)
1 catchment equivalent
2 catchment equivalents3x
2x
1x

Social indicators
GPI accounts

Social domain
• Economic growth also causes social effects
• Tensions in this area too
• GPI accounts module (monetary)

GPI (Social indicators)
200 M
100 M1 11 21
Time (Year)
80,000
40,0001 11 21Time (Year)
10 M
4 M1 11 21
Time (Year)
20 M
8 M1 11 21
Time (Year)
6 M
2 M1 11 21
Time (Year)
1.9 M
1.8 M1 11 21
Time (Year)
GPI indic 11 – Cons Dur GPI indic 12 – Unemp GPI indic 13 – Prod (Un)
GPI indic 14 – Veh AccGPI indic 15 – CommuteGPI indic 15 – Crime

GPI (Social indicators)
6 M
01 11 21
Time (Year)
4 M
01 11 21
Time (Year)
4 M
1 M1 11 21
Time (Year)
GPI indic 17 – Fam BreakGPI indic 18 – SuicideGPI indic 19 – Gambling

Social cost of growth
400 M
100 M1 11 21
Time (Year)
2001 2005 2010 2015 2020 2025
400 M
100 M
Time (years)
Socialcost ($)

Conclusions
What development scenarios for the Motueka catchment
environment - economy - social system are sustainable?

Business-as-usual (sustainable?)
• Business-as-usual growth scenario is unlikely to achieve the development goals identified by the community reference group
• We have looked at indicators in the– Ecological sustainability area (tensions)
– Social sustainability area (tensions)
≠ Economically sustainable (either)

Key problems
• Economic growth is also growing debt• Indirect + direct GHG emission (offsets) will
exceed available catchment land area• Reason:
– consumption (Indirect effects)– our focus on mitigation is direct effects (i.e.
recycling, solar power, building insulation, hybrid cars etc), 5-10%
• Social costs of business-as-usual growth

Key problems
• GCP/GPI diverge long term
• We haven’t considered offsetting:
• water takes/discharges,
• other point and non-point source pollutants,
• landfill (solid waste streams) ,
• non-renewable resources etc …

Conclusions
Building a sustainable scenario

Planning for a sustainable future
• If business-as-usual is not sustainable, then … what is?
• Question - how do we build a sustainable model scenario?
• Assume an ideal world
• On-the-ground implementation is another matter

To make a sustainable model run
• Manufacture, sell and buy local– Strategy for smart/local intermediate industry dev.
• Mitigation of direct effects (important) - yes• Critical issues - reduce consumption (indirect
effects)• Substantial gains in energy efficiency and local
renewable energy production• Increase ecosystem service capacity (water
discharges)

To make a sustainable model run
• Innovation associated with sustainableintermediate production and ecological restoration to offset preferred indirect consumption effects
• Reduction of fossil fuel transport (commuting)
• Demographic plans/policy needed– ageing population (labour market)– attract a local skilled workforce

Other important factors
• Sea-level change mitigation
• Managed net growth (rather than net decline) of threatened ecosystem services (& species) – this implies offsetting should focus on indigenous ecosystem restoration (i.e. more land area)
www.natureonfilm.co.nz


How can cultural impacts of land use change be modelled?
Oscar Montes de Oca
Garth Harmsworth
Manaaki Whenua – Landcare Research

How can Agent Based Modelling be used for resource management?
• Tool that helps with discussion on land use options
• Brings together:– “hard data” – gross margins, jobs,
environment– “soft data” – aspirations, common goals
• Represents diversity of interests
Definition of a cultural metric for IDEAS
• Collaboration with Tiakina iwi group
• Visualisation was an effective trigger to discuss cultural values
• Integrated into the IDEAS framework

Pre-European cover to present cover to define original cultural values

Forest and wetlands lost – cultural values impacted

Cultural metric outcomesCultural score, land use scenarios
3.0
3.5
4.0
4.5
5.0
historic present bmp_present intensive bmp_intensive

Trade off analysis –IDEAS indicatorsNitrogen
$ Output
Jobs
E Coli
Sediment
Cultural
Carbon
NOW
SCENARIO

Trade off analysis for policy evaluation –quick prototyping


Land use and the marine environment
ICM IDEAS: using marine models to extend our assessment of land use decisions beyond the river mouth.

Catchment footprint on the coast can be large and persistent.
Why? Because size matters…

Connections
Catchment Model
River Transport Model
Coastal Models
Water quality & quantity

Transport

Salinity Fine Sediments
… historic sediment still causing problems (e.g. decline in scallop fishery).
Marine Aquaculture

Nitrogen and phytoplankton.
521
234
3,806
Nitrogen Load
(ton/yr)

Phytoplankton
Shellfish Zooplankton
Baitfish
Fish
Benefits for ecosystem/catchment economy?
Jobs

Conclusions
• Land use can have positive and negative impacts on coast.
• Region and time of influence on coast can be large.
• Therefore need to consider coast in catchment decisions to avoid problems.
• IDEAS offers flexible approach to plan for the future.
Satellite image of turbidity (29 october, 2007). Red = high turbidity.


