
Outlook for World Cotton Supply and Use
Armelle Gruère, ICAC ABARE’s Outlook 2010 Conference
March 2, 2010
Outlook for World Cotton Supply and Use
1. A Bright Short-Term Outlook
2. A More Nuanced Long-term Outlook

A BRIGHT SHORT-TERM OUTLOOK

-12%
-6%
0%
6%
12%
98/99 00/01 02/03 04/05 06/07 08/09 10/11
-2%
0%
2%
4%
6%
1998 2001 2004 2007 2010
Growth in World Cotton
Mill Use
Growth in World
GDP

Cotton Consumption
0
3
6
9
12
China India Pakistan Turkey Brazil Bang. USA
2007/08 2008/09 2009/10 2010/11
Million tons

18
20
22
24
26
28
00/01 02/03 04/05 06/07 08/09 10/11
Million tons
World Cotton Production and Mill Use
Production
Consumption

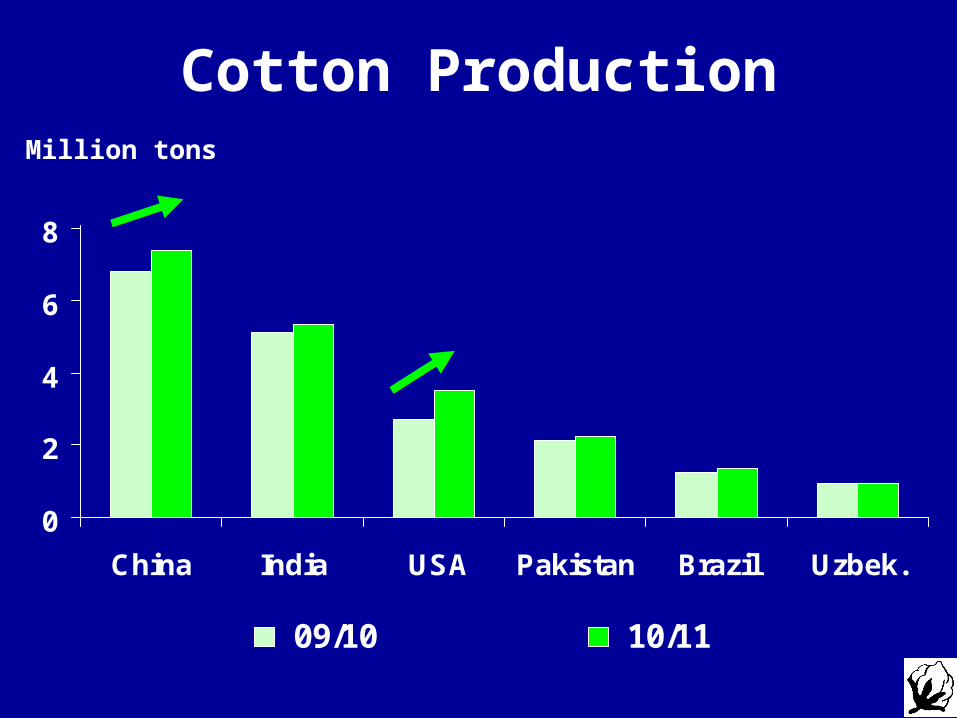
0
2
4
6
8
China India USA Pakistan Brazil Uzbek.
06/07 07/08 08/09 09/10
Cotton ProductionMillion tons

35
45
55
65
75
99/00 01/02 03/04 05/06 07/08 09/10
Cotlook A IndexSeason-average (US cents/lb)
7479
69
61

Price Ratios at Planting TimeCotton to: Maize, Soy, Wheat, Rice and Sugar
0
5
10
15
Maize Soy Wheat Rice Sugar
05 06 07 08 09 10
Price Ratio

2000 = 100
50
150
250
350
450
550
Jan-08 Jul-08 Jan-09 Jul-09 Jan-10
Crude Oil Prices
0
200
400
600
800
1000
Jan-08 Jul-08 Jan-09 Jul-09 Jan-10
Fertilizer Prices2000 = 100
0
300
600
900
1,200
00/01 02/03 04/05 06/07 08/09 10/110
9
18
27
36
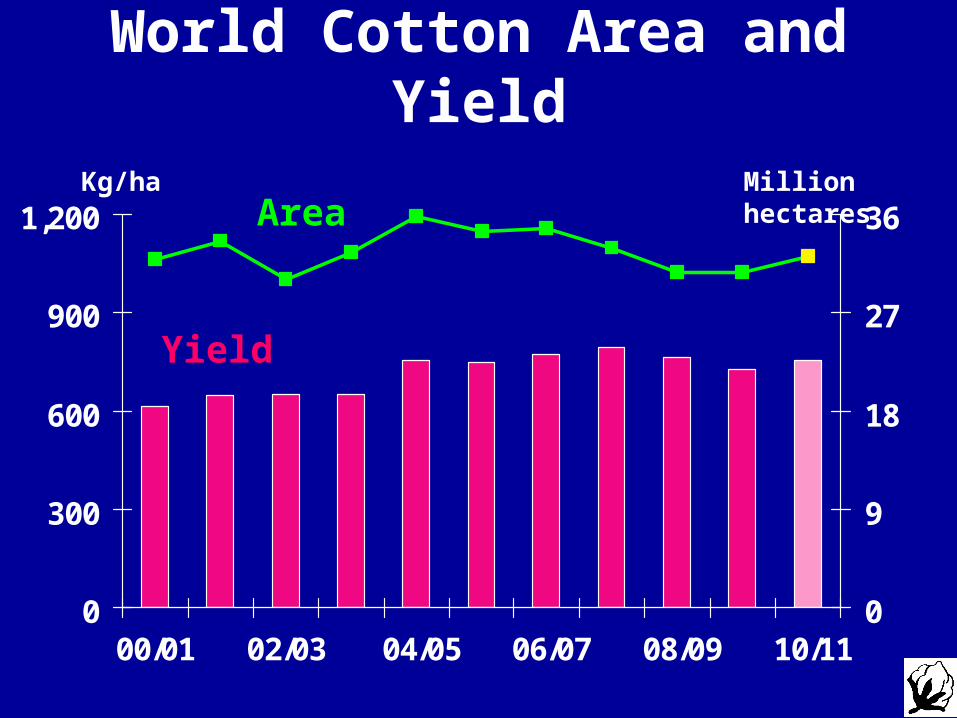
World Cotton Area and Yield
Million hectaresKg/haArea
Yield
0
2
4
6
8
China India USA Pakistan Brazil Uzbek.
09/10 10/11
Cotton ProductionMillion tons

World Cotton Imports
0
4
8
12
99/00 01/02 03/04 05/06 07/08 09/10
China Rest of the World
Million tons

Cotton Exports
0
1
2
3
USA India Uzbek. CFAZone
Brazil Australia
2009/10 2010/11
Million tons

40%
60%
80%
100%
00/01 02/03 04/05 06/07 08/09 10/11
Share of Asia in the World Total
Mill Use
Production
Imports

Cotton Exports

A MORE NUANCED LONG-TERM OUTLOOK

World Cotton Production and Consumption
12
16
20
24
28
80/81 90/91 00/01 10/11 20/21
Million Tons

0
50
100
150
200
Jan-90 Jan-95 Jan-00 Jan-05 Jan-10
Wheat Maize
Cotton/Grain Price RatiosIndex: 1990 = 100

World Cotton Area
25
30
35
40
80/81 90/91 00/01 10/11 20/21
Million Ha

World Cotton Yields
200
400
600
800
80/81 90/91 00/01 10/11 20/21
Kg per Hectare

World End-Use Textile Fiber Consumption by Fibers
0
10
20
30
40
50
60
70
1960 1965 1970 1975 1980 1985 1990 1995 2000 2005 2010
Wool
Cellulosic
Non-cellulosic
Cotton
Million tons

20
30
40
50
60
1975 1980 1985 1990 1995 2000 2005 2010 2015 2020
Cotton’s Share of World End-Use Textile Fiber Consumption
Percent
Average 1960-2008

35
50
65
80
95
73/74 83/84 93/94 03/04 13/14
Cotlook A Index (Nominal)
Season Average (US cents/lb)

050
100150200250300350
73/74 83/84 93/94 03/04 13/14
Cotlook A Index (Real)
Season Average (2008 = 100)

Conclusions
• A bright short-term cotton outlook:– Recovering mill use– Tightening stocks– Firm prices
• A more nuanced long-term outlook:– Slow growth in production– Continued competition with polyester– Higher nominal prices but declining real prices


