
Out Briefing to City / MCS LeadershipMadison Schools Growth Impact Committee
22 March 2018 Rev 6A

Core Nature of MCS➢The Madison City School System is Large Now (>10,000) and Getting Larger, Yet…
✓Premier Performance: MCS Consistently Scores in the Top Three (or Higher) Rankings of State School Systems; Competitive Nationally (Top 1.5%)
✓Excellence: MCS is, By-Far, the School System of Choice in North Alabama
➢The MCS System is Unique in the State’s Education System✓Appointed School Board – Void of Political Posturing – Focused on City-Wide Excellence
• Board Appointment is a City Council Responsibility
✓Unparalleled Teacher / Parent Involvement with Universal Community Support• Entire City Values Education – The Binding “Glue” of Our City
✓No “Have Not” Schools - Balanced Demographics / Diversity Enrollment• Managed by Periodic Rezoning
✓ Not a Rich District
• Madison City is ranked 61st of 137 school districts in per-pupil expenditures
✓ Madison City Schools is a young district (started in 1998) – youngest large district in the State2

Definitions of Growth Impact Study Cases
• Case 1 (Current Approved Projects Only + Strategic Annexations): No Additional Annexations for Residential and No New Subdivision Developments Approved for Property Already Annexed. Caveat is Allowance for "Strategic" Annexation (e.g., business or compelling City need). Buildout to ~58,000 residents.
• Case 2 (Growth per City Master Plans w/i Annexed Boundaries): Case 1 + No Additional Annexations, but Allows Additional Subdivision Developments for Properties Already in the City. Development Guided by the WSMP Characterizations of Property. Buildout to ~74,000
• Case 3 (Growth with No Plan Constraints): Case 1 & 2 + WSMP Study Boundary Fully Realized. Madison Annexes More Lands to the Extent of the WSMP Vision Map (Limited by Boundaries with Athens / Huntsville). Potential for Current Nonresidential Land to be Rezoned Residential. Buildout to ~81,000
3
All Rooftop Counts and Student Enrollment Numbers have been Revised to Incorporate the Most Recent Regional Development Activities (Town Madison, Clift Farms, Toyota/Mazda, etc)
* Note:

Bottom Line Up Front
➢Without Timely Action, Overcrowding due to Madison’s Residential Growth will Threaten Our Premier Public School System.✓Residential development, Guided by Approved Master Plans (Case II), will Overwhelm Capacity in all
Three (Elementary, Middle and High) School Levels by 2025.
➢Given Industrial Growth in Madison & Limestone Counties, and increasing residential demand, Madison City has Little Flexibility to Postpone Taking Action to Address School Overcrowding✓Under Current Growth Trajectory, a New Middle and Elementary School are Needed
✓Expansion to Bob Jones and James Clemens High Schools or a third high school will be needed.
4

4
5
6
7
8
9
10
11
12
13
14
15
16
17
18
19
2000 2005 2010 2015 2020 2025 2030 2035 2040
# ST
UD
ENTS
(Th
ou
san
ds)
SCHOOL YEAR
MCS: HISTORICAL AND PROJECTED ENROLLMENT
Case 1 Stu
Case 2 Stu
Case 3 Stu
5
HistoricalGrowth
ProjectedGrowth
Cases 1, 2 & 3Case 1: In 2023, Reassess Needs
Case 2&3: New ES & MS by 2022
Case 2&3: New HS by 2025
Case 3: Another ES by 2032

Document
• What Breaks & When• Identify Mitigation
Actions• Identify Essential Fixes• Cost Assessment• Recommendations
Methodology
6
Ro
of
Top
s
Po
pu
lati
on
Stu
de
nts
(Mad
iso
n +
Tri
ana)
*WSMP(-) = CASE 1+ Annexed Land Likely to be Developed; **WSMP(+) = Cases 1 & 2 + Unincorporated Land Out to WSMP Outer Boundary
Estimate From Rooftops –to- Population –to- Students
e.g. - Case II Rooftops Population Students
Current 18,859 48,194 10,545
Circa 2025/28 24,861 63,532 14,074
Circa 2040 29,116 74,406 16,542

Near Term MCS Enrollment
• Case 1: No New Growth. • Case 2: Controlled Growth. • Case 3: Unrestricted Growth
Source:
1. Rooftops: City of Madison Planning and Economic Development Department, TARCOG and Madison County Commission.
2. Student Enrollment: MCS Demographics Study7
School
Madison City Schools
Capacity
Total Elementary 5455 5096 93.4% 5713 104.73% 5770 105.77%
Total Middle School 3000 3069 102.3% 3442 114.73% 3476 115.88%
Total High School 4400 4386 99.7% 4919 111.79% 4968 112.91%
MCS Total All grades 12,855 12550 97.6% 14074 109.48% 14214 110.57%
Case 1 Case 2 Case 3
Projected Enrollment 2017- 2028

Long Term MCS Enrollment
• Case 1: No New Growth. Slight Overcrowding• Case 2: Controlled Growth. Significant Over Crowding without New Facilities• Case 3: Unrestricted Growth: Catastrophic Over Crowding without New Facilities
8
Source:
1. Rooftops: City of Madison Planning and Economic Development Department, TARCOG and Madison County Commission.
2. Student Enrollment: MCS Demographics Study
School
Madison City Schools
Capacity
Total Elementary 5455 5275 96.7% 6722 123.23% 7286 133.57%
Total Middle School 3000 3167 105.6% 4043 134.76% 4384 146.14%
Total High School 4400 4526 102.9% 5777 131.29% 6264 142.37%
MCS Total All grades 12,855 12969 100.9% 16542 128.68% 17935 139.52%
Projected Enrollment 2028-2040
Case 1 Case 2 Case 3

MCS BOE and Superintendent NeedsAssuming Growth beyond Case 1
9
✓ New 1,000*-Student Middle School
✓ Additional Classrooms at Both High Schools or New High School
✓ New Elementary School
✓ Additional Space for Special Needs Students
✓ Additional Space for Alternative School
✓ Periodic Rezoning to Maintain Demographics* Note MCS Supplied Cost Estimate is for a 1,200 Student Middle School Facility

MCS BOE and Superintendent Wants
10
✓ Recommission West Madison Elementary
✓ Additional Pre-K classes
✓ New performing arts space for elementary and middle schools

Estimated Cost
11
• New Elementary - $35M for 900 students
• New Middle - $61M for 1,200* students
• High SchoolAddition - $ 20M for 500 student additions at each existing HS New 3rd HS - $120M for a new high school (6X Cost of Additions)
Cost of Option A = $116M (New Elementary / Middle, Additions at High Schools)
This translates to approximately 11 mills.
Cost of Option B = $216M (New Elementary, Middle and High Schools)
This translates to approximately 20 mills.
* MCS Cost Estimate Done Prior to Committee’s Findings

Possible Revenue Sources
12
3 Revenue Paths
• Ad Valorem (Property Tax)
• Sales Tax
• External Revenue• TVA• BRAC Bonds• Other (e.g. Impact Fees, etc)
Comments on Various Revenue Paths:
• Any Ad Valorem Increase Must Pass Referendum Vote by Registered Voters
• Any Increase in Current Sales Taxes Puts Madison as Highest in Region:
• Option A needs 1% Additional• Option B needs 2% Additional
• Other Revenue• Securing Fair Share of TVA Dollars is a lengthy
Battle with Local Legislators• TVA Money is Decreasing Due to Energy
Conservation• No Other Revenue Options like BRAC are Likely• Impact Fees: Being Assessed, not a Solution but
may Help

Ad ValoremAmount
10 Mill 15 Mill 20 Mill 25 Mill
20 Yr Bond $86.04M $129.05M $172.07M $215.09M
25 Yr Bond $97.63M $146.44M $195.25M $244.06M
30 Yr Bond $106.80M $160.20M $213.59M $266.99M
Data estimated in August 2017 by Jo Jolly & CoAssumes 1 mill generates $577,972 in revenue (conservative)Does Not reflect any Inflation Variation
Estimated Bond Amounts fromAdditional Ad Valorem Millage
EG: 11 mills would support a 30 year Bond of $117.78M

What did MCS Do with Initial 11mill Tax?
14

Findings: Assuming Case 1
1. School Capacity is Sufficient for Projected Enrollment until 2028.
2. In 2023 a New Growth Impact Committee should Review Enrollment Numbers and Determine whether New Facilities will be Needed within the Next 10 Years.
3. MCS Continues Periodic Rezoning to Keep Demographics Balanced and Ensure No Schools are Overcrowded.
4. MCS can Locate Additional PreK Classes in Available Classrooms Across the District.
5. Case 1 (No New Growth) is the Least Likely to Occur.
6. No Millage Increase Recommended under Case I Assumptions.
15

Findings: Assuming Case 2
1. The City should Immediately Take Action to Gain Legislative Support to Hold a City-Wide Ad Valorem Property Tax Referendum with Sufficient Millage to Build (by SY2022): a 1,000 Student Middle School and 900 Student Elementary School.• People Need to Vote on the Future of Our Schools.• Decide whether to Include Millage for Third High School at This Time.• There are No Reduced-Cost Revenue Sources Similar to QSCB / BRAC Bonds.
2. By 2025, MCS will Need to Build a Third High School.
3. In 2033 MCS may Need to Build an Additional Elementary School. It is
Likely that MCS will be able to Borrow Against Current Revenue Streams.
16

Findings: Case 2 continued
4. Engage Triana Leadership to Ensure their Residents also Vote on a Corresponding Increase in Ad Valorem Taxes.
5. City of Madison Needs a Growth Policy that Reduces High Density Residential Development and Regulates the Rate of Residential Growth in Approved Developments.• Recommend Development Agreements Prior to Presentation to Planning
Commission / City Council.
• Consider Including a BOE Member or MCS Representative to Participate in New Residential Development Reviews Before Submission to Planning Commission.
17

Findings: Assuming Case 3
1. The City should Immediately Take Action to Gain Legislative Support to Hold a City-Wide Ad Valorem Property Tax Referendum with Sufficient Millage to Build (by SY2022): a 1,000 Student Middle School and 900 Student Elementary School.• People Need to Vote on the Future of Our Schools.• Decide whether to Include Millage for Third High School at This Time.• There are No Reduced-Cost Revenue Sources Similar to QSCB / BRAC Bonds.
2. In 2025, MCS will Need to Build a Third High School.
3. In 2028 MCS should Secure Revenue for the Next Elementary School.
4. Engage Triana Leadership to Ensure their Residents also Vote on a Corresponding Increase in Ad Valorem Taxes.
18

25
30
35
40
45
50
55
60
65
70
75
80
85
2000 2005 2010 2015 2020 2025 2030 2035 2040
# R
ESID
ENTS
(Th
ou
san
ds)
CALENDAR YEAR
CITY POPULATION
Case 1 pop Case 2 pop Case 3 pop
Three High Schools Needed for Population over 65,000
James Clemens HS Built When Population reached 43,000
Bob Jones HS held only grades 10-12
ADDITIONS NEEED TO BOTH HS

4
5
6
7
8
9
10
11
12
13
14
15
16
17
18
19
00 05 10 15 20 25 30 35 40
# ST
UD
ENT
S (
Tho
usa
nd
s)
SCHOOL YEAR
MCS ENROLLMENT
Case 1 Case 2 Case 3
Three High Schools Needed if Enrollment exceeds 14,000
Bob Jones High school was the only HS until 2012
James Clemens Opens in 2012 due to overcrowding at BJ.
ADDITIONS NEEDEDTO BOTH HS

Committee’s Key Findings
• Approximately 10 Mill (based on FY2016 data) Ad Valorem Tax would Support the Estimated Revenue Needed for a New Middle School and Elementary School.
• One Additional Mill Would Finance the Additions at Both High Schools.
• 10 Additional Mills Would Generate Revenue Needed for a Third High School.
• Final Millage Would need to be Adjusted to Current Revenue at Time of Referendum.
21

Committee’s Key Findings Continued
• Recommend City Consider Modifying Assumptions in Case 2 that would Reduce by 3,500 the Number of New Homes in 2040 Build Out.
o Case 2 Projects 10,300 New Homes by 2040.
o Scale Back Growth to only 6,800 New Homes by 2040.
o Very Difficult to Control Growth over Multiple Administrations.
• Controlling Growth Potentially could Avoid the Need for a 3rd High School – But this Needs to be Reassessed in 2022.o If Case 2 is Modified, Additions could be Added to Each High School
creating Two 2,500 Student High Schools.o Additions would be Needed by 2025. o City and MCS need to Monitor Population Closely.
22

Summary• MCS has a Real Growth Problem: Near-Term Enrollment vs Capacity
• City Leadership needs to formalize a growth policy that can regulate residential development. A target population number should be expressed
• Significant New MCS Debt is Not Supported by Existing Revenue until 2034
• There is No Debate Concerning the Need for New Schools at Elementary / Middle School Levels
• Most Significant Challenge is Solving the High School Situation• If Case 2 or Case 3 is followed, a new high school will be necessary. • If growth is capped at ~65,000 residents, additions may be built at each high school. MCS
will need to brainstorm solutions for middle grade students. Additions to existing schools, Magnet schools, 6th grade or 8th grade academy, and other configurations may be viable options.
23
Back Up: Understanding / Managing Growth
24

Basic Growth Model
25
GovernmentCreates
Infrastructure
• Transportation• Utilities• Workforce
Regional Government
Competes
• Abatements• Quality of Life• Education
Industry Commits to North Ala
• Construction• Hiring• Relocation
Employees Relocate
• Housing Demand
• School Choice
PopulationGrowth
• Home Choice• Infrastructure• Quality of Life• Public Safety
School SystemGrowth
• K-12 Capacity• K-12 Staff
Madison Schools are a Key Factor in Competing for Regional Growth
Madison CityMgmt Prob
MCSMgmt Prob

26
Example: New Jobs Driving Growth
EVENT IMPACT
BRAC (1995) & BRAC (2005)
Changed RSA’s Army Missile Command focus (2 General Officers) to Multi-Mission Defense Focus (AVN, SMDC, MDA, LOGSA, AMC, FBI, etc) with over 12 General Officers.
Polaris (2015) Invested $142M to construct 600K SQFT facility to employ ~2,000
GE Aviation (2016)A $200M investment to construct a world-wide unique silicon carbide production facility for ceramic composites; Employing 300 on a 100 acre site west of Madison
Aerojet / Rocketdyne(2017)
Company will construct 136K SQFT advanced manufacturing facility with 700 employees in west Hsv and consolidate Defense HQ in 122KSQFT facility in Research Park.
BOCAR (2017) AutoSupplier
A $115M investment for manufacturing Tier-1 auto parts; Will employ 300 near I-565 / I-65.
Toyota / Mazda (2018)A $1.6B investment to build production facilities for 3,000 cars / year; Employ4,000 with approximately 10,000 spinoff / supplier jobs.

Actions Already Taken by MCS
✓Passed Resolution Advocating no New Residential Annexation in Limestone County Until Settlement.
✓Settled Limestone County Tax Dispute
✓Constructing 16 Additional Classrooms at Liberty Middle School
✓Moving 6th Grade to Middle School in 2018-19
✓Rezoned New Growth
✓Successful Campaign to Renew Current District and County-Wide (Madison) Ad Valorem
27

MCS: Historical Enrollment
• Enrollment Tends to Grow for Any Class Grouping – New Students Join MCS Across Every Grade Level
• Over Crowding at Bob Jones High School Caused Decreases in Enrollment from 2007-2011
• With Opening of JCHS in 2012, Yearly Increases in MCS Enrollment Resumed
28
Source: Madison City Schools

Top Alabama School Systems
School System Grade ADA* School System Grade ADA*
Mountain Brook 98 4,369 Arab 92 2,473
Vestavia Hills 96 6,940 Cullman 92 3,114
Madison City 95 9,907 Hoover 92 13,846
Homewood 94 4,004 Hartselle 91 3,002
Muscle Shoals 93 2,883 Oneonta 91 1,473
Trussville 93 4,453 Winfield 90 1,244
29
* ADA = Average Daily Attendance, Circa SY 2017
• Ten (10) Systems have One (1) High School; Madison and Hoover have Two (2).
• Alabama has 12 County / Municipal School Systems Larger than Madison City. Madison and
Mountain Brook were the Only Ones Where All Schools in the System Earned an “A” ranking.
12
Ala
“A”
Sch
oo
l Sys
tem
s

Back Up: MCS Connection to Real Estate
30

Good Schools Drive Home Values
• Assessed Residential Property in Neighborhoods Zoned for Butler HS in the 18 Months prior to Rezoning to Huntsville HS (01/01/14 -05/31/15).
• Assessed Same Neighborhoods After Rezoning (06/-01/15 –08/31/17).
31
Impact of Butler HS Rezoning to Huntsville HS
Rezoning Event
# of MLS ListingsAve # Days on
MarketAve List Price Ave Sold Price
Before 33 133 $58,048 $53,607
After 77 100 $66,375 $62,861
• Market Saw >100%+ Increase in Activity
• Sale Value > 17% Increase
• Time on Market was 33 Days Shorter
Source: MLS Historical Data; Analysis by Realtor / Assoc Broker

32
• Madison Enjoys Robust Home Sales
• Recovered from 2008 Slump
• Home Sales▪ Existing ~67%▪ New ~33%
• 2017 Ave Sales Price: ~$268K
Great Schools Promote Stable Sale and Resale of Homes
0
200
400
600
800
1000
1200
1400
Home Sales, Madison, AlSource: Valley MLS, 1996-2017
Existing Homes Sold
New Homes Sold
Historical Home Sales Data
Madison Realtor FB Post 11 Feb 2018: “ You know you live and work in an area with tremendous growth when you have multiple people FaceTiming home buyers that are out of state from inside the open house you are hosting! 😳”

Back Up: MCS Best Bang for the Education Buck
33

2018 NICHE* School System Rankings
• MCS Ranking: #3 of 135 in Alabama School Systems
• MCS Earned Grade: “A+”• Only 7 Schools Systems in the State Received a Grade of “A+”:
• Athens City Schools Achieved an “A-” grade.• Huntsville City, Madison County & Decatur City Schools Earned a “B+” Grade• Limestone County Schools Received a “C+” Report
• Nationwide: MCS Ranked 141 of 10,576 Nationwide – Top 1.5%
34
A+ (1) Mountain Brook City Schools A+ (5) Hoover City Schools
A+ (2) Vestavia Hills City Schools A+ (6) Auburn City Schools
A+ (3) MADISON CITY SCHOOLS A+ (7) Muscle Shoals City Schools
A+ (4) Homewood City Schools B+ (22) Huntsville City Schools
* https://www.niche.com/k12/search/best-school-districts/s/alabama/

" Bob Jones and James Clemens were 2 of only 6
non-magnet high schools in the state that
received an A.”
- Robby Parker
2018 Alabama Report Card Rankings
• MCS Score was 95: Third Highest Score in the State
• Only Two Systems had Every School in the System Earn an “A”• Madison City Schools and Mountain Brook City Schools
• Local School Systems:Huntsville City: 75 Madison Cnty: 85 Limestone Cnty: 83 Athens City: 81 Decatur City: 79
35
98 Mountain Brook City Schools 92 Arab City Schools
96 Vestavia Hills City Schools 92 Cullman City Schools
95 MADISON CITY SCHOOLS 92 Hoover City Schools
94 Homewood City Schools 91 Hartselle City Schools
93 Muscle Shoals City Schools 91 Oneonta City Schools
93 Trussville City Schools 90 Winfield City Schools
* http://ap.alsde.edu/accountability/EducationReportCard/selectschool
Sch
oo
l Sys
tem
sEa
rnin
g an
“A
”

Per Pupil Expenditures
36
Alabama NICHE Ranking
School System Per Pupil Expenditure
1 Mountain Brook City Schools $12,811
2 Vestavia Hills City Schools $10,727
3 Madison City Schools $9,305
4 Homewood City Schools $11,075
5 Hoover City Schools $10,812
6 Auburn City Schools $9,106
7 Muscle Shoals City Schools $9,496
14 (A-) Athens City Schools $9,671
22 (B+) Huntsville City Schools $10,874
• For A+ Rated Schools: Auburn & Madison City Schools Spend the Least $$ per Pupil
• The MCS System Spends Less $$ per Pupil than Area Schools with Lower NICHE Rankings
A+
SC
HO
OLS
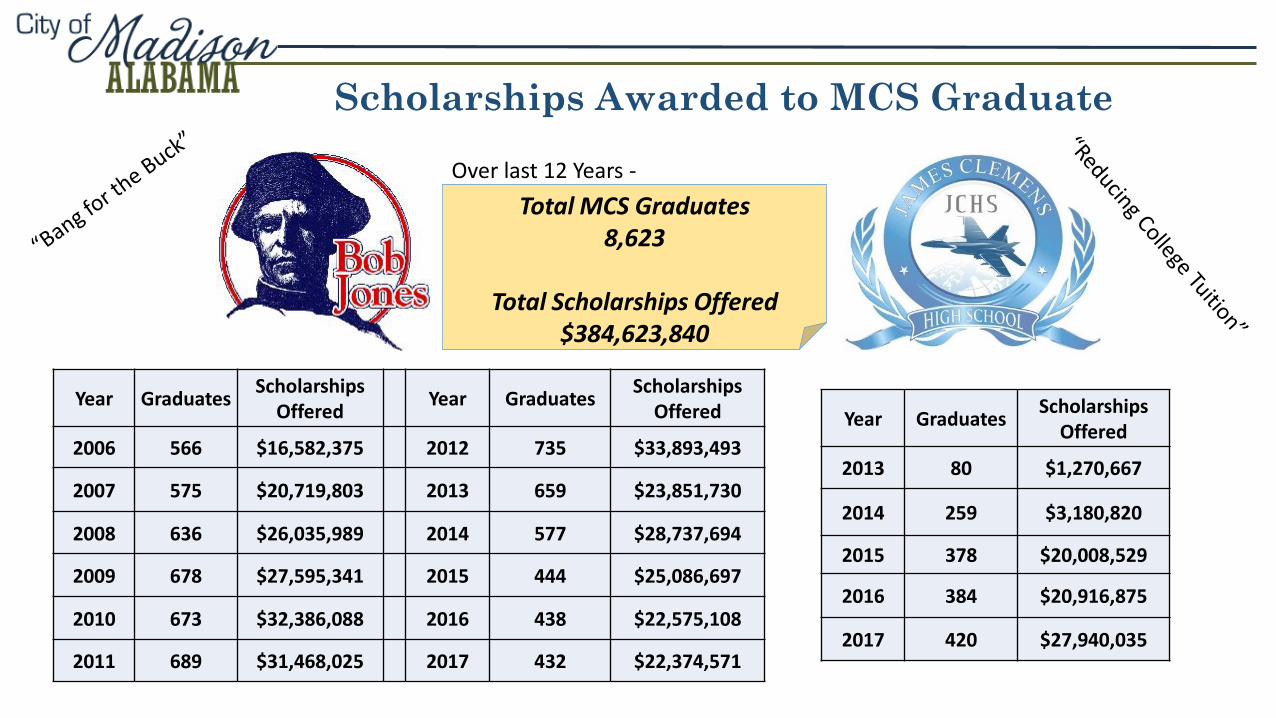
Year GraduatesScholarships
Offered
2013 80 $1,270,667
2014 259 $3,180,820
2015 378 $20,008,529
2016 384 $20,916,875
2017 420 $27,940,035
Year GraduatesScholarships
Offered Year Graduates
Scholarships Offered
2006 566 $16,582,375 2012 735 $33,893,493
2007 575 $20,719,803 2013 659 $23,851,730
2008 636 $26,035,989 2014 577 $28,737,694
2009 678 $27,595,341 2015 444 $25,086,697
2010 673 $32,386,088 2016 438 $22,575,108
2011 689 $31,468,025 2017 432 $22,374,571
Scholarships Awarded to MCS Graduate
Total MCS Graduates8,623
Total Scholarships Offered $384,623,840
Over last 12 Years -

Back Up: City of Madison and MCS - Tutorial on Taxes
38

Ad Valorem Taxes in Alabama
39
Alabama NICHE
RankingSchool System
CountyEducation* Tax Millage
City Education
Tax Millage
Total Property Tax Millage
1 Mountain Brook City – Jefferson Co 8.2 44.7 99.0
2Vestavia Hills City – Shelby CoVestavia Hills City – Jefferson Co
16.023.3
25.679.392.6
3Madison City – Madison CoMadison City – Limestone Co*
1616
11.057.560.0
4 Homewood City – Jefferson Co 8.2 29.3 75.0
5Hoover City – Shelby CoHoover City – Jefferson Co
22.022.1
24.066.572.6
22Huntsville City – Madison CoHuntsville City – Limestone Co*
1616
11.558.060.5
* Includes County-Wide and District Taxes Collected by County. Note Limestone County does not distribute 5.5 mills ofthe 16.0 mills to municipalities proportionately by student population.
Source: Official Statements from Each Municipality

Total City Revenue*Ad Valorem & Sales Taxes
40
Alabama NICHE
RankingSchool System
Total Prop Tax Millage % of Revenue
Sales Tax% of Revenue
1 Mountain Brook – Jefferson Co 99.0 50% 23%
2Vestavia Hills – Shelby CoVestavia Hills – Jefferson Co
79.392.6
58% 19%
3Madison City – Madison CoMadison City – Limestone Co
57.560.0
29% 41%
* Total Revenue includes ad valorem, sales and other monies (fees, fines, inter governmental, etc)
• Top Two School Systems in Alabama are Much Less Dependent on Sales Tax Revenue to Fund
Them and Their Associated Municipality.
• Madison City and Madison City Schools Greatly Depend on Sales Taxes vs Ad Valorem.
Source: PARCA. http://parcalabama.org/wp-content/uploads/2017/04/How-Alabama-City-Finances-Compare.pdf

Ad Valorem Taxes for Cities of Interest
41
City / County State*County
Non-School
Schools** Municipality
County-Wide
DistrictGeneral
FundCity
SchoolsTotal Mills
Mountain Brook City – Jefferson Co 6.5 13.5 8.2 0.0 26.1 44.7 99.0
Vestavia Hills City – Shelby CoVestavia Hills City – Jefferson Co
6.56.5
7.513.5
16.08.2
0.015.1
23.723.7
25.625.6
79.392.6
Madison City – Madison CoMadison City – Limestone Co***
6.56.5
11.013.5
5.55.5
10.510.5
13.013.0
11.011.0
57.560.0
Homewood City – Jefferson Co 6.5 13.5 8.2 0.0 17.5 29.3 75.0
Hoover City – Shelby CoHoover City – Jefferson Co
6.56.5
7.513.5
16.08.2
6.013.9
6.56.5
24.024.0
66.572.6
Huntsville City – Madison CoHuntsville City – Limestone Co***
6.56.5
11.013.5
5.55.5
10.510.5
13.013.0
11.511.5
58.060.5
* Three (3) mills of the State’s 6.5 mill ad valorem levy goes to State Education Fund directly** The County Education District Tax is collected by the County, but allocated directly to the school system serving that district*** Limestone County’s 5.5 mill education tax is not distributed pro rata to all school districts in the county (proportionately by student population)
Source: Official Statements from Each Municipality

42
State and City Property TaxesSame Regardless of County
State of Alabama➢ General State Fund
➢ Public Schools
➢ State Soldier
City of Madison➢ General City Tax
➢ Debt Service
➢ Library Tax
➢ City School Tax
Total 06.5 mills➢ 02.5 mills
➢ 03.0 mills
➢ 01.0 mills
Total 24.0 mills➢ 07.0 mills
➢ 05.5 mills
➢ 00.5 mills
➢ 11.0 mills
Madison City Homeowners Pay the Same Millage Rate in State
and City Ad Valorem Taxes
Source: Official Statements from Madison County Tax Assessor & Limestone County Revenue Commissioner

43
Property Taxes Differ at County Level
• Madison County➢ General Tax
➢ Roads & Bridges Tax
➢ County-Wide School
• Limestone County➢ General Tax
➢ Public Buildings Tax
➢ Public Health Tax
➢ County-Wide School
▪ Total 27.0 mills➢ 07.0 mills
➢ 04.0 mills
➢ 05.5 mills
➢ 10.5 mills
▪ Total 29.5 mills➢ 07.0 mills
➢ 03.5 mills
➢ 03.0 mills
➢ 05.5 mills
➢ 10.5 mills
• Different County
Tax Priorities
• Distribution IAW
Legal Agreement
Source: Official Statements from Madison County Tax Assessor & Limestone County Revenue Commissioner

Dollars & Cents Factoids• Historical Value of One Mill Ad Valorem in City of Madison:
• Of Madison’s Total City Revenue, 41% Comes from Sales Taxes & 16% of Those Sales Taxes Come from New Home Construction Building Materials (6.6% of Total Revenue)
• Madison Averages 38 Building Permits per Month & has 2,016 Approved Lots in Subdivisions un Development = 4.42 Years of Residential Construction
• Value of Real Property: Madison County = $563,383,960; Limestone County = $108,389,780. (Mad / Lim = ~5.2)
44
City of Madison: Value of One Mill Ad Valorem
YEAR Value % Delta YEAR VALUE % Delta
2012 $519,754 NA 2015 $558,617 0.1%
2013 $539,127 3.7% 2016 $577,972 3.5%
2014 $557,802 3.5% 2017 $589,985 2.1%

45
• Determine the number of mills of additional ad valorem tax necessary to meet identified needs.
• Coordinate with City Council to reach consensus on development of a proposal for the tax increase.
PreliminaryActivities
• City to provide ten (10) days’ notice of a public hearing on proposal to increase the rate of ad valorem taxation in the City.
• City conducts hearing and thereafter adopts a resolution proposing the tax increase for education and publication of the proposed legislation to approve the proposed tax increase.
PrepareLocal LegislationFor Introduction
Call and ConductProposed Tax Increase
Election
Public Hearingand Proposal
City CouncilLevies the
Tax increase
• Drafting and public advertisement of local legislation necessary to approve proposed increase.
• Detailed timeline to be provided when election date selected.
• Tax to be collected beginning October 2020.
Now Jan 2019 Feb 2019 Mar 2019 May 2019 Jul 2019 Mar 2020 May 2020
Legislature ApprovesLocal Legislation
Representative Property Tax Timeline

Estimating Additional Homeowner’s Property Tax
46
AssessedValue
1Mill 5Mill 10Mill 15Mill 20Mill 25Mill
$100K $10 $50 $100 $150 $200 $250$200K $20 $100 $200 $300 $400 $500$300K $30 $150 $300 $450 $600 $750$400K $40 $200 $400 $600 $800 $1,000
$500K $50 $250 $500 $750 $1,000 $1,250
IncreaseinAnnualPropertyTax(Homestead/Age/DisabilityExemptionsExcluded)
• Most Homeowners have one or More Exemptions which Reduce the Number in the Table
• Formula is 10% of Assessed Value Times the the Millage Value Divided by 1000.


