
mmmll
Optimal use of biogas from waste streams
An assessment of the potential of biogas from digestion in the EU beyond 2020
Optimal use of biogas from waste streams
March 2017 I 2
Optimal use of biogas from
waste streams
An assessment of the potential of biogas from digestion in the EU beyond 2020
CE Delft:
Bettina Kampman, Cor Leguijt, Thijs Scholten
Eclareon:
Jurga Tallat-Kelpsaite, Robert Brückmann, Georgios Maroulis
Wageningen Research:
Jan Peter Lesschen, Koen Meesters, Natasa Sikirica, Berien Elbersen
December 2016

Optimal use of biogas from waste streams
March 2017 I 3
Optimal use of biogas from waste streams
March 2017 I 4
Table of Contents
Table of Contents .............................................................................................. 4 Summary ......................................................................................................... 7 1 Introduction ............................................................................................... 15
Background of this study ....................................................................... 15 1.1
Objective and scope of this study ........................................................... 16 1.2
2 Biogas in the EU ......................................................................................... 17 Methodology and data sources ............................................................... 17 2.1
Current production and consumption ...................................................... 18 2.2
Current feedstock use ........................................................................... 20 2.3
Key drivers for biogas developments....................................................... 20 2.4
Key barriers to biogas growth ................................................................ 22 2.5
Biogas production technologies .............................................................. 29 2.6
Cost ................................................................................................... 30 2.7
Infrastructure ...................................................................................... 31 2.8
Inter-EU trade ..................................................................................... 31 2.9
3 Biogas policies ............................................................................................ 33 Key EU policies .................................................................................... 33 3.1
EU Policy outlook .................................................................................. 35 3.2
Member State support schemes ............................................................. 36 3.33.3.1 Electricity sector ............................................................................ 36
3.3.2 Heat sector .................................................................................... 38
3.3.3 Transport sector ............................................................................. 39
3.3.4 Significant variations in support policies and sustainability requirements 40
4 Biogas scenarios until 2030 .......................................................................... 42 Methodology ........................................................................................ 42 4.1
High level scenario design ..................................................................... 43 4.2
4.2.1 Main parameters to vary ................................................................. 43
4.2.2 Scenario 1: Local use + electricity .................................................... 46
4.2.3 Scenario 2: Local use + electricity, with accelerated deployment and
innovation .................................................................................................. 46
4.2.4 Scenario 3: Biomethane to grid ........................................................ 47
4.2.5 Scenario 4: Biomethane to grid, with accelerated deployment and innovation .................................................................................................. 48
Biogas model and scenario implementation ............................................. 49 4.34.3.1 Feedstock potentials ....................................................................... 50
4.3.2 Technologies ................................................................................. 53
4.3.3 Cost and GHG reduction calculations ................................................. 53
4.3.4 Learning curve: cost reduce over time, and process efficiencies increase 54
4.3.5 Fuels replaced................................................................................ 55
Key output from the modelling ............................................................... 56 4.4
5 Scenario evaluation ..................................................................................... 57 Biogas production volume potential ........................................................ 57 5.1
Production costs of biogas ..................................................................... 59 5.2

Optimal use of biogas from waste streams
March 2017 I 5
Production costs of bio-electricity (from CHP) and of biomethane ............... 61 5.3
Greenhouse gas emission reduction potentials ......................................... 63 5.4
Cost-effectiveness ................................................................................ 65 5.5
Fossil fuels and electricity production replaced ......................................... 67 5.6
Biogas contribution to RES deployment in the EU ..................................... 68 5.7
Variation of maize/manure ratio in co-digestion ....................................... 69 5.8
Other effects ........................................................................................ 70 5.95.9.1 Impacts on other sectors ................................................................. 70
5.9.2 Resource efficiency incl. energy efficiency and land use ...................... 71
5.9.3 Air quality ..................................................................................... 72
Beyond current technologies .................................................................. 72 5.105.10.1 Examples of innovations in biogas/biomethane production................... 73
5.10.2 Gasification ................................................................................... 75
5.10.3 Power to gas ................................................................................. 75
6 Policy recommendations .............................................................................. 77 General policy recommendations ............................................................ 77 6.1
EU policy recommendations ................................................................... 78 6.26.2.1 General ......................................................................................... 78
6.2.2 Renewable energy policies and targets .............................................. 79
6.2.3 Sustainability criteria ...................................................................... 80
6.2.4 Heat ............................................................................................. 80
6.2.5 Agriculture .................................................................................... 81
6.2.6 Waste and circular economy ............................................................ 82
6.2.7 Biomethane: grid access and trade ................................................... 83
6.2.8 Dissemination and Innovation .......................................................... 85
Member State recommendations ............................................................ 85 6.3
6.3.1 Strategy Development .................................................................... 85
6.3.2 Biogas production and demand support policies ................................. 86
6.3.3 Support use of residual heat ............................................................ 88
6.3.4 Agriculture .................................................................................... 88
6.3.5 Waste and circular economy policies ................................................. 89
6.3.6 Biomethane: grid access and trade ................................................... 89
6.3.7 Regional opportunities .................................................................... 90
6.3.8 Dissemination and information ......................................................... 90
7 Conclusions and recommendations ................................................................ 91 Main conclusions .................................................................................. 91 7.1
7.1.1 Current status of biogas in the EU .................................................... 91
7.1.2 Biogas polices in the EU and Member States ...................................... 93
7.1.3 Scenarios for biogas development beyond 2020 ................................. 94
Main policy recommendations ................................................................ 96 7.2
EU level recommendations .................................................................... 96 7.3
National recommendations .................................................................... 98 7.4
8 References ............................................................................................... 100 Appendix A Country factsheets .................................................................... 105
Optimal use of biogas from waste streams
March 2017 I 6
Appendix A.1 Austria .................................................................................. 105 Appendix A.2 Belgium ................................................................................ 107 Appendix A.3 Bulgaria ................................................................................ 109 Appendix A.4 Croatia ................................................................................. 111 Appendix A.5 Cyprus .................................................................................. 113 Appendix A.6 Czech Republic ...................................................................... 114 Appendix A.7 Denmark ............................................................................... 115 Appendix A.8 Estonia ................................................................................. 117 Appendix A.9 Finland ................................................................................. 119 Appendix A.10 France ................................................................................ 121 Appendix A.11 Germany ............................................................................. 123 Appendix A.12 Greece ................................................................................ 125 Appendix A.13 Hungary .............................................................................. 127 Appendix A.14 Ireland ................................................................................ 128 Appendix A.15 Italy ................................................................................... 130 Appendix A.16 Latvia ................................................................................. 132 Appendix A.17 Lithuania ............................................................................. 133 Appendix A.18 Luxembourg ........................................................................ 135 Appendix A.19 Malta .................................................................................. 137 Appendix A.20 The Netherlands ................................................................... 137 Appendix A.21 Poland ................................................................................ 139 Appendix A.22 Portugal .............................................................................. 141 Appendix A.23 Romania .............................................................................. 143 Appendix A.24 Slovakia .............................................................................. 145 Appendix A.25 Slovenia .............................................................................. 146 Appendix A.26 Spain .................................................................................. 148 Appendix A.27 Sweden ............................................................................... 150 Appendix A.28 United Kingdom ................................................................... 152
Appendix B Assumptions and references biogas model ................................... 155 Appendix B.1 Technologies ......................................................................... 155 Appendix B.2 Important assumptions regarding feedstock deployment ............. 157 Appendix B.3 New capacity ......................................................................... 158

Optimal use of biogas from waste streams
March 2017 I 7
Summary
Introduction
Biogas can be produced from a range of feedstocks and utilised in all energy sectors,
contributing to the EU’s decarbonisation, renewable energy and energy security
objectives. Current (2014) biogas production level in the EU is almost 15 Mtoe, which
represents about 7.6% of all primary renewable energy production in the EU.
Differences between Member States are, however, very significant: only three Member
States (Germany, United Kingdom and Italy) are currently responsible for more than
77% of the EU’s biogas production. This biogas is mostly used for electricity
production, followed by heat production and use as a transport fuel.
As the European Commission is working on the further development and
concretisation of the post-2020 climate and energy policies, this study was
commissioned to zoom in on the potential role, cost and benefits of biogas, and to
assess the key barriers and drivers of biogas deployment in the EU. An important
question to address was what policies at both EU and Member State level can best
contribute to the effective and efficient growth of biogas deployment in the EU.
The study focussed on biogas production by digestion processes of local waste
streams, i.e. on biogas production from sewage sludge, landfill gas and from suitable
organic waste streams from agriculture, the food industry and households. Gasification
of biomass, renewable methane production via power to gas or increasing mono-
digestion of energy crops were considered outside the focus of the study and were not
included in the scenario modelling part of this study.
The research was carried out through desktop research and quantitative modelling,
with strong support and involvement by stakeholders. Interviews were held with
stakeholders from all Member States, and two stakeholder workshops were held
during the course of this project to validate the research approach and key findings.
Biogas in the EU
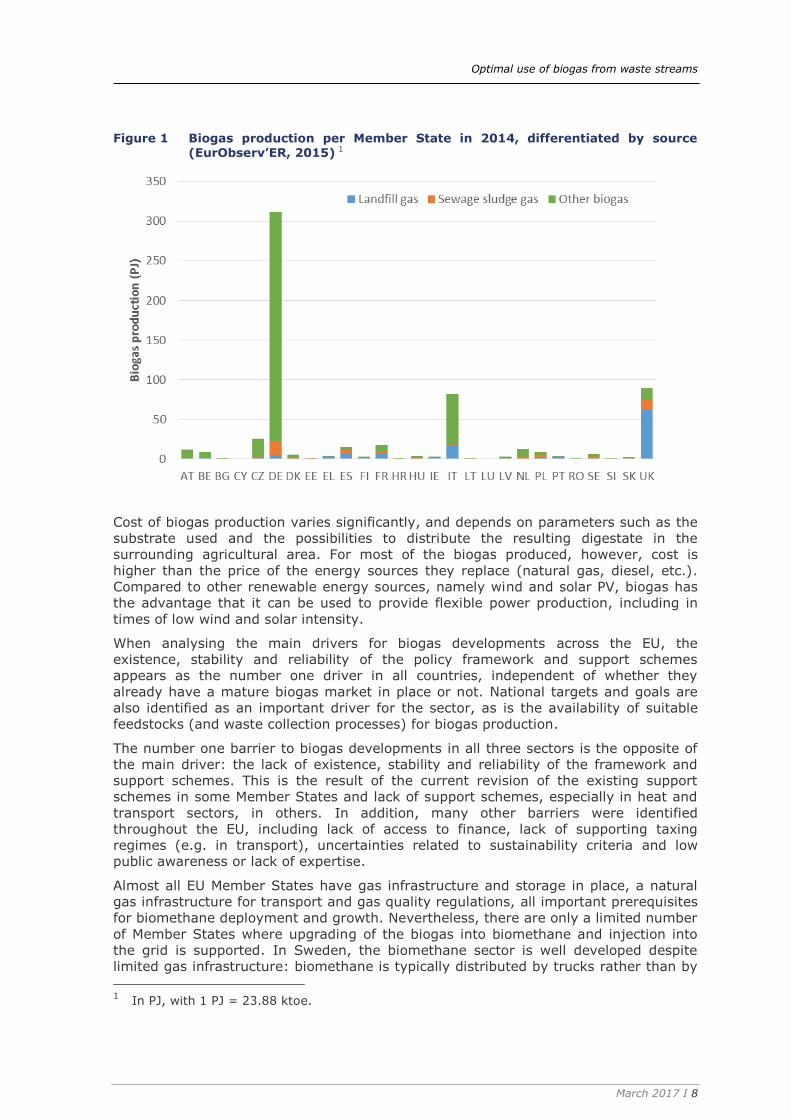
The most recent data (2014) on biogas production per Member State, differentiated by
source, is shown in Figure 5. Germany is by far the largest producer of biogas (311 PJ,
7.4 Mtoe) in the EU - 50% of the EU28 total - followed by Italy and the United
Kingdom. Looking at the contribution of different feedstocks, biogas from sewage
sludge had a share of 9%, landfill 18% and 72% of the biogas was produced in other
digesters, mainly farm-based plants and some industrial organic waste digesters.
Most of the biogas is used for electricity production (62%) followed by heat (27%).
Biomethane, for direct use in the transport sector or injected into the grid to be used
in the built environment or in transport, contributes to about 11% of generated energy
from biogas. Upgrading of biogas to biomethane has a substantial percentage of the
use of biogas in Sweden, the Netherlands and Germany only. Energy crops (mainly
maize) provide about half of the biogas production, followed by landfill, organic waste
(including municipal waste), sewage sludge and manure.
Optimal use of biogas from waste streams
March 2017 I 8
Figure 1 Biogas production per Member State in 2014, differentiated by source (EurObserv’ER, 2015) 1
Cost of biogas production varies significantly, and depends on parameters such as the
substrate used and the possibilities to distribute the resulting digestate in the
surrounding agricultural area. For most of the biogas produced, however, cost is
higher than the price of the energy sources they replace (natural gas, diesel, etc.).
Compared to other renewable energy sources, namely wind and solar PV, biogas has
the advantage that it can be used to provide flexible power production, including in
times of low wind and solar intensity.
When analysing the main drivers for biogas developments across the EU, the
existence, stability and reliability of the policy framework and support schemes
appears as the number one driver in all countries, independent of whether they
already have a mature biogas market in place or not. National targets and goals are
also identified as an important driver for the sector, as is the availability of suitable
feedstocks (and waste collection processes) for biogas production.
The number one barrier to biogas developments in all three sectors is the opposite of
the main driver: the lack of existence, stability and reliability of the framework and
support schemes. This is the result of the current revision of the existing support
schemes in some Member States and lack of support schemes, especially in heat and
transport sectors, in others. In addition, many other barriers were identified
throughout the EU, including lack of access to finance, lack of supporting taxing
regimes (e.g. in transport), uncertainties related to sustainability criteria and low
public awareness or lack of expertise.
Almost all EU Member States have gas infrastructure and storage in place, a natural
gas infrastructure for transport and gas quality regulations, all important prerequisites
for biomethane deployment and growth. Nevertheless, there are only a limited number
of Member States where upgrading of the biogas into biomethane and injection into
the grid is supported. In Sweden, the biomethane sector is well developed despite
limited gas infrastructure: biomethane is typically distributed by trucks rather than by
1 In PJ, with 1 PJ = 23.88 ktoe.
Optimal use of biogas from waste streams
March 2017 I 9
the grid. Cross-border biomethane trade is ongoing between some countries but is still
very limited and hampered by issues such as country specific quality requirements and
lack of harmonised traceability requirements.
Biogas polices in the EU and Member States
A wide range of EU policies are relevant to biogas and biomethane developments,
including directives and communications on climate change, renewable energy,
transport, agriculture, waste, state aid and natural gas. Many of these are currently
being revised or further developed, creating an uncertainty in the market. Because of
the importance of effective and stable policy support for biogas deployment and
investments, the regulations and communications for the period after 2020 are
expected to be crucial to the longer term developments of biogas in the EU.
Looking at the policies on national level, a large variety of support policies for biogas
and biomethane is currently in place and there is still a lack of effective support
schemes in many Member States. The survey conducted as part of this study indicated
a clear correlation between the financial incentives in place and the way biogas is
deployed in the Member States. Biogas is mainly supported in the electricity sector,
while support for biomethane has its focus on the transport sector.
An overview of the biogas status and policies in each Member State is provided in an
Annex of the report.
Growth scenarios for biogas deployment until 2030
In this study, four scenarios covering the playing field of possible biogas development
in 2030 were designed and assessed; all based on the presumption that digestion of
local biomass waste streams increases towards the total biogas potential that was
identified, in all Member States. As shown in the overview of Table 1, the key
parameters that were varied in these scenarios were
1. End-use of the biogas: local use in a cogeneration unit (CHP) or upgraded to
biomethane for use in transport or heating.
2. Rate of biogas production increase and innovation.
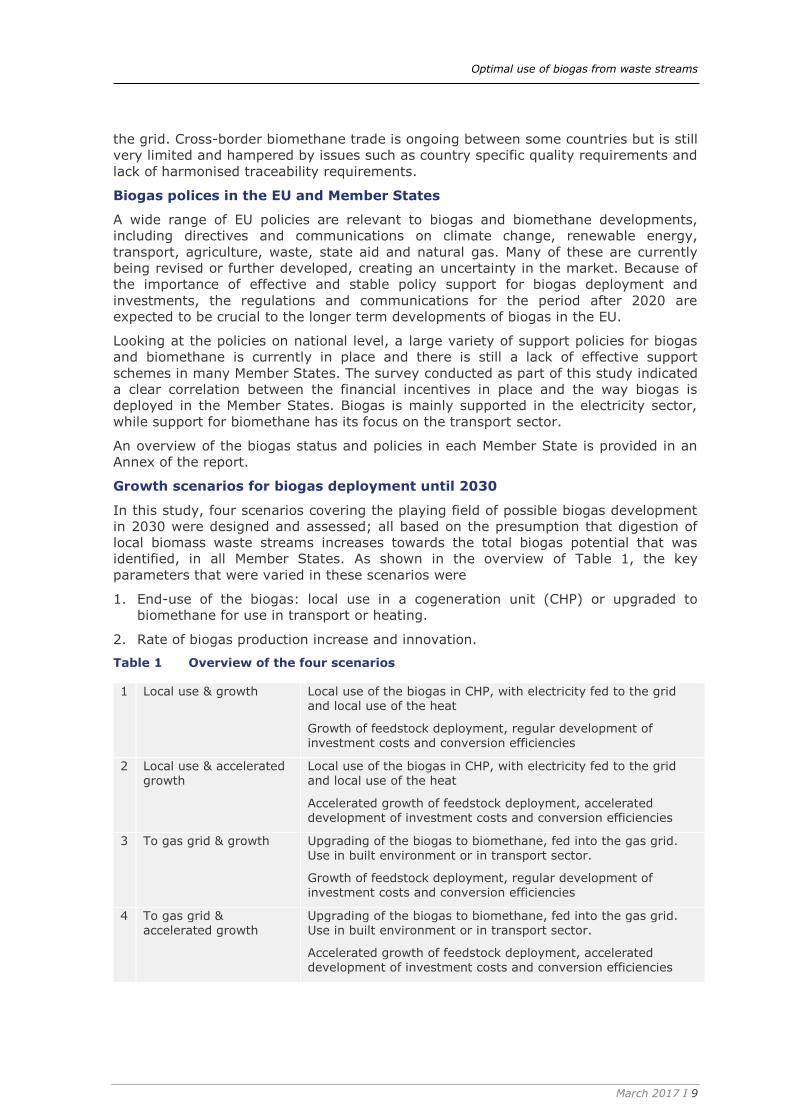
Table 1 Overview of the four scenarios
1 Local use & growth Local use of the biogas in CHP, with electricity fed to the grid and local use of the heat
Growth of feedstock deployment, regular development of investment costs and conversion efficiencies
2 Local use & accelerated growth
Local use of the biogas in CHP, with electricity fed to the grid and local use of the heat
Accelerated growth of feedstock deployment, accelerated development of investment costs and conversion efficiencies
3 To gas grid & growth Upgrading of the biogas to biomethane, fed into the gas grid. Use in built environment or in transport sector.
Growth of feedstock deployment, regular development of investment costs and conversion efficiencies
4 To gas grid & accelerated growth
Upgrading of the biogas to biomethane, fed into the gas grid. Use in built environment or in transport sector.
Accelerated growth of feedstock deployment, accelerated development of investment costs and conversion efficiencies
Optimal use of biogas from waste streams
March 2017 I 10
With the focus of the study on biogas production by digestion processes of local waste
streams, the increased feedstock deployment in these scenarios refers to improved
collection and use of available organic waste streams suitable for these processes.
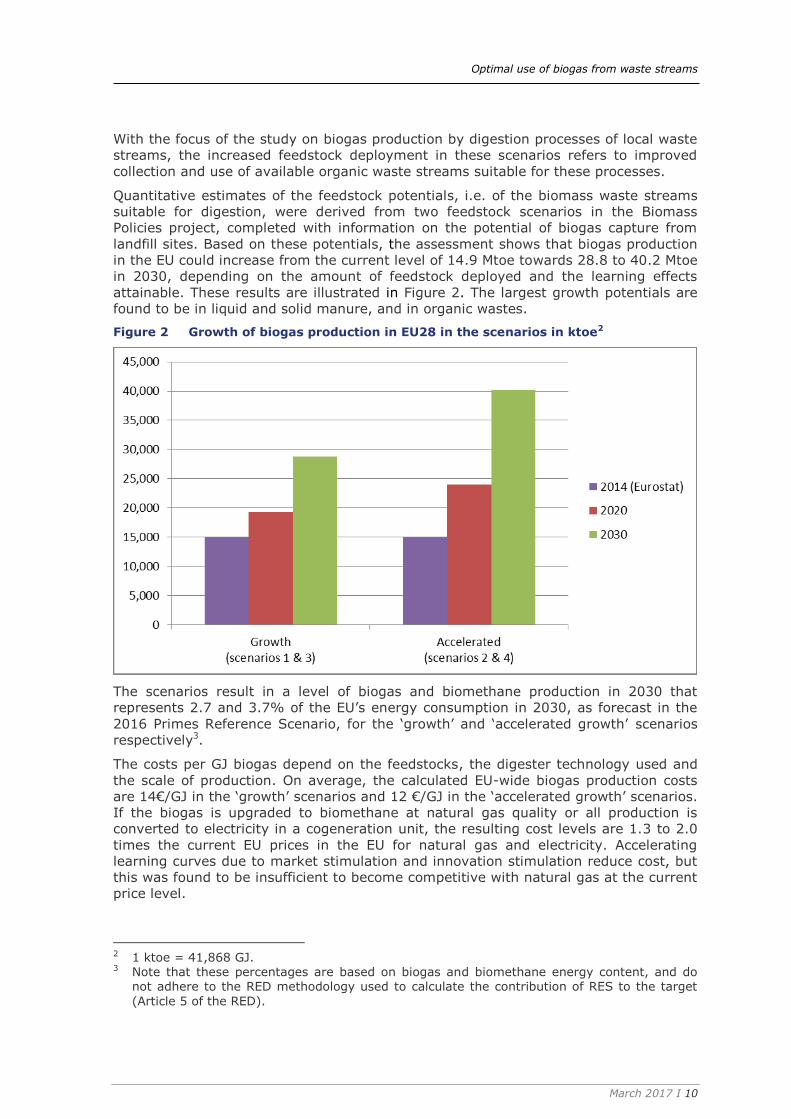
Quantitative estimates of the feedstock potentials, i.e. of the biomass waste streams
suitable for digestion, were derived from two feedstock scenarios in the Biomass
Policies project, completed with information on the potential of biogas capture from
landfill sites. Based on these potentials, the assessment shows that biogas production
in the EU could increase from the current level of 14.9 Mtoe towards 28.8 to 40.2 Mtoe
in 2030, depending on the amount of feedstock deployed and the learning effects
attainable. These results are illustrated in Figure 2. The largest growth potentials are
found to be in liquid and solid manure, and in organic wastes.
Figure 2 Growth of biogas production in EU28 in the scenarios in ktoe2
The scenarios result in a level of biogas and biomethane production in 2030 that
represents 2.7 and 3.7% of the EU’s energy consumption in 2030, as forecast in the
2016 Primes Reference Scenario, for the ‘growth’ and ‘accelerated growth’ scenarios
respectively3.
The costs per GJ biogas depend on the feedstocks, the digester technology used and
the scale of production. On average, the calculated EU-wide biogas production costs
are 14€/GJ in the ‘growth’ scenarios and 12 €/GJ in the ‘accelerated growth’ scenarios.
If the biogas is upgraded to biomethane at natural gas quality or all production is
converted to electricity in a cogeneration unit, the resulting cost levels are 1.3 to 2.0
times the current EU prices in the EU for natural gas and electricity. Accelerating
learning curves due to market stimulation and innovation stimulation reduce cost, but
this was found to be insufficient to become competitive with natural gas at the current
price level.
2 1 ktoe = 41,868 GJ. 3 Note that these percentages are based on biogas and biomethane energy content, and do
not adhere to the RED methodology used to calculate the contribution of RES to the target
(Article 5 of the RED).
Optimal use of biogas from waste streams
March 2017 I 11
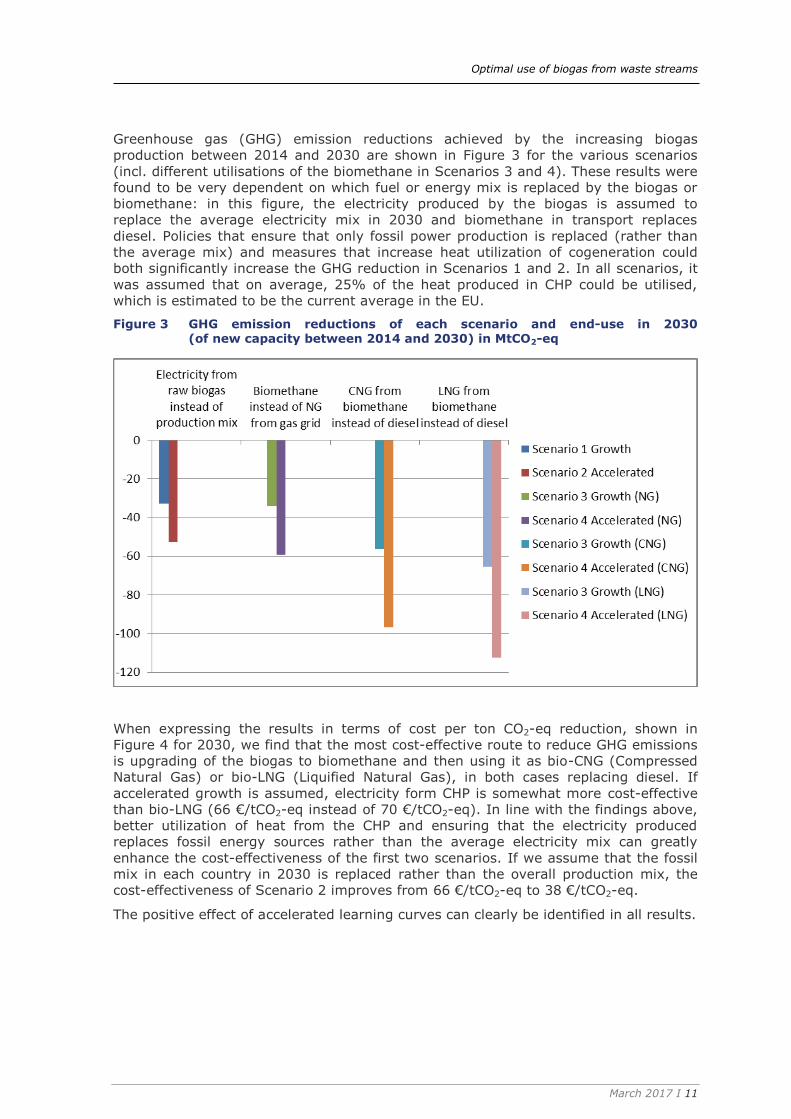
Greenhouse gas (GHG) emission reductions achieved by the increasing biogas
production between 2014 and 2030 are shown in Figure 3 for the various scenarios
(incl. different utilisations of the biomethane in Scenarios 3 and 4). These results were
found to be very dependent on which fuel or energy mix is replaced by the biogas or
biomethane: in this figure, the electricity produced by the biogas is assumed to
replace the average electricity mix in 2030 and biomethane in transport replaces
diesel. Policies that ensure that only fossil power production is replaced (rather than
the average mix) and measures that increase heat utilization of cogeneration could
both significantly increase the GHG reduction in Scenarios 1 and 2. In all scenarios, it
was assumed that on average, 25% of the heat produced in CHP could be utilised,
which is estimated to be the current average in the EU.
Figure 3 GHG emission reductions of each scenario and end-use in 2030 (of new capacity between 2014 and 2030) in MtCO2-eq
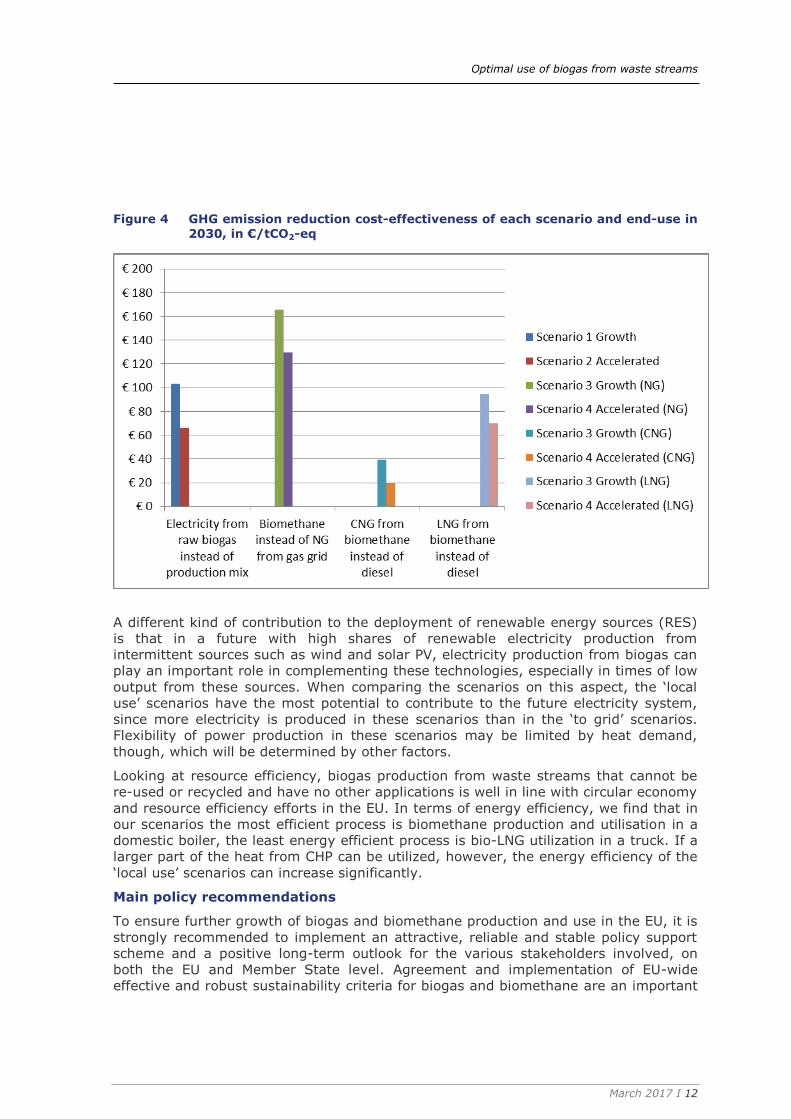
When expressing the results in terms of cost per ton CO2-eq reduction, shown in
Figure 4 for 2030, we find that the most cost-effective route to reduce GHG emissions
is upgrading of the biogas to biomethane and then using it as bio-CNG (Compressed
Natural Gas) or bio-LNG (Liquified Natural Gas), in both cases replacing diesel. If
accelerated growth is assumed, electricity form CHP is somewhat more cost-effective
than bio-LNG (66 €/tCO2-eq instead of 70 €/tCO2-eq). In line with the findings above,
better utilization of heat from the CHP and ensuring that the electricity produced
replaces fossil energy sources rather than the average electricity mix can greatly
enhance the cost-effectiveness of the first two scenarios. If we assume that the fossil
mix in each country in 2030 is replaced rather than the overall production mix, the
cost-effectiveness of Scenario 2 improves from 66 €/tCO2-eq to 38 €/tCO2-eq.
The positive effect of accelerated learning curves can clearly be identified in all results.
Optimal use of biogas from waste streams
March 2017 I 12
Figure 4 GHG emission reduction cost-effectiveness of each scenario and end-use in
2030, in €/tCO2-eq
A different kind of contribution to the deployment of renewable energy sources (RES)
is that in a future with high shares of renewable electricity production from
intermittent sources such as wind and solar PV, electricity production from biogas can
play an important role in complementing these technologies, especially in times of low
output from these sources. When comparing the scenarios on this aspect, the ‘local
use’ scenarios have the most potential to contribute to the future electricity system,
since more electricity is produced in these scenarios than in the ‘to grid’ scenarios.
Flexibility of power production in these scenarios may be limited by heat demand,
though, which will be determined by other factors.
Looking at resource efficiency, biogas production from waste streams that cannot be
re-used or recycled and have no other applications is well in line with circular economy
and resource efficiency efforts in the EU. In terms of energy efficiency, we find that in
our scenarios the most efficient process is biomethane production and utilisation in a
domestic boiler, the least energy efficient process is bio-LNG utilization in a truck. If a
larger part of the heat from CHP can be utilized, however, the energy efficiency of the
‘local use’ scenarios can increase significantly.
Main policy recommendations
To ensure further growth of biogas and biomethane production and use in the EU, it is
strongly recommended to implement an attractive, reliable and stable policy support
scheme and a positive long-term outlook for the various stakeholders involved, on
both the EU and Member State level. Agreement and implementation of EU-wide
effective and robust sustainability criteria for biogas and biomethane are an important

Optimal use of biogas from waste streams
March 2017 I 13
essential part of this policy package, as well as ambitious climate and renewable
energy targets for 2030 (and beyond).
EU level recommendations
On EU level, harmonisation of developments and facilitation of biomethane cross-
border trade would support further growth of biogas and biomethane production and
use. EU-wide technical standards and sustainability criteria, as well as harmonization
of (administrative) data transfer are key enablers for cross-border trade.
Increasing the use of biomethane as a means to decarbonise the EU transport sector
also requires increased shares of (natural) gas vehicles and a network of CNG and/or
LNG filling stations. This involves coherence of a range of EU level policies, including
the Renewable Energy Directive (2009/28/EC)RED, the Fuel Quality Directive
(2009/30/EC) FQD and the Clean Power for Transport Directive (2014/94/EU).
Implementation of an EU-wide system of Guarantees of Origin (GoO) for biomethane
can facilitate administrative trade of the biomethane and improve disclosure and
transparency.
It is furthermore recommended to encourage Member States to decarbonise heating
further in the EU’s energy policies. Strengthening incentives to use the heat from
biogas in a CHP can increase GHG savings, increase the share of RES in heating and
improve energy efficiency. Looking at agricultural policies, it is recommended to
differentiate the requirements regarding the use of digestate in the Nitrates Directive
(91/676/EEC), based on the share of manure in the feedstock and the nitrogen
content of the digestate. EU-wide harmonisation of regulations regarding which co-
substrates are allowed in anaerobic digestion, preferably in the form of sustainability
criteria for biogas and biomethane, would support the further development of the EU
internal market of biogas and biomethane. It is also recommended to ensure
compliance with the waste and landfill directives throughout the EU, and to encourage
Member States to implement separate collection systems for organic waste streams, if
they do not yet have this in place.
Since innovation of the biogas chain can have a range of benefits (e.g. cost reduction,
increased GHG savings), continued efforts into R&D of biogas production, conversion
into biomethane and the application of biogas are recommended. EU-wide
dissemination of biogas-related knowledge and expertise can be improved by setting
up a platform for best practices related to biogas production technologies, applications
and policies, targeted at farmers, economic actors, municipalities and policy decision
makers.
Member State recommendations
Because of the importance of stable and effective Member State policy support for
biogas projects and investments, Member States are recommended to develop
national strategies for the role of biogas and biomethane to meet future renewable
energy and climate goals. This should include an assessment of available organic
waste streams that could be suitable feedstocks for biogas production, and establish
an outlook for improved waste collection (where relevant) and potential
biogas/biomethane production and use. The strategies should take into account
related policy areas that may benefit such as agriculture, rural development, waste
and circular economy.
Based on this strategy, stable and effective renewable energy targets for 2030 and
long-term, stable support policies can be implemented. These policies should include
effective and stable minimum sustainability criteria in line with the EU criteria that will
be decided on in the coming years. Specific RES targets and support policies for the
various sectors can increase investment security; a further differentiation of policy
incentives to the sustainability of the renewable energy (e.g. GHG savings) can
Optimal use of biogas from waste streams
March 2017 I 14
enhance focus of efforts and investments towards the most sustainable options. In
addition, different policy packages are needed for different applications of the biogas
and biomethane. Member States can thus design and implement a coherent and
integrated policy package that suits national priorities and opportunities.
Member States that do not yet have sufficient support policies in place should focus
their efforts on the mobilization of agricultural manure and residue streams since this
feedstock category has the largest potential for growth. Integration of the biogas
sector as a part of sustainable agriculture may provide opportunities to optimise
prevention of GHG emissions from manure storage and wastes and to increase the use
of biogas co-products for improved soil management. Member States should
furthermore ensure compliance with the waste and landfill directives, including the
provisions on bio-waste. It is also recommended to assess whether the administrative
procedures and technical rules for biogas and biomethane projects create unnecessary
barriers and can be improved. Improving incentives or regulations to increase the use
of heat from CHP can increase both the GHG savings from the biogas and the share of
RES in the heating sector.
If a Member States chooses to support biomethane for heating or in transport to
increase the share of renewables in these sectors and/or increase demand for biogas,
financial support to connect biomethane plants to the grid may be necessary. If grid
expansion is required, this should be assessed as part of a broader national gas
strategy and grid development plan, to identify cost-effective projects. A national
registry for biogas Guarantees of Origin can be set up to oversee the issuing,
administration and cancellation of GoOs and facilitate transparency and cross-border
trade, if Member States do not yet have this in place.
Regions and municipalities are also recommended to assess their potential biogas
sources as well as options to develop these opportunities. These can contribute to
their energy independence and rural development, increase the share of locally
produced renewable energy, and, at the same time, reduce environmental impact of
waste streams.
On both national and regional level, attention should be given to knowledge transfer
and raising awareness regarding the available benefits of biogas production and
usage, especially in Member States where biogas markets are still immature. Potential
producers and users can be informed directly; best practices can be advertised, etc.
Adequate communication with the public and NGOs should be organised to ensure
public support of the developments.

Optimal use of biogas from waste streams
March 2017 I 15
1 Introduction
Background of this study 1.1
Biogas is a very versatile form of bioenergy, as it can be produced from a range of
feedstocks and utilised in all energy sectors: for electricity production, heat and
cooling and in transport. This biogas production and use contributes to the EU’s
decarbonisation, renewable energy and energy security objectives.
Due to successful policies in various Member States, EU-wide biogas production
increased rapidly in recent years. However, as some of these policies were modified
and incentives reduced, this level of growth may not be sustained in the coming years.
At the same time, the differences between Member States are significant, in many
respects: feedstock potential, current biogas production levels and policies. Only three
Member States (Germany, the United Kingdom and Italy) are currently responsible for
more than 77% of the EU’s biogas production.
Current (2014) biogas production level in the EU is 14.9 Mtoe4, which represents
about 7.6% of all primary renewable energy production in the EU.
Almost 10% of this biogas is produced by wastewater treatment plants, about 21% is landfill biogas and the remainder, 69%, is biogas produced by anaerobic digestion of feedstock such as agricultural, industry or household waste and energy crops.
This biogas is mostly used for renewable electricity production, followed by heat
production and use as a transport fuel.
As the Commission is working on the further development and concretisation of the
post-2020 climate and energy policies, there is a need to zoom in on the potential
role, cost and benefits of biogas, and to assess the key barriers and drivers of biogas
deployment. An important question in this respect is what policies at both EU and
Member State level can best contribute to the effective and efficient growth of biogas
deployment in the EU.
To answer these questions, a project was commissioned by the European Commission,
DG Energy, and carried out by a consortium of CE Delft, Eclareon and Wageningen
Research (Wageningen Environmental Research and Wageningen Food & Biobased
Research). The project was divided into three Tasks:
1. The first Task was a stock-taking and information collection exercise which
resulted in a comprehensive overview of the biogas sector in the EU, the support
policies in place in the Member States, key drivers and barriers, etc. The results of
this task can be found mainly in Chapters 2 and 3 and in Appendix A.
2. In the second Task, a number of biogas scenarios were developed, as well as a
model that could quantify the effects and impacts of these scenarios. These
scenarios covered all 28 EU Member States and focus on the timeframe 2014-
2030. The results of this part are described in Chapter 4.
3. In the third and final Task, the effects of the scenarios are evaluated and analysed.
In addition, policy recommendations are developed based on the results of this
study, focussing on EU level policies but also including a number of general
recommendations for Member State policies. The scenario evaluation can be found
in Chapter 5, policy recommendations in Chapter 6.
4 2014 primary energy data, Eurostat data.
Optimal use of biogas from waste streams
March 2017 I 16
The main conclusions from the various Tasks and the key recommendations for both
the EU and Member States are gathered in Chapter 7.
The research was carried out through desktop research and quantitative modelling,
with strong support and involvement by stakeholders. Interviews were held with
stakeholders from all Member States as part of the first Task, and two stakeholder
workshops were organised during the course of this project to validate the research
approach, the key results and resulting recommendations.
Objective and scope of this study 1.2
This study had the following objectives.
to provide an up-to-date overview of projections of the EU biogas (including
biomethane) potentials for 2020 and 2030 in the electricity, heating and transport
sectors;
to identify its possible contribution to EU objectives in the field of climate change
mitigation, energy security and resource efficiency;
to identify existing technical, economic and administrative barriers to further
development of biogas;
to discuss options for policy action on EU level needed to overcome the identified
barriers.
The scope of the study is the EU28, and the analysis was carried out both on Member
State and EU level. The study focus was the period until 2030, although the longer
term EU climate objectives and potential energy developments were taken into
account when developing the scenarios and policy recommendations.
The study focussed on biogas production by digestion processes of local waste
streams, i.e. on biogas production from landfill gas, sewage sludge and from suitable
organic waste streams from agriculture, the food industry and households.
Within this scope, it includes all biogas- and biomethane-to-energy routes, covering
the various conversion technologies and energy applications as far as considered
feasible until 2030.

Optimal use of biogas from waste streams
March 2017 I 17
2 Biogas in the EU
The following chapter provides an overview of the key findings of Task 1 of the study,
the stock-taking exercise. The chapter first describes the data gathering methodology
used, and then summarizes our findings on the biogas and biomethane state of play
throughout the EU for a wide range of topics:
current production;
current feedstock use;
key drivers;
key barriers;
biogas production technologies;
cost;
infrastructure;
inter-EU trade;
An overview of relevant EU policies and Member State support schemes is presented
in the following chapter.
More detailed information per Member State can be found in the concise country
factsheets that are included in Appendix A of this report. These factsheets were based
on comprehensive Member State reports that were drafted for this study (not included
in this report).
Methodology and data sources 2.1
The following research techniques were deployed in this stock-taking task:
research of primary (e.g. laws and documentations of legal processes) and
secondary (e.g. policy reports and plans, policy and technical databases, articles,
presentations, specific news-websites and blogs) sources;
stakeholder interviews at Member State and EU level;
A Stakeholder Workshop in Brussels targeted at biogas experts at national and EU
level.
The first step was the research of primary and secondary sources. A large part of this
work focused on Member State sources, but some aspects were mainly covered using
EU level sources, to allow comparison of data. For example, since the market situation
for biogas in the individual Member States varies, the project team focused on
centralized data as far as technical data was concerned. This mainly covered
feedstock-related issues as well as current production levels. The centralized data was
mainly collected from the deliverables under the Biomass Policies project (Elbersen,
2016), the Biomethane & Biogas Report drafted by the European Biogas Association
(EBA) in 2015 (EBA, 2015), data on supply transformation and consumption of
renewable energies from Eurostat (Eurostat, 2016) and data on renewable energies
and biogas from EurObserv’ER (EurObserv’ER, 2015) (EurObserv'ER, 2014). For the
remaining issues the focus was on the national sources of information.
In a second step, to gather additional information, but also to fill the gaps in the
desktop research, phone interviews have been conducted with the national
stakeholders in all EU Member States. For the identification of the stakeholders at
national level, the project team looked at biogas associations and farming
associations, national and selected regional ministries, biogas research institutions and
environmental associations.
Optimal use of biogas from waste streams
March 2017 I 18
To gather objective and reliable data, 1-3 stakeholders per Member State have been
interviewed. The selected stakeholders were also requested to review the desktop
research results, since one of the key objectives of the interviews was to validate the
first research results. In addition, certain qualitative issues have been discussed with
the national experts (e.g. barriers and drivers, feedstock availability, effectiveness of
the supporting policies in place, relevant planned policy amendments, etc.) Some
questions were formulated to provide further input for scenario development in
Task 2.
The data collected through desktop research and stakeholder interviews has been
revised in a three step information revision process:
internal revision at each partner by experienced senior members;
revision through partners;
feedback from biogas experts at national level.
In a final step, the structured and categorized research results were presented to the
experts at the first of the two planned stakeholder workshops, in May 2016. In
addition, research results have been circulated through an extensive network of
experts to gather the feedback on the results before data is being processed and
analysed for the Task 2 “Building biogas scenarios”.
Current production and consumption 2.2
The current (2014, the most recent data available) production of biogas in the EU is
obtained from three sources: The European Biogas Association, EuroObserv’Er and
Eurostat. The Eurostat and EuroObserv’Er data were very similar, whereas the data
from the European Biogas Association was lower for some Member States, probably
due to incomplete coverage of all biogas producers. Using the Eurostat data, we find
that the total biogas production in 2014 was 625 PJ (14.9 Mtoe), with only 167 PJ
(4.0 Mtoe) of biogas production in 20055. Biogas accounted for 7.6% of the total
primary production from Renewable Energy Sources (RES) in 2014.
The total biogas production per Member State, differentiated by source, is shown in
Figure 5. Germany is by far the largest producer of biogas (311 PJ, or 7.4 Mtoe) in the
EU which is 50% of the EU28 total, followed by Italy and the United Kingdom (UK).
Biogas from landfill had a share of 18%, sewage sludge 9%, whereas 72% of the
biogas was produced in other digesters, mainly farm-based plants and some industrial
organic waste digesters. Biogas production from landfill is relatively high in the United
Kingdom, but this is expected to decrease in the near future as the share of waste
deposited in landfill sites decreases and biogas production from existing land sites will
decline over time.
5 In this report, biogas production data are given in terms of energy content. This can be
converted to volume by taking into account the energy density of the gas, in terms of MJ/Nm3, which depends on the methane content of the biogas. For example: Biogas: 23.9 MJ/Nm3; Landfill gas: 22.3 MJ/Nm3; Biomethane: 38.9 MJ/Nm3 (all based on higher
heating value).

Optimal use of biogas from waste streams
March 2017 I 19
Figure 5 Biogas production per Member State in 2014, differentiated by source (EurObserv’ER, 2015)
Figure 6 shows the current use of biogas, expressed in share of final energy produced.
Most of the biogas is used for electricity (62%) followed by heat (27%). Biomethane,
for direct use in the transport sector or injected into the grid to be used in the build
environment (for heating or cooking mainly) or in transport, contributes to about 11%
of generated energy from biogas. Upgrading of biogas to biomethane is important in
Sweden, the Netherlands and Germany; although in absolute terms Germany
produces by far the largest amount (33 PJ or 788 ktoe of biomethane). Biogas
consumption data per sector is available from Eurostat statistics, but for many
countries the data is not complete or included in the category non-specified. According
to these data most is used in the sector Services, followed by Industry and
Agriculture.
Figure 6 Generated energy from biogas per Member State (EBA, 2015)
Optimal use of biogas from waste streams
March 2017 I 20
Current feedstock use 2.3
Information on feedstock use for biogas is often not easy to obtain, as this is not
centrally registered, and its use is rather variable over time due to changes in
feedstock prices and legislation. Based on data from three EU sources (EBA, 2015; DG
Environment survey, 2011; Pedroli et al., 2011) and few national data, we made an
estimate of the current feedstock use and quantified these based on the 2014 biogas
production from the EuroObserv’Er data, as these data distinguish between landfill,
sewage sludge and other biogas production.
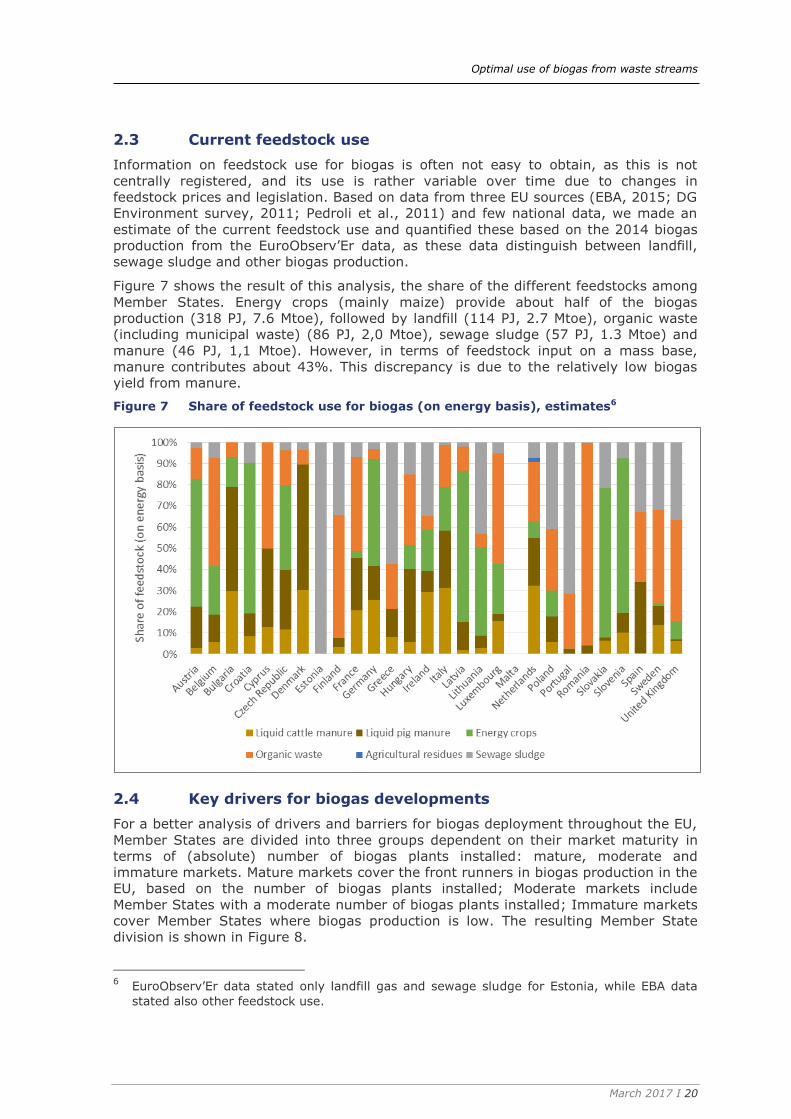
Figure 7 shows the result of this analysis, the share of the different feedstocks among
Member States. Energy crops (mainly maize) provide about half of the biogas
production (318 PJ, 7.6 Mtoe), followed by landfill (114 PJ, 2.7 Mtoe), organic waste
(including municipal waste) (86 PJ, 2,0 Mtoe), sewage sludge (57 PJ, 1.3 Mtoe) and
manure (46 PJ, 1,1 Mtoe). However, in terms of feedstock input on a mass base,
manure contributes about 43%. This discrepancy is due to the relatively low biogas
yield from manure.
Figure 7 Share of feedstock use for biogas (on energy basis), estimates6
Key drivers for biogas developments 2.4
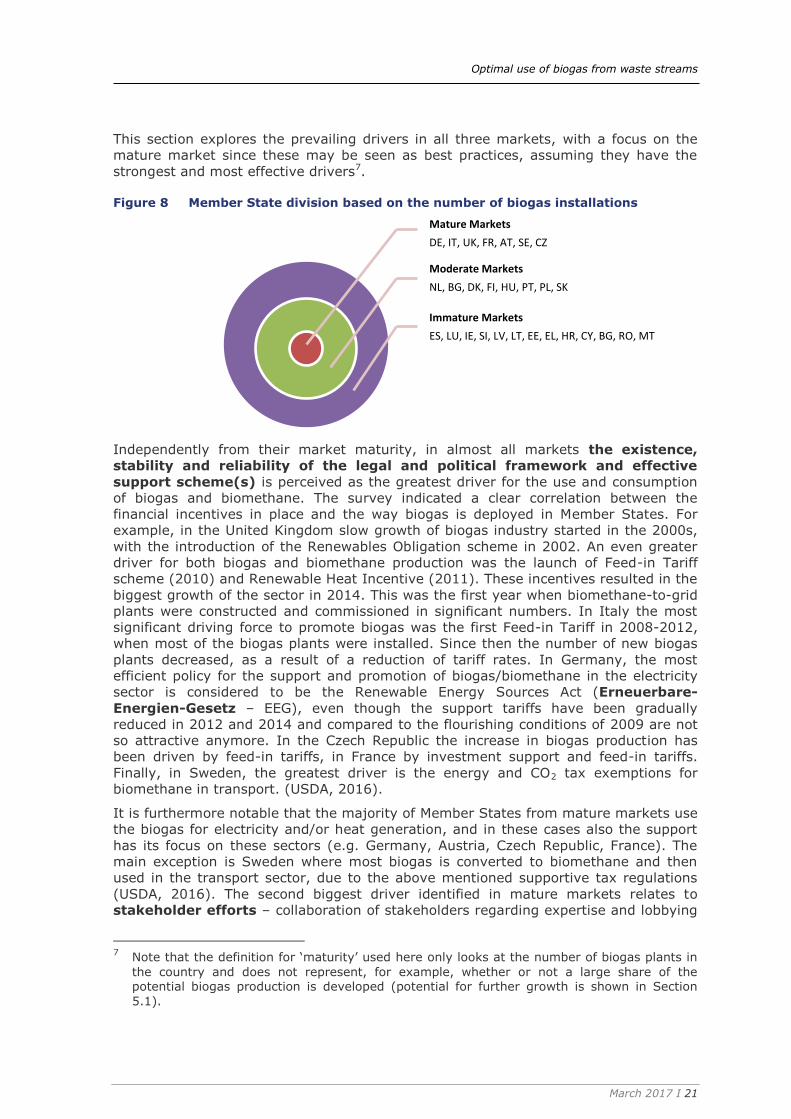
For a better analysis of drivers and barriers for biogas deployment throughout the EU,
Member States are divided into three groups dependent on their market maturity in
terms of (absolute) number of biogas plants installed: mature, moderate and
immature markets. Mature markets cover the front runners in biogas production in the
EU, based on the number of biogas plants installed; Moderate markets include
Member States with a moderate number of biogas plants installed; Immature markets
cover Member States where biogas production is low. The resulting Member State
division is shown in Figure 8.
6 EuroObserv’Er data stated only landfill gas and sewage sludge for Estonia, while EBA data
stated also other feedstock use.
Optimal use of biogas from waste streams
March 2017 I 21
This section explores the prevailing drivers in all three markets, with a focus on the
mature market since these may be seen as best practices, assuming they have the
strongest and most effective drivers7.
Figure 8 Member State division based on the number of biogas installations
Independently from their market maturity, in almost all markets the existence,
stability and reliability of the legal and political framework and effective
support scheme(s) is perceived as the greatest driver for the use and consumption
of biogas and biomethane. The survey indicated a clear correlation between the
financial incentives in place and the way biogas is deployed in Member States. For
example, in the United Kingdom slow growth of biogas industry started in the 2000s,
with the introduction of the Renewables Obligation scheme in 2002. An even greater
driver for both biogas and biomethane production was the launch of Feed-in Tariff
scheme (2010) and Renewable Heat Incentive (2011). These incentives resulted in the
biggest growth of the sector in 2014. This was the first year when biomethane-to-grid
plants were constructed and commissioned in significant numbers. In Italy the most
significant driving force to promote biogas was the first Feed-in Tariff in 2008-2012,
when most of the biogas plants were installed. Since then the number of new biogas
plants decreased, as a result of a reduction of tariff rates. In Germany, the most
efficient policy for the support and promotion of biogas/biomethane in the electricity
sector is considered to be the Renewable Energy Sources Act (Erneuerbare-
Energien-Gesetz – EEG), even though the support tariffs have been gradually
reduced in 2012 and 2014 and compared to the flourishing conditions of 2009 are not
so attractive anymore. In the Czech Republic the increase in biogas production has
been driven by feed-in tariffs, in France by investment support and feed-in tariffs.
Finally, in Sweden, the greatest driver is the energy and CO2 tax exemptions for
biomethane in transport. (USDA, 2016).
It is furthermore notable that the majority of Member States from mature markets use
the biogas for electricity and/or heat generation, and in these cases also the support
has its focus on these sectors (e.g. Germany, Austria, Czech Republic, France). The
main exception is Sweden where most biogas is converted to biomethane and then
used in the transport sector, due to the above mentioned supportive tax regulations
(USDA, 2016). The second biggest driver identified in mature markets relates to
stakeholder efforts – collaboration of stakeholders regarding expertise and lobbying
7 Note that the definition for ‘maturity’ used here only looks at the number of biogas plants in
the country and does not represent, for example, whether or not a large share of the potential biogas production is developed (potential for further growth is shown in Section
5.1).
Mature Markets
DE, IT, UK, FR, AT, SE, CZ
Moderate Markets
NL, BG, DK, FI, HU, PT, PL, SK
Immature Markets
ES, LU, IE, SI, LV, LT, EE, EL, HR, CY, BG, RO, MT
Optimal use of biogas from waste streams
March 2017 I 22
can contribute to the developments. Stakeholder efforts play a crucial role in Austria
and Italy. In Italy, the possibility to inject biomethane into the natural gas grids, as
well as the availability of methane distribution plants for natural gas vehicles was
initiated by the Fiat Chrysler Automobiles group that urged the government to
promote the use of biomethane for cars and reduce natural gas imports.
Stakeholder efforts have not been communicated as a driver in moderate markets.
With regards to immature markets it has been mentioned only for Luxembourg.
In moderate and immature markets, the second most relevant driver relates to
feedstock potential. Feedstock potential is seen as a good driver in Poland, Belgium,
Portugal, Spain, Ireland, and Croatia. The majority of these Member States have a
significant agricultural sector and therefore a huge amount of agricultural waste to be
used for biogas/biomethane production. Feedstock potential plays a lesser role in
mature markets. This driver has been mentioned only for France, which also has a
strong agricultural profile.
National targets and goals are the number three driver in all three markets
analysed. Ambitious national goals are seen as a good driving force in France,
Sweden, Denmark, Finland and Luxemburg. While France and Sweden highlighted
national climate ambitions and GHG targets as a driving force, targets for the use of
livestock manure for green energy and national RES targets are perceived as good
drivers in Denmark, and biomethane specific targets in Finland.
The remaining drivers cannot be easily compared among the three markets, since they
vary from market to market. Hence for example in mature markets further drivers
highlighted during the survey include growing confidence in biomethane
technology (the United Kingdom), which resulted from resolving certain regulatory
issues. In France, regions with poor electricity and high unemployment rate in
rural areas are seen to provide good opportunities for greater use of biogas and
biomethane, ensuring both better electricity supply and additional revenues for
farmers.
When it comes to moderate markets, availability of technical know-how that
ensures profitable management of biogas production plays a role in Belgium
(Flanders). In immature markets further drivers include the existence of an extensive
gas network with the possibility to connect and inject biogas/biomethane into the
grid in Spain, and large customer demand for green gas in Ireland.
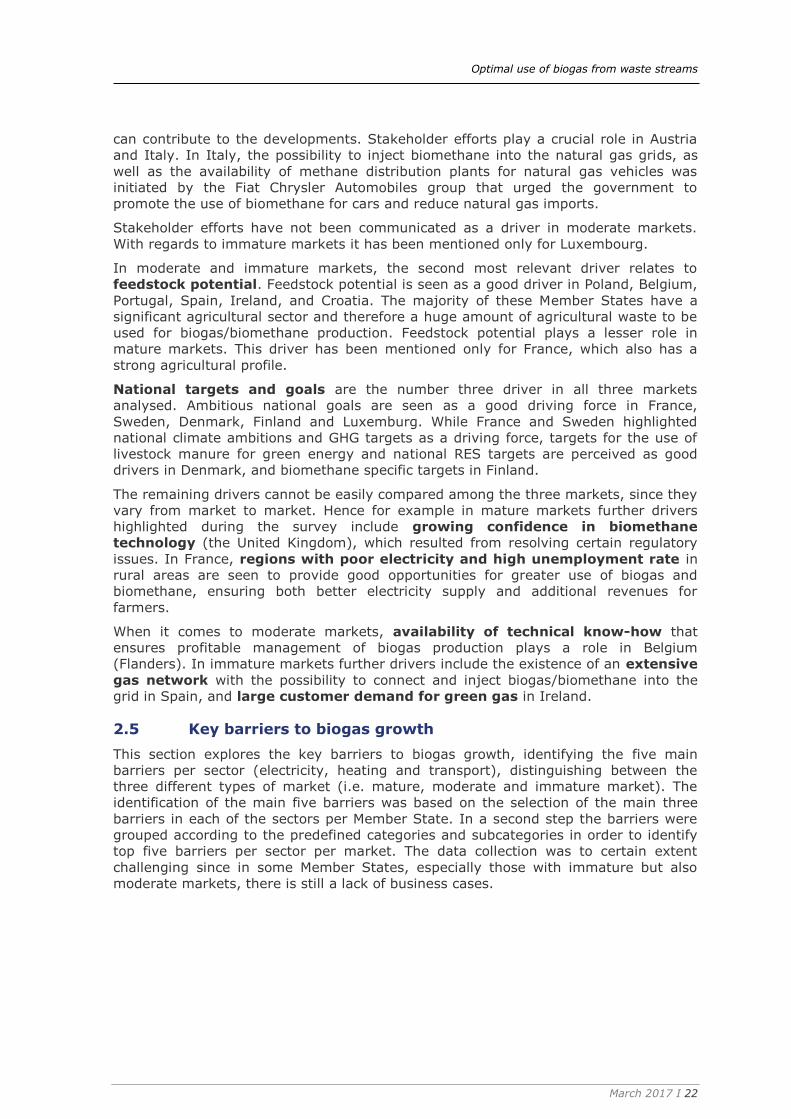
Key barriers to biogas growth 2.5
This section explores the key barriers to biogas growth, identifying the five main
barriers per sector (electricity, heating and transport), distinguishing between the
three different types of market (i.e. mature, moderate and immature market). The
identification of the main five barriers was based on the selection of the main three
barriers in each of the sectors per Member State. In a second step the barriers were
grouped according to the predefined categories and subcategories in order to identify
top five barriers per sector per market. The data collection was to certain extent
challenging since in some Member States, especially those with immature but also
moderate markets, there is still a lack of business cases.
Optimal use of biogas from waste streams
March 2017 I 23
Figure 9 Barriers for electricity generation from biogas/biomethane
0
2
4
6
8
10
12
Existence, stability and reliabilityof the framework and support
scheme(s)
Existence of a strategy and along-term perspective
Access to finance
Perception/ public awareness
ILUC and sustainability criteria
Expertise/ stakeholder efforts
Information exchange &Communication between
relevant stakeholders
Treatment of biogas by-products
Complexity and duration ofadministrative procedure
Access to feedstock
Remunaration level
Taxing regime
Mature markets Moderate markets Immature markets
Optimal use of biogas from waste streams
March 2017 I 24
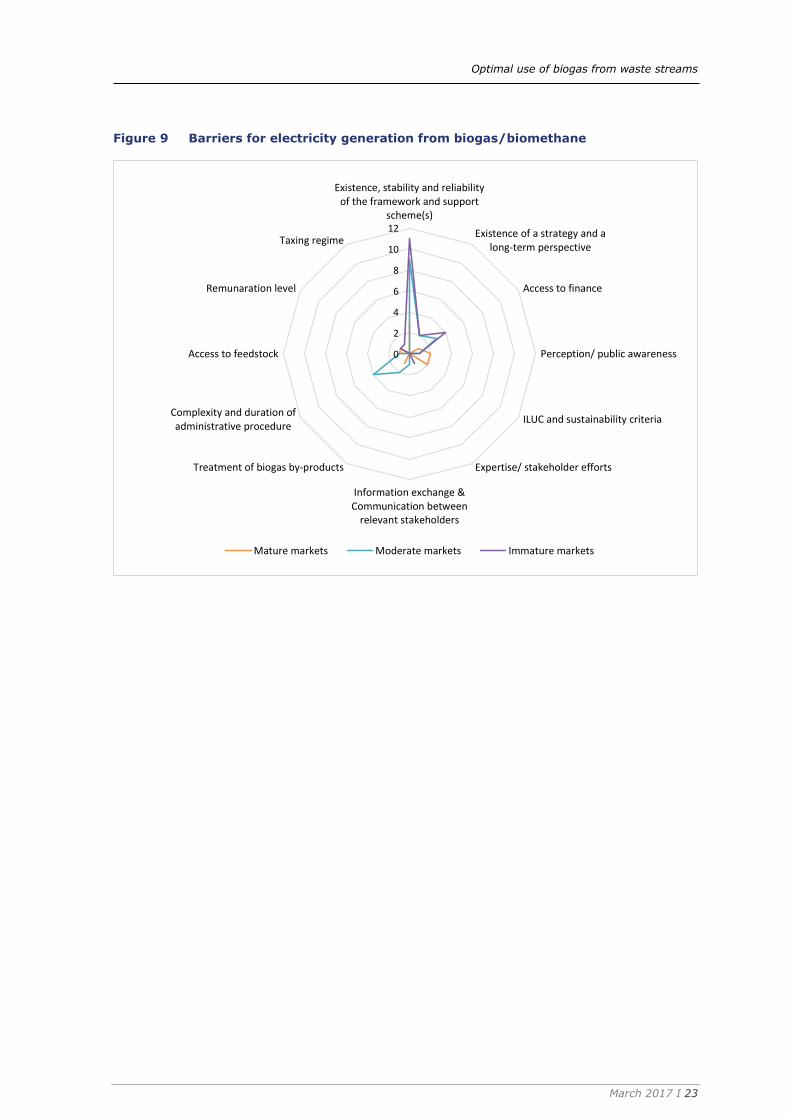
Figure 10 Barriers for heat generation from biogas/biomethane
0
2
4
6
8
10
12
14
16
Existence, stability and reliabilityof the framework and support
scheme(s)
Existence of a strategy and along-term perspective
Access to finance
Perception/ public awareness
ILUC and sustainability criteria
Expertise/ stakeholder efforts
Information exchange &Communication between
relevant stakeholders
Treatment of biogas by-products
Operational issues
Certification
Grid acccess
Demand related issues
Mature markets Moderate markets Immature markets
Optimal use of biogas from waste streams
March 2017 I 25
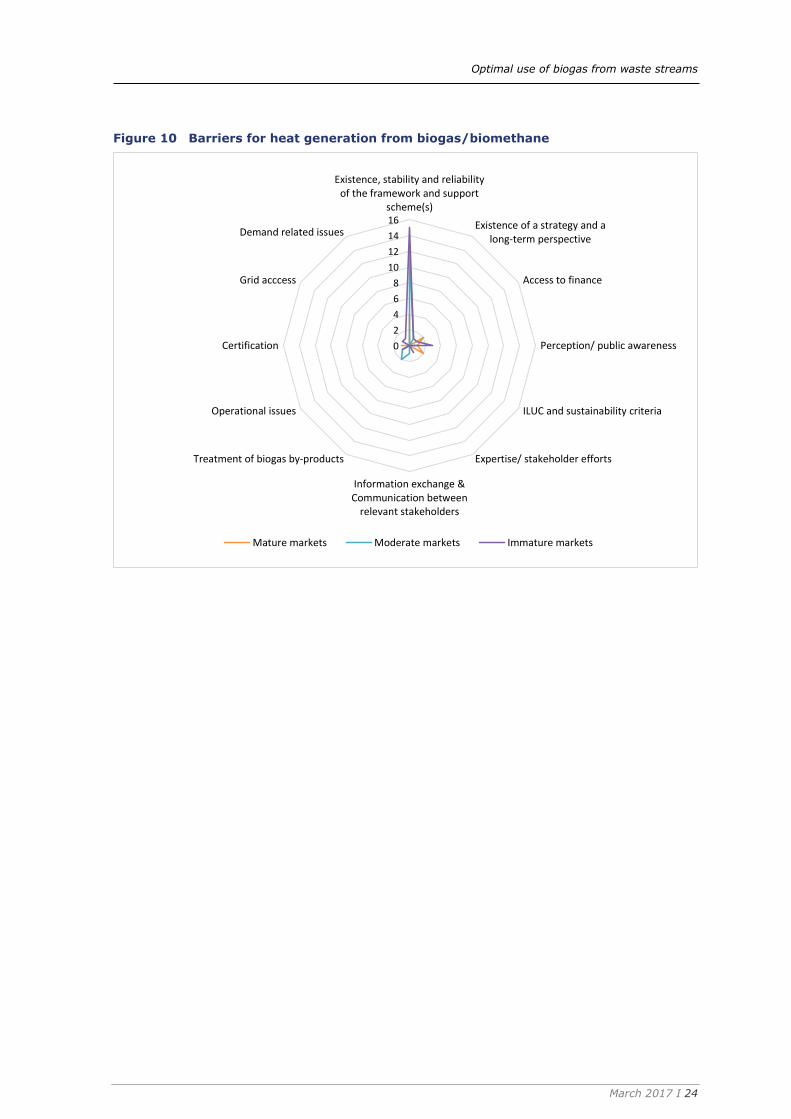
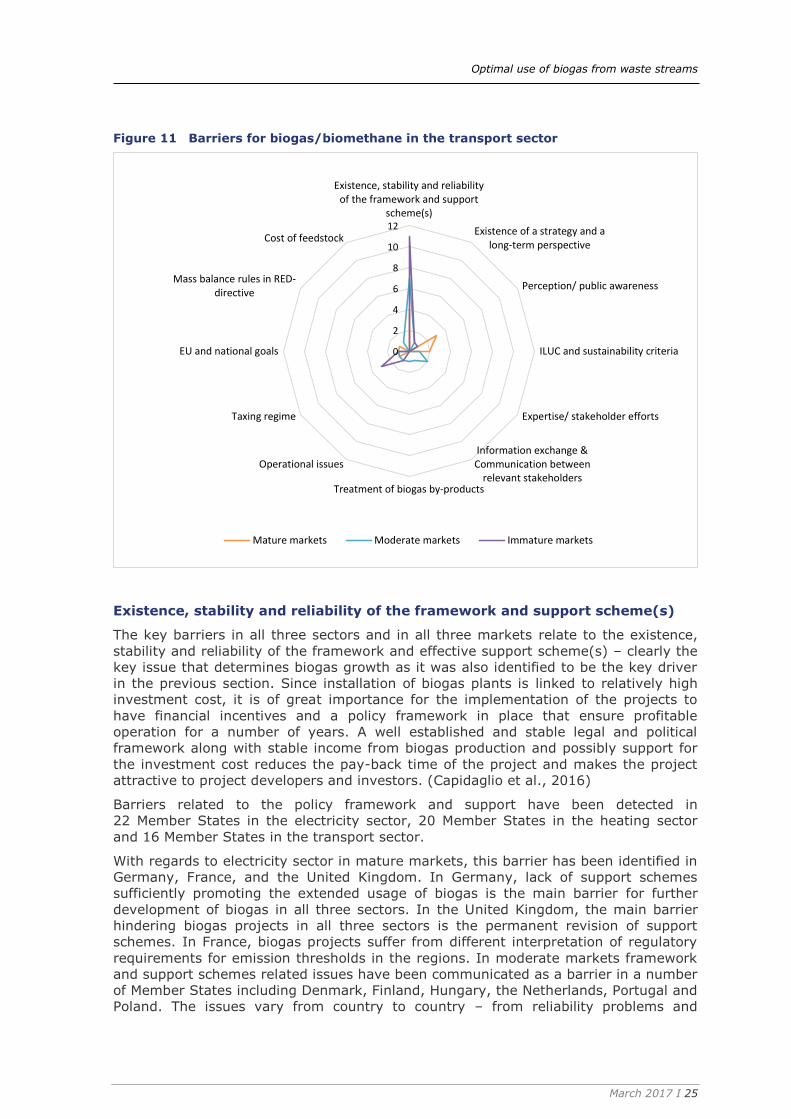
Figure 11 Barriers for biogas/biomethane in the transport sector
Existence, stability and reliability of the framework and support scheme(s)
The key barriers in all three sectors and in all three markets relate to the existence,
stability and reliability of the framework and effective support scheme(s) – clearly the
key issue that determines biogas growth as it was also identified to be the key driver
in the previous section. Since installation of biogas plants is linked to relatively high
investment cost, it is of great importance for the implementation of the projects to
have financial incentives and a policy framework in place that ensure profitable
operation for a number of years. A well established and stable legal and political
framework along with stable income from biogas production and possibly support for
the investment cost reduces the pay-back time of the project and makes the project
attractive to project developers and investors. (Capidaglio et al., 2016)
Barriers related to the policy framework and support have been detected in
22 Member States in the electricity sector, 20 Member States in the heating sector
and 16 Member States in the transport sector.
With regards to electricity sector in mature markets, this barrier has been identified in
Germany, France, and the United Kingdom. In Germany, lack of support schemes
sufficiently promoting the extended usage of biogas is the main barrier for further
development of biogas in all three sectors. In the United Kingdom, the main barrier
hindering biogas projects in all three sectors is the permanent revision of support
schemes. In France, biogas projects suffer from different interpretation of regulatory
requirements for emission thresholds in the regions. In moderate markets framework
and support schemes related issues have been communicated as a barrier in a number
of Member States including Denmark, Finland, Hungary, the Netherlands, Portugal and
Poland. The issues vary from country to country – from reliability problems and
0
2
4
6
8
10
12
Existence, stability and reliabilityof the framework and support
scheme(s)
Existence of a strategy and along-term perspective
Perception/ public awareness
ILUC and sustainability criteria
Expertise/ stakeholder efforts
Information exchange &Communication between
relevant stakeholdersTreatment of biogas by-products
Operational issues
Taxing regime
EU and national goals
Mass balance rules in RED-directive
Cost of feedstock
Mature markets Moderate markets Immature markets
Optimal use of biogas from waste streams
March 2017 I 26
permanent revision of schemes in the Netherlands to a lack of visibility concerning the
schemes beyond 2020 in Denmark, or lack of support schemes for new plants in Italy.
In immature markets there are several Member States suffering from lack of
incentives for biogas (Bulgaria, Spain, Ireland, Cyprus, Luxembourg), which hampers
the access to financing for biogas projects.
Framework and support schemes related issues in the heat sector have been
communicated by less Member States, however the problem in this sector can be
expected to be more severe, since the number of Member States having no support
for heat generation from biogas/biomethane is greater than in the electricity sector
(see Section 5).
In contrast to the other two sectors lack of incentives becomes a barrier also in
mature markets (Germany, France, Austria) when it comes to the transport sector
(see Section 5).
ILUC and sustainability criteria
The second biggest barrier in the electricity sector in mature markets is related to
Indirect Land Use Change (ILUC) and sustainability criteria (Sweden, the United
Kingdom). This problem has not been communicated by other Member States for the
electricity sector. In mature markets ILUC and sustainability issues are also perceived
as a barrier in the heat and transport sector. In addition, it hinders biomethane
deployment in Poland – the only Member State that communicated this barrier besides
mature markets.
The Renewable Energy Directive (RED 2009/28/EC) and the ILUC Directive ((EU)
2015/1513) determine how Member States may fulfil their 10% target of renewable
sources in the transport sector by 2020. It classifies biofuels based on the materials
used for their production, distinguishing between biofuels from food crops, from waste
and residue streams, and advanced biofuels that may be produced from a range of
other feedstocks. The contribution of the first generation biofuels, produced from so-
called “food crops” is limited to 7% of the total transport fuels. The remaining 3%
renewable energy may be produced from other sources. However, the ILUC Directive
has not yet been implemented in national legislation. Furthermore, the feedstock used
in a biogas unit is composed of different raw materials, which fall under different
categories of biofuels.
With regards to sustainability criteria, the United Kingdom industry is concerned about
the incorporation of sustainability criteria into the existing support schemes, which
might to some extent discourage the use of crops in anaerobic digestion (AD) as well
as the UK government’s proposals to limit gas yield from energy crops to 50% (50%
non-crop materials). Sweden communicated that the ILUC regulations limit the
production of biogas and biomethane from food-based crops, even if these crops are
produced in a sustainable way without having an ILUC effect.
Complexity and duration of administrative procedures
In the moderate markets the second biggest barrier for biogas projects in the
electricity sector is the complexity (Hungary) and duration (Belgium, Poland) of
administrative procedures.
Interestingly, administrative procedures seem to constitute no barrier in other Member
States in any of the sectors. It might be explained by the fact that in the mature
markets the processes have been optimized over time, while in immature markets too
few projects have been implemented so far to see administrative procedures as a
huge barrier. Another explanation might be that other barriers are simply more severe
than those related to administrative procedures. As already mentioned there is a great
number of Member States without any support schemes in place or schemes being
Optimal use of biogas from waste streams
March 2017 I 27
currently revised. Therefore, project developers are not keen in starting new projects
until new schemes are in place or at least details on them are disclosed. The
uncertainty and related risks are simply too high, which leads to another related
barrier in immature markets and moderate markets – access to finance.
Access to finance
Access to finance related issues has been identified in all three markets in electricity
sector and in mature and immature markets in the heating sector. This barrier is
usually a result of several other barriers identified, such as lack of or insufficient
stability and reliability of the framework and support scheme(s), lack of strategy,
insufficient expertise of stakeholders or negative perception of biogas/biomethane
technologies and low public awareness, which result in a difficulty for project
developers to receive project financing.
In the electricity sector, access to finance is the second largest barrier in immature
markets (Bulgaria, Spain, Croatia, Lithuania) third largest barrier in moderate markets
(Belgium, Portugal) and is among key barriers in mature markets (France). In the
heat sector, access to finance is the second biggest barrier in mature markets (Czech
Republic, France) and perceived as a barrier in Estonia (immature market).
For example, in France the granting of loans is conditioned to high guarantee
requirements of banks. In addition, banks require that the biogas project contracts
long-term agreements for feedstock supply, which is particularly difficult for operators.
In Portugal, high capital costs are the result of uncertainty regarding new support
mechanisms. In Estonia, access to finance is aggravated by the relatively low gas
demand, which increases the risks of unviable projects.
Perception and public awareness
The third biggest barrier in mature markets in the electricity sector relates to
perception and public awareness, identified in the Czech Republic and France. It has
an adverse effect on biogas/biomethane deployment also in moderate markets
(Ireland and Slovakia). In the heating sector perception and public awareness is
perceived as a barrier in all three markets; however mainly in immature markets
(Slovenia, Ireland, Estonia). In moderate markets, this barrier has been
communicated only in Poland and in mature markets in France. In the transport sector
perception and public awareness is the number two barrier in mature markets
(Austria, Italy).
The reasons vary from country to county. In France, general lack of knowledge about
biogas technologies among financial stakeholders resulting in high guarantee
requirements of banks has been communicated as a barrier. In addition, public
acceptance causes problems for project developers in France. The opposition is often
based on fears regarding odour nuisance or explosion risks of biogas plants. In the
Czech Republic, Ireland, Slovakia, Slovenia and Estonia the stakeholders reported this
barrier to be related to a lack of political will, and a negative image of renewable
energy of politicians and media. In Estonia and the Czech Republic renewable energy
is perceived as a financial burden for the energy consumers.
Perception and public awareness was not mentioned to be a barrier in the transport
sector in moderate markets. The explanation here might be the fact that biomethane
is currently being developed only in few Member States, mainly in mature markets like
Germany (178 plants), Sweden (59 plants), the United Kingdom (37 plants), Austria
(14 plants), France (8 plants) and Italy (5 plants), but also in few moderate markets
like the Netherlands (21 plants), Finland (9 plants), Denmark (6 plants) and Hungary

Optimal use of biogas from waste streams
March 2017 I 28
(2 plants); in immature markets biomethane is produced only in Luxembourg (3
plants) and Spain (1 plant)8.
Lack of a strategy and a long-term perspective
The third biggest barrier in the electricity sector of immature markets is a lack of a
strategy and a long-term perspective. It hinders biogas for electricity projects in
Lithuania and Slovenia. In Lithuania, lacking long-term national vision for RES is the
key barrier affecting biogas/biomethane in all three sectors. This barrier is among key
five barriers in moderate markets (Hungary and Poland). Next to Lithuania, it is
perceived as a barrier in the heat sector in Portugal and in the transport sector in
Hungary. In Portugal, the industry urges the drafting of a Renewable Heat Strategy to
boost the ambition and the deployment of the sector. EBA suggests establishing a
common EU strategy for heating and cooling sector by the European Commission
(EBA, 2016).
This barrier has not been detected in mature markets in any of the sectors.
Treatment of biogas by-products
The fifth barrier in the electricity sector in moderate markets relates to the treatment
of biogas by-products (Belgium, the Netherlands); perceived as a barrier also in heat
sector in both countries. Treatment of biogas by-products related issues are among
the key barriers in mature markets (Austria) as well; however, the barrier does not
appear in immature markets.
In Belgium (Walloon and Brussels-Capital) this barrier concerns the legal status of
digestate, which represents no less than 90% of the output of an AD plant
(the remaining 10% being biogas). The status of the digestate depends on the nature
of the feedstock used in the biogas unit. If the feedstock is not waste (e.g. agricultural
substrates valued on site), digestate will be regarded as a product; if on the other side
the feedstock is classified as waste, the digestate will be regarded as waste and not as
a valuable product. Its legal redefinition constitutes a challenge, since waste is
regulated by regional as well as by federal regulations, depending on the type of
waste. Therefore, only the production of biogas currently contributes to the
profitability of a biogas project, while the economic potential of digestate remains
untapped. In this regard, the legislation about the value of digestate should be
clarified, preferably on the European level, as this will enable producers to sell their
digestate where it is most logical to them.
Other barriers
Other barriers that have been communicated for the electricity sector include issues
concerning the access to feedstock (Denmark, the United Kingdom), taxing regime
(Latvia) and remuneration level (Austria).
With regards to access to feedstock, Denmark reported a problem in finding suitable
biomass for supplementing slurry in order to achieve adequate gas production, while
the United Kingdom is experiencing problems with availability of especially food waste.
Due to a lack of a mandatory food collection in place – notably in England – availability
of food waste suitable for anaerobic digestion is limited in the United Kingdom. The
industry therefore suggests introduction of mandatory collection of food waste in the
United Kingdom.
8 These numbers refer to the year 2014 and come from the EBA Biomethane & biogas report
2015 (EBA, 2015).

Optimal use of biogas from waste streams
March 2017 I 29
In immature markets key barriers include also expertise and stakeholder efforts
related issues (Croatia, Romania, Bulgaria). The problem in these countries relates to
a lack of knowledge and expertise among potential investors, farmers, and producers.
If barriers are more or less similar in the electricity and heat sector, some new
barriers have been identified in the transport sector.
First, the EU and national goals related barriers. This is a barrier in all three
markets (Sweden, the Netherlands, Spain), and typically relates to the first two
barriers mentioned above. Spain communicated insufficient national targets in the
transport sector as the main barrier for the development of biofuels. Sweden stressed
the need for ambitious goals at EU level, because Sweden has already reached the
2020 RES-target for transport of 10%. Also the Netherlands highlighted the
uncertainty about post-2020 EU biofuel policy. Since in most Member States the
national incentives are the direct result of the EU policies for biofuels, the uncertainty
about the post-2020 goals might work as a deterrent for producers and investors.
Goals beyond 2020 are needed to provide certainty in the long-term perspective to the
industry and encourage them to expand the deployment of gaseous biofuels.
Taxing regime related barriers are also among key barriers in all three markets,
especially in immature markets (Bulgaria, Spain, Lithuania). Both Lithuania and
Bulgaria highlighted the need in and importance of the excise duty exemptions for
biomethane. In Lithuania excise duty relief for biomethane has been removed from
January 2016. That beneficial tax regulations can be a good driver can be
demonstrated by the good practice examples of Finland or Sweden and therefore it is
urged by the industry across number of Member States to introduce or maintained
them.
Finally, Sweden communicated mass balance rules in RES directive related
concerns. A high number of end-consumers in Sweden favour 100% biomethane,
especially as a transportation fuel and many of them would not accept a mixture of
biomethane and natural gas. Therefore, Sweden sees as highly important that the EU
regulations continue to allow mass balancing methodology in relation to biomethane
blended with natural gas. Today sustainability properties, as well as economic
incentives such as tax exemption, are following the biomethane from the point of
injection into the natural gas grid and all the way to the final consumer. This has been
a major prerequisite to biomethane market development. Without mass balancing
methodology, it is believed that the biomethane market would not continue to develop
extensively in Sweden.
Biogas production technologies 2.6
Two different biogas production systems exist: dry digesters and wet digesters. Wet
digesters have water as the continuous phase, whereas dry digesters have biogas as
the continuous phase. Dry digesters are used if substrates are ‘dry’ and cannot be
mixed easily (think of roadside grass or garden waste). Otherwise the wet system is
most preferred. Dry systems are in a ‘niche’ market and need to be competitive with
wet systems because, after size reduction, almost any substrate can be treated in a
wet system.
At least four types of wet digester systems are applied:
mixed tank systems;
mixed tanks in series;
plug flow systems;
systems with sludge retention.
Optimal use of biogas from waste streams
March 2017 I 30
Mixed tanks in series are currently most often applied. Plug flow systems have similar
costs and achievements, while single mixed tanks are phased out. The two stage
digester is currently most often applied. In addition to the types described above,
several types of wet systems with sludge retention are applied. These systems are
used to treat industrial wastewater (from the agro-food industry) or sludge from
aerobic wastewater treatment systems. The biogas production of these is not expected
to grow as the amount of waste is limiting. Waste reduction measures may even
reduce the production of biogas from these units.
Biogas may be burnt in a Combined Heat and Power (CHP) unit. Typical CHP units
have 40% electrical efficiency and 50% heat efficiency. The remaining 10% is lost
with the off gases via the chimney. In many occasions, not all heat is applied as no
suitable year around demand for heat use is available. Part of the heat is used to heat
the digesters. Usually the CHP unit consists of a gas engine. If high temperature heat
(steam) is demanded, also gas turbines (with lower electrical efficiency) may be
applied.
For biogas upgrading four different methods are used:
washing: a liquid removes CO2; this can be based on a temperature or pressure
swing;
cryogenic: cooling and compressing such that CO2 is removed as a liquid;
vacuum pressure swing adsorption (VPSA): Packed bed absorbs CO2;
membranes: CO2 or methane permeates through selective membrane (depending
on applied membrane).
Cost 2.7
The costs of biogas production are highly depending on the substrate used. Easily
digestible substrates (such as energy crops) are more expensive but require less
investment costs as energy crops have high energy density and fast production of
biogas, resulting in smaller biogas reactors. Difficult substrates on the other hand, are
cheap (often with a negative price) but require large investment costs.
It is important to realize that wet substrates produce large amounts of digestate. This
digestate needs to be distributed in the surrounding agricultural area or needs to be
cleaned to specifications of dischargeable water. The costs of distribution or water
treatment are directly related to the volume. The price at the gate of the farmland is
very dependent on the local circumstances. In some areas farmers will pay for the
organic carbon and nitrogen and phosphorous in the digestate. In other areas (where
a nitrogen and/or phosphate surplus exist, such as in the Netherlands and Belgium,
but, as a consequence also in the border areas of their neighbouring countries: France
and Germany), the farmers will actually receive a gate fee for the distribution of
digestate on their land. In these areas the addition of crops may significantly add to
the costs of digestate distribution.
The lump sum costs for biogas upgrading are around 0.2-0.31€/Nm3 CNG independent
of the applied method (Valorgas, 2012). The investment costs are 2,700 €/(Nm3/hr)
raw gas and the operating and maintenance costs are 270 €/(Nm3/hr) raw gas per
year. The costs of upgrading are said to decrease with increasing scale to a value of
0.012 €/(kW.hr) at 2,000 Nm3/hr. The lump sum costs may be calculated from the
total cost of upgraded biogas production minus the cost of biogas production
(0.063 €/(kW.hr) – 0.053 €/(kW.hr)) = 0.01 €/(kW.hr) (Zuijlen and Lensink, 2015).
Optimal use of biogas from waste streams
March 2017 I 31
Infrastructure 2.8
Concerning infrastructure, the following four parameters were researched:
availability of gas or even biogas pipelines;
existing gas storage (buffers);
infrastructure for natural gas, Compressed Natural Gas (CNG) or Liquefied Natural
Gas (LNG) for vehicles;
gas quality.
All in all, it can be concluded that almost all EU Member States have gas infrastructure
and storage in place, as well as a natural gas infrastructure for transport, and gas
quality regulations. These are clearly important prerequisites for biomethane
deployment and growth. There are two exceptions, namely Malta and Cyprus, the two
small island country Member States, where there is no natural gas infrastructure
available. Cyprus, however, has projects to exploit its own natural gas reserves by
2022, and has initiated designing and constructing a natural gas network along with a
natural gas storage facility. In addition, there are countries such as Croatia that do not
have gas storage facilities due to the low demand for natural gas in the country.
Countries such as Austria, Denmark, Finland and the Netherlands have the most
positive prospects concerning the further deployment of biogas/biomethane in the
future. Those countries do not only have sufficient infrastructure available, but there
also seems to be willingness to further boost biogas and biomethane production in the
future. Characteristically, the Netherlands expects a significant contribution to the
future energy mix from the direct feed-in of biomethane into the natural gas grid,
namely 24 PJ in 2020. Clearly, besides the four issues listed above, other favourable
conditions also need to exist for biomethane production and use to increase.
The availability of infrastructure for CNG or LNG for vehicles depends on the
policy priorities of each EU member State. There are countries such as Germany and
Italy where there is a great number of CNG stations available (925 and 1,022
respectively). However, in Italy their number is not sufficient to satisfy the fuel
demand of the existing fleet. Relative to the size of the Member State, Austria has an
extensive network of CNG fuelling stations (177), while the same is true for Sweden
(218 CNG stations). Apart from that, in Finland, the share of biomethane in the
methane/CNG mix in transport sector amounted to 30% in 2015 (IEA Bioenergy Task
37, 2016). This was mainly due to the fact that the price of CBG presented the lowest
cost energy option in motorized transport costing EUR 0.77 per gasoline litre
equivalent (due to government support). However, other EU Member States show a
moderate performance on that field, as many of them have only initiated the process
of creating the necessary infrastructure.
Inter-EU trade 2.9
The cross-border biomethane trade related issues have been analysed in several
recent projects and reports, such as the BIOSURF project (BIOSURF, 2016) and the
EBA Biomethane & biogas report 2015 (EBA, 2015). Biogas trade is negligible.
Initially, biomethane has been traded mainly at a national level only. However,
gradually it becomes a cross-border commodity that is traded between EU Member
States. Nevertheless, cross-border biomethane trade is still very limited.
Internationally biomethane is mainly traded through physical road transport rather
than using the natural gas grid. An example could be the existing trade between
Switzerland and Germany, where 110 GWh of biomethane were exported from
Germany to Switzerland in 2014 (EBA, 2015).
Optimal use of biogas from waste streams
March 2017 I 32
The main problems hindering cross-border trading is the current wording of the
Renewable Energy Directive (2009/28/EC), which makes it difficult to trade
biomethane injected into the grid within a Member State and among the Member
States. This is due to traceability requirements and in particular the mass balancing
system that was included in the Directive with a focus on liquid fuels, which is less
suitable for the trading of biomethane that has been injected into the natural gas grid
(BIOSURF, 2016).
When biomethane is used as a fuel in transport it has to meet the sustainability
criteria set in the RED. In addition, there are traceability rules. While there is a
common understanding how to use these rules for liquid biofuels, with regards to
biomethane to be injected into the grid application of these rules remain unclear. The
biomethane can be traced up to the moment of the injection into the grid, after which
it is blended with the natural gas.
Cross-border trade in biomethane is more difficult if there is a number of country
specific quality requirements. In particular, this might be a barrier where different
verification procedures are in place in different Member States. Note that this problem
concerns only sustainability criteria additional to those set by the EU. The EU
sustainability criteria for biofuels and bioliquids have to be implemented by all Member
States through the voluntary schemes approved by the European Commission.
(BIOSURF, 2016).
To solve this problem, the BIOSURF project suggests to strictly separate sustainability
requirements for biomethane as traded commodity from the additional requirements
(e.g. noise or odour emissions, etc.) that are important for the operation of the
production plants for example, the conversion of biomethane into an end product or
for the treatment of digestate that resulted from the production processes. Those
additional requirements could be regulated at Member State level and should not be
linked to the use of biomethane or financial support granted for the use of
biomethane. For this solution, however, mandatory sustainability criteria for gaseous
biomass, especially used in the heat and power sector, is an important prerequisite.
With mandatory criteria in place, there would be no need for country specific
additional sustainability criteria for biomethane as traded commodity, nor for
production of biogas (BIOSURF, 2016).
Another issue is that Member States can exclude certain feedstock for biomethane
production (e.g. from support schemes). As a result, biomethane produced has
different quality, which also aggravates the cross-border trade. Here again, mandatory
sustainability criteria at EU level would be helpful (BIOSURF, 2016).
EBA suggests international harmonization of Guarantees of Origin (GoO) certification
systems to enable import and export of biomethane across Member States. Initial
steps towards harmonization have already been taken by national biomethane
registries in place in several countries including Germany, Denmark, Austria, France,
the United Kingdom and Switzerland. It has to be noted, however, that all these
countries have a strict mass balancing system and do not allow a separate trade of the
physical gas and GoO beyond boundaries between balancing zones. To resolve these
issues, EBA suggests considering European gas grid as one balancing zone
(EBA, 2015); (BIOSURF, 2016).

Optimal use of biogas from waste streams
March 2017 I 33
3 Biogas policies
Similar to the Member State policies, EU policies relevant to biogas development in the
EU span a large range of topics and sectors: renewable energy, climate change,
agriculture, waste, transport and (natural) gas regulations and policies all impact
biogas. Some of these policies impact the use of specific feedstocks, others only
specific end-uses, biogas production or upgrading facilities. Any of these may support
or, in some cases, hamper biogas developments, and should therefore be considered
when assessing policy options to further support or accelerate biogas developments.
Key EU policies 3.1
The following provides an overview of the key EU policies and regulations relevant for
the topic of this study, categorized by issues9.
Renewable energy
A number of EU directives are in place that promote the use of renewable energy,
including biogas. The main directive in this respect is the Renewable Energy
Directive (2009/28/EC), in 2015 amended with the ILUC directive ((EU)
2015/1513). The RED sets, inter alia, binding targets for the share of renewable
energy in both total energy and transport energy use of a Member State. Bioenergy,
biofuels and biogas also count towards these targets. In addition, the RED defines
sustainability criteria for biofuels and bioliquids, incl. bio-CNG (compressed
biomethane). Annex V of the RED provides default and typical values for GHG
emission savings for three bio-CNG routes (from municipal organic waste, from wet
and dry manure). Biogas/biomethane produced from waste streams may count double
towards the transport target, providing an additional incentive above biogas and
biofuels produced from energy crops. A list of feedstocks which do not fall under the
cap on food-based biofuels introduced in the ILUC Directive is provided in Part A of
Annex IX. These include manure, landfill and sewage sludge, but also cover crops and
algae cultivated on land in ponds or photobioreactors.
The Clean Power for Transport package and resulting directive (2014/94/EU) lays
out a comprehensive EU alternative fuels strategy, and aims to increase the
deployment of refuelling stations for both CNG (in urban/suburban and other densely
populated areas by 2020, and along the TEN-T core network by 2025) and LNG (for
shipping and heavy-duty vehicles, by 2025). These developments can be seen as a
prerequisite for growth of the market share of CNG and LNG vehicles and ships, as
thus for increasing market opportunities for the use of biomethane in the transport
sector.
Another relevant EU policy is the State aid guidelines for environmental
protection and energy 2014-2020 (2014/C 200/01). These aim to gradually
introduce market-based mechanisms as a replacement for subsidies to RES, and set a
number of guidelines for RES support schemes that also apply to biogas, including the
core principle of the waste hierarchy10, and provide a number of specific guidelines for
support of biogas production and upgrading, as well as for biogas use for transport (in
Annex 2) and for state aid for cogeneration and district heating.
9 Only the key elements relevant for biogas deployment are included here. For more detail, we
refer to the directives and regulations itself. 10 From 2014/C 200/01: (118) State aid for energy from renewable sources using waste,
including waste heat, as input fuel can make a positive contribution to environmental
protection, provided that it does not circumvent that principle.

Optimal use of biogas from waste streams
March 2017 I 34
Climate change
Many of the Member States support biogas as part of their climate policies. The most
relevant EU level directives in this respect are the EU Emission Trading Directive (EU
ETS Directive; 2003/87/EC) and the Effort sharing agreement for the non-ETS sectors.
The Effort sharing agreement for the non-ETS sectors defines GHG reduction
targets per Member States, for all emissions that are not included in the ETS. This
includes, for example, the emissions from natural gas used in the build environment,
emissions from transport fuels and agriculture, and from land use and land use
change. Reducing GHG emission from land fill and manure by using these as sources
for biogas production thus contributes to these targets, as does the use of biomethane
as a transport fuel.
The ETS applies the ‘cap and trade’ principle to the amount of greenhouse gas
emissions that can be emitted by installations covered by the system. If biogas is used
for energy production in these installations, it is considered to be zero-emission, and
no emission allowances are required for this part of the GHG emissions.
The Fuel Quality Directive (FQD) sets, inter alia, GHG reduction targets for road
transport fuels, and increasing the share of biomethane in transport fuel sales can
contribute to this target. Since a well-to-wheel approach is used in this directive,
biomethane with higher well-to-wheel GHG savings (e.g. from biogas produced from
manure) contribute more than biomethane from energy crops.
Agriculture
The Common Agricultural Policy (CAP) encourages, through its rural development
measures, the production of biogas (anaerobic digestion plants using animal waste),
to substitute fossil fuel and reduce methane emissions from the animal waste
(COM(2008) 306 final). The EU’s Nitrates Directive (91/676/EEC) aims to reduce water
pollution from agricultural sources and fertiliser consumption. The Fertilisers
Regulation (from 2003) ensures free movement in the single market mainly for
conventional, non-organic fertilisers, typically extracted from mines or produced
chemically, but does not address organic fertilisers, thus hampering EU cross-border
trade of digestate.
Waste
EU regulations on waste and, to some extent, recycling are also relevant to biogas
production, mainly because they determine in part the availability of landfill as a
source for biogas and of other suitable feedstock, including sewage sludge and
biowaste.
Natural gas
A number of regulations and directives mainly intended for natural gas, notably those
on infrastructure and trade, also apply to biomethane:
Common Rules for the Internal Market in Natural Gas Directive (2009/73/EC);
Regulation on Conditions for Access to the Natural Gas Transmission Networks
(715/2009/EC).
These directives ensure non-discriminatory access to the gas system taking into
account the necessary quality requirements and provided such access is permanently
compatible with the relevant technical rules and safety standards.
Optimal use of biogas from waste streams
March 2017 I 35
EU Policy outlook 3.2
Most of the current EU directives on renewable energy and climate define targets for
2020, not beyond. However, investments in biogas production, conversion or use
would need to be profitable also beyond 2020 to achieve an attractive return on
investment. The outlook regarding directives, regulations and policies for beyond 2020
is therefore crucial for biogas developments in the coming years.
In 2014, the European Council agreed on a framework for the 2030 climate and
energy policy framework, which includes, inter alia, the following conclusions.
A binding EU target of an at least 40% domestic reduction in greenhouse gas
emissions by 2030 compared to 1990, with the reductions in the ETS and non-ETS
sectors amounting to 43 and 30% by 2030 compared to 2005, respectively.
Reforming of the ETS, and a change of the annual factor to reduce the cap on the
maximum permitted emissions from 1.74 to 2.2% from 2021 onwards.
The European Council invites the Commission to further examine instruments and
measures for a comprehensive and technology neutral approach for the promotion
of emissions reduction and energy efficiency in transport, for electric transportation
and for renewable energy sources in transport also after 2020.
An EU target of at least 27% is set for the share of renewable energy consumed in
the EU in 2030.
An indicative target at the EU level of at least 27% is set for improving energy
efficiency in 2030 compared to projections of future energy consumption based on
the current criteria.
The European Commission has been and is working on a number of proposals for
directives on both climate and energy policies until 2030. Some of these were
published earlier in 2016, other are expected near the end of 2016 or early 2017.
These include:
ETS and the effort sharing agreement for non-ETS sectors;
energy efficiency and renewable energy policies beyond 2020;
sustainability criteria for solid and gaseous biomass in the electricity and heat sector
policies;
a communication by the Commission on decarbonisation of transport.
In addition, a Circular Economy Package and roadmap are being developed. The latter
is expected to include capping of landfilling, and a revision of Fertilisers regulation to
include digestate. Increased EU focus on heating and cooling can provide additional
incentives for local use of biogas for heating.
As part of the EU’s Circular Economy Package, published by the Commission at the
end of 2015, a number of legislative proposals on waste were published. With the
overarching objective formulated as ‘Turning waste into a resource is an essential part
of increasing resource efficiency and closing the loop in a circular economy’, these
included a number of issues relevant for biogas, such as a binding landfill target to
reduce landfill to maximum of 10% of municipal waste by 2030, a ban on landfilling of
separately collected waste, measures to promote re-use and stimulate industrial
symbiosis. In March 2016, a new proposal for a regulation was published that aims to
significantly ease the access of organic and waste-based fertilisers to the EU single
market, bringing them on a level playing field with traditional, non-organic fertilisers.
State aid guidelines for the period after 2020 are also to be expected. The current
guidelines state that ‘These Guidelines … should prepare the ground for achieving the
objectives set in the 2030 Framework. Notably, it is expected that in the period
between 2020 and 2030 established renewable energy sources will become grid-

Optimal use of biogas from waste streams
March 2017 I 36
competitive, implying that subsidies and exemptions from balancing responsibilities
should be phased out in a degressive way.’
The many new regulations and communications for the period after 2020 can be
crucial to the longer term developments of biogas in the EU. Ambitious GHG savings
and RES targets may provide strong incentives for Member States to enhance (and
continue) their biogas support policies.
Member State support schemes 3.3
In this section, an overview is provided of the support schemes for biogas and
biomethane throughout the EU. More information on support schemes can be found in
the country factsheets included in Appendix A of this report.
3.3.1 Electricity sector
The variety of financial incentives and policies supporting biogas and/or biomethane
across the EU is shown in Maps 1-5 below. In the electricity sector, the most
widespread schemes for biogas include the Feed-in Tariff and Feed-in Premium
schemes as well as grants and loans.
The Feed-in Tariff as main support scheme is still applicable in Bulgaria, Greece,
France, Hungary, Ireland, Luxembourg, Portugal, and Slovakia (see Map 1).
In Bulgaria, Portugal, Ireland and Latvia feed-in tariffs are currently not available for
new renewable plants. In Latvia, the Feed-in Tariff scheme is under revision since
2011 due to concerns about corruption and a lack of transparency. A new support
scheme is awaited, but not earlier than the end of 2018.
Map 1 Support schemes for biogas in the EU in the electricity sector
The Feed-in Premium is the key support scheme in Denmark, Estonia, Finland,
Croatia, the Netherlands and Lithuania. Under this scheme a premium is granted on
top of the market price of electricity, which shall compensate the difference between
the price of electricity from renewable sources (base amount) and the wholesale price
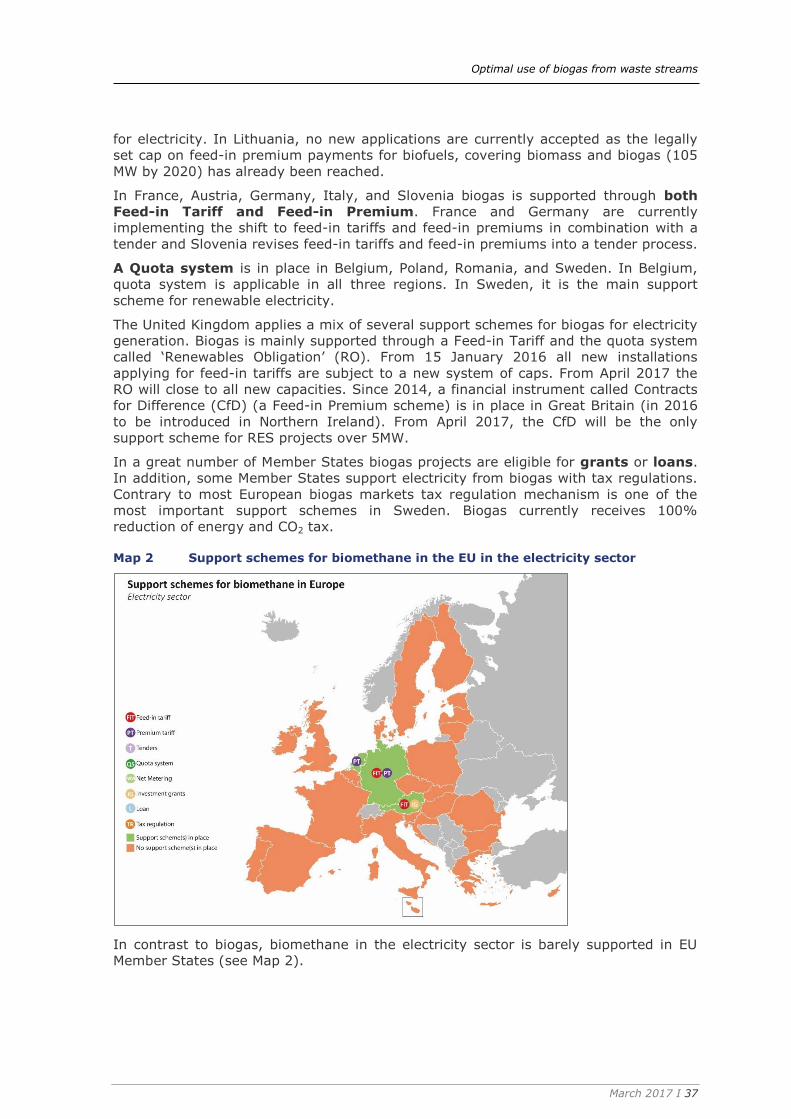
Optimal use of biogas from waste streams
March 2017 I 37
for electricity. In Lithuania, no new applications are currently accepted as the legally
set cap on feed-in premium payments for biofuels, covering biomass and biogas (105
MW by 2020) has already been reached.
In France, Austria, Germany, Italy, and Slovenia biogas is supported through both
Feed-in Tariff and Feed-in Premium. France and Germany are currently
implementing the shift to feed-in tariffs and feed-in premiums in combination with a
tender and Slovenia revises feed-in tariffs and feed-in premiums into a tender process.
A Quota system is in place in Belgium, Poland, Romania, and Sweden. In Belgium,
quota system is applicable in all three regions. In Sweden, it is the main support
scheme for renewable electricity.
The United Kingdom applies a mix of several support schemes for biogas for electricity
generation. Biogas is mainly supported through a Feed-in Tariff and the quota system
called ‘Renewables Obligation’ (RO). From 15 January 2016 all new installations
applying for feed-in tariffs are subject to a new system of caps. From April 2017 the
RO will close to all new capacities. Since 2014, a financial instrument called Contracts
for Difference (CfD) (a Feed-in Premium scheme) is in place in Great Britain (in 2016
to be introduced in Northern Ireland). From April 2017, the CfD will be the only
support scheme for RES projects over 5MW.
In a great number of Member States biogas projects are eligible for grants or loans.
In addition, some Member States support electricity from biogas with tax regulations.
Contrary to most European biogas markets tax regulation mechanism is one of the
most important support schemes in Sweden. Biogas currently receives 100%
reduction of energy and CO2 tax.
Map 2 Support schemes for biomethane in the EU in the electricity sector
In contrast to biogas, biomethane in the electricity sector is barely supported in EU
Member States (see Map 2).

Optimal use of biogas from waste streams
March 2017 I 38
There is currently no support scheme for the promotion of biogas or biomethane in the
electricity sector in Cyprus, and there seems to be no intentions for the introduction of
such a scheme in the future. In Malta, no support measures for the promotion of
biogas have been currently and historically in place. Due to a lack of space, the
development of energy crops for biogas production is not considered suitable for
Malta.
3.3.2 Heat sector
Compared to the electricity sector, biogas in the heating sector is supported less
frequently (see Map 3). If no support schemes for electricity generation from biogas
are currently in place only in Cyprus and Malta, heat generation receives no support
also in a number of other Member States including Spain, Ireland, Italy, Luxembourg,
Latvia, Portugal, Romania and Slovenia.
By far the most widespread schemes in the heat sector to support biogas are grants
(12 Member States), followed by loans (7 Member States) and tax regulations
(5 Member States).
Feed-in Premium in the heat sector is currently applied in Austria, Estonia, Finland,
and the Netherlands. In Austria, CHP is an outstandingly fostered technology, which is
reflected through a supplementary premium to the basic feed-in tariff (CHP bonus).
The only Member State applying Feed-in Tariff in the heat sector - the so-called
‘Renewable Heat Incentive’ – is the United Kingdom. The scheme supports biogas
combustion and biomethane injection into the gas grid with a fixed tariff per kWh
produced. The scheme is available in Great Britain only; in Northern Ireland it was
closed to new applicants in March 2016.
Map 3 Support schemes for biogas in the EU in the heating sector
In contrast to biogas, biomethane is supported more in the heat than in the electricity
sector (see Map 4).

Optimal use of biogas from waste streams
March 2017 I 39
Map 4 Support schemes for biomethane in the EU in the heating sector
3.3.3 Transport sector
The most applied incentive to support biogas and biomethane in the transport sector is
the biofuel quota. Biomethane as a fuel in vehicles is covered by this scheme in
8 Member States (See Map 5).
Map 5 Support schemes for biogas and biomethane in the EU in the transport sector

Optimal use of biogas from waste streams
March 2017 I 40
When looking at Maps 1-5, it becomes obvious that biogas across EU Member States is
mainly supported in the electricity sector, while support for biomethane has its focus
on the transport sector.
While only two Member States (Cyprus and Malta) have no support for biogas for
electricity generation, in the heat and transport sectors the number of Member States
without any kind of support is much higher: 10 in the heat sector and 12 in the
transport sector.
3.3.4 Significant variations in support policies and sustainability
requirements
Clearly, biogas support policies vary significantly between Member States and the
same holds for the sustainability requirements for eligibility of the support. This can be
illustrated with the following illustrative examples of the current diversity of policies
and criteria within the EU (status mid 2016), for a number of countries that either fall
into the mature or the moderate market category11.
Biogas in Austria is supported mainly through a feed-in tariff. Among the
preconditions for the receipt of the tariff are the following requirements:
CHP plants shall reach an overall efficiency of at least 60%.
The tariff is only granted if pure agricultural substrates and animal manure with a
share of >30% are deployed. If other input materials are used, the tariff will be cut
by 20%.
For CHP-plants operating on the basis of biogas, the feed-in tariff applying for
biogas is granted with an additional premium of € 0.02 per kWh if certain criteria of
efficiency according to the Act on CHP are fulfilled.
France also uses a feed-in tariff to support renewable electricity. Biogas plants are
eligible to the feed-in tariff during 15 years with a number of restrictions, including the
requirement that the biogas shall be produced through the pyrolysis or fermentation of
substances and waste from agriculture, forestry and related industries, or through the
treatment of water, or from domestic waste through the use of biogas. The feed-in
tariff for existing biogas plants depends on the capacity, with a lower tariff for larger
plants than for plants with lower production capacity. A bonus can be granted for
biogas plants using a share of at least 60% livestock manure. A similar scheme (but
with slightly different levels of support) is expected for new plants in the near future.
For larger scale plants support is allocated via a tender scheme allowing for a financial
compensation guaranteed over 20 years. Feedstock requirements focus on waste
streams, the share of food crops shall not exceed 15% per ton of feedstock.
A Heat Fund is implemented to support heat use, e.g. biogas projects using
cogeneration of electricity and heat, biogas projects with heat recovery and upgrading
to biomethane for grid injection or use as biofuels. Under this fund, CHP project
requirements include a minimum operating time of 6,550 hours per year, and a
minimum level of annual energy efficiency (of 55% for CHP plants and 80% for boilers
and the injection into the gas grid).
11 This overview is not intended to be complete, the Member State policies are typically too
complex and extensive to reproduce here.

Optimal use of biogas from waste streams
March 2017 I 41
Finland provides a premium tariff on top of the wholesale electricity price for a period
of 12 years for producers of electricity from biogas, with several requirements. An
additional subsidy of EUR 50/MWh as a heat premium on top of the basic subsidy is
provided, if the efficiency minimum of the plant is at 50 or 75% if the nominal
capacity of generator exceeds 1 MVA.
In Germany, small renewable electricity (RES-E) plants up to 100 kW and put into
operation after 31 December 2015 are promoted under the Feed-in Tariff scheme. A
Market Premium scheme is the main support scheme for electricity from renewable
energy sources. A number of special provisions and restrictions for biogas generated
from the anaerobic fermentation of biowaste and from the fermentation of manure are
in place for both measures, including a capacity limit, an obligation to employ CHP
technology and the amount of manure used to produce the biogas is at least 80 mass
percent.
The Netherlands has implemented the SDE+ scheme which supports biogas-related
renewable electricity production for a number of categories, including electricity
generated from sewage gas using thermal pressure hydrolysis (a treatment to make
sewage waste fermentation more effective), CHP generation using gas from all-
purpose fermentation with a nominal electricity capacity of at least 20% of the total
nominal capacity, CHP using gas from mono-fermentation of animal manure, and CHP
using gas from co-fermentation of animal manure with a nominal electricity capacity of
at least 20% of the total nominal capacity. Biogas-related renewable heat production
is eligible under the SDE+ scheme for heat generation using gas from mono-
fermentation of animal manure, from co-fermentation of animal manure or from gas
from all-purpose fermentation. Similarly, biomethane production is eligible under the
SDE+ scheme for a number of categories.
In addition, the Dutch manure legislation lists substrates allowed for co-digestion12.
The United Kingdom supports biogas via the Renewables Obligation, Feed-in Tariff
scheme and the Renewable Heat Incentive. These policies include sustainability
criteria such as a minimum level of GHG savings and land criteria (demonstrating the
feedstock came from pre-existing agricultural land are sufficient).
12
The list can be found at: http://wetten.overheid.nl/BWBR0018989/2016-09-16#BijlageAa
Optimal use of biogas from waste streams
March 2017 I 42
4 Biogas scenarios until 2030 To assess the potential impacts of enhanced biogas deployment in the EU in the period
until 2030, four scenarios were developed. These scenarios are used to make a
number of ambitious but realistic projections of the biogas and biomethane
availability, production costs and CO2-equivalent emission reductions in 2030.
This chapter first discusses the methodology, and the scenarios that were developed.
Then the key aspects are presented of the CE Biogas model that was developed to
quantify the potential developments and assess the various impacts. The results of the
scenarios are presented and evaluated in the next chapter.
More details on the scenarios and the model can be found in Appendix B.
Methodology 4.1
Four scenarios were developed based on a number of overarching story lines to
identify the main variables that drive future developments, taking into account
possible policy contexts. The scenarios aim to be realistic and in line with the current
status and developments. They have a common starting point: the status quo of 2014,
and then cover the ‘corners of the playing field’ of potential biogas developments in
the EU until 2030. The scope of the scenarios is biogas production by digestion of local
waste streams.
The effects of the scenarios are calculated by the CE Biogas model per feedstock,
Member State and time period. This model uses the current feedstock deployment of
2014 as a basis (as presented in Section 2.3) and data for feedstock potential
(discussed below in Section 4.3.1). The biogas production and upgrading technologies
listed in Section 4.3.2) are implemented in the model together with a learning curve
for the investments costs and efficiencies of these technologies (Section 4.3.4).
As the amount of ‘energy crops’ (e.g. maize) is virtually unlimited from a technical
point of view, its utilization is expected to be limited by the future sustainability
policies. Initially, in the feedstock volumes used in the scenarios no additional use of
energy crops was assumed, given expected future sustainability constraints. During
the course of the project, however, it was decided to use a different approach because
of the large differences among Member States in market maturity and current use of
maize in digesters. To keep the energy crops volumes at 2014 levels would imply that
some Member States would stay at a high level of energy crops in the scenario
calculations, whereas others would have to remain at zero. This would not reflect a
realistic situation. Therefore, in the scenario calculations it was assumed that maize is
only used in co-digestion with manure in at least a mass ratio of 80% manure and
20% maize. The potential amount of maize is thus determined by the assumptions
regarding the amount of manure used for co-digestion (i.e. following the feedstock
potentials). The result is a limited growth for maize use in digesters in the scenarios
for those Member States that have large growth potentials for manure as feedstock for
digesting.
To evaluate the effects of the scenarios, a reference situation was adopted in which
the situation of 2014 is assumed to remain constant over time. Comparing results of
the scenarios with this reference situation allows us to clearly distinguish between the
developments that are assumed in the scenarios. In the next Chapter the results and
the evaluation of the scenarios will be provided.
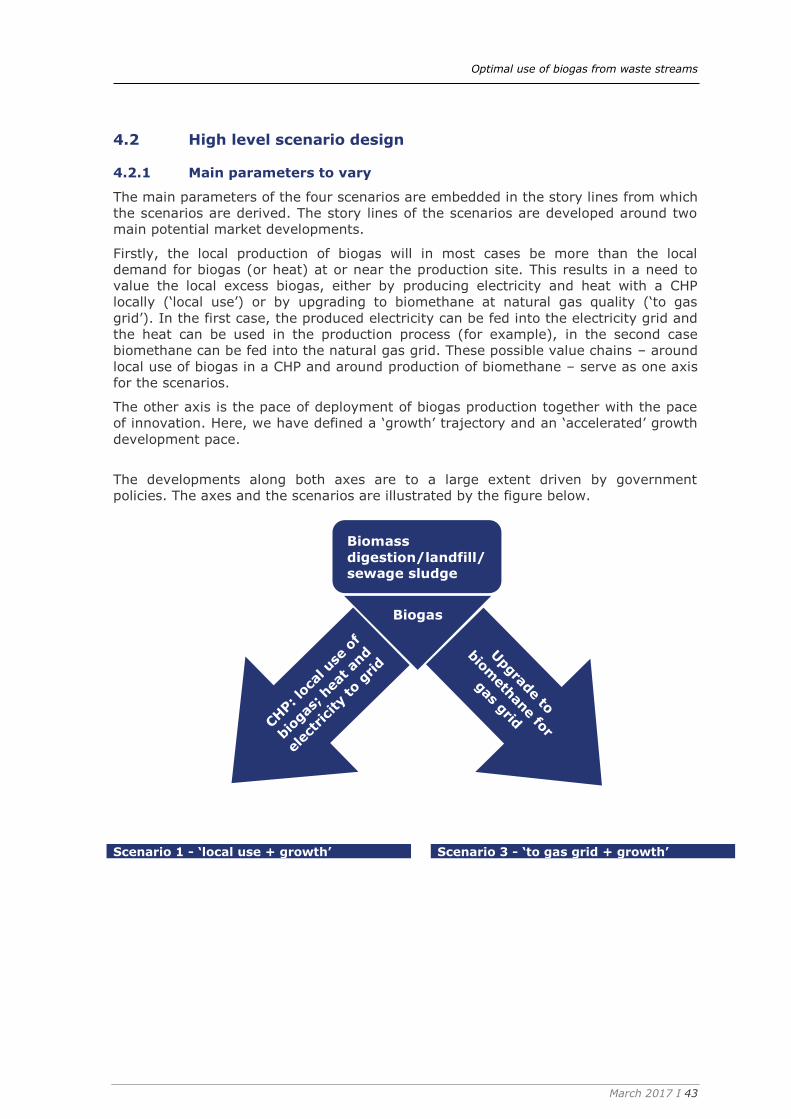
Optimal use of biogas from waste streams
March 2017 I 43
High level scenario design 4.2
4.2.1 Main parameters to vary
The main parameters of the four scenarios are embedded in the story lines from which
the scenarios are derived. The story lines of the scenarios are developed around two
main potential market developments.
Firstly, the local production of biogas will in most cases be more than the local
demand for biogas (or heat) at or near the production site. This results in a need to
value the local excess biogas, either by producing electricity and heat with a CHP
locally (‘local use’) or by upgrading to biomethane at natural gas quality (‘to gas
grid’). In the first case, the produced electricity can be fed into the electricity grid and
the heat can be used in the production process (for example), in the second case
biomethane can be fed into the natural gas grid. These possible value chains – around
local use of biogas in a CHP and around production of biomethane – serve as one axis
for the scenarios.
The other axis is the pace of deployment of biogas production together with the pace
of innovation. Here, we have defined a ‘growth’ trajectory and an ‘accelerated’ growth
development pace.
The developments along both axes are to a large extent driven by government
policies. The axes and the scenarios are illustrated by the figure below.
Scenario 1 - ‘local use + growth’ Scenario 3 - ‘to gas grid + growth’
Biomass
digestion/landfill/sewage sludge
Biogas
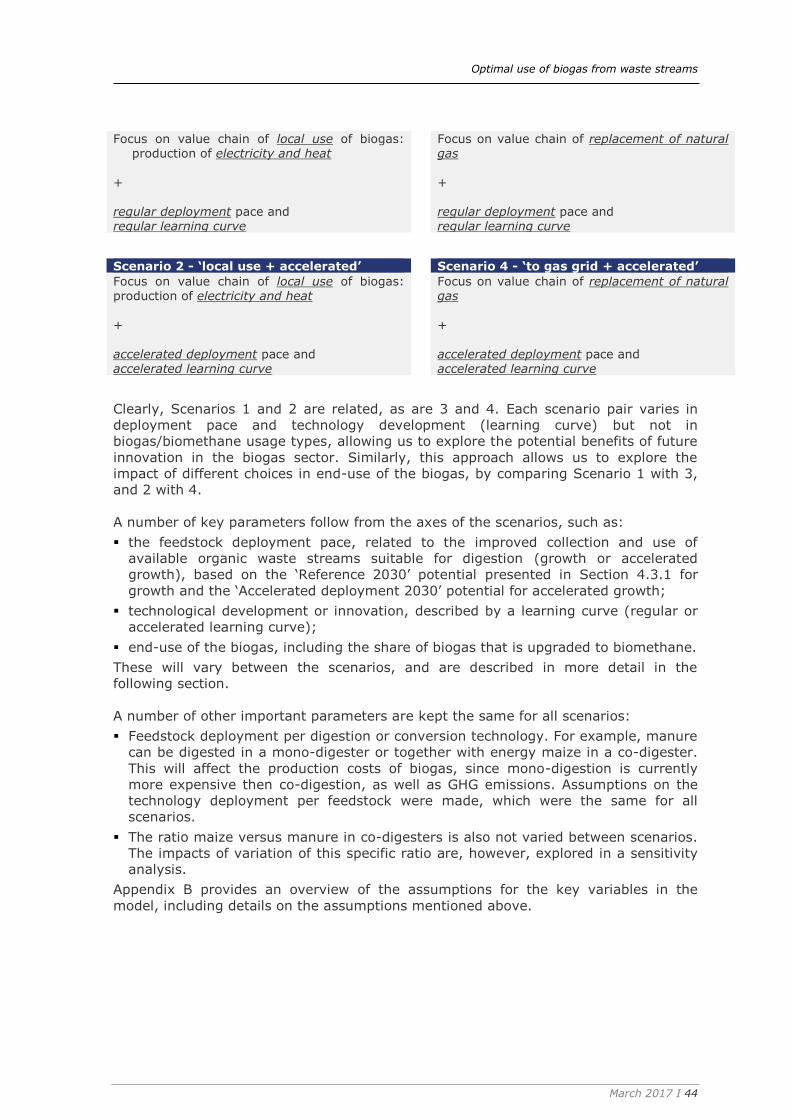
Optimal use of biogas from waste streams
March 2017 I 44
Focus on value chain of local use of biogas: production of electricity and heat
+ regular deployment pace and regular learning curve
Focus on value chain of replacement of natural gas
+ regular deployment pace and regular learning curve
Scenario 2 - ‘local use + accelerated’ Scenario 4 - ‘to gas grid + accelerated’
Focus on value chain of local use of biogas: production of electricity and heat
+ accelerated deployment pace and accelerated learning curve
Focus on value chain of replacement of natural gas
+ accelerated deployment pace and accelerated learning curve
Clearly, Scenarios 1 and 2 are related, as are 3 and 4. Each scenario pair varies in
deployment pace and technology development (learning curve) but not in
biogas/biomethane usage types, allowing us to explore the potential benefits of future
innovation in the biogas sector. Similarly, this approach allows us to explore the
impact of different choices in end-use of the biogas, by comparing Scenario 1 with 3,
and 2 with 4.
A number of key parameters follow from the axes of the scenarios, such as:
the feedstock deployment pace, related to the improved collection and use of
available organic waste streams suitable for digestion (growth or accelerated
growth), based on the ‘Reference 2030’ potential presented in Section 4.3.1 for
growth and the ‘Accelerated deployment 2030’ potential for accelerated growth;
technological development or innovation, described by a learning curve (regular or
accelerated learning curve);
end-use of the biogas, including the share of biogas that is upgraded to biomethane.
These will vary between the scenarios, and are described in more detail in the
following section.
A number of other important parameters are kept the same for all scenarios:
Feedstock deployment per digestion or conversion technology. For example, manure
can be digested in a mono-digester or together with energy maize in a co-digester.
This will affect the production costs of biogas, since mono-digestion is currently
more expensive then co-digestion, as well as GHG emissions. Assumptions on the
technology deployment per feedstock were made, which were the same for all
scenarios.
The ratio maize versus manure in co-digesters is also not varied between scenarios.
The impacts of variation of this specific ratio are, however, explored in a sensitivity
analysis.
Appendix B provides an overview of the assumptions for the key variables in the
model, including details on the assumptions mentioned above.
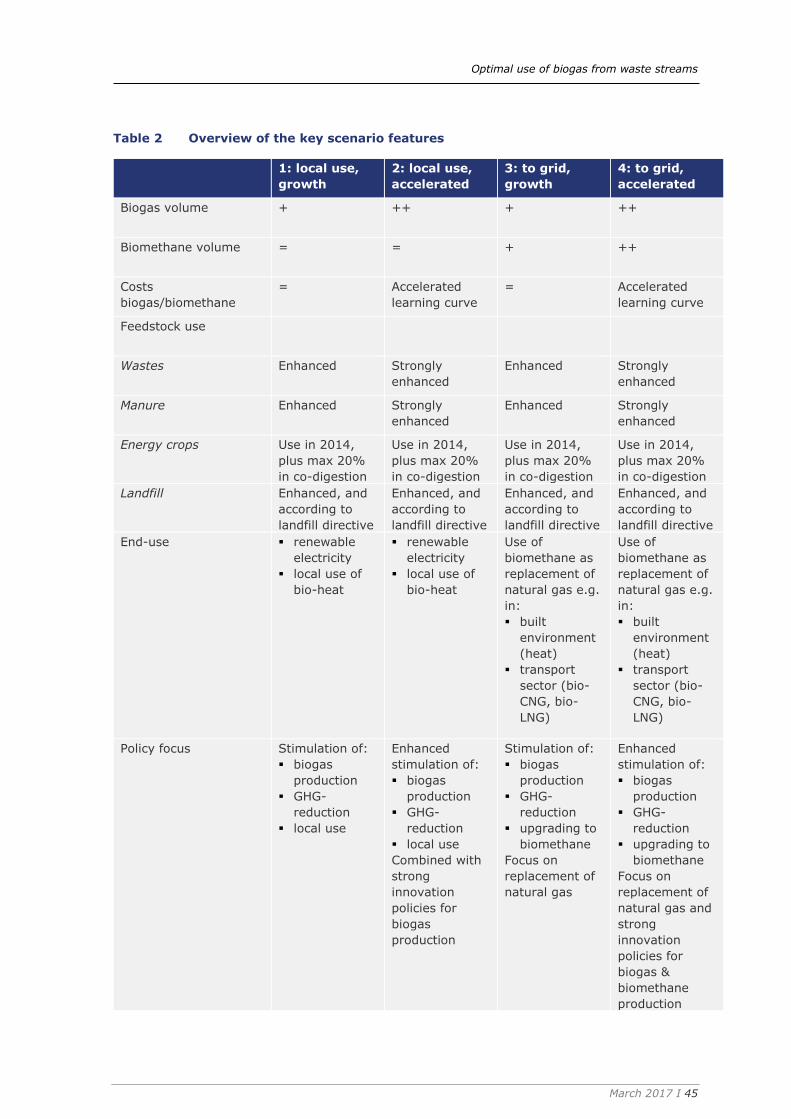
Optimal use of biogas from waste streams
March 2017 I 45
Table 2 Overview of the key scenario features
1: local use,
growth
2: local use,
accelerated
3: to grid,
growth
4: to grid,
accelerated
Biogas volume + ++ + ++
Biomethane volume = = + ++
Costs
biogas/biomethane
= Accelerated
learning curve
= Accelerated
learning curve
Feedstock use
Wastes Enhanced Strongly
enhanced
Enhanced Strongly
enhanced
Manure Enhanced Strongly
enhanced
Enhanced Strongly
enhanced
Energy crops Use in 2014,
plus max 20%
in co-digestion
Use in 2014,
plus max 20%
in co-digestion
Use in 2014,
plus max 20%
in co-digestion
Use in 2014,
plus max 20%
in co-digestion
Landfill Enhanced, and
according to
landfill directive
Enhanced, and
according to
landfill directive
Enhanced, and
according to
landfill directive
Enhanced, and
according to
landfill directive
End-use renewable
electricity
local use of
bio-heat
renewable
electricity
local use of
bio-heat
Use of
biomethane as
replacement of
natural gas e.g.
in:
built
environment
(heat)
transport
sector (bio-
CNG, bio-
LNG)
Use of
biomethane as
replacement of
natural gas e.g.
in:
built
environment
(heat)
transport
sector (bio-
CNG, bio-
LNG)
Policy focus Stimulation of:
biogas
production
GHG-
reduction
local use
Enhanced
stimulation of:
biogas
production
GHG-
reduction
local use
Combined with
strong
innovation
policies for
biogas
production
Stimulation of:
biogas
production
GHG-
reduction
upgrading to
biomethane
Focus on
replacement of
natural gas
Enhanced
stimulation of:
biogas
production
GHG-
reduction
upgrading to
biomethane
Focus on
replacement of
natural gas and
strong
innovation
policies for
biogas &
biomethane
production
Optimal use of biogas from waste streams
March 2017 I 46
In the next sections, the storylines of the individual scenarios, the policy context and
the main assumptions are presented.
4.2.2 Scenario 1: Local use + electricity
This scenario focusses on a value chain of local use of the produced biogas, by
production of electricity and heat using cogeneration (CHP). The heat produced is used
locally (if possible), the excess electricity is fed into the electricity grid. This local use
maximises the production of renewable energy (heat and electricity) from the
available biomass feedstock potentials against the lowest cost, because no extra
investment steps and accompanying conversion losses are involved (e.g. for biogas
upgrading, grid injection, etc.).
This implies that:
renewable energy production from biogas will increase compared to 2014 levels;
biogas use focusses on local use, for electricity and heat production;
deployment of biogas production is assumed to grow, following the growth of
feedstock used for biogas production;
innovation rate is assumed to be regular.
In this scenario, it is assumed that the main driver for future biogas growth and
support is the aim of Member States to use biogas locally in the electricity and heating
sectors with high energy efficiency, optimizing the contribution of the available biogas
to the renewable energy target.
Policy context
The developments of this scenario are driven by government policies (at different
levels) throughout the EU.
Member States and regional/local policies effectively drive the conversion of suitable
biomass waste streams to digestion, and subsequently to the production of
renewable energy (heat and electricity);
the EU defines sustainability criteria for biogas which include, inter alia, a minimum
level of GHG savings, and effectively prevents ILUC due to biogas production.
Key assumptions
government policies effectively achieve that biogas production increases over time,
until the full sustainable biogas production of the ‘2030 reference potential’ is
reached in 2030 (see Section 4.3.1), in all Member States;
government policies focus on most cost-effective option for renewable energy
production from biogas, from societal perspective;
local use of biogas, with 100% application in CHP;
on average 25% of the nett heat production (net heat production = heat production
by the CHP minus the heat demand of the digester) is effectively used as
replacement of heat production by boilers using natural gas;
‘regular’ innovation rates on investment costs and feedstock to biogas yield (see
Section 4.3.4).
4.2.3 Scenario 2: Local use + electricity, with accelerated deployment
and innovation
This scenario focusses, as Scenario 1 (Local use + electricity, see above), on a value
chain of local use of the produced biogas, by production of electricity and heat using
cogeneration (CHP). But in this scenario, accelerated deployment of the biogas
production is assumed, together with accelerated innovation rates, both as a result of
strong policies targeting biogas production and R&D for these specific technologies.

Optimal use of biogas from waste streams
March 2017 I 47
Compared to Scenario 1, this implies:
Faster growth rates for the production of biogas.
Steeper learning curves for existing technology both on efficiency and on cost,
leading to lower cost and emissions per unit biogas.
More feedstock can be deployed in the period to 2030 than in Scenario 1. The upper
values for the feedstock potential are used.
The main driver/reasoning for this scenario is the same as in Scenario 1: to use biogas
locally in the electricity and heating sectors with high energy efficiency, optimizing the
contribution of the available biogas to the renewable energy target.
As in the first scenario, biogas production and use are assumed to be mainly local and
regional scale projects, i.e. focus on local and regional feedstocks and local and
regional use of the biogas.
Policy context
The developments of this scenario are driven by government policies (at different
levels) throughout the EU similar to those in Scenario 1, but with additional or
stronger policies and accompanied funding for faster deployment of biogas production,
and stronger policy support for R&D.
Key assumptions
government policies effectively achieve that biogas production increases over time,
until the full sustainable biogas production of the ‘2030 accelerated deployment
potential’ is reached in 2030 (Section 4.3.1), in all Member States;
strong policy support, with focus on most cost-effective option for renewable energy
production from biogas, from societal perspective;
local use of biogas, with 100% application in CHP;
on average 25% of the nett heat production (net heat production = heat production
by the CHP minus the heat demand of the digester) can be effectively used as
replacement of heat production by boilers using natural gas;
accelerated/enhanced innovation rates on investment costs and feedstock to biogas
yield, compared to Scenario 1.
4.2.4 Scenario 3: Biomethane to grid
The main driver/reasoning for this scenario is the desire to use the biogas to replace
fossil fuels in applications where other sustainable alternatives are scarce: for heating
in the built environment and industry (via the natural gas grid) and use as a transport
fuel, to replace diesel. This helps the EU and the Member States to reduce their
dependence on fossil fuel also in those sectors and applications. It can also be seen as
a step towards further developing and strengthening the biobased economy, replacing
the industry feedstock natural gas by biomethane. In this scenario an increasing share
of biogas is converted to biomethane of natural gas quality, for use elsewhere. This
biomethane can be injected into the gas grid or distributed separately (e.g. via trucks)
to be used for example in heavy-duty transport when converted to bio-CNG or bio-
LNG, for heating in specific areas in the existing built environment or in high
temperature processes in industry; three sectors with relatively few options for
renewable energy. This could be the result of a targeted EU market mechanism to
reach the EU-wide RES target in 2030, and/or of the Member State’s individual policy
strategies to implement the EU-wide target.
This scenario can also result in increasing cross-border trade of biomethane within the
EU, since the share of biomethane in the natural gas grid increases.

Optimal use of biogas from waste streams
March 2017 I 48
Policy context
This scenario assumes the following policy strategy.
Member State and regional/local policies support biomethane injection into the gas
grid and/or biomethane consumption in the sectors listed above (for example by
supporting its use in heavy-duty transport);
strong EU renewable energy policy, driving this Member State policy (to achieve an
EU-wide focus on these routes);
strengthening of the EU’s alternative fuels in transport policies, including support to
the roll-out of a (bio-)CNG and/or LNG fuelling infrastructure;
further alignment of the EU’s renewable energy policy framework to biomethane
injection into the grid, including harmonisation of cross-border trade regulations.
Key assumptions
focus on upgrading of the produced biogas to natural gas quality and injection in the
gas grid;
biogas production increases over time, until the full sustainable biogas production of
the ‘2030 reference feedstock potential’ is reached in 2030 (see Section 4.3.1);
driven by government policies on all levels;
use of the biomethane for applications where other sustainable alternatives are
scarce;
enhanced roll-out of LNG fuelling infrastructure for heavy-duty vehicles (HDV), and
increasing shares of LNG-fuelled HDV;
innovation rates on investment costs and feedstock to biogas yield as regular;
this scenario is in general modelled as 100% upgrading of biogas to biomethane for
the gas grid. Variations on this scenario are 100% upgrading to bio-CNG or bio-LNG.
4.2.5 Scenario 4: Biomethane to grid, with accelerated deployment and
innovation
This scenario focusses, as Scenario 3, on conversion to biomethane as means to
replace natural gas in those applications for which sustainable alternatives are scarce.
However, in this scenario, accelerated deployment of the biogas/biomethane
production is assumed, together with accelerated innovation rates, both as a result of
strong policies targeting biogas production and R&D for these specific technologies.
Compared to Scenario 3, this implies:
Faster growth rates for the production of biogas and, thus, biomethane.
Steeper learning curves for existing technology both on efficiency and on cost,
leading to lower cost and emissions per unit biogas and biomethane.
More feedstock can be deployed in the period to 2030 than in Scenario 3. The upper
values for the feedstock potential (see Section 4.3.1) are used.
The main driver/reasoning for this scenario is the aim of Member States to use
biomass and biomethane optimally to reduce their dependence on natural gas and
diesel and to further develop and strengthen the biobased economy.
This scenario may also result in an increasing cross-border trade of biomethane within
the EU, since the share of biomethane in the natural gas grid increases.

Optimal use of biogas from waste streams
March 2017 I 49
Policy context
The developments of this scenario are driven by government policies at different levels
throughout the EU, as they are in Scenario 3, but with additional policies and
accompanied funding for faster deployment of biogas/biomethane production, and
strong policy support focused on R&D.
Key assumptions
focus on upgrading of the produced biogas to natural gas quality and injection in the
gas grid;
biogas production increases over time, until the full sustainable biogas production of
the ’2030 accelerated deployment potential’ is reached in 2030 (see Section 4.3.1;
driven by government policies on all levels;
use of the biomethane for applications where other sustainable alternatives are
scarce;
enhanced roll-out of LNG fuelling infrastructure for heavy-duty vehicles, and
increasing shares of LNG-fuelled HDV;
accelerated/enhanced innovation rates on investment costs and feedstock to biogas
yield, compared to Scenario 3;
this scenario is in general modelled as 100% upgrading of biogas to biomethane for
the gas grid. Variations on this scenario are 100% upgrading to bio-CNG or bio-LNG.
Biogas model and scenario implementation 4.3
The CE Biogas model is an Excel- and VBA-based calculation model to calculate the
effects of biogas scenarios per feedstock, EU Member State and time period. The
model uses a feedstock and technology database filled with the necessary data on
feedstocks and technologies as discussed in the following Sections and Appendix B.
Learning curves are implemented in the model to account for the effect of learning by
innovation on investment costs, conversion efficiencies, electricity consumption and
methane loss.
In the model calculations it is assumed that all new available feedstocks per Member
State in a given period are digested or converted to biogas. The biogas is then
upgraded to biomethane, or directly used in a biogas CHP. Figure 12 illustrates the
model building blocks and calculation sequence on a schematic level. This results in a
staged procedure, where the calculations concerning the production of the biogas are
separated from the calculations concerning the biogas upgrading and utilisation.
Figure 12 Schematic view of the building blocks and calculation sequence of the
model, from feedstock to utilisation of the biogas and biomethane

Optimal use of biogas from waste streams
March 2017 I 50
4.3.1 Feedstock potentials
The estimates of the feedstocks’ potential availability for biogas production are
sourced from the Biomass Policies project (Elbersen, 2016). In that project several
scenarios have been presented, from which we selected the Reference and High
bioenergy & global sustainability scenario. The first was assumed to be representative
for the two ‘Growth’ scenarios of this project; the latter was used as a basis for the
two ‘Accelerated Deployment’ scenarios. The high bioenergy global sustainability
scenario builds on the Energy Roadmap 2050-Primes high RES scenario; it involves
strict sustainability and resource efficiency criteria, in the EU and globally.
From the Biomass Policies database, 20 feedstocks types for anaerobic digestion have
been identified to estimate biomass potential for biogas production for 2020 and 2030,
which were summarised in six groups:
1. Energy crops (energy maize, and forage grass cuttings).
2. Solid manure (solid manure from poultry, cattle, pigs, goats and sheep).
3. Liquid manure (liquid manure from cattle and pigs).
4. Agricultural residue streams (residues from sunflower, rapeseed, sugar beet tops,
and road-side verges).
5. Organic waste (from households: Animal & mixed food waste, vegetal waste,
municipal solid waste; Other sources: Animal & mixed food waste, vegetal waste,
municipal solid waste, and used animal fats and vegetal oils). And
6. Sludge.
For manure updated calculations were made of the potential, based on data from
MITERRA-Europe model. In the Reference scenario all liquid manure and 50% of solid
manure from farms with >200 livestock units is considered. In the High bioenergy &
global sustainability scenario all liquid manure and 50% of solid manure from farms
with >50 livestock units is considered.
Figure 13 shows the current feedstock use together with the feedstock potentials for
2020 and 2030 for these two feedstock scenarios. New potential feedstocks such as
cover crops/intermediate crops, sea weed and algae were not included in the
potentials, as EU-wide data is lacking and especially for sea weed and algae it is still
very uncertain whether these feedstocks can be produced at a cost-effective large
scale manner.
As discussed in Section 4.1, the amount of maize was assumed to be limited in
scenario calculations, due to future sustainability constraints. The feedstock potentials
are calculated based on the assumption that maize is only used in co-digestion with
manure in at least a mass ratio of 80% manure and 20% maize. The level of maize in
the feedstock potential is thus determined by the assumptions regarding the amount
of manure used for co-digestion (i.e. following the feedstock potentials).

Optimal use of biogas from waste streams
March 2017 I 51
Figure 13 Current feedstock use and potentials for 2020 and 2030 based on two scenarios (PJ)
For solid and liquid manure and organic waste still a large potential for biogas
production is available, whereas for sludges the current use is already estimated to be
higher than the future potential. This might be due to uncertainties in the data,
assumptions on better use of wastes over time which will reduce sludge volumes, or
differing assumptions in the biogas yield. In any case, it indicates that there is no
large feedstock potential for increase in biogas production from sewage sludge (and
using current technologies).
The total additional feedstock potential in 2030, excluding energy crops and landfill, is
estimated at 470 PJ in the ‘Reference’ scenario and 890 PJ in the ‘Accelerated
Deployment’ scenario. This potential might increase in the future if new feedstock
sources such as cover crops and sea weed are included, but it is very uncertain
whether these feedstocks can be used for biogas in a cost-effective manner in the
time period to 2030.
The landfill gas potential for 2030 per Member State is taken from SERPECC
(SERPECCC, 2009) and shown in Figure 14. For the landfill gas production in 2014 we
used the data of EurObserv’ER 2015 (EurObserv'ER, 2015). The methane emissions
from landfill reported by SERPECC are the theoretical maximum, it is not sure whether
these can be fully recovered and used as biogas. At least it is hard to do this
economically in all cases. In the model calculations we therefore assumed a 95%
utilization.
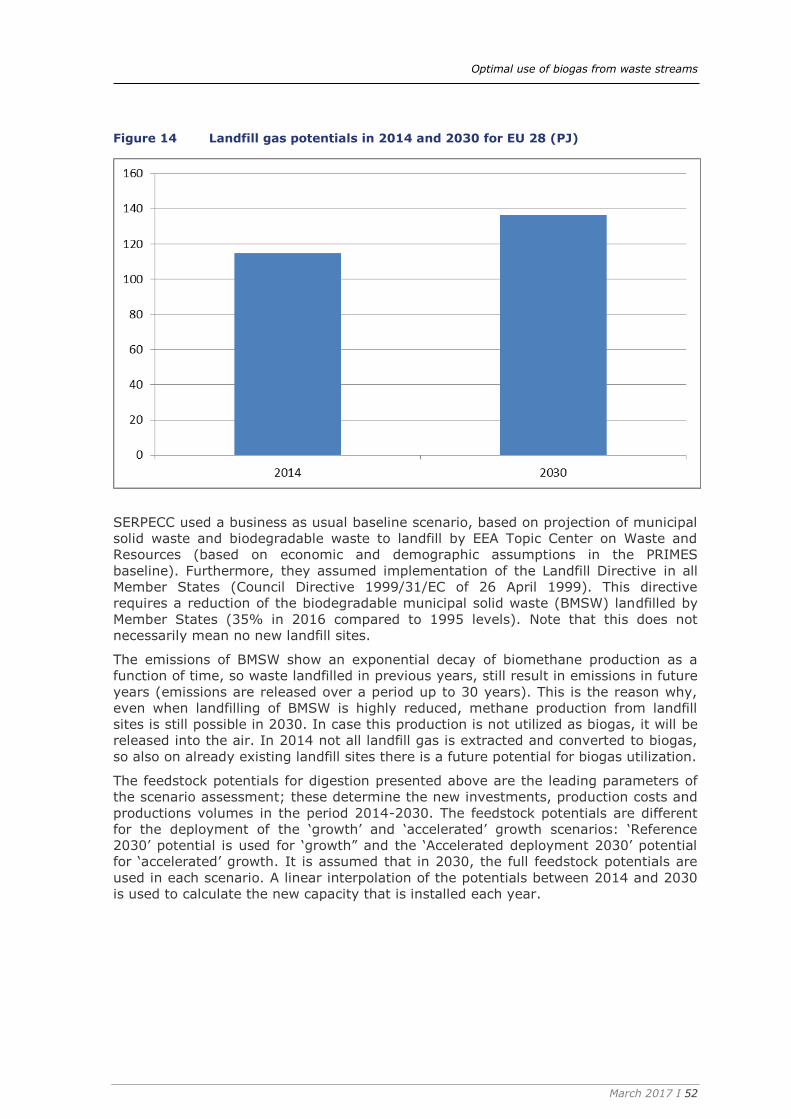
Optimal use of biogas from waste streams
March 2017 I 52
Figure 14 Landfill gas potentials in 2014 and 2030 for EU 28 (PJ)
SERPECC used a business as usual baseline scenario, based on projection of municipal
solid waste and biodegradable waste to landfill by EEA Topic Center on Waste and
Resources (based on economic and demographic assumptions in the PRIMES
baseline). Furthermore, they assumed implementation of the Landfill Directive in all
Member States (Council Directive 1999/31/EC of 26 April 1999). This directive
requires a reduction of the biodegradable municipal solid waste (BMSW) landfilled by
Member States (35% in 2016 compared to 1995 levels). Note that this does not
necessarily mean no new landfill sites.
The emissions of BMSW show an exponential decay of biomethane production as a
function of time, so waste landfilled in previous years, still result in emissions in future
years (emissions are released over a period up to 30 years). This is the reason why,
even when landfilling of BMSW is highly reduced, methane production from landfill
sites is still possible in 2030. In case this production is not utilized as biogas, it will be
released into the air. In 2014 not all landfill gas is extracted and converted to biogas,
so also on already existing landfill sites there is a future potential for biogas utilization.
The feedstock potentials for digestion presented above are the leading parameters of
the scenario assessment; these determine the new investments, production costs and
productions volumes in the period 2014-2030. The feedstock potentials are different
for the deployment of the ‘growth’ and ‘accelerated’ growth scenarios: ‘Reference
2030’ potential is used for ‘growth” and the ‘Accelerated deployment 2030’ potential
for ‘accelerated’ growth. It is assumed that in 2030, the full feedstock potentials are
used in each scenario. A linear interpolation of the potentials between 2014 and 2030
is used to calculate the new capacity that is installed each year.
Optimal use of biogas from waste streams
March 2017 I 53
4.3.2 Technologies
As was described in Section 2.6, a range of biogas production systems are in use
throughout the EU. In the scenario and model calculations the following technologies
are included:
non-specific digestion;
mono-digestion;
co-digestion;
sewage sludge digestion;
landfill gas cleaning.
Other technologies incorporated in the model are:
upgrading of biogas to biomethane;
compression of biomethane to bio-CNG;
liquefaction of biomethane to bio-LNG;
biogas and clean landfill gas CHP.
These technologies all have their own process characteristics (e.g. energy input,
efficiencies) and cost associated with them. Details about the main technological
assumptions can be found in Appendix A. This Appendix also includes a number of key
assumptions on feedstock deployment per technology.
4.3.3 Cost and GHG reduction calculations
Costs are calculated over the production chain, taking into account the investments in
new capacity, substrate costs where relevant, annual O&M costs and electricity costs
where relevant (e.g. electricity used for gas compression)13. GHG emissions are also
calculated ‘from well-to-wheel’, i.e. using a life cycle approach.
For each two-year period, the production costs of new invested capacities are
calculated, as are the GHG emission effects of the added production. In case of
decreasing feedstock potentials, the model calculations account for decreasing biogas
production volumes, GHG emissions and operational costs (excluding O&M costs since
existing investments have to be maintained). This occurs in some specific countries,
for example due to changing demographics. The total production volumes of biogas or
biomethane in a specific year are then calculated by adding this new production to the
existing volumes of 2014. Production costs of existing capacities are not included,
since details of the historic investments are unknown. Moreover, the aim of this study
is to provide policy recommendations. Since the costs of already existing production
facilities are in fact sunken costs, we concentrated on the costs of new production
facilities in the scenario evaluations.
The GHG emission effects are then calculated for the feedstocks and chain emissions,
mainly due to electricity consumption and methane slip. For maize we used the
emission factors determined by JEC14 (whole maize plant) excluding compression to
bio-CNG (JEC - Joint Research Centre-EUCAR-CONCAWE collaboration, 2014), to
ensure alignment with other EU calculations. For the other feedstocks, where no JEC
emission factors were available, the emission calculations were based on the data in
our feedstock and technology database.
13 Cost of grid expansion or biomethane road transport are not included, these differ
significantly between projects, depending on the local and regional circumstances, and average cost factors are unknown.
14 We assumed that all manure feedstocks have the same emission factor equal to the JEC
emission factor for wet manure.

Optimal use of biogas from waste streams
March 2017 I 54
In the specific situation when the biogas is used in a CHP, part of the heat produced
by CHP is used for heating the digester tank. Nevertheless, there is a net heat
production from the combined installation (digester + CHP). In determining the
electricity production costs by CHP it is assumed that 25% of the nett heat produced
can be put on the market, and the other 75% of the net heat is lost. This may be a
pessimistic assumption for specific cases or countries where much more of the net
heat can be used, but might be very optimistic when looking at the (average) EU level,
taking into account the large volumes of biogas that are produced in the scenarios,
often at remote locations where there is not a large heat demand.
In the scenarios, it is assumed that the heat is sold at the price of producing the same
amount of heat produced with a natural gas boiler. The heat which is sold on the
market is accounted as a revenue to the costs of producing electricity by the CHP
installation. The nett costs of the whole chain – digestion and the generation of
electricity by cogeneration – is used to calculate the production costs of electricity.
4.3.4 Learning curve: cost reduce over time, and process efficiencies
increase
Learning curves represent the effect that technology costs per unit capacity or unit
energy decrease as a function of time, as the market grows. In a strict theoretical
approach, the costs per unit are represented as a function of market volume. In the
calculations for this biogas study, we used cost curves as a function of time, using
typical cost curve shape adopted from well documented wind farm investment cost
reductions (Junginger, 2005). For the biogas ‘growth’ and ‘accelerated growth’
scenarios, different initial slopes of the learning curve were assumed; representing
different innovation rates, see Figure 15.
The learning curves provides the cost reduction as a function of time. To the right end
side, the technology gets more mature and the curve flattens out, whereas at the left
end side, the curve is steep. In the model, the cost reduction as a function of time of
each specific technology is calculated by placing each technology on its own starting
point on the curve in the year 2014, based on the amount of years from the market
introduction of the technology. Relatively young technologies, with large cost
reduction potentials, are thus placed on the steep left part of the curve, whereas
mature technologies, with small cost reduction potentials, are placed on the flat right
part of the curve. The same approach is used to calculate improvements of the
conversion efficiency and reduction of electricity consumption and methane loss over
time.
The learning curve was furthermore used for digestion, resulting in the assumption
that the biogas yield15 per feedstock will increase to 110% of the 2014 yield in 2030 in
the ‘growth’ scenarios and to 120% in the ‘accelerated growth’ scenarios. For other
technologies we assume about 20% reduction in the cost, conversion efficiency and
electricity consumption between 2014 and 2030.
15 The biogas yield of a feedstock indicates the amount of biogas that can be generated from a
certain amount of feedstock. New processes or technologies, e.g. pre-treatment, might be
able to extract more biogas from the same amount of feedstock, thus increasing the yield.
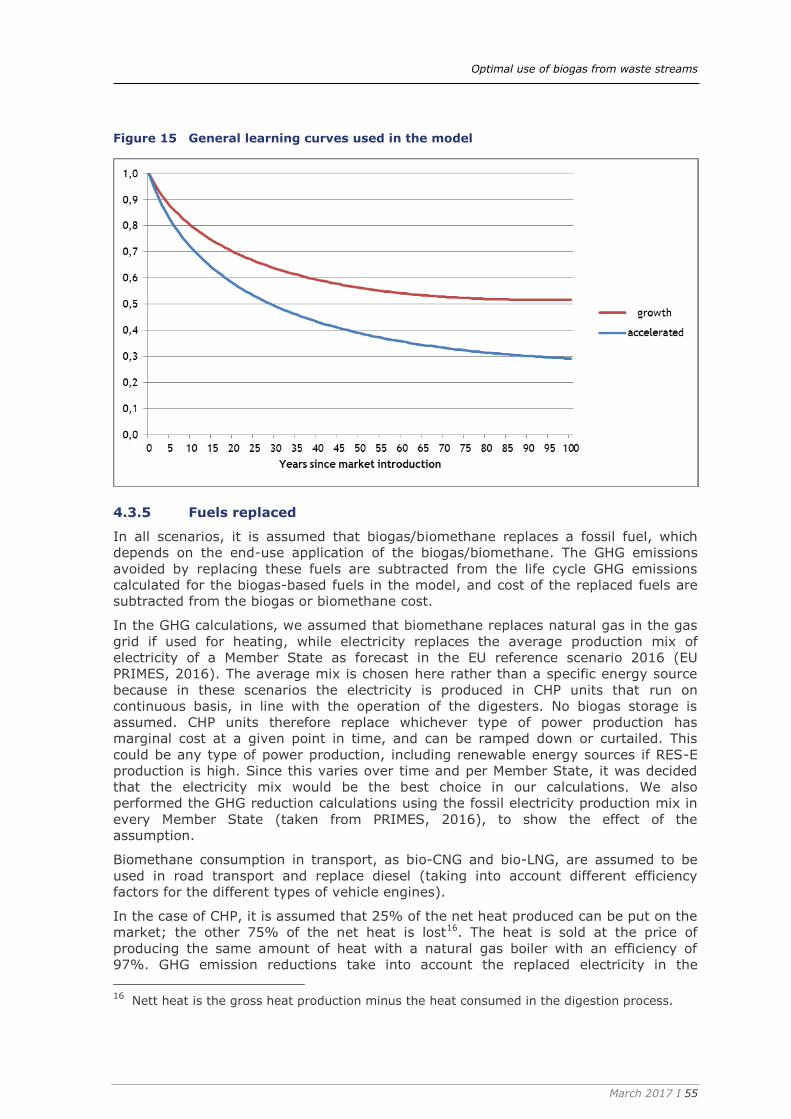
Optimal use of biogas from waste streams
March 2017 I 55
Figure 15 General learning curves used in the model
4.3.5 Fuels replaced
In all scenarios, it is assumed that biogas/biomethane replaces a fossil fuel, which
depends on the end-use application of the biogas/biomethane. The GHG emissions
avoided by replacing these fuels are subtracted from the life cycle GHG emissions
calculated for the biogas-based fuels in the model, and cost of the replaced fuels are
subtracted from the biogas or biomethane cost.
In the GHG calculations, we assumed that biomethane replaces natural gas in the gas
grid if used for heating, while electricity replaces the average production mix of
electricity of a Member State as forecast in the EU reference scenario 2016 (EU
PRIMES, 2016). The average mix is chosen here rather than a specific energy source
because in these scenarios the electricity is produced in CHP units that run on
continuous basis, in line with the operation of the digesters. No biogas storage is
assumed. CHP units therefore replace whichever type of power production has
marginal cost at a given point in time, and can be ramped down or curtailed. This
could be any type of power production, including renewable energy sources if RES-E
production is high. Since this varies over time and per Member State, it was decided
that the electricity mix would be the best choice in our calculations. We also
performed the GHG reduction calculations using the fossil electricity production mix in
every Member State (taken from PRIMES, 2016), to show the effect of the
assumption.
Biomethane consumption in transport, as bio-CNG and bio-LNG, are assumed to be
used in road transport and replace diesel (taking into account different efficiency
factors for the different types of vehicle engines).
In the case of CHP, it is assumed that 25% of the net heat produced can be put on the
market; the other 75% of the net heat is lost16. The heat is sold at the price of
producing the same amount of heat with a natural gas boiler with an efficiency of
97%. GHG emission reductions take into account the replaced electricity in the
16
Nett heat is the gross heat production minus the heat consumed in the digestion process.

Optimal use of biogas from waste streams
March 2017 I 56
Member States electricity mix (again based on Primes 2016 Reference scenario), and
the reduced GHG emissions of avoided natural gas consumption of the heat sold
(50.81 gCO2-eq/MJheat).
An overview of the key assumptions is provided in Table 3.
Table 3 Replaced fossil fuels and the emission factors used
Sector/application Fuel assumed to be replaced
by biogas/biomethane
Emission factor of
the replaced fuel
(gCO2-eq/MJ)
Transport (bio-CNG, bio-LNG) Diesel, using an efficiency
factor to compare fuel
efficiency of diesel with CNG
(0.91 MJdiesel/MJCNG) and LNG
(1.11 MJdiesel/MJLNG) (CE Delft,
ECN and TNO, 2013)
95.10
(Council of the
European Union, 2015)
Biomethane at natural gas
quality in gas grid
Natural gas 49.36
CHP (cogeneration of electricity
and heat)
Natural gas
Electricity (production mix)
49.36
Variable
(EU PRIMES, 2016)
In view of the large uncertainties in the future cost development of these energy
sources, the 2014 EU-average prices are used in the cost calculations, based on 2014
Eurostat data: 9.5 €/GJ is used for the average EU natural gas price; 27.78 €/GJ for
electricity and 15.70 €/GJ for diesel (average prices of Q3 and Q4 of 2014).
Alternatively, it might be argued that biogas/biomethane replaces a renewable energy
source (wind, solar, biofuel, etc.), taking the viewpoint that Member States aim for an
overall renewable energy target: more investments in biogas then result in less
investments in other RES. However, this approach has not been chosen here: in this
study the biogas/biomethane routes are assessed based on their own merit, the study
does not aim to provide a direct comparison with other RES options.
Note that these assumptions are quite crucial to the calculations of the effects of the
various scenarios and biogas-to-end-use routes.
Key output from the modelling 4.4
For each scenario, a range of output data is calculated per two-years interval. Data is
calculated at Member State level, and aggregated to EU28-level. The outputs are:
biogas production volume per feedstock and digestion technology (ktoe);
biomethane production volume (ktoe);
CHP heat and electricity generation (ktoe);
life cycle GHG emissions (tCO2-eq) and emission reduction (reduction %);
biogas, biomethane, bio-CNG and bio-LBG production costs per technology,
excluding taxes and levies (€/ktoe).
These results are presented in the next Chapter.

Optimal use of biogas from waste streams
March 2017 I 57
5 Scenario evaluation
In this chapter the main results of the scenario calculations discussed in Chapter 4 are
provided and evaluated. For each scenario, a number of key parameters are assessed:
biogas production volume potential;
production costs of biogas;
production costs of bio-electricity (from CHP) and of biomethane;
greenhouse gas emission reduction potentials;
fossil fuels replaced;
biogas contribution to RES deployment in the EU.
In addition, in Section 5.8 we briefly discuss the impact of maize/manure ratio in
co-digestion on GHG emissions of the produced biogas.
The results of these calculations indicate what would happen if the feedstock
potentials that were identified are fully utilized, exploring ‘the corners of the playing
field’.
Biogas production volume potential 5.1
As was discussed in the previous chapter, the feedstock potential in 2030 of the
accelerated scenarios (Scenarios 2 & 4) is larger than the feedstock potential of the
growth scenarios (Scenarios 1 & 3). Together with different assumptions on how fast
this potential can be deployed and the learning effects (i.e. cost reductions and
conversion efficiencies) that can be achieved, this results in two different growth rates
and a higher biogas production in the accelerated scenarios, as shown in Figure 16.
The potential biogas production for the EU28 in 2030 is calculated to be 28.8 and 40.2
Mtoe (of 1,436 Mtoe total primary EU energy consumption, as forecast in the 2016 EC
Reference scenario to 2050) in the growth and accelerated growth scenarios
respectively. This is about 1.9 and 2.7 times larger than the biogas production in 2014
(Eurostat data). Clearly, these results show that there is a considerable growth
potential of biogas from digestion of waste streams, if the right policies and
regulations are put in place.
The results also show that with the linear growth rate that is assumed in these
scenarios between 2014 and 2030, biogas production in the EU28 would increase
between now and 2020: 2020 production levels are in these scenarios 1.3 and 1.6
times higher than 2014 production levels, respectively. It should be noted that the
calculated 2020 production levels might be an underestimate in some countries, due
to the assumption of linear growth rate between 2014 and 2030.
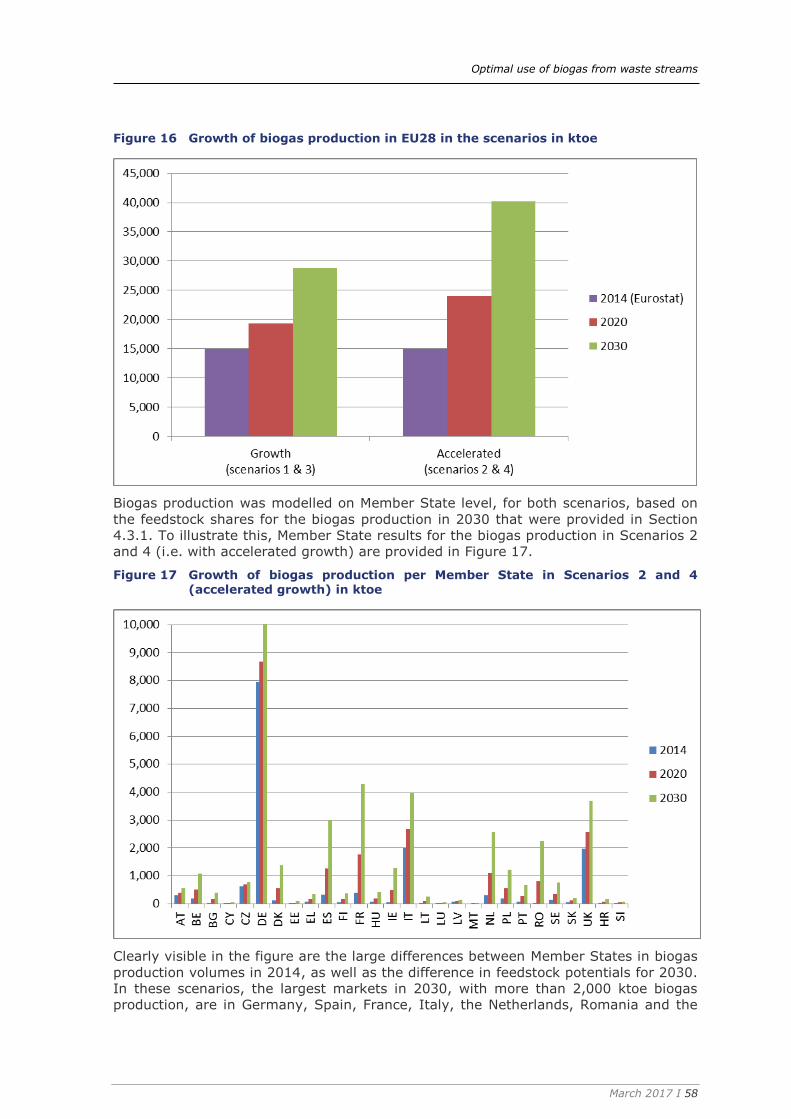
Optimal use of biogas from waste streams
March 2017 I 58
Figure 16 Growth of biogas production in EU28 in the scenarios in ktoe
Biogas production was modelled on Member State level, for both scenarios, based on
the feedstock shares for the biogas production in 2030 that were provided in Section
4.3.1. To illustrate this, Member State results for the biogas production in Scenarios 2
and 4 (i.e. with accelerated growth) are provided in Figure 17.
Figure 17 Growth of biogas production per Member State in Scenarios 2 and 4 (accelerated growth) in ktoe
Clearly visible in the figure are the large differences between Member States in biogas
production volumes in 2014, as well as the difference in feedstock potentials for 2030.
In these scenarios, the largest markets in 2030, with more than 2,000 ktoe biogas
production, are in Germany, Spain, France, Italy, the Netherlands, Romania and the
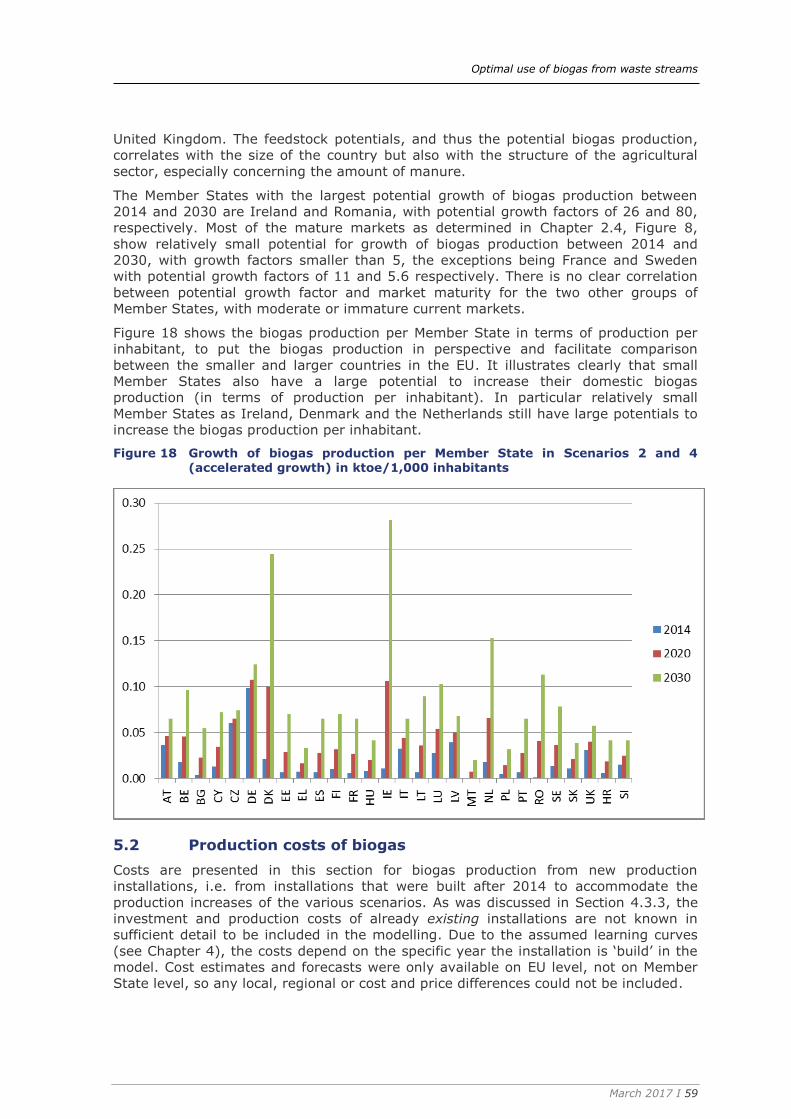
Optimal use of biogas from waste streams
March 2017 I 59
United Kingdom. The feedstock potentials, and thus the potential biogas production,
correlates with the size of the country but also with the structure of the agricultural
sector, especially concerning the amount of manure.
The Member States with the largest potential growth of biogas production between
2014 and 2030 are Ireland and Romania, with potential growth factors of 26 and 80,
respectively. Most of the mature markets as determined in Chapter 2.4, Figure 8,
show relatively small potential for growth of biogas production between 2014 and
2030, with growth factors smaller than 5, the exceptions being France and Sweden
with potential growth factors of 11 and 5.6 respectively. There is no clear correlation
between potential growth factor and market maturity for the two other groups of
Member States, with moderate or immature current markets.
Figure 18 shows the biogas production per Member State in terms of production per
inhabitant, to put the biogas production in perspective and facilitate comparison
between the smaller and larger countries in the EU. It illustrates clearly that small
Member States also have a large potential to increase their domestic biogas
production (in terms of production per inhabitant). In particular relatively small
Member States as Ireland, Denmark and the Netherlands still have large potentials to
increase the biogas production per inhabitant.
Figure 18 Growth of biogas production per Member State in Scenarios 2 and 4 (accelerated growth) in ktoe/1,000 inhabitants
Production costs of biogas 5.2
Costs are presented in this section for biogas production from new production
installations, i.e. from installations that were built after 2014 to accommodate the
production increases of the various scenarios. As was discussed in Section 4.3.3, the
investment and production costs of already existing installations are not known in
sufficient detail to be included in the modelling. Due to the assumed learning curves
(see Chapter 4), the costs depend on the specific year the installation is ‘build’ in the
model. Cost estimates and forecasts were only available on EU level, not on Member
State level, so any local, regional or cost and price differences could not be included.
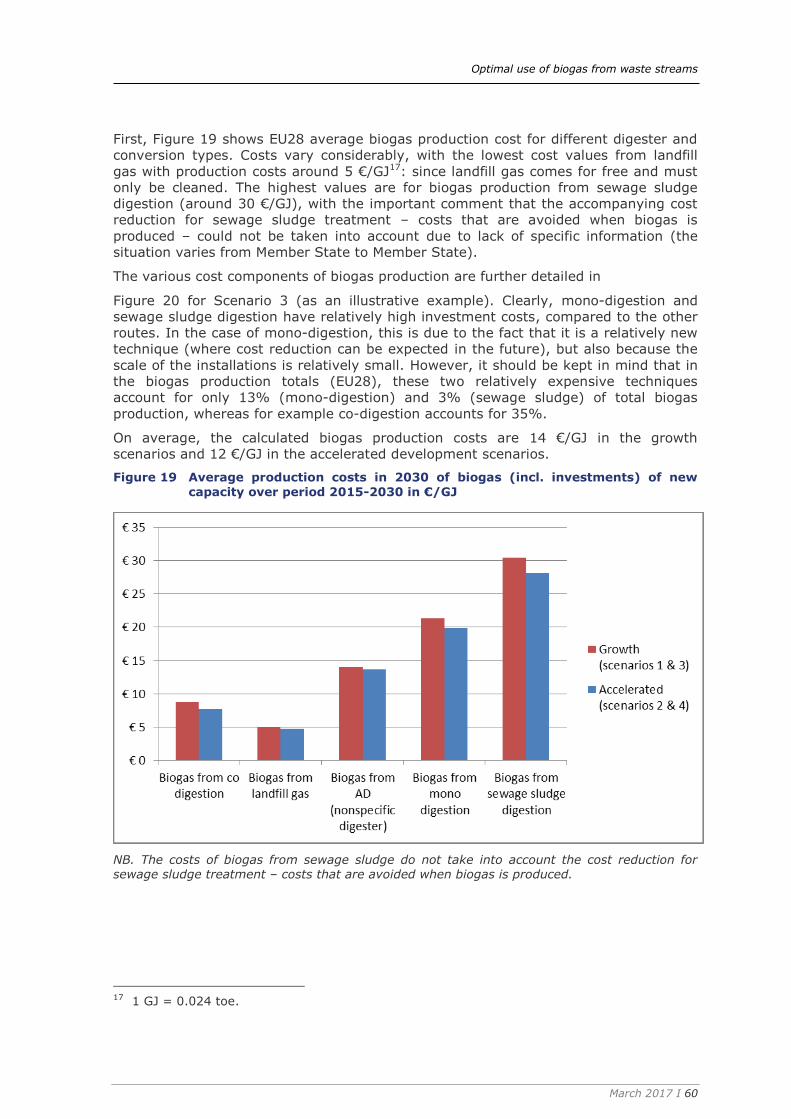
Optimal use of biogas from waste streams
March 2017 I 60
First, Figure 19 shows EU28 average biogas production cost for different digester and
conversion types. Costs vary considerably, with the lowest cost values from landfill
gas with production costs around 5 €/GJ17: since landfill gas comes for free and must
only be cleaned. The highest values are for biogas production from sewage sludge
digestion (around 30 €/GJ), with the important comment that the accompanying cost
reduction for sewage sludge treatment – costs that are avoided when biogas is
produced – could not be taken into account due to lack of specific information (the
situation varies from Member State to Member State).
The various cost components of biogas production are further detailed in
Figure 20 for Scenario 3 (as an illustrative example). Clearly, mono-digestion and
sewage sludge digestion have relatively high investment costs, compared to the other
routes. In the case of mono-digestion, this is due to the fact that it is a relatively new
technique (where cost reduction can be expected in the future), but also because the
scale of the installations is relatively small. However, it should be kept in mind that in
the biogas production totals (EU28), these two relatively expensive techniques
account for only 13% (mono-digestion) and 3% (sewage sludge) of total biogas
production, whereas for example co-digestion accounts for 35%.
On average, the calculated biogas production costs are 14 €/GJ in the growth
scenarios and 12 €/GJ in the accelerated development scenarios.
Figure 19 Average production costs in 2030 of biogas (incl. investments) of new
capacity over period 2015-2030 in €/GJ
NB. The costs of biogas from sewage sludge do not take into account the cost reduction for sewage sludge treatment – costs that are avoided when biogas is produced.
17 1 GJ = 0.024 toe.

Optimal use of biogas from waste streams
March 2017 I 61
Figure 20 Scenario 3: break down of EU28 average production costs in 2030 of biogas (incl. investments) over period 2015-2030 in €/GJ
NB. The cost of biogas from sewage sludge do not take into account the cost reduction for sewage sludge treatment – costs that are avoided when biogas is produced.
Production costs of bio-electricity (from CHP) and of 5.3biomethane
In case the biogas is used locally in a CHP unit to produce electricity and heat, we can
calculate the production costs of the produced bio-electricity by treating the produced
heat as a co-product, see Section 4.3.3. The resulting electricity production costs are
shown in Figure 21. The figure shows electricity production costs of about 1.5 times
the 2014 reference EU electricity price, implying that realisation of that volume needs
active support policies. Since the heat from the CHP is treated as a co-product in the
calculations, an increased utilization of the nett heat from the CHP will reduce the
resulting electricity production costs. For example, in case the heat utilization is
assumed to be 35% instead of 25%, the resulting electricity production costs reduce
from 33.1 to 32.0 €/GJ in scenario 2, i.e. a cost reduction of 3.3%.
The electricity price in the accelerated scenarios is 5,4 €/GJ lower than in the growth
scenarios, see Figure 21, due to cost reductions as a result from innovation and
market stimulation.
The total of the extra costs of the produced bio-electricity in Scenarios 1 and 2 is 3.4
to 3.5 billion euro, when compared to the average (i.e. fossil dominated) market price
of electricity in 2014 in the EU (Eurostat data). This is the cost for bio-electricity
produced in 2030 by new installations build in the period 2015-2030.
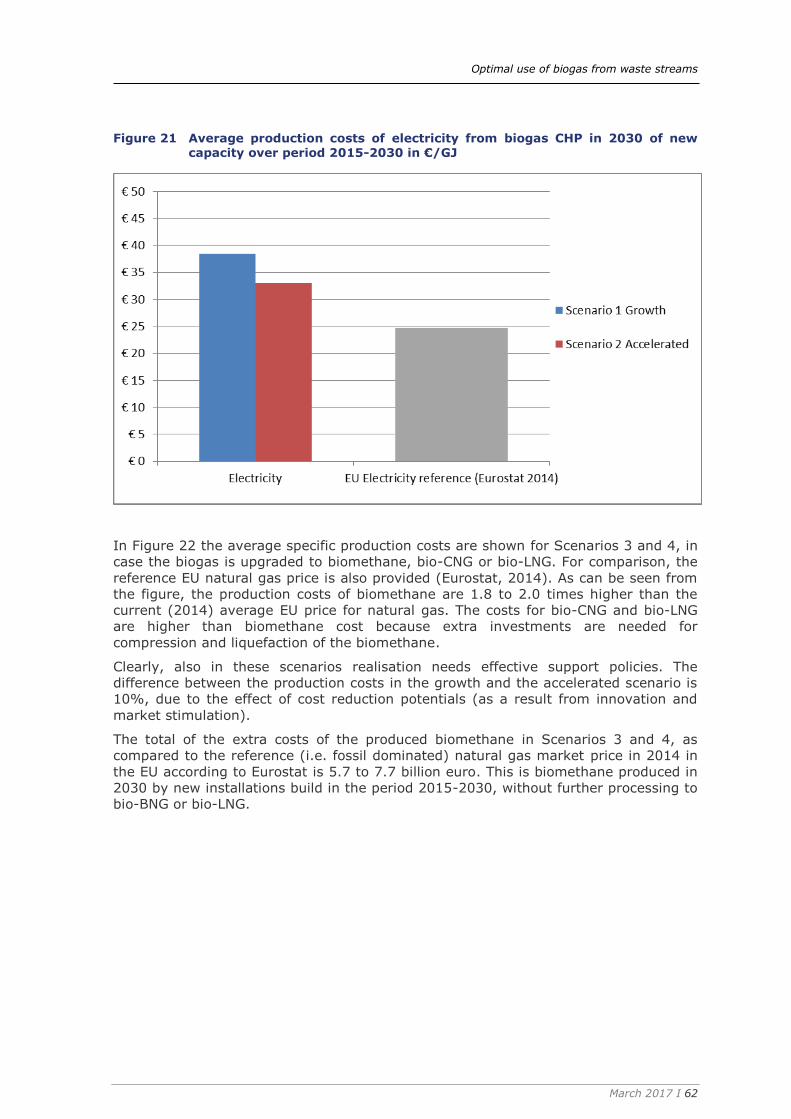
Optimal use of biogas from waste streams
March 2017 I 62
Figure 21 Average production costs of electricity from biogas CHP in 2030 of new capacity over period 2015-2030 in €/GJ
In Figure 22 the average specific production costs are shown for Scenarios 3 and 4, in
case the biogas is upgraded to biomethane, bio-CNG or bio-LNG. For comparison, the
reference EU natural gas price is also provided (Eurostat, 2014). As can be seen from
the figure, the production costs of biomethane are 1.8 to 2.0 times higher than the
current (2014) average EU price for natural gas. The costs for bio-CNG and bio-LNG
are higher than biomethane cost because extra investments are needed for
compression and liquefaction of the biomethane.
Clearly, also in these scenarios realisation needs effective support policies. The
difference between the production costs in the growth and the accelerated scenario is
10%, due to the effect of cost reduction potentials (as a result from innovation and
market stimulation).
The total of the extra costs of the produced biomethane in Scenarios 3 and 4, as
compared to the reference (i.e. fossil dominated) natural gas market price in 2014 in
the EU according to Eurostat is 5.7 to 7.7 billion euro. This is biomethane produced in
2030 by new installations build in the period 2015-2030, without further processing to
bio-BNG or bio-LNG.
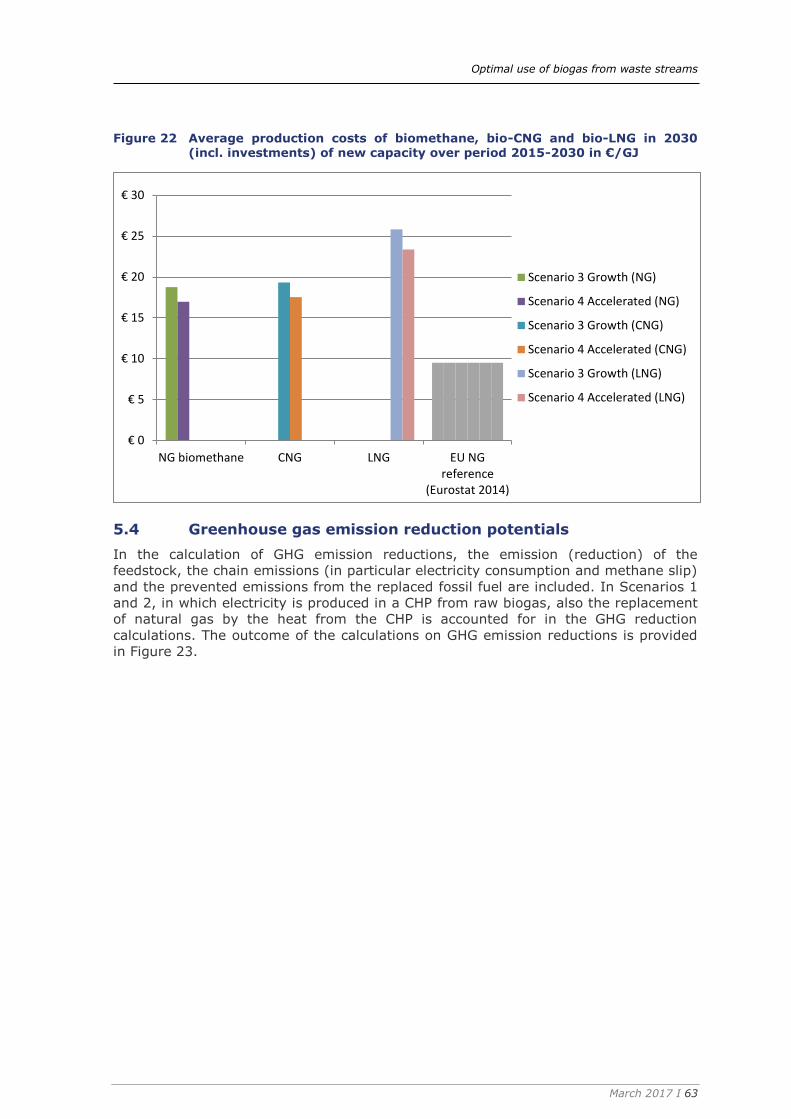
Optimal use of biogas from waste streams
March 2017 I 63
Figure 22 Average production costs of biomethane, bio-CNG and bio-LNG in 2030 (incl. investments) of new capacity over period 2015-2030 in €/GJ
Greenhouse gas emission reduction potentials 5.4
In the calculation of GHG emission reductions, the emission (reduction) of the
feedstock, the chain emissions (in particular electricity consumption and methane slip)
and the prevented emissions from the replaced fossil fuel are included. In Scenarios 1
and 2, in which electricity is produced in a CHP from raw biogas, also the replacement
of natural gas by the heat from the CHP is accounted for in the GHG reduction
calculations. The outcome of the calculations on GHG emission reductions is provided
in Figure 23.
€ 0
€ 5
€ 10
€ 15
€ 20
€ 25
€ 30
NG biomethane CNG LNG EU NGreference
(Eurostat 2014)
Scenario 3 Growth (NG)
Scenario 4 Accelerated (NG)
Scenario 3 Growth (CNG)
Scenario 4 Accelerated (CNG)
Scenario 3 Growth (LNG)
Scenario 4 Accelerated (LNG)

Optimal use of biogas from waste streams
March 2017 I 64
Figure 23 Absolute emission reductions of each scenario and end-use in 2030 (of new capacity between 2014 and 2030) in MtCO2-eq
These findings show that the largest GHG emission reductions result from the use as
biomethane in the transport sector. The use of biomethane as replacement of natural
gas in the built environment shows a lower effect, mainly because the emission factor
of the replaced energy source, natural gas, is lower than that of the diesel that is
replaced in the transport scenarios.
The smallest effect arises when the biogas is used in a CHP. This may be surprising
because of the high efficiency of CHP, but this is mainly due to the fact that emission
factors for electricity are rapidly declining towards 2030, and because on average only
25% of the net heat production from the CHP is assumed to be effectively used (to
replace natural gas heating). In case the net heat utilization from 25% can be
increased, e.g. due to policy incentives, the GHG reduction in that scenario will
increase also. For example, in case the heat utilization is assumed to be 35% instead
of 25%, the resulting GHG emission reduction in Scenario 2 changes from 52.8 to
55.2 Mton in 2030, an increase of 4.5%.
GHG reduction could also be increased by ensuring that the biogas electricity does not
replace the electricity mix but fossil power production only. In the short-term, this will
typically be the case in most Member States since RES production is still limited, and
wind and solar production are not likely to be curtailed on a significant scale. In the
longer term, however, this situation may change, and GHG savings of biogas
electricity production (i.e. the CHP operation) can be optimised to periods of low wind
and solar generation. This would ensure that the biogas electricity production does not
compete with other RES-E production. However, in many cases the CHP production is
must run, since it follows the biogas production from the digester. This kind of
optimisation therefore requires biogas storage (adding extra costs) and it might
reduce the share of heat utilisation rather than increase heat use as was
recommended above.
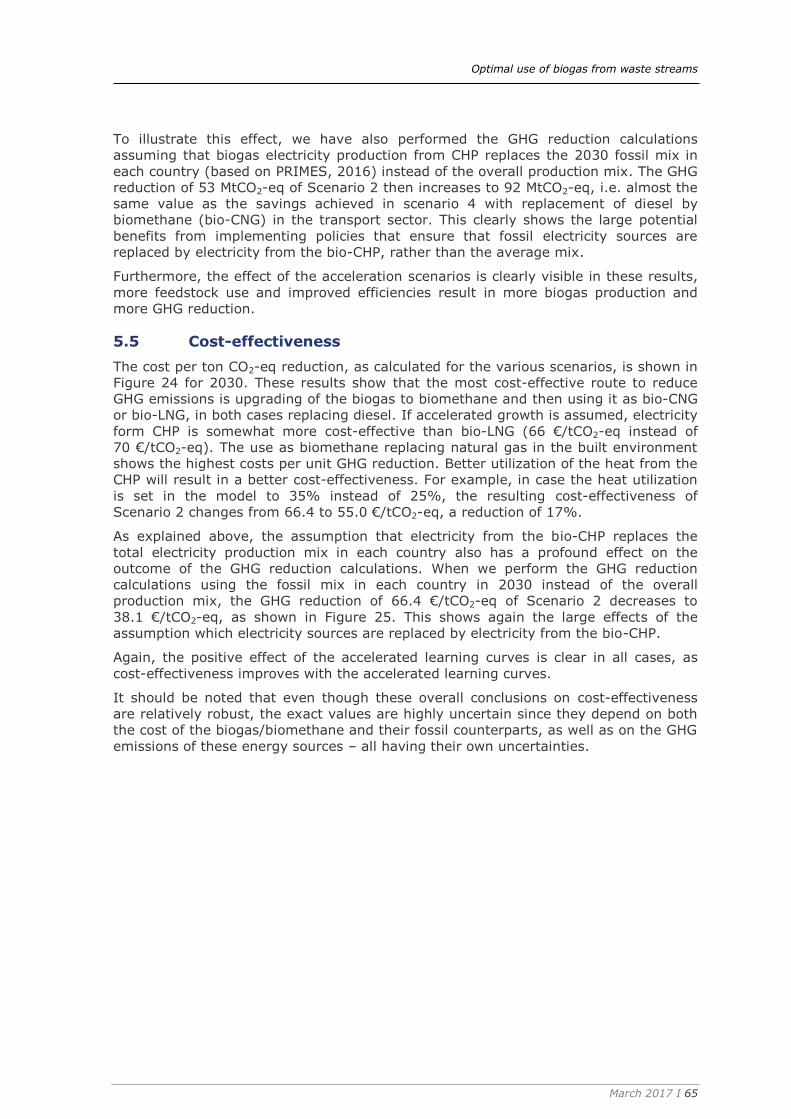
Optimal use of biogas from waste streams
March 2017 I 65
To illustrate this effect, we have also performed the GHG reduction calculations
assuming that biogas electricity production from CHP replaces the 2030 fossil mix in
each country (based on PRIMES, 2016) instead of the overall production mix. The GHG
reduction of 53 MtCO2-eq of Scenario 2 then increases to 92 MtCO2-eq, i.e. almost the
same value as the savings achieved in scenario 4 with replacement of diesel by
biomethane (bio-CNG) in the transport sector. This clearly shows the large potential
benefits from implementing policies that ensure that fossil electricity sources are
replaced by electricity from the bio-CHP, rather than the average mix.
Furthermore, the effect of the acceleration scenarios is clearly visible in these results,
more feedstock use and improved efficiencies result in more biogas production and
more GHG reduction.
Cost-effectiveness 5.5
The cost per ton CO2-eq reduction, as calculated for the various scenarios, is shown in
Figure 24 for 2030. These results show that the most cost-effective route to reduce
GHG emissions is upgrading of the biogas to biomethane and then using it as bio-CNG
or bio-LNG, in both cases replacing diesel. If accelerated growth is assumed, electricity
form CHP is somewhat more cost-effective than bio-LNG (66 €/tCO2-eq instead of
70 €/tCO2-eq). The use as biomethane replacing natural gas in the built environment
shows the highest costs per unit GHG reduction. Better utilization of the heat from the
CHP will result in a better cost-effectiveness. For example, in case the heat utilization
is set in the model to 35% instead of 25%, the resulting cost-effectiveness of
Scenario 2 changes from 66.4 to 55.0 €/tCO2-eq, a reduction of 17%.
As explained above, the assumption that electricity from the bio-CHP replaces the
total electricity production mix in each country also has a profound effect on the
outcome of the GHG reduction calculations. When we perform the GHG reduction
calculations using the fossil mix in each country in 2030 instead of the overall
production mix, the GHG reduction of 66.4 €/tCO2-eq of Scenario 2 decreases to
38.1 €/tCO2-eq, as shown in Figure 25. This shows again the large effects of the
assumption which electricity sources are replaced by electricity from the bio-CHP.
Again, the positive effect of the accelerated learning curves is clear in all cases, as
cost-effectiveness improves with the accelerated learning curves.
It should be noted that even though these overall conclusions on cost-effectiveness
are relatively robust, the exact values are highly uncertain since they depend on both
the cost of the biogas/biomethane and their fossil counterparts, as well as on the GHG
emissions of these energy sources – all having their own uncertainties.
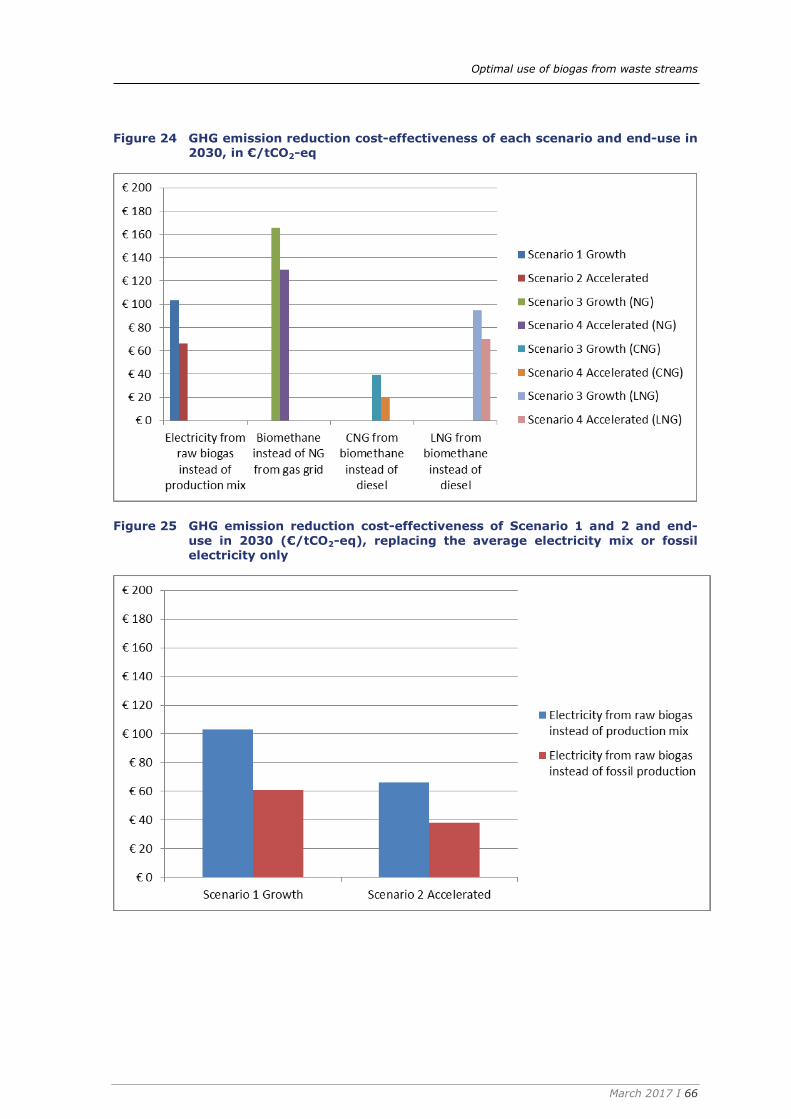
Optimal use of biogas from waste streams
March 2017 I 66
Figure 24 GHG emission reduction cost-effectiveness of each scenario and end-use in 2030, in €/tCO2-eq
Figure 25 GHG emission reduction cost-effectiveness of Scenario 1 and 2 and end-
use in 2030 (€/tCO2-eq), replacing the average electricity mix or fossil electricity only
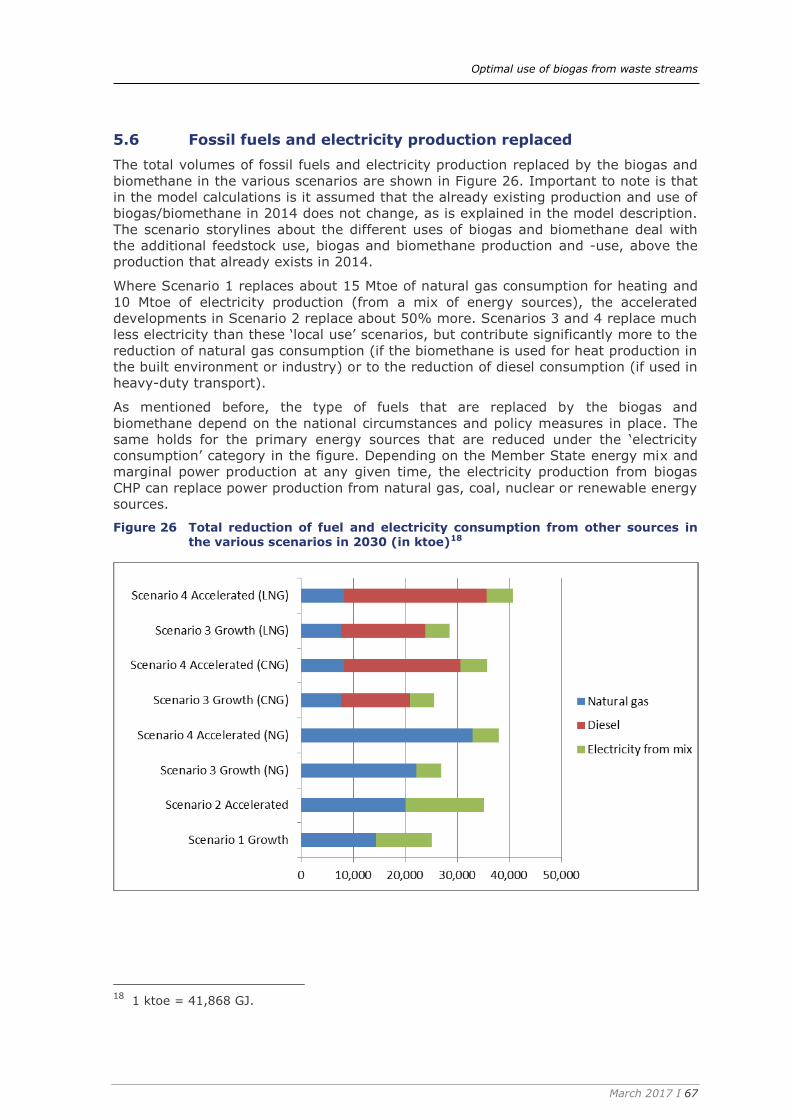
Optimal use of biogas from waste streams
March 2017 I 67
Fossil fuels and electricity production replaced 5.6
The total volumes of fossil fuels and electricity production replaced by the biogas and
biomethane in the various scenarios are shown in Figure 26. Important to note is that
in the model calculations is it assumed that the already existing production and use of
biogas/biomethane in 2014 does not change, as is explained in the model description.
The scenario storylines about the different uses of biogas and biomethane deal with
the additional feedstock use, biogas and biomethane production and -use, above the
production that already exists in 2014.
Where Scenario 1 replaces about 15 Mtoe of natural gas consumption for heating and
10 Mtoe of electricity production (from a mix of energy sources), the accelerated
developments in Scenario 2 replace about 50% more. Scenarios 3 and 4 replace much
less electricity than these ‘local use’ scenarios, but contribute significantly more to the
reduction of natural gas consumption (if the biomethane is used for heat production in
the built environment or industry) or to the reduction of diesel consumption (if used in
heavy-duty transport).
As mentioned before, the type of fuels that are replaced by the biogas and
biomethane depend on the national circumstances and policy measures in place. The
same holds for the primary energy sources that are reduced under the ‘electricity
consumption’ category in the figure. Depending on the Member State energy mix and
marginal power production at any given time, the electricity production from biogas
CHP can replace power production from natural gas, coal, nuclear or renewable energy
sources.
Figure 26 Total reduction of fuel and electricity consumption from other sources in the various scenarios in 2030 (in ktoe)18
18 1 ktoe = 41,868 GJ.

Optimal use of biogas from waste streams
March 2017 I 68
Biogas contribution to RES deployment in the EU 5.7
The adopted targets for renewable energy production in the EU28 are 20% in 2020
and a minimum of 27% in 2030 (to be decided on in the coming years), in
percentages of final energy consumption. Following the projections in the EU
Reference Scenario 2016, the final energy demand in the EU28 will be about
1,134 Mtoe in 2020 and 1,081 Mtoe in 2030, resulting in values for renewable energy
production of 227 Mtoe in 2020 and 292 Mtoe in 2030.
When comparing these values to the biogas production in the EU28 in the various
scenarios, Figure 16, we find for the two accelerated growth scenario 24.0 Mtoe biogas
in 2020 and 40.2 Mtoe in 2030 (primary energy production). This represents 10.6%
and 13.8% of the EU28 renewable energy targets in 2020 and 2030 respectively, or
3.7% of the EU28 Reference Scenario energy consumption in 2030.
When comparing the ‘local use’ and ‘grid injection’ scenarios, the latter are likely to
contribute more to national and EU RES targets of the RED than the former, due to the
methodology used to calculate the contribution of RES to the target (Article 5 of the
RED).
When biomethane is used in transport, its full (primary) energy content can count
towards the target.
When it is used for electricity production, the gross final consumption of electricity
counts towards the target. The efficiency of the electricity production (in our
scenarios, of the CHPs) then has to be taken into account.
The same holds for heating via CHP: the quantity of district heating and cooling
from renewable sources counts towards the target, not the primary energy
consumption.
The contribution of the various scenarios toward a RES target in 2030 therefore
depends strongly on the conversion efficiency of the CHP used.
A different kind of contribution to RES deployment is that in contrast to wind and
solar, renewable power production from biogas is non-intermittent, and it can even
facilitate integration of these variable renewable energy sources when some form of
biogas storage is in place.
As RES deployment increases throughout the EU, the electricity market will change
quite fundamentally. Growth of intermittent sources (onshore and offshore wind, solar
PV) will have a number of effects19.
Depending on weather conditions and demand, there will be either a surplus or a
deficit of output from renewables.
Frequent simultaneity of wind/solar leads to a substantial decrease in market value
of renewably sourced power.
These effects will have a negative impact on business cases of both RES and
conventional power generation capacities, and create risks for security of delivery as
can already be observed in some parts of the EU. These effects are likely to increase
as RES deployment grows, unless the underlying drivers are resolved adequately.
19
CE Delft, 2014, Energy market on the move and CE Delft, 2014, Structural changes in the
energy market. See http://www.cedelft.eu/publicatie/energy_market_on_the_move_-_thinktank_on_energy_market_reform/1623 See http://www.cedelft.eu/publicatie/energy_market_on_the_move_-
_thinktank_on_energy_market_reform/1623

Optimal use of biogas from waste streams
March 2017 I 69
Potential solutions can be technical, for example by implementing ‘smart’ technologies
and services, demand response services and energy storage, by expanding grid
capacity to the level needed to accommodate the new generation and demand
requirements, by integrating regional European power systems20, etc. To ensure that
these opportunities are developed and used, however, the electricity market design
also needs to be adapted, as acknowledged, for example, in the recent launch of a
public consultation process on a new energy market design by the Commission
(SWD(2015) 142) and the 2015 publication ‘Regulatory Recommendations for the
Deployment of Flexibility’ by DG Energy’s Smart Grids Task Force.
In this future high-RES electricity system, electricity production from biogas (and
bioenergy in general) can play an important role in complementing wind and solar
electricity generation, especially in times of low output from these sources. Electricity
production from biogas and biomass has the advantage that it is demand driven: it
can be stored, and used for electricity (and/or heat) generation when needed.
Furthermore, electricity production from biogas is very flexible, and can be ramped up
and down quickly, when needed. It can thus have quite a number of benefits to the
future electricity system and market:
Biogas can reduce the need for fossil power backup. This will contribute to
increasing the share of RES and reducing GHG emissions of power supply, and
reduce the EU’s dependency on energy imports (notably natural gas).
As it can be stored and used when needed, biogas power generation can contribute
to mitigation of the price fluctuations caused by supply-driven and variable RES
technologies.
Electricity production from biogas can respond quickly in times of large variation of
wind and solar output, which can contribute to balancing the market and ensure
security of delivery.
When comparing the four scenarios on these aspects, the ‘local use’ scenarios clearly
have the most potential to contribute to the future electricity system, since more
electricity is produced in these scenarios than in the ‘to grid’ scenarios. Flexibility of
power production in these scenarios may be limited by heat demand, though, which is
of course determined by other factors. Optimizing the CHP towards the electricity
system demands is likely to have negative impacts on heat use, reducing overall
energy efficiencies and GHG savings. Quantification of the benefits to the electricity
system and market is not possible at this stage of developments within the scope of
this project, as the future price fluctuations due to RES production are uncertain, as is
the demand for flexible power production.
Variation of maize/manure ratio in co-digestion 5.8
One of the specific issues that can be addressed with the model, is the question how
the GHG savings of co-digestion depend on the share of maize in manure co-digesters.
This is relevant for policy support measures and regulations, since higher shares of
maize (or any other crop as co-substrate) can increase the scale of the digesters and
biogas production, thus reducing cost, but at the same time increase GHG emissions
and create a risk of indirect land use change21. Some Member States, e.g. Germany,
use such a cap in their subsidy regimes for co-digesters.
20 See, for example, Agora (2015) The European Power System in 2030: Flexibility Challenges
and Integration Benefits. 21 In the ILUC directive, maize falls under the cap of 7% maximal share of biofuels from crops
grown on agricultural land that can be counted towards the 2020 renewable energy targets.
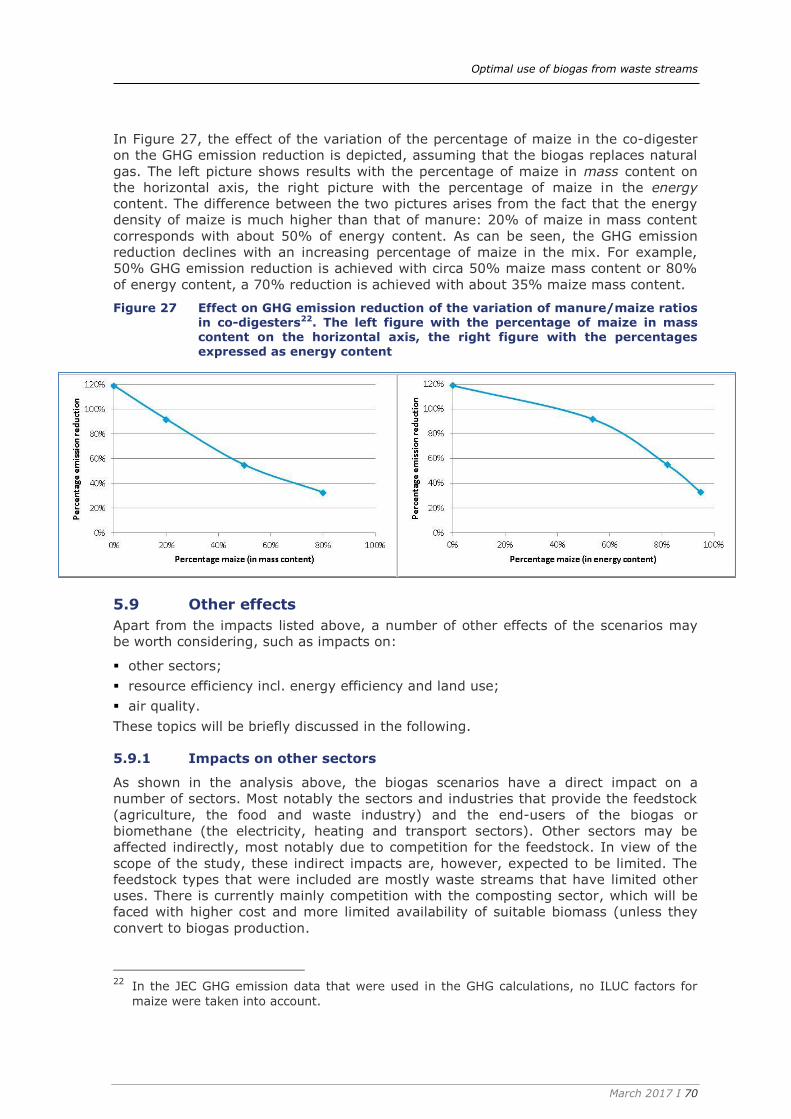
Optimal use of biogas from waste streams
March 2017 I 70
In Figure 27, the effect of the variation of the percentage of maize in the co-digester
on the GHG emission reduction is depicted, assuming that the biogas replaces natural
gas. The left picture shows results with the percentage of maize in mass content on
the horizontal axis, the right picture with the percentage of maize in the energy
content. The difference between the two pictures arises from the fact that the energy
density of maize is much higher than that of manure: 20% of maize in mass content
corresponds with about 50% of energy content. As can be seen, the GHG emission
reduction declines with an increasing percentage of maize in the mix. For example,
50% GHG emission reduction is achieved with circa 50% maize mass content or 80%
of energy content, a 70% reduction is achieved with about 35% maize mass content.
Figure 27 Effect on GHG emission reduction of the variation of manure/maize ratios in co-digesters22. The left figure with the percentage of maize in mass content on the horizontal axis, the right figure with the percentages expressed as energy content
Other effects 5.9
Apart from the impacts listed above, a number of other effects of the scenarios may
be worth considering, such as impacts on:
other sectors;
resource efficiency incl. energy efficiency and land use;
air quality.
These topics will be briefly discussed in the following.
5.9.1 Impacts on other sectors
As shown in the analysis above, the biogas scenarios have a direct impact on a
number of sectors. Most notably the sectors and industries that provide the feedstock
(agriculture, the food and waste industry) and the end-users of the biogas or
biomethane (the electricity, heating and transport sectors). Other sectors may be
affected indirectly, most notably due to competition for the feedstock. In view of the
scope of the study, these indirect impacts are, however, expected to be limited. The
feedstock types that were included are mostly waste streams that have limited other
uses. There is currently mainly competition with the composting sector, which will be
faced with higher cost and more limited availability of suitable biomass (unless they
convert to biogas production.
22 In the JEC GHG emission data that were used in the GHG calculations, no ILUC factors for
maize were taken into account.
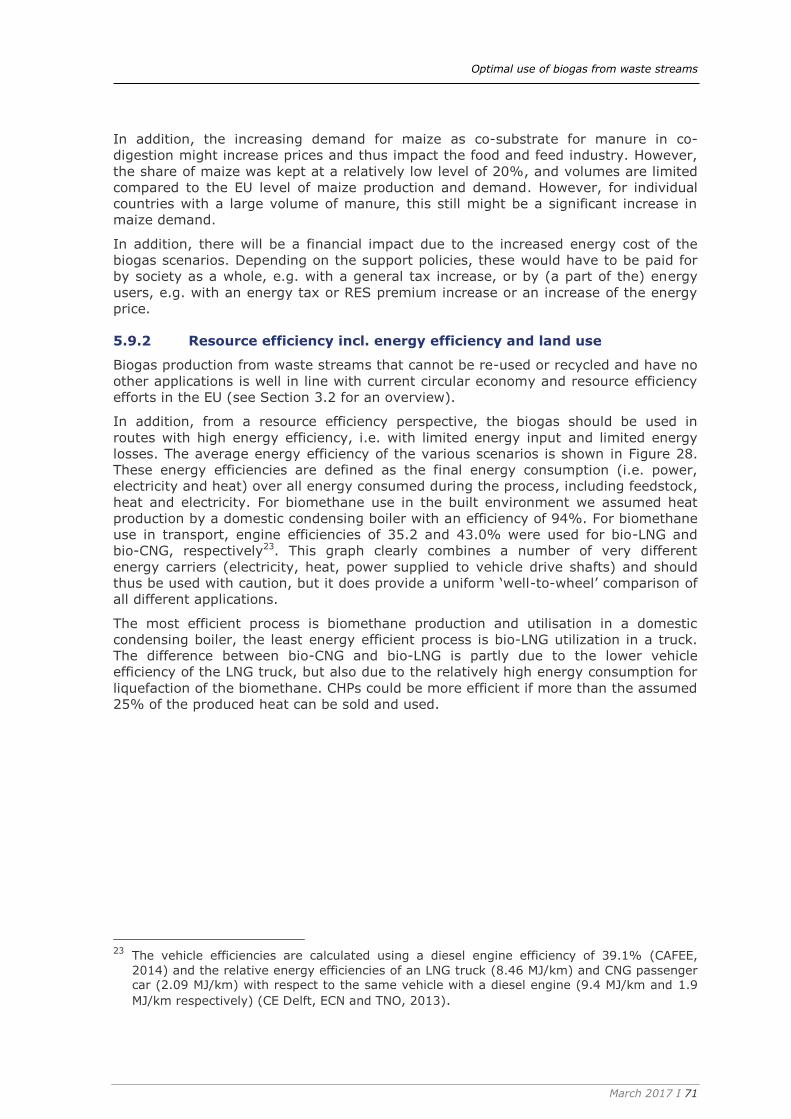
Optimal use of biogas from waste streams
March 2017 I 71
In addition, the increasing demand for maize as co-substrate for manure in co-
digestion might increase prices and thus impact the food and feed industry. However,
the share of maize was kept at a relatively low level of 20%, and volumes are limited
compared to the EU level of maize production and demand. However, for individual
countries with a large volume of manure, this still might be a significant increase in
maize demand.
In addition, there will be a financial impact due to the increased energy cost of the
biogas scenarios. Depending on the support policies, these would have to be paid for
by society as a whole, e.g. with a general tax increase, or by (a part of the) energy
users, e.g. with an energy tax or RES premium increase or an increase of the energy
price.
5.9.2 Resource efficiency incl. energy efficiency and land use
Biogas production from waste streams that cannot be re-used or recycled and have no
other applications is well in line with current circular economy and resource efficiency
efforts in the EU (see Section 3.2 for an overview).
In addition, from a resource efficiency perspective, the biogas should be used in
routes with high energy efficiency, i.e. with limited energy input and limited energy
losses. The average energy efficiency of the various scenarios is shown in Figure 28.
These energy efficiencies are defined as the final energy consumption (i.e. power,
electricity and heat) over all energy consumed during the process, including feedstock,
heat and electricity. For biomethane use in the built environment we assumed heat
production by a domestic condensing boiler with an efficiency of 94%. For biomethane
use in transport, engine efficiencies of 35.2 and 43.0% were used for bio-LNG and
bio-CNG, respectively23. This graph clearly combines a number of very different
energy carriers (electricity, heat, power supplied to vehicle drive shafts) and should
thus be used with caution, but it does provide a uniform ‘well-to-wheel’ comparison of
all different applications.
The most efficient process is biomethane production and utilisation in a domestic
condensing boiler, the least energy efficient process is bio-LNG utilization in a truck.
The difference between bio-CNG and bio-LNG is partly due to the lower vehicle
efficiency of the LNG truck, but also due to the relatively high energy consumption for
liquefaction of the biomethane. CHPs could be more efficient if more than the assumed
25% of the produced heat can be sold and used.
23 The vehicle efficiencies are calculated using a diesel engine efficiency of 39.1% (CAFEE,
2014) and the relative energy efficiencies of an LNG truck (8.46 MJ/km) and CNG passenger car (2.09 MJ/km) with respect to the same vehicle with a diesel engine (9.4 MJ/km and 1.9
MJ/km respectively) (CE Delft, ECN and TNO, 2013).
Optimal use of biogas from waste streams
March 2017 I 72
Figure 28 Final energy consumption process efficiencies of the scenarios for the new capacity of the year 2030 in GJin/GJout (including all produced heat of CHP)
Zooming in on land use, this is limited in all scenarios by the focus on waste streams
as input for the biogas production and the 20% cap on the share of maize in co-
digesters. Mono-digestion of crops was not included. The ‘advanced deployment’
scenarios (Scenario 2 and 4) can be seen to require more land than the ‘growth’
scenario, as they are based on a significantly higher manure potential, resulting in
higher volumes of maize for co-digestion: 80.5 Mton maize in the ‘advanced
deployment scenarios, compared to 44.5 Mton in the ‘growth’ scenarios.
5.9.3 Air quality
Digestion of manure reduces most methane and nitrous oxide emissions compared to
emissions from conventional manure storages. Odour from digested manure is in
general lower compared to non-digested manure. However, as more organic nitrogen
becomes available, the ammonia (NH3) emission during application of digestate on the
land might be higher compared to conventional manure. Therefore, it is recommended
to apply digestate with low-emission techniques, i.e. injection in the soil, to reduce
NH3 emissions (Hou, 2015). In case digestate is used to replace the use of artificial
fertilizer, the emissions related to the production of the fertilizer might be reduced. In
general, the accelerated deployment scenarios (S2 and S4) will have higher GHG
reduction from manure storages.
Beyond current technologies 5.10
The scenario storylines and model calculations focus on 2020 and 2030, using
information on feedstocks (i.e. suitable waste streams) and technologies from recent
studies. In the model calculations, learning curves are assumed for investment costs
and on efficiencies, anticipating the empirical fact that technologies have a tendency in
time to gradually show lower costs and better efficiencies due to innovations and
market scale effects.

Optimal use of biogas from waste streams
March 2017 I 73
Model calculations also have inherent limitations. For this study, the model and the
input figures are used to calculate output values with a relatively high degree of
possibility (albeit strongly depending on the design of the relevant policies).
The calculations do not take into account new disruptive innovations, nor in feedstock
technologies, nor in conversion technologies, nor in the markets.
For example, in the section on feedstock potentials (see Section 4.3.1), it was already
mentioned that in the future, beyond 2030, there might be substantial contributions
from new feedstocks for digesters like cover crops or sea weed. These are not likely to
have large impacts before 2030 and are therefore not taken into account in the
feedstock scenarios that are used in this study. It should be noted that also the
volumes of feedstocks for digestion like manure and organic wastes may change after
2030.
In the longer term, power to gas (P2G) developments may lead to an increased
availability of ‘renewable gas’. The same may be true for syngas production from
gasification processes, although that technology competes with other bioenergy routes
as it requires significant amounts of sustainable biomass (mostly dry streams, e.g.
wood) as feedstock that can also be used in other applications such as direct
electricity production, bio-refineries or pyrolysis which directly produces a liquid
biofuel that can be used as feedstock for the chemical or other industries (replacing
mineral oil) or as transport fuel.
This short analysis does by no means disqualify the scenarios and model calculations
presented here, but aim to stress that one should keep in mind that things might
change over time.
The following provides a brief overview of a few innovative techniques that may
influence the availability and costs of ‘renewable gas’ in the future. This is purely
meant as an illustration of possible future developments, and does not serve as
complete overview, that would be outside the scope of this study.
5.10.1 Examples of innovations in biogas/biomethane production24
BIOMASTER
The BIOMASTER Project (supported by Intelligent Energy Europe) aims to engage with
people and processes to enable a significant breakthrough in the uptake of
biomethane for transport. The four participating regions in BIOMASTER, Malopolska
Region (Poland), Norfolk County (United Kingdom), Skåne Region (Sweden) and
Trentino Province (Italy), are working together to promote biomethane production, its
grid injection and use for transport. They are undertaking a joint initiative involving all
these key components of the biomethane chain, stimulating investment, lobbying to
remove non-technological barriers and mobilising action for uptake.
More information: http://biomaster-project.eu/index.php?ID1=8&id=8
BioWALK4Biofuels: Use of macroalgae for biogas production
The FP7 project BioWALK4Biofuels aims to develop an innovative system for the
treatment of biowaste and use of GHG emissions to produce biofuels, through the use
of macroalgae.
More information: www.biowalk4biofuels.eu
24 Information is partly taken from www.biofuelstp.eu/biogas.html

Optimal use of biogas from waste streams
March 2017 I 74
AHPD (Autogenerative High Pressure Digestion)
AHPD produces almost pure biomethane with 90% CH4-concentration directly from
biomass or waste water. The high pressure (20 bar) in the digester is autogeneratively
build up by specific micro-organisms. The pressure is used to concentrate carbon
dioxide in the water phase, comparable with e.g. the process in a beer brewery. The
AHPD technology can be used in various processes in which biomass wastes have to
be processed, like waste water, sewage sludge and waste streams from agriculture
and food industries. AHPD is assessed to be at Technology Readiness Level 8. The
financial feasibility of AHPD is high: based on a green gas cost level of 0.44 euro/Nm3
and a solid waste (substrate) gate fee of 330 euro/ton TSS, a pay-back time of 5-8
years is obtained.
An interesting feature of AHPD as sewage cleaning technique is that conventional
sewage cleaning installations treat the settled sewage liquor using aerobic biological
processes. To be effective, the biota requires both oxygen and food to live. The
bacteria consume biodegradable soluble organic contaminants (e.g. sugars, fats,
organic short-chain carbon molecules, etc.) and bind much of the less soluble fractions
into floc. This conventional process results in large emissions of CO2 into the air.
However, in the AHPD process the CO2 is used to produce biomethane. As a result, the
biomethane production from sewage using AHPD is up to 50% higher than with
conventional techniques and at the same time emission of the CO2 to air is prevented.
A future development is the use of additional hydrogen to enhance the concentration
of biomethane to 99%. The hydrogen can e.g. be produced from temporary surpluses
of electricity from wind or solar power.
More information: www.bareau.nl
BIOGASFUEL
The Eureka BIOGASFUEL project is developing a dual-fuel supply system for diesel
engines using alternative fuel. The research programme on fuel will assess the
possibility of using biogas as a fuel for compression ignition engines of non-road
vehicles and machines used in agriculture.
More information: www.eurekanetwork.org/project/id/5030
FaBbiogas
The objective of the IEE project FaBbiogas is to elaborate a solid information base on
FaB (Food and Beverage) waste utilisation for biogas production and to prove the
efficiency and feasibility of FaB waste-based biogas implementation projects. The EU
project FABbiogas (Intelligent Energy Europe) project aspires to change the mindsets
of all stakeholders in the waste-to-energy chain by promoting use of residue streams
from FAB industry as a new and renewable energy source for biogas production.
Project outputs will support the diversification of energy sources within FAB
companies, leading to wide-spread valorization and efficient integration of FAB residue
streams into energy systems and boosting the realization of a growing number of
biogas projects in Austria, Czech Republic, France, Germany, Italy and Poland.
More information: www.fabbiogas.eu/en/home/
Optimal use of biogas from waste streams
March 2017 I 75
5.10.2 Gasification25
Gasification is a process that converts organic or fossil fuel-based carbonaceous
materials into carbon monoxide, hydrogen and carbon dioxide. This is achieved by
reacting the material at high temperatures (>700°C), without combustion, with a
controlled amount of oxygen and/or steam. The resulting gas mixture is called syngas
and is itself a fuel.
The advantage of gasification is that using the syngas is potentially more efficient than
direct combustion of the original fuel because it can be combusted at higher
temperatures or even in fuel cells, so that the thermodynamic upper limit to the
efficiency defined by Carnot's rule is higher or (in case of fuel cells) not applicable.
Syngas may be burned directly in gas engines, used to produce methanol and
hydrogen, or converted e.g. via the Fischer–Tropsch process into synthetic fuel.
Gasification can also begin with material which would otherwise have been disposed of
such as biodegradable waste. In addition, the high-temperature process refines out
corrosive ash elements such as chloride and potassium, allowing clean gas production
from otherwise problematic fuels. Gasification of fossil fuels is currently widely used on
industrial scales to generate electricity. Gasification of biomass is a technology for
production of renewable energy. One of the critical process parameters in case of
gasification of biomass is a stable quality of the biomass, for which pretreatments like
torrefication might be used.
Gasifiers can be categorized as follows:
fluidised bed gasifiers (for dry streams), work at lower temperatures;
entrained bed gasifiers (for dry streams), work at higher temperatures and at a
larger scale than fluidised bed gasifiers;
supercritical gasifier (for wet streams, like wet manure and sewage sludge), at
supercritical condition in water (i.e. high pressure of 300 bar and temperature of
400°C);
plasma gasifier (for both dry and wet streams) at atmospheric pressure and 600°C.
After a long lasting development, which dates back to the 18th century, the
commercial implementation of biomass gasification is still problematic. Very few
processes have yet proved economically viable, although the technology has
progressed steadily.
One of the important features of gasifiers for future biogas/biomethane markets is the
capability to produce biogas/biomethane on a large scale from domestic or important
wood pellets, for example in harbour sites.
5.10.3 Power to gas
With increasing capacities of electricity production from domestic intermittent
renewable sources (wind, solar), there comes a time when an increasing fraction of
the additional power from solar and wind can no longer be directly used in the
electricity markets, but will have to be stored or ‘time-shifted’ using some form of
flexibility solutions. The situation depends on the specific country. Storage and large
scale flex options, require investments and may also reduce energy efficiencies but
add value to the renewable energy produced and are a crucial enabler for an energy
system with large shares of fluctuating renewable energy sources.
25 Information taken from, among other sources: Wikipedia, from Groen Gas Nederland
“Innovatieve technieken en leveranciers voor biogas en groen gas”, and from the European Biomass Industry Association (www.eubia.org/index.php/about-biomass/pyrolysis-and-
gasification/gasification)

Optimal use of biogas from waste streams
March 2017 I 76
One of the potential options to make use of higher shares of RES production is power
to gas, where the renewable electric power is used to produce hydrogen and/or
methane. These can be stored and especially the renewable methane can also be
transported over long distances (via pipelines or liquefied). If the Power-to-Methane
technologies and routes are developed on a large scale in the future, they may result
in significant additional volumes of renewable methane that can be injected into the
natural gas grid or directly used as a fuel for transport, heating or electricity
production.

Optimal use of biogas from waste streams
March 2017 I 77
6 Policy recommendations
The stock-taking exercise of this study clearly identified a number of best practices, as
well as barriers to biogas deployment throughout the EU. The scenario assessment
then provided more insight in the potential growth of biogas production and use in the
EU until 2030, as well as the potential impacts of these developments.
Based on these results and a thorough review of recent biogas studies, position papers
or other publications on biogas policies, a wide range of policy recommendations could
be identified. They aim to further develop sustainable biogas and biomethane
deployment in the EU, allowing biogas production projects to be developed and market
demand to grow. These recommendations span the whole biogas value chain, and are
aimed at both EU and national policy makers. As was also the case for the previous
chapters, the recommendations focus on biogas and biomethane production from
digestion of waste streams.
The national policy recommendations provided here focus on issues relevant to all or
at least a significant share of Member States. Specific recommendations for specific
countries were outside the scope of the study. While some Member States already
have a large part of their potential biogas production in operation and have a mature
market and policy framework in place, there is still significant room for growth in other
countries. Depending on their current starting point and maturity of their markets,
some policy recommendations may be more relevant for some Member States than for
others.
General policy recommendations 6.1
Due to the additional cost of biogas and biomethane compared to natural gas and
other fossil fuels, national support policies and an effective EU policy framework are
key to increase biogas and biomethane production and use. There is still significant
potential for growth of biogas and biomethane production and use throughout the EU,
with only few exceptions, especially in the already mature markets (e.g. Germany).
Any investments in this area strongly depend on an attractive, reliable and stable
policy support scheme, and a positive long-term outlook. These are likely to be
more important than the exact type of policy measure in place. Policy proposals should
be validated against these requirements, taking into account that biogas and
biomethane projects typically require high up-front investments and have long pay-
back periods (around 15 years). The climate and renewable energy policies and
regulations that are currently being developed for the timeframe until 2030 on both
EU and Member State levels are considered key to achieving the growth rates and
innovation scenarios presented in this report.
Increasing biogas and biomethane production and use can contribute to various EU
and national policy aims, most notably to climate goals - reducing methane emissions
of agriculture, land-fill sites or sewage plants, reducing fossil fuel emissions - and to
renewable energy targets. However, these projects are typically affected by a much
wider range of policy areas, including agricultural and waste policies, natural gas
regulations, etc. It is therefore important to ensure adequate involvement of the
various policy makers and stakeholders in the decision making process, to ensure a
consistent approach and alignment of the policy developments.
Optimal use of biogas from waste streams
March 2017 I 78
In the following, EU level recommendations are provided first, followed by
recommendations for national policies. This distinction was based on the authors’
assessment, keeping the EU’s key principles on subsidiarity26 and internal market in
mind. Some recommendations could arguably be implemented at either policy level
based on political considerations. We have then included the recommendations in both
sections, so that they can be read separately and independently, at the cost of having
some duplication in the text.
EU policy recommendations 6.2
6.2.1 General
Biogas and biomethane deployment is affected by a wide range of EU regulations,
including directives on renewable energy, natural gas and agriculture. However, in
many of these regulations only a (very) limited number of provisions specifically focus
on biogas or biomethane. For example, the RED is an important driver for biogas
support in many Member States and biogas can contribute to the target in various
sectors, but it is only included in the GHG calculation methodology for biofuels for
transport. While the EU internal market rules for natural gas (Directive 2009/73/EC)
are also applicable in a non-discriminatory way to biogas and other types of gas27 and
quality standards for natural gas also apply to biomethane, these EU regulations do
not have any specific provisions on biomethane included. This is understandable, given
the relatively limited share of biogas in total RES and a limited share of biomethane in
the gas grid. It is important, however, to assess whether biogas needs specific
attention when designing these policies, in view of the potential benefits that
increased biogas and biomethane production and use can have, both in terms of GHG
emission reduction and as a versatile renewable energy source that can play a
valuable role in the future energy system.
Furthermore, since many relevant EU regulations are currently being drafted (e.g.
2030 energy policies and state aid guidelines) or under revision (e.g. the waste
regulation), coherence and interaction between the various policies and regulations
should be considered. For example, since biomethane can be exported to other
Member States via the gas grid (a current practice in a limited number of Member
States only, but this trade may increase in the future), the RED (or an alternative
regulation) should regulate and facilitate cross-border administration of the
biomethane as renewable energy with certain sustainability characteristics and grid
regulations should address technical specifications of the injected biomethane.
It is also recommended to improve data monitoring, on both EU and Member State
level. Biogas production is monitored by Eurostat, but data on the feedstock mix and
on the end-use of biogas and biomethane is currently not monitored and reported in
full throughout the EU. Especially data gathering and reporting on feedstocks (the
various waste streams as well as any energy crops used), use of the heat in biogas
CHP applications and cost of the various biogas chains could be improved.
More specific EU level policy recommendations are listed in the following Sections.
26
See, for example, http://eur-lex.europa.eu/summary/glossary/subsidiarity.html
The principle of subsidiarity aims to ensure that decisions are taken as closely as possible to the citizen and that constant checks are made to verify that action at EU level is justified in light of the possibilities available at national, regional or local level.
27 "…, in so far as such gases can technically and safely be injected into, and transported
through, the natural gas system".
Optimal use of biogas from waste streams
March 2017 I 79
6.2.2 Renewable energy policies and targets
For many Member States, EU renewable targets and policies are arguably the
strongest driver for biogas support measures. Agreeing on stable and effective
renewable energy targets and policies for 2030 on EU level can therefore be
expected to increase investment security and lead to equally effective renewable
energy targets and policies in the Member States. The overarching targets should
preferably be accompanied by an effort sharing decision that translates the EU target
to national RES targets or a strong encouragement to Member States to set their own
binding targets. These would contribute to a clear and stable market outlook and thus
increase investment security.
It is also recommended that the EU provides guidelines or benchmarks to further
support decarbonisation efforts in all sectors and harmonise developments. Specific
and long-term sector targets for RES (for electricity, heat, transport) have the
potential to further increase investment security and thereby reduce the cost of capital
for new installations. Sector (indicative) targets for heating and transport, in
particular, can support increased biogas use in these sectors, where significant GHG
savings can be achieved and alternative renewable energy options are currently
scarce.
Member States should be encouraged to develop an outlook for biogas/biomethane
production and use to replace natural gas. This outlook should be based on an
assessment of the potential for biogas production, including identification of the
various potential feedstocks and sources, and of the different options for its use. As a
first step, biogas and biomethane could be explicitly included in the requirements for
the Member State progress reports required by Article 22(1) of the RED.
In the transport sector, increasing the use of biomethane requires not only
increasing the production of biomethane, but also an increasing market share of
vehicles suitable for CNG or LNG, as well as sufficient filling stations. These issues are
all addressed in a number of EU policies: the RED, the FQD and the Clean Power for
Transport Directive28. Biomethane is likely to be key to increase the share of
renewable energy in CNG and LNG, and coherence of the various policies is crucial
to the effective development of biomethane use in transport.
The 2030 RES policies should include both direct application of (100%) biomethane (in
the transport sector, for district heating, etc.) as well as injection in the grid. The
latter route is often the most cost-effective means of transporting biomethane, but the
first is sometimes preferred for reasons of cost, especially in areas with limited gas
grid coverage, transparency or public perception. The mass balance method
introduced in RED Article 18(1) can provide this flexibility on Member State level (see
Section 6.2.7 for the topic of cross-border trade).
We furthermore recommend revisiting Article 17(1) of the RED and also allow Member
States to apply an energy balance system to account for feedstock mixtures, as an
alternative to the mass balance system. This is a detail of the legislation relevant to
co-digestion, where the energy density of feedstocks can differ significantly: manure
has a much lower yield (in terms of GJ biogas per tonne feedstock) than maize. For
example, if co-digestion is applied with 80% manure and 20% maize (mass percent),
the produced biogas and biomethane will be considered to be 20% from maize, i.e.
from a crop that falls under the cap defined in the ILUC directive. 80% counts as being
based on a waste and residue streams that does not fall under the cap and is eligible
28 The first two support the deployment of biomethane in the sector, notably in road transport,
the latter aims to ensure sufficient availability of CNG filling stations by 2020/2025, and of
LNG for heavy-duty vehicles and shipping by 2025/2030.
Optimal use of biogas from waste streams
March 2017 I 80
for double counting if used in the transport sector. In reality, however, due to the
difference in energy density, the maize will have contributed to about 60-70% of the
resulting energy, depending on the characteristics of the manure. Energy allocation
will thus provide a more realistic result than mass allocation in these cases. This issue
is relevant for all biofuel and bioliquid production processes that have mixed
feedstocks, but it is only relevant for use of the biomethane in transport and the
transport target of the RED, not for use in heating or electricity production or for the
overall RES target.
6.2.3 Sustainability criteria
It is recommended to agree on clear, effective and robust sustainability criteria
for biogas feedstock and other biomass feedstock use at EU level for all applications,
not only for transport as it is today. This is necessary for a number of reasons:
to create a level playing field with other biomass routes;
to enable and facilitate cross-border trade;
to ensure public support; and
safeguard that efforts focus on deployment of biogas routes that achieve high GHG
savings.
These criteria should be stable until 2030, again to enhance investment security.
They should put the necessary boundary conditions in place to be sufficiently robust
for the next decade from an environmental point of view. This also requires that they
allow for new developments and feedstock types to be included over time.
Ambitious targets of minimum GHG savings over the whole production chain, for
example, are likely to be more robust than specifications that define which feedstocks
are allowed since they leave room for technological innovations.
EU level sustainability criteria should harmonise criteria related to feedstocks used
for biogas production for all applications, comparable to the provisions of the ILUC
directive that applies to biofuels (incl. biomethane) used in the transport sector. This
is especially relevant for co-digestion of manure and mono-digestion of crops such as
maize. In co-digesters, large shares of co-substrate will improve biogas yields and,
depending on local conditions and cost, improve the business case for the biogas
production. These feedstocks can have limited environmental benefits, though, and
cause indirect land use change. Sustainability criteria should limit the environmental
impact of these co-substrates, encouraging farmers to increase the level of manure in
co-digestion.
Harmonisation of sustainability criteria in the EU can be considered a prerequisite for
the proper functioning of the internal market, as it will facilitate cross-border trade.
6.2.4 Heat
Using biogas as a fuel in CHP-plants has the potential to achieve relatively high GHG
savings, depending on whether or not the produced heat is used. Reliable EU-wide
data on heat use from biogas electricity production are not available, but EBA
estimates that about 25% of the heat is utilized. If a larger share of the rest-heat
would be used, there would be significant potential to improve overall energy
efficiency, replace more natural gas with a given amount of biogas and increase GHG
savings. However, biogas production is not always close to heat users and heat
demand typically varies significantly over the year. Heat demand from industry, as
energy input for processes, can be more stable over time than demand from the built
environment, depending on the type of industry and processes.

Optimal use of biogas from waste streams
March 2017 I 81
It is therefore recommended to provide incentives to use the rest-heat from
biogas use. This can be done on Member State level (discussed below, Section 6.3.3),
but there are also a number of EU level regulations and communications that could
support these measures. This support would aim to encourage biogas producers and
users to optimise local biogas end-use by choosing a location for CHP close to heat
users, by optimising CHP operations (e.g. by combining CHP with biogas or thermal
storage), by investing in infrastructure needed for heat use, etc.
EU heating and cooling policies should explicitly address the use of biogas and
biomethane as a potential means for (locally produced) sustainable energy,
particularly for heating. Heat utilisation warrants explicit support through the relevant
policies, namely the Energy Efficiency Directive (EED; 2012/27/EU), RED and Energy
Performance of Buildings Directive (EPBD; 2010/31/EU), and the future 2030
energy policies. These policies should encourage Member States to reduce and
decarbonise energy demand for heating in line with the 2016 EU Strategy on Heating
and Cooling (COM(2016) 51 final), and include provisions on the following topics:
For example, by providing indicative targets for the share of RES in the heating
sector, or by setting an ambitious overall RES target that would require increasing
the share of RES in heating in order to meet the target efficiently.
Encourage Member States to require heat utilisation plans for future CHP plants as
well as for existing ones.
Urge Member States to consider heat distribution as a sustainable alternative to
other heating options in their energy network strategies.
Share information on best available technologies for useful heat utilisation from CHP
plants, including options such as district heating and cooling and on-site utilisation.
This could be achieved, for example, through guidelines for practitioners and
demonstration projects.
6.2.5 Agriculture
There are a number of key issues in EU level agricultural policies that directly affect
biogas production and use, the following are recommendations for potential
improvements of these policies.
The use of digestate as fertilizer and soil improver instead of waste should be
stimulated, as long as the digestate is derived from clean feedstocks. The EU waste
legislation29 already regards anaerobic digestion, which result in the production of
biogas and digestate, as a recycling operation. The EC proposal (COM(2016) 157) for
a Regulation on the making available on the market of CE marked fertilising products
and amending Regulations (EC) No 1069/2009 and (EC) No 1107/2009, provides the
legislative framework and limits for use of organic fertilizer products, such as
digestate, which should lead to harmonisation.
However, in livestock dense areas, the use of digestate can be limited, since the
Nitrates Directive (91/676/EEC) considers all digestate with a share of animal manure,
as 100% animal manure for which a limit of 170 kg N/ha is included for Nitrate
Vulnerable Zones. Whereas use of undigested manure in combination with compost
would allow higher application. It is therefore recommended to differentiate the
requirements regarding the use of digestate in agriculture, based on the share of
manure in the feedstock and the nitrogen content of the digestate. This would increase
29 Article 2 (6) of Commission Decision 2011/753/EU establishing rules and calculation methods
for verifying compliance with the targets set in Article 11(2) of Directive 2008/98/EC of the
European Parliament and of the Council. OJ L 310 of 25.11.2011.
Optimal use of biogas from waste streams
March 2017 I 82
the potential use of digestate and therefore promote biogas production from co-
digestion.
EU-wide harmonisation of the regulations regarding which co-substrates are
allowed in anaerobic digestion would be beneficial to the development of the EU
internal market of biogas/biomethane. This would create a level playing field and
would allow export of digestate to other Member States. This approach should allow
for flexibility regarding co-substrates – an important issue as there are different co-
substrates used in different Member States and developments and research may result
in new types entering the market in the coming years and decades30. An option to
achieve this is by defining EU-wide sustainability criteria for biogas and
biomethane, as discussed above. This approach should allow for flexibility regarding
co-substrates and ensure the sustainability of the overall end product. Large shares of
co-substrate in co-digestion can improve biogas yields and therefore improve the
business case for biogas production on farms. However, they may also reduce the
average environmental benefits (GHG savings) of the biogas that is produced,
depending on the GHG emissions of these co-substrates. Sustainability criteria can
increase the GHG savings of the biogas produces, encouraging farmers to increase the
level of manure in co-digestion and choose co-substrates with low environmental
impact31, e.g. by distinguishing between different levels of the use of maize in
co-digestion.
Although the current Common Agricultural Policy (CAP) already provides options to
stimulate anaerobic digestion of manure through provisions in the Second Pillar, e.g.
investment subsidies, this could be strengthened in the next revision of the CAP, e.g.
through rewarding the prevented emissions from manure storage and stimulating
mono-digestion.
Removal of nitrogen rich crop residues (e.g. vegetables and sugar beet leaves) and
use as biogas feedstock could decline nitrogen leaching and could lead to an
improvement of the soil and surface water quality. The introduction of measures to
introduce residue removal practices in zones that have high nitrate leaching could
increase the availability of biomass feedstock available for digestion, improve
compliance with the Nitrates Directive and bring down nitrate leaching levels.
6.2.6 Waste and circular economy
The main objective of the EU’s Circular Economy Package published in 2015 is to ‘close
the loop’ of product lifecycles through greater recycling and re-use, and to bring
benefits to both the environment and the economy. 31% of the EU’s municipal waste
is still being landfilled, with very large variations between Member States (COM(2015)
595 final). Since a large proportion of municipal waste is biodegradable, this landfill
potentially causes significant GHG emissions, as well as pollution of surface water,
groundwater, soil and air. The 2015 proposal for a landfill directive includes a binding
landfill target to reduce landfill to maximum of 10% of municipal waste by 2030 and a
ban on landfilling of separately collected waste. These developments are likely to
reduce biogas production from landfill, but increase the availability of organic waste
for anaerobic digestion. When re-use is not feasible, for example when the waste
cannot be used as food or feed, biogas production through anaerobic digestion can
30 An alternative approach with a list of allowed co-substrates (currently used in some Member
States, for example in the Netherlands) would be less flexible in that respect. 31 The cost of co-substrates is also relatively high, therefore innovations aimed at improving
business cases of mono-digestion would be beneficial, and research is ongoing.
Optimal use of biogas from waste streams
March 2017 I 83
then be a waste-to-energy route preferable to landfill32. Biogas production can thus
contribute to the objectives and targets of both the current and the future (2030) EU
level waste and circular economy policies.
It is therefore recommended to ensure compliance with the waste and landfill
directives throughout the EU. This includes the provisions on applying the waste
hierarchy (Article 4) and on bio-waste (Article 22). For example, some countries in the
EU still lack economic and regulatory instruments to divert waste from landfill.
Furthermore, in view of the significant potential for growth of biogas production from
organic wastes that was identified in this study (see Section 4.3.1), Member States
should be encouraged to implement separate collection systems for organic waste
streams, if they do not yet have this in place. The various reporting provisions
included in the proposals for the waste and landfill directives can be a useful starting
point for this exercise.
The 2015 proposal for an EU waste and circular economy package also aims to
improve harmonisation and simplify the legal framework on by-products. Digestate,
the by-product of anaerobic digestion, is also affected by this legislation: Article 5
confirms that it is a by-product and not waste. This allows the digestate to be used as
fertilizer and soil improver.
6.2.7 Biomethane: grid access and trade
To further develop biogas upgrading to biomethane, access to the natural gas grids
becomes relevant and, albeit to a lesser extent, biomethane trade across borders.
Biomethane trade is still very limited, mainly because biomethane volumes are limited
and demand is often higher than supply, but this may change as biomethane demand
and production increases in the EU33. Trade is currently based on bilateral agreements
between countries. EU-wide harmonisation of quality standards, sustainability criteria
as well as data transfer would remove the need for these bilateral agreements and
facilitate the internal market for biomethane.
From a regulatory point of view, biomethane grid access is currently covered by the
EU natural gas regulations, and recently approved standards for biomethane for
injection into the natural gas network (EN 16723-1:2016). An automotive standard is
currently under approval (prEN 16723-2), both under responsibility of CEN Working
group TC408. These standards are considered to be an essential enabler of the
biomethane market in the EU.
It is furthermore important to develop EU-wide common traceability and
sustainability standards for biomethane for the use in national grids, as
harmonisation of these standards can support the development of the internal market
and cross-border trade, ensuring that sustainable biomethane that is injected into the
grid in one Member State can be sold as sustainable biomethane in another Member
State, where it can also be included in RES consumption targets and policies
(depending on the policies in place).
It is, however, recommended to keep the approach for trade of biomethane in line
with the situation in renewable electricity production, where the actual location of the
RES production to the electricity grid determines which country may count the RES
towards its RES target (RED, Article 5(3)). National policy support measures are
32 The proposals also contain provisions on waste prevention (Article 9), which also reduces
potential feedstock for biogas production but nevertheless will have a positive environmental impact.
33 Biomethane Status and Factors Affecting Market Development and Trade, IEA Bioenergy,
2014.

Optimal use of biogas from waste streams
March 2017 I 84
typically also limited to this scope. This prevents double counting in EU statistics and
double support. At the same time, EU level harmonisation of transfer of administrative
data relevant to biomethane would facilitate trade within the EU. An EU-wide system
of Guarantees of Origin (GoO) for biomethane, similar to GoOs for electricity that
are governed by Article 15 of the RED, can then be used to facilitate administrative
trade of the biomethane, for disclosure and transparency purposes.
An alternative approach would be the implementation of a system for an EU-wide
mass balancing of biomethane in natural gas grids that could provide a flexible basis
for biomethane trade. This could encourage end-users to use biomethane that is
produced elsewhere, further contributing to an internal market for biomethane. The
BIOSURF project recently concluded that EU-wide mass balancing is necessary to
maintain the ‘green’ and ‘renewable energy’ value on the international market
(BIOSURF, 2016) and ensure that any volume of biomethane injected into the grid can
only be brought to the market once. These options would require cross-border
harmonisation of biomethane support policies to prevent double support (e.g.
eligibility for a feed-in tariff in our country and for lower tax levels for biomethane
end-use in another country).
The data to be transferred through GoO or any other administrative system when
trading biomethane should include all information relevant for national support
schemes, transparency and RES reporting requirements, such as34:
biogas producer details;
biomethane upgrading details (plant name and address);
period of injection and amount injected;
proof of Injection by the distribution system operator (DSO) or transmission system
operator (TSO);
trader ID;
origin (anaerobic digestion, landfill, sewage sludge, other);
in case of anaerobic digestion: substrate(s) used. In case of co-digestion or other
mixes: share of various substrates, based on energy content;
sustainability certificate;
whether the biogas producer, the biomethane upgrading or injection received any
support, and if so, what kind;
date, country of issue, unique ID.
As a first step, the use of Guarantees of Origin certification systems as a disclosure
and transparency system for biomethane can be improved by encouraging more
Member States to establish a national register for biogas GoOs. Currently, 7 Member
States have such a register in place. These registries oversee the issuing,
administration and cancellation of GoOs. This measure could be included in Article 15
of the RED, which contains similar provisions for GoO of electricity, heating and
cooling produced from RES.
The EU can furthermore encourage Member States to invest in grid development
relevant for biomethane projects: to connect remote biogas production locations to the
natural gas grid as part of gas network strategy and planning, with a focus on rural
grid development.
Biomethane can be injected into both the distribution and transmission gas grids, most
of the recommendations above therefore apply to all gas grids. As far as the authors
34 Partly based on BIOSURF Deliverable D3.3, with modifications.
Optimal use of biogas from waste streams
March 2017 I 85
of this study are aware, cross-border trade of biomethane, however, only involves
transport via transmission grids.
6.2.8 Dissemination and Innovation
As the results of the scenario analysis illustrate, innovation of the biogas chain can
have a range of benefits. Continued efforts into R&D of biogas production, conversion
into biomethane and the application of biogas are therefore recommended. These
efforts should be aimed at technology developments that reduce cost, improve
efficiencies and reduce emissions, as well as at sustainable sourcing of co-substrates
for co-digestion. Important issues to address are further developing innovations
regarding manure mono-digestion and development of other innovative digestion
techniques (e.g. high pressure digestion), but innovative research into other parts of
the value chain, for example regarding methanisation processes, can also contribute
to cost reductions and/or extra cash flows in the future. Innovations into the use of
digestate as useful natural fertilizer, the use of fibres from digestates, and pre-
treatment of sludges can also contribute to further driving biogas developments.
Provide a platform for best practices related to biogas production technologies,
applications and policies, with dissemination targeted at farmers, economic actors,
municipalities, policy decision makers and other stakeholders throughout the EU. The
results of the stock-taking has shown that a large part of the biogas installations are
deployed by semi-professional investors such as farmers, local cooperatives and
private owners. Such groups often do not have the means to inform themselves on the
fields relevant for an investment decision. They would therefore greatly benefit from a
platform that gives them a first overview on the framework of biogas investments and
helps them evaluating their own project ideas. A description of best practices would
also help policy decision makers understand their own conditions and find new options
to improve their respective national framework. It should be noted that, though, that
there is already a large number of platforms that cover parts of the content of this
platform. For that reasons, the main input of the proposed platform would be to
assess the existing platforms and connect their input in a centrally available
information database.
Member State recommendations 6.3
6.3.1 Strategy Development
As was concluded earlier, stable and effective Member State policy support is crucial
for biogas projects and investments throughout the EU. There is significant potential
for biogas production with significant potential benefits, but there are still many
Member States with no or only limited support policies. Other Member States,
including countries with mature markets and large scale biogas production in
operation, are currently revising their renewable energy policies and support schemes,
for various reasons: the revised state aid guidelines from the European Commission,
concerns about high cost to consumers, the need to enhance efforts to achieve the
2020 RED targets or change in policy priorities. The current policy reviews as well as
ongoing and future efforts to develop national RES targets and policies for 2020 and
beyond can provide a good opportunity to further develop the national biogas strategy
for the longer term.
Member States are therefore recommended to develop national strategies on the
role of biogas and biomethane to meet future renewable energy and climate
goals, in cooperation with the relevant biogas stakeholders. This should include an
assessment of available suitable feedstocks and an outlook for biogas/biomethane
production and use, indicating the potential for biogas production and assessing the
different options for its use: is local use feasible and cost-effective, how does this
Optimal use of biogas from waste streams
March 2017 I 86
compare to upgrading and grid injection or transport to end-user in heating or
transport?
The strategies should take into account related policy areas that may benefit from
increased biogas deployment such as agriculture, rural development, air and water
quality, waste and circular economy. Environmental benefits of biogas production,
including avoided methane emissions, should be included both in strategy
development as well as in any support policies.
As part of this strategy, Member States should decide which policy focus would be
optimal, given the national, regional and local objectives, opportunities and
circumstances. Policies can focus on different areas: on integration of biogas sector as
a part of sustainable agriculture, on maximising renewable energy production and/or
GHG savings (national or regional), on developing a renewable and sustainable
alternative to natural gas in the heating and/or transport sectors, etc. As part of the
assessment, Member States can also compare different applications, i.e. options for
end-use.
For example:
Biogas can be used locally for sustainable electricity and heat production, typically
as a replacement for natural gas in district heating systems (e.g. in high efficiency
CHP).
Biogas can also be used to provide flexible electricity production, and thus
contribute to the uptake and growth of flexible RES from wind and solar energy in
the energy system. The benefits of this application can be further enhanced by
using the residual heat.
If the biogas is upgraded to biomethane, it can be used as a renewable energy
source for heating in the built environment or industry, or as a renewable transport
fuels, notably in CNG and/or LNG vehicles. If the natural gas network allows, this
can be achieved by injection into the grid, alternatively, dedicated biomethane
transport by truck to the end-user or filling station may be an option. As the
scenarios demonstrate, this route can result in relatively high GHG savings,
assuming that the biomethane replaces diesel.
These choices can each have different impacts, pros and cons, and will result in
different policy packages.
6.3.2 Biogas production and demand support policies
Irrespective of what overall strategy is chosen, stable and effective renewable
energy targets for 2030 and long-term, stable support policies are considered
to be a prerequisite to increase biogas production and demand to the levels identified
in this study. These policies should include effective and stable minimum
sustainability criteria that remain valid until at least 2030. These determine the
environmental benefits from the policies as well as the future demand for specific
feedstock-biogas/biomethane routes, important boundary conditions for investment
decisions.
Specific RES targets and support policies for the various sectors (e.g. electricity,
heat, transport) can further increase investment security as it reduces uncertainties
regarding the future outlook for biogas demand. Support policies can take many
forms, including feed-in tariffs or premiums, quota (e.g. for renewable heat in
buildings, renewable energy in transport fuels, etc.), financial and fiscal incentives,
etc.
A further differentiation of policy incentives to the sustainability of the
renewable energy (e.g. GHG savings) can further ensure focus of efforts and

Optimal use of biogas from waste streams
March 2017 I 87
investments towards the most sustainable options including many of the biogas routes
from waste, use of waste heat and CHP, etc.
Biogas and biomethane support policies need to take into account that biogas
installations have high upfront investment costs and therefore need long-term
financing possibilities and return on investments. To realise biogas projects on small-
scale farm-level, specific support policies for these actors may be necessary, the
smaller scale operations typically lead to higher investment security requirements.
Farmers have, for example, indicated to accept lower prices if those are guaranteed
over time, and that this type of support would be preferred over investment subsidies.
The biogas sector can also be seen as a part of sustainable agriculture, not limiting
policy considerations to energy production. The biogas sector can contribute to
prevention of GHG emissions from manure storage and wastes, and the use of biogas
co-products for improved soil management (high-quality bio-fertilisers). Policy support
can include higher incentives for mono-digestion (at least 90 or 95% manure) than for
co-digestion with lower shares of manure. As a matter of course, in case manure is
used as feedstock in a digester, GHG emission reductions due to prevented methane
emissions that would normally result from the manure should be taken into account in
the GHG emission calculation methodologies.
To support and facilitate growth of demand for biogas or biomethane, different policy
packages are needed for different applications of the biogas and biomethane. These
typically require additional supporting policies and strategies on top of biogas policies,
for example:
support to district heating and CHP installations;
an electricity market design that values flexible power production;
investment support or supporting regulations to facilitate connections to the gas
grid;
support for the market uptake of CNG vehicles and filling stations, possibly targeted
at specific transport modes such as city buses or regional goods transport.
It is recommended to assess and compare the various policy options in these areas,
based on the more strategic choice of the preferred end-use options that was
discussed in the previous section. Member States can then design and implement a
coherent and integrated policy package that suits the national priorities and
opportunities.
The largest potential for biogas growth is in making more use of existing agricultural
waste streams such as manure. Member States that do not yet have sufficient support
policies in place should therefore focus their efforts on the mobilization of these
feedstocks. Care should also be taken that EU agro-environmental legislation such as
the Nitrate directive is properly implemented (Elbersen, 2016).
As mentioned above, it may be useful to implement support policies specifically for
small scale biogas production facilities (typically < 1 MW, but this can vary per
Member State). These projects can be very effective in reducing GHG emissions and
making use of waste streams that have no other applications. This applies to
digesters, but also to biogas production from landfill and sewage sludge.
It is also recommended to assess whether the administrative procedures and technical
rules for biogas and biomethane projects create unnecessary barriers and can be
improved (related to permits, support policies, grid injection, etc.).
Member State implementation of future EU level regulations regarding biogas (and co-
substrate) sustainability criteria, which are expected to be part of the 2030 renewable
energy policy proposals by the European Commission, can be an important step
Optimal use of biogas from waste streams
March 2017 I 88
towards harmonisation of biogas-related Member State policies. In the current
situation, these policies differ significantly, as illustrated in Section 3.3.4.
6.3.3 Support use of residual heat
As was concluded in Section 6.2.4, using biogas as a fuel in CHP-plants has the
potential to achieve relatively high GHG savings, if a large share of the produced heat
is used. However, biogas production is not always close to heat users, and especially
heat demand from the built environment (households, public buildings, utilities,
offices, etc.) can vary significantly over the year. Heat demand from industry, as
energy input for processes, can be more stable over time, depending on the type of
industry and processes.
It is therefore recommended to provide incentives to use of heat from CHP, in order
to increase both the GHG savings from the biogas and the share of RES in the heating
sector. There are a number of options to achieve this on Member State level, such as:
Include relevant requirements or incentives in financial support measures for
renewable energy. For example, differentiate support to biogas according to GHG
savings achieved or to the average share of rest-heat used, provide support to
renewable heat production and use, or oblige gas grid operators to achieve a
minimum share of RES in their heat production and supply or to purchase biogas at
set prices and inject into the grid (as is the case in Lithuania, for example).
Include relevant requirements or incentives in building regulations. Consider, for
example, to take measures that oblige the use of RES-heat in buildings. In
Germany, for example, the law ‘EEWärmeG’ regulates the obligation to use
renewable energy in new buildings. Owners of new buildings must cover part of
their heat supply with renewable energies.
Promote use of biogas in CHP installations close to end-users of the heat. For
example, require heat utilisation plans for future CHP plants as well as for existing
ones, or provide dedicated support to biogas project developers, such as heat
mapping, technical or contractual support (see, for example, the Heat Network
Delivery Unit in the UK). Barriers related to heat grid connection and access should
be addressed. Suitable locations could be near municipalities or residential areas
with a district heating system, or an industrial area with heat-consumers. Financial
support may be necessary to develop a sound business case for all parties involved,
for example due to additional transport and distribution cost if these locations are at
a distance to biogas feedstock or production facilities.
Encourage investments in heat infrastructure, for example by providing financial
support, by implementing requirements in industrial development areas or (new)
residential areas, etc.
Note that most of these measures are not only relevant for biogas but also for the
decarbonisation of heat in general. They should therefore be an integral part of the
sustainable heating and cooling strategies of Member States, regions and
municipalities, especially related to existing buildings were there are often only few
renewable and cost-effective alternatives for decarbonisation.
6.3.4 Agriculture
Agricultural policies are very relevant to biogas developments, and Member States
could focus stronger on integration of the biogas sector as a part of sustainable
agriculture, not limiting policy considerations to energy production. For example, by
optimising the biogas sector’s contribution to prevention of GHG emissions from
manure storage and wastes, and the use of biogas co-products for improved soil
management (high-quality bio-fertilisers). Member States should value GHG emission
reduction in their support policies and regulation in case manure is used as feedstock
Optimal use of biogas from waste streams
March 2017 I 89
in a digester, thereby reducing the methane emissions that would normally result from
the manure.
6.3.5 Waste and circular economy policies
In line with the EU level recommendations on waste and circular economy, each
Member State should ensure compliance with the waste and landfill directives.
This includes the provisions on applying the waste hierarchy (Article 4) and on bio-
waste (Article 22). Many countries have these policies implemented and some have
effectively prohibited landfill of organic wastes altogether, for example the
Netherlands, but some countries in the EU still lack economic and regulatory
instruments to divert waste from landfill.
Furthermore, in view of the significant potential for growth of biogas production from
organic wastes that was identified in this study, Member States should assess their
organic waste streams, identify their sources, determine the potentials for biogas
production and ensure separate collection of these waste streams.
6.3.6 Biomethane: grid access and trade
A number of Member States have chosen to support biomethane as a renewable
alternative to natural gas for heating or for use in the transport sector, typically to
increase the share of renewables in these sectors and to increase demand for biogas.
The latter can improve the business case for biogas projects, especially in cases where
the biogas is produced at locations with limited electricity and heat demand. The
biomethane is then either transported directly to the end-user (typically via dedicated
trucks35) or injected into the gas grid where it is then mixed with natural gas. The first
route is applied by some Member States (e.g. Sweden), the latter route in others (e.g.
Italy, the Netherlands). The type of distribution is mainly based on cost
considerations, which depend strongly on the gas grid coverage near the biogas and
biomethane production site.
If a Member State has a well-developed gas grid, distribution cost will be lower than in
countries with a less developed grid, but even then, additional pipelines are often
necessary to connect biomethane plants to the grid due to the often remote
location of biogas production plants.
Since grid expansion typically requires significant investments, Member States can
thus support biomethane development by providing investment support, or by
implementing relevant grid expansion requirements for national gas grid operators.
The investments needed in grid expansion, and the overall cost of bringing the
biomethane to the market depend strongly on the local conditions, and need to be
determined on a project-by-project basis. Any assessment of options to enhance
biomethane grid access should then be part of a broader national gas strategy and
grid development plan, to identify projects where grid expansion would be cost-
effective.
Facilitating biomethane cross-border trade requires a number of EU level actions (see
the recommendations in Section 6.2.7), but Member States can contribute to these
developments by setting up a national registry for biogas Guarantees of Origin that
oversee the issuing, administration and cancellation of GoOs.
35
Either as compressed biomethane or as liquid (bio-LNG), depending on transport distance.
Optimal use of biogas from waste streams
March 2017 I 90
6.3.7 Regional opportunities
Regions and municipalities are also recommended to assess their potential biogas
sources as well as options to develop these opportunities. These can contribute
to their energy independence and rural development, increase the share of locally
produced renewable energy, and, at the same time, reduce environmental impact of
waste streams. These include agricultural waste (incl. manure), food waste, sewage
sludge and landfill.
A broader view on biogas and RES-related regional and rural development can then be
useful to identify options to optimise investments, support and energy related
opportunities. Examples of policies that can support biogas and biomethane projects
are financing of demonstration or pilot projects of rural intelligent grids with high
share of renewable energy (RE) on farms, and the development of micro-credit
schemes at the national level (possibly guaranteed by EU funds) for RE installed on
farms. Connection of remote biogas production locations to the natural gas grid
typically requires a broader view on rural natural grid developments. Developing
biogas projects in conjunction with district heating can optimise heat use.
6.3.8 Dissemination and information
Specific attention should be given to raising awareness of potential stakeholders
and investors regarding the available benefits of biogas production and usage,
especially in Member States where biogas markets are still immature and there is
significant potential to increase biogas production. Potential producers and users can
be informed directly, best practices can be advertised, training courses and workshops
can be organized, etc.
Organise adequate communication with the public and national or local NGOs,
to ensure that they are well informed about ongoing and planned biogas projects in
their neighbourhood, the environmental benefits and safety and sustainability
safeguards in place, etc. This could include local and regional information campaigns,
web-based communication and a central point to turn to in case of questions.

Optimal use of biogas from waste streams
March 2017 I 91
7 Conclusions and recommendations
This final chapter provides and overview of the key conclusions and recommendations
of this study.
Main conclusions 7.1
7.1.1 Current status of biogas in the EU
Biogas production and use
Biogas production in the EU is currently 625 PJ (2014 data), accounting for 7.6% of
the total primary production from RES. All EU Member States have at least some
biogas production, but, as shown in Figure 29, Germany is by far the largest producer
- responsible for half of the total annual production in the EU28 - followed by Italy and
the United Kingdom. 72% of the biogas is produced in anaerobic digesters, mainly
farm-based plants and some industrial organic waste digesters. In addition, landfill
had a share of 18% of the total, and sewage sludge 9%. This biogas is mainly used for
electricity production (62%), followed by heat production (27%). About 11% is
upgraded to biomethane and then either used directly as a transport fuel or injected
into the natural gas grid.
Figure 29 Biogas production per Member State in 2014, differentiated by source (EurObserv’ER, 2015)36
Information on feedstock use for biogas production in the EU is not easy to obtain, but
it is estimated that energy crops (maize mainly) provide about half of the biogas
production (318 PJ) in the EU, followed by landfill (114 PJ), organic waste (86 PJ),
sewage sludge (57 PJ) and manure (46 PJ).
Based on the number of biogas plants installed, the Member States were divided into
‘mature’, ‘moderate’ or ‘immature’ market categories. This division was then used to
36 In PJ, with 1 PJ = 23.88 ktoe.

Optimal use of biogas from waste streams
March 2017 I 92
explore whether specific drivers or barriers could be identified depending on the
market maturity of a country.
Drivers for biogas developments
Existence, stability and reliability of the policy framework and support scheme(s) is
the number one driver in all countries, independent of whether they already have a
mature biogas market in place or not. This demonstrates how important it is to have a
stable and reliable political and legal framework providing long-term visibility and
certainty for project developers and investors. Along with attractive and well-
functioning support schemes it helps technologies to enter the market and compete
with conventional energy.
National targets and goals also play an important role in all three markets, leading to
the conclusion that ambitious GHG reduction, renewable energy or biogas/biomethane
specific targets at national level can be seen as a good example also for the remaining
Member States that opt to increase biogas/biomethane production and use.
Furthermore, feedstock potential or availability of feedstock is a driving force in all
three markets; highlighted in Poland, Belgium, Portugal, Spain, Ireland, and Croatia.
Stakeholder effort is seen as an important driver in mature markets and immature
markets; it is not mentioned as a driver in moderate markets.
Other identified drivers are difficult to compare since they vary a lot not only among
the three markets but also in the respective market itself. Examples of other drivers
mentioned are growing confidence in biomethane technology (the United Kingdom),
regions with poor electricity and high unemployment rate (France), and large
customer demand for green gas (Ireland).
Barriers
The number one barrier in all three sectors and in all three markets is opposite of the
main driver mentioned above: the lack of existence, stability and reliability of the
framework and support scheme(s). This barrier is a result of the current revision of
the existing support schemes in some Member States and lack of support schemes,
especially in heat and transport sectors, in a variety of Member States.
Besides this main issue, there is a great variety of barriers across EU Member States.
Access to finance is a barrier in electricity sector in all three markets, more severe in
immature and moderate markets. In the heating sector access to finance is more
severe in mature markets than in immature markets (and not detected in moderate
markets).
In the transport sector, other problems are deemed more relevant, such as lack of EU
and/or national goals, lack of supporting taxing regimes, mass balancing rules related
issues as well as a negative perception of biogas/biomethane technologies and low
public awareness, which was found to be the second biggest barrier in mature
markets.
ILUC and sustainability issues have mainly been reported by the Member States with
mature markets (the United Kingdom and Sweden in all three sectors). For the
transport sector ILUC related problems have been communicated also by Poland.
These issues typically relate to policy uncertainties.
Barriers related to the treatment of biogas by-products as well as the access to the
suitable waste streams appeared in mature and moderate markets, whereas lack of
expertise and stakeholder efforts constitute a barrier in immature markets (Croatia,
Romania and Bulgaria). Some barriers appeared only in one of the Member States,
like e.g. certification issues in Italy or cost of feedstock in Portugal.
Optimal use of biogas from waste streams
March 2017 I 93
Cost of biogas production
Biogas production cost differs significantly, depending on the substrate used, the
technology applied, investments needed and the possibilities to distribute the resulting
digestate in the surrounding agricultural area. In case the biogas is upgraded to
biomethane, additional investment and operational cost result.
Infrastructure
Almost all EU Member States currently have gas infrastructure and storage in place, as
well as a natural gas infrastructure for transport and gas quality regulations, important
prerequisites for biomethane deployment and growth (unless biomethane is
transported with dedicated trucks, as is common practice in Sweden).
To apply the biomethane in transport, the necessary infrastructure and sufficient filling
stations for CNG or LNG need to be available, and typically also support policies to
make the bio-CNG or -LNG attractive to vehicle owners. The EU-countries with the
highest number of CNG filling stations are Italy and Germany, but Austria, Sweden
and Finland also have an extensive network of CNG stations. Other EU Member States
are clearly lagging behind these countries in this area, as many of them have only
initiated the process of creating the necessary infrastructure.
Inter-EU trade
Initially, biomethane has been traded at a national level only, but gradually it becomes
a cross-border commodity that is traded between EU Member States. Nevertheless,
cross-border biomethane trade is still very limited. The main problems identified
concern the traceability requirements and in particular the mass balancing system that
is implemented on national level but does not include trading of biomethane across
borders via the natural gas grid. Moreover, cross-border trade in biomethane is more
difficult if there are country specific quality requirements additional to those set by the
EU (e.g. regarding noise or odour emissions of production plants). EU-wide
harmonisation and mandatory sustainability criteria for gaseous biomass, especially
used in the heat and power sector, are seen as an important prerequisite to resolve
this issue.
7.1.2 Biogas polices in the EU and Member States
EU policies
A large number of EU policies is relevant to biogas and biomethane developments,
ranging from renewable energy and climate change policies, state aid guidelines,
regulations on transport, agriculture and waste to natural gas regulations. Many of
these are currently being revised or further developed, most notably the renewable
energy and climate policies beyond 2020, and waste and recycling policies related to
the EU’s Circular Economy Package. In view of the dependence of biogas deployment
and investments on effective and stable policy support, these new regulations and
communications for the period after 2020 are expected to be crucial to the longer
term developments of biogas in the EU.
Member State support schemes
The EU-wide overview of biogas support schemes demonstrates that biogas across EU
Member States is mainly supported in the electricity sector, while support for
biomethane has its focus on the transport sector. As the significant gap between
current biogas production and technical potential illustrates, there is still a lack of
effective support schemes in many Member States. Biogas and biomethane for
electricity generation is supported in 26, for heat generation in 18, biomethane in the
transport sector in 16 Member States. A greater focus in the future national policies on
the biogas and biomethane supporting incentives in the heat and transport sector
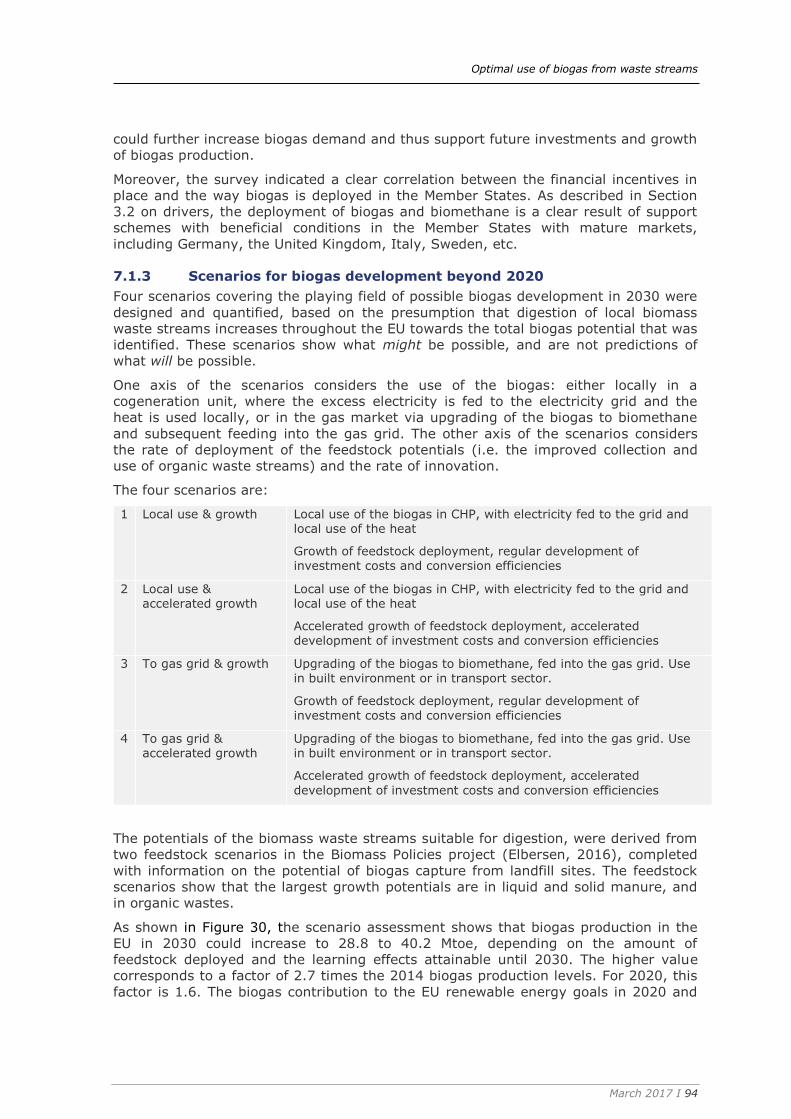
Optimal use of biogas from waste streams
March 2017 I 94
could further increase biogas demand and thus support future investments and growth
of biogas production.
Moreover, the survey indicated a clear correlation between the financial incentives in
place and the way biogas is deployed in the Member States. As described in Section
3.2 on drivers, the deployment of biogas and biomethane is a clear result of support
schemes with beneficial conditions in the Member States with mature markets,
including Germany, the United Kingdom, Italy, Sweden, etc.
7.1.3 Scenarios for biogas development beyond 2020
Four scenarios covering the playing field of possible biogas development in 2030 were
designed and quantified, based on the presumption that digestion of local biomass
waste streams increases throughout the EU towards the total biogas potential that was
identified. These scenarios show what might be possible, and are not predictions of
what will be possible.
One axis of the scenarios considers the use of the biogas: either locally in a
cogeneration unit, where the excess electricity is fed to the electricity grid and the
heat is used locally, or in the gas market via upgrading of the biogas to biomethane
and subsequent feeding into the gas grid. The other axis of the scenarios considers
the rate of deployment of the feedstock potentials (i.e. the improved collection and
use of organic waste streams) and the rate of innovation.
The four scenarios are:
1 Local use & growth Local use of the biogas in CHP, with electricity fed to the grid and local use of the heat
Growth of feedstock deployment, regular development of investment costs and conversion efficiencies
2 Local use & accelerated growth
Local use of the biogas in CHP, with electricity fed to the grid and local use of the heat
Accelerated growth of feedstock deployment, accelerated development of investment costs and conversion efficiencies
3 To gas grid & growth Upgrading of the biogas to biomethane, fed into the gas grid. Use in built environment or in transport sector.
Growth of feedstock deployment, regular development of
investment costs and conversion efficiencies
4 To gas grid & accelerated growth
Upgrading of the biogas to biomethane, fed into the gas grid. Use in built environment or in transport sector.
Accelerated growth of feedstock deployment, accelerated
development of investment costs and conversion efficiencies
The potentials of the biomass waste streams suitable for digestion, were derived from
two feedstock scenarios in the Biomass Policies project (Elbersen, 2016), completed
with information on the potential of biogas capture from landfill sites. The feedstock
scenarios show that the largest growth potentials are in liquid and solid manure, and
in organic wastes.
As shown in Figure 30, the scenario assessment shows that biogas production in the
EU in 2030 could increase to 28.8 to 40.2 Mtoe, depending on the amount of
feedstock deployed and the learning effects attainable until 2030. The higher value
corresponds to a factor of 2.7 times the 2014 biogas production levels. For 2020, this
factor is 1.6. The biogas contribution to the EU renewable energy goals in 2020 and

Optimal use of biogas from waste streams
March 2017 I 95
2030 can be 10.6% and 13.8%, where the target volumes in these years are
expressed as 100% and assuming that a 27% RES target is set for 2030.
Figure 30 Growth of biogas production in EU28 in the scenarios in ktoe37
The costs per GJ biogas depend on the feedstocks and the corresponding digester
technology and scale used. The range is between 5 €/GJ for landfill gas to around
30 €/GJ for sewage sludge digestion, with the comment that in the last number, the
reduction of sewage sludge treatment costs is not taken into account in the
calculations due to lack of data. On average, the calculated EU-wide biogas production
costs are 14 €/GJ in the growth scenarios and 12 €/GJ in the accelerated growth
scenarios.
In case all the produced biogas is upgraded to biomethane at natural gas quality or all
production is converted to electricity in a cogeneration unit (CHP), the resulting cost
levels are 1.8 to 2.5 times the current EU reference prices in the EU for natural gas
and electricity, respectively. A cost reduction effect can be seen from accelerating
learning curves due to market stimulation and innovation stimulation, but this is
insufficient to become competitive with natural gas at the current price level.
As shown in Figure 31, the largest GHG emission reductions result from the use as
biomethane in the transport sector, when the biomethane replaces diesel. The
smallest GHG effect arises when the biogas is used in a CHP, due to the fact that
emission factors for electricity are rapidly declining towards 2030 (resulting in
relatively low-carbon electricity to be replaced), and because on average only 25% of
the net heat production from the CHP is effectively used in the scenarios. Optimisation
of electricity production to ensure that only fossil power production is replaced and
increasing heat utilization could therefore both contribute to increasing the GHG
reduction in that scenario. In fact, if the electricity produced by the CHP in Scenarios 1
and 2 replace fossil fuels only instead of the 2030 electricity mix, the GHG savings in
these scenarios could increase by more than 70%.
37 1 ktoe = 41,868 GJ.
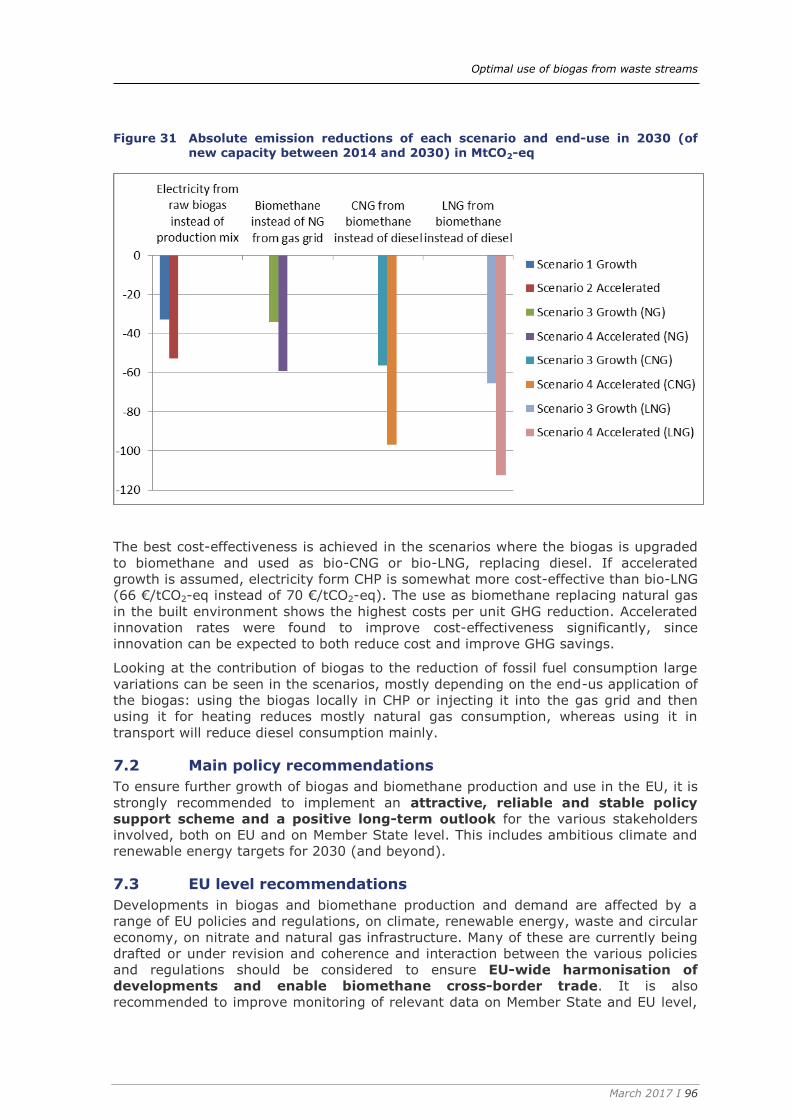
Optimal use of biogas from waste streams
March 2017 I 96
Figure 31 Absolute emission reductions of each scenario and end-use in 2030 (of new capacity between 2014 and 2030) in MtCO2-eq
The best cost-effectiveness is achieved in the scenarios where the biogas is upgraded
to biomethane and used as bio-CNG or bio-LNG, replacing diesel. If accelerated
growth is assumed, electricity form CHP is somewhat more cost-effective than bio-LNG
(66 €/tCO2-eq instead of 70 €/tCO2-eq). The use as biomethane replacing natural gas
in the built environment shows the highest costs per unit GHG reduction. Accelerated
innovation rates were found to improve cost-effectiveness significantly, since
innovation can be expected to both reduce cost and improve GHG savings.
Looking at the contribution of biogas to the reduction of fossil fuel consumption large
variations can be seen in the scenarios, mostly depending on the end-us application of
the biogas: using the biogas locally in CHP or injecting it into the gas grid and then
using it for heating reduces mostly natural gas consumption, whereas using it in
transport will reduce diesel consumption mainly.
Main policy recommendations 7.2
To ensure further growth of biogas and biomethane production and use in the EU, it is
strongly recommended to implement an attractive, reliable and stable policy
support scheme and a positive long-term outlook for the various stakeholders
involved, both on EU and on Member State level. This includes ambitious climate and
renewable energy targets for 2030 (and beyond).
EU level recommendations 7.3
Developments in biogas and biomethane production and demand are affected by a
range of EU policies and regulations, on climate, renewable energy, waste and circular
economy, on nitrate and natural gas infrastructure. Many of these are currently being
drafted or under revision and coherence and interaction between the various policies
and regulations should be considered to ensure EU-wide harmonisation of
developments and enable biomethane cross-border trade. It is also
recommended to improve monitoring of relevant data on Member State and EU level,

Optimal use of biogas from waste streams
March 2017 I 97
such as data on feedstock for biogas production and end-use of the biogas and
biomethane.
In line with the general recommendation above, stable and effective renewable
energy targets and policies for 2030 on EU level can increase investment security,
which can be further enhanced by EU level policies that achieve equally effective
renewable energy targets and policies in the Member States, preferably in the form of
specific and long-term sector targets for renewable energy (for electricity, heat and
transport). Member States should also be encouraged to develop an outlook for
biogas/biomethane production and use to replace natural gas, based on an
assessment of the potential for biogas production and of the different options for its
use. These targets and efforts would contribute to a clear and stable market outlook
and thus increase investment security.
Increasing the use of biomethane as a means to decarbonise the EU transport sector
not only requires increased production but also increased shares of (natural) gas
vehicles and a network of CNG and/or LNG filling stations. This requires coherence of
a range of EU level policies, including the RED, the FQD and the Clean Power for
Transport Directive.
It is furthermore recommended to use an energy balance method to account for
different feedstocks rather than the mass balance method currently used in the RED
(Article (17(1)). This is relevant to properly account for co-digestion of manure and an
energy crop such as maize, two feedstocks with very different energy densities.
Agreement and implementation of EU-wide clear, effective and robust
sustainability criteria for biogas and biomethane is key to create a level playing
field with other biomass routes, to enable and facilitate cross-border trade, to ensure
public support and to safeguard that efforts focus on deployment of biogas routes that
achieve high GHG savings. They need to be stable until 2030 to enhance investment
security, and should be technology and feedstock neutral, to allow for new
development and feedstock types to be included over time. They should furthermore
harmonise criteria for feedstocks used for biogas production for all applications,
comparable to the provisions of the RED and ILUC directive for biofuels (incl.
biomethane) used in the transport sector.
It is recommended to provide incentives to use the heat from biogas use in a CHP,
since this can significantly increase GHG savings and energy efficiency. This can be
done on Member State level (discussed below), but heat utilisation also warrants
explicit support through the relevant EU policies, namely the EED, the RED, the EPBD,
and the future 2030 energy policies. These policies should encourage Member States
to reduce and decarbonise energy demand for heating, for example with provisions on
indicative targets for the share of RES in heating, a requirement for Member States to
demand heat utilisation plans for CHP plants, etc.
Looking at agricultural policies, it is recommended to differentiate the
requirements regarding the use of digestate in the Nitrates Directive
(91/676/EEC), based on the share of manure in the feedstock and the nitrogen
content of the digestate. This increases the potential to the use the digestate and
therefore promote biogas production from co-digestion. In addition, EU-wide
harmonisation of the regulations regarding which co-substrates are allowed in
anaerobic digestion would be beneficial to the development of the EU internal market
of biogas/biomethane. This could be achieved with a list of allowed co-substrate
(where new co-substrates can be added over time) or via EU-wide sustainability
criteria for biogas and biomethane, as discussed above.

Optimal use of biogas from waste streams
March 2017 I 98
It is also recommended to ensure compliance with the waste and landfill
directives throughout the EU, and to encourage Member States to implement
separate collection systems for organic waste streams, if they do not yet have this in
place. This is an important step towards developing the significant potential for growth
of biogas production from organic wastes that was identified in this study.
To further develop biogas upgrading to biomethane, access to the natural gas grids
becomes relevant as does biomethane trade across borders. EU-wide standards for
biomethane injected into the grid have been recently agreed on. In addition, EU-wide
sustainability criteria as well as harmonisation of (administrative) data transfer can be
considered key to facilitate the internal market for biomethane. An EU-wide system of
Guarantees of Origin (GoO) for biomethane, similar to GoOs for electricity that are
governed by Article 15 of the RED, can be implemented to facilitate administrative
trade of the biomethane for disclosure and transparency purposes. The EU can
furthermore encourage Member States to invest in grid development relevant for
biomethane projects: to connect remote biogas production locations to the natural gas
grid as part of gas network strategy and planning.
Innovation of the biogas chain can have a range of benefits (e.g. cost reduction,
increased GHG savings) and many projects are currently ongoing. Continued efforts
into R&D of biogas production, conversion into biomethane and the application of
biogas are therefore recommended.
To improve dissemination of biogas-related knowledge and expertise, it is
recommended to set up a platform for best practices related to biogas production
technologies, applications and policies. EU dissemination efforts should be targeted at
farmers, economic actors, municipalities, policy decision makers and other
stakeholders throughout the EU.
National recommendations 7.4
Because of the importance of stable and effective Member State policy support for
biogas projects and investments, Member States are recommended to develop
national strategies on the role of biogas and biomethane to meet future
renewable energy and climate goals, in cooperation with the relevant biogas
stakeholders. This should include an assessment of available suitable feedstocks and
an outlook for biogas/biomethane production and use, indicating the potential for
biogas production and assessing the different options for its use (local use in CHP or
injection into the natural gas grid, use in transport or in other sectors, etc.). The
strategies should take into account related policy areas that may benefit from
increased biogas deployment such as agriculture, rural development, air and water
quality, waste and circular economy.
Based on the results of this strategy development, stable and effective renewable
energy targets for 2030 and long-term, stable support policies should be
implemented, a prerequisite to increase biogas production and demand to the levels
identified in this study. These policies should include effective and stable minimum
sustainability criteria that remain valid until at least 2030, in line with the EU criteria
that will be decided on in the coming years. Specific RES targets and support policies
for the various sectors can increase investment security, a further differentiation of
policy incentives to the sustainability of the renewable energy (e.g. GHG savings) can
enhance focus of efforts and investments towards the most sustainable options.
Policies should take into account that biogas installations have high upfront
investment costs and therefore need long-term financing possibilities and return on
investments.
Optimal use of biogas from waste streams
March 2017 I 99
It is furthermore important to realise that different policy packages are needed for
different applications of the biogas and biomethane. This could entail, for example,
support to district heating and CHP installations, an electricity market design that
values flexible power production or support for the market uptake of CNG vehicles and
filling stations. Member States can then design and implement a coherent and
integrated policy package that suits the national priorities and opportunities.
Since the largest potential for biogas growth is in making more use of existing
agricultural waste streams such as manure, Member States that do not yet have
sufficient support policies in place should focus their efforts on the mobilization of
these feedstocks (whilst ensuring adequate implementation of the Nitrate directive). It
is also recommended to assess whether the administrative procedures and technical
rules for biogas and biomethane projects create unnecessary barriers and can be
improved (related to permits, support policies, grid injection, etc.).
It is also recommended to provide incentives to use of heat from CHP, in order to
increase both the GHG savings from the biogas and the share of RES in the heating
sector. A range of policy options was identified, such as including requirements or
incentives in relevant support schemes or building regulations and providing technical
or contractual support to biogas project developers.
Member States could focus stronger on integration of the biogas sector as a part of
sustainable agriculture, for example by optimising the biogas sector’s contribution
to prevention of GHG emissions from manure storage and wastes and the use of
biogas co-products for improved soil management (high-quality bio-fertilisers).
Member State should furthermore ensure compliance with the waste and landfill
directives, including the provisions on applying the waste hierarchy and on bio-
waste.
If a Member States chooses to support biomethane as a renewable alternative to
natural gas for heating or for use in the transport sector, to increase the share of
renewables in these sectors and/or increase demand for biogas, distribution cost may
be a significant barrier for project developers. This may require financial
(investment) support to connect biomethane plants to the grid. If significant
grid expansion is required, an assessment of options should be part of a broader
national gas strategy and grid development plan, to identify projects where grid
expansion would be cost-effective. To facilitate transparency and cross-border trade,
Member States can set up a national registry for biogas Guarantees of Origin that
oversee the issuing, administration and cancellation of GoOs if they do not yet have
this in place.
Regions and municipalities are also recommended to assess opportunities for biogas
production and use. These can contribute to their energy independence and rural
development, increase the share of locally produced renewable energy and reduce
environmental impact of waste streams.
On both national and regional level, knowledge transfer and awareness raising can be
improved, especially in Member States where biogas markets are still immature. This
includes providing information for potential producers and users, advertising best
practices, etc. Adequate communication with the public and national or local NGOs
should be organised to ensure that they are well informed about ongoing and planned
biogas projects in their neighbourhood, the environmental benefits, safety and
sustainability safeguards, etc.
Optimal use of biogas from waste streams
March 2017 I 100
8 References
BIOSURF, 2016. Deliverable D4.3 Benchmark and Gap Analysis of C&I, s.l.: BIOSURF.
BIOSURF, 2016. Deliverable D4.4 Selected country analysis of sustainable
biomethane, s.l.: BIOSURF.
BIOSURF, 2016. Deliverables D3.2 and D3.5, s.l.: BIOSURF.
CAFEE, 2014. Heavy-Duty Vehicle Diesel Engine Efficiencies Evaluation and Energy
Audit, Morgantown, USA: CAFEE.
CA-RES II, 2015. Biomethane in Natural Gas Grids. Report from the Task Force within
CT7 Transport, s.l.: CA-RES.
CE Delft, ECN and TNO, 2013. Natural gas in transport, Delft: CE Delft.
CE Delft, 2010. Rijden en varen op gas - Kosten en milieueffecten van aardgas en
groen gas in transport, Delft: CE Delft/Energietransitie – Platform Nieuw Gas.
Council of the European Union, 2015. COUNCIL DIRECTIVE (EU) 2015/652, Brussels:
Official Journal of the European Union.
DHV/STOWA, 2011. Verkenning thermische slibontsluiting, Amersfoort: STOWA.
EBA, 2015. Biomethane and Biogas Report 2015 - Annual statistical report of the
European Biogas Association on the European anaerobic digestion industry and
market, s.l.: s.n.
ECN & DNV GL, 2014. Eindadvies basisbedragen SDE+ 2015, Petten: ECN.
ECN & DNV GL, 2015. Eindadvies basisbedragen SDE+ 2016, Petten: ECN.
ECN, 2011. Basisbedragen SDE+ 2012, Petten: ECN.
ECN, 2011. Stimuleringsregeling Duurzame Energie 2012, datasheet 'stortgas'.
[Online]
Available at:
https://www.ecn.nl/fileadmin/ecn/units/bs/SDE/SDE_2012_new/w2012_stortgas_WK
K.xls
Elbersen, B. e., 2016. Biomass Policies Deliverable 2.3: Outlook of spatial biomass
value chains in EU28, Brussels: European Commission.
EU PRIMES, 2016. EU Reference Scenario 2016. [Online]
Available at:
https://ec.europa.eu/energy/sites/ener/files/documents/AppendixRefSce.xls
EurObserv’ER, 2015. The state of renewable energies in Europe; Edition 2015, s.l.:
EurObserv’ER.
EurObserv'ER, 2014. Biogas Barometer, s.l.: EurObserv'ER.
EurObserv'ER, 2015. The state of renewable energies in Europe edition 2015, s.l.:
EurObserv'ER.
EUROSTAT, 2015. Half-yearly electricity and gas prices, second half year, 2012-14.
[Online]
Available at: http://ec.europa.eu/eurostat/statistics-
explained/images/9/9f/Energy_prices_YB2015.xlsx
Eurostat, 2016. Supply, transformation and consumption of renewable energies -
annual data [nrg_107a], s.l.: Eurostat.
Hou, Y. V. G. a. O. O., 2015. Mitigation of ammonia, nitrous oxide and methane
emissions from manure management chains: a meta-analysis and integrated
assessment.. Global Change Biology 21, p. 1293–1312.
IEA Bioenergy Task 37, 2016. Country Reports Summary 2015, s.l.: s.n.
JEC - Joint Research Centre-EUCAR-CONCAWE collaboration, 2014. Well-to-Tank
Report Appendix 4, Verion 4a. [Online]
Available at: http://iet.jrc.ec.europa.eu/about-jec/sites/about-
jec/files/documents/report_2014/wtt_appendix_4_v4a_2_biogas_synthetic_methane.
xlsx
Junginger, H. M., 2005. Learning in Renewable Energy Technology Development, PhD
thesis, Utrecht: Utrecht University.
Optimal use of biogas from waste streams
March 2017 I 101
SERPECCC, 2009. Methane in the waste sector, s.l.: SERPECCC.
SGC, 2013. Biogas upgrading – Review of commercial technologies, Malmö: SGC.
USDA, 2016. GAIN Report; EU-28. Biofuels Annual. EU Biofuels Annual 206, s.l.:
USDA.
Further reading used for the country factsheets included in Annex A of this
report
ADBA, 2015a. The Anaerobic Digestion and Bioresources Association. Anaerobic
Digestion Market Report of December 2015. Available at:
http://adbioresources.org/docs/151204_marketreport-dec2015-
44a4_v1_%282%29.pdf [Accessed 22 March 2016].
Ademe, 2014. French Energy Agency. Pre-industrial experimentation of production and
distribution of liquefied biomethane from a biogas plant, 02.2014. Available at:
http://www.ademe.fr/sites/default/files/assets/documents/biognval.pdf [Accessed 20
April 2016].
Ademe, 2015. French Energy Agency. Technical Report on Methanisation, 02.2015.
Available at: <http://www.ademe.fr/sites/default/files/assets/documents/fiche-
technique-methanisation-201502.pdf> [Accessed 12 April 2016].
Agro Intel, 2013. Fermierii romani au inceput sa foloseasca biogazul. Available at:
http://agrointel.ro/5626/fermierii-romani-au-inceput-sa-foloseasca-biogazul/
[Accessed 20 March 2016].
ANRE, 2015. National Energy Regulatory Authority - Autoritatea Nationala de
Reglementare in domeniul Energiei. Lista producatori (Internal document), received as
a pdf via e-mail on 28 March 2016.
Atee, 2014. Technical Association for Energy and Environment. White book for biogas:
a multiform renewable energy, with a strategic role for energy transition. 05.2014.
Available at: http://atee.fr/sites/default/files/2014-04_livre-blanc-biogaz_web_0.pdf
[Accessed 11 April 2016].
Aquiris, n.d. Operator of the Wastewater Treatment Plant of Brussels-North. Available
at: http://www.aquiris.be/environnement.php [Accessed 8 April 2016].
Biogas-e, 2014. Biogas-e, platform for Anaerobic Digestion in Flanders.
Voortgangsrapport 2014. Available at: www.biogas-
e.be/sites/default/media/rapporten/Voortgangsrapport_2014.pdf> [Accessed 24 April
2016].
Biogasvereenegung, 2016. National Biogas Association. Forderungskatalog der
Biogasvereenegung A.S.B.L. Available at: www.biogasvereenegung.lu/news.html
[Accessed 14 March 2016].
Brugel, 2013. Regional Energy Regulator. BRUGEL-RAPPORT-20130823-17,
23.08.2013. Available at: www.brugel.be/Files/media/SIGI/525fa6d563fae.pdf
[Accessed 8 April 2016].
Bundesnetzagentur, 2015. Federal Network Agency. Report. Monitoring Report 2015.
Available at:
www.bundesnetzagentur.de/SharedDocs/Downloads/EN/BNetzA/PressSection/Reports
Publications/2015/MonitoringReport_2015.pdf?__blob=publicationFile&v=1 [Accessed
25 February 2016].
BusinessGreen, 2015. UK anaerobic digestion capacity tops 500MW. Available at:
www.businessgreen.com/bg/news/2423367/uk-anaerobic-digestion-capacity-tops-
500mw [Accessed 22 March 2016].
Optimal use of biogas from waste streams
March 2017 I 102
Centrale Paysanne Luxembourgeoise, 2013. Im Biogassektor rumort es.
Biogaskonferenz in Ettelbrück zu neuen Vermarktungsmöglichkeiten für Biogasstrom.
Available at http://centralepaysanne.lu/WordPress3/im-biogassektor-rumort-es/
[Accessed 14 March 2016].
CERA, 2015. Cyprus Energy Regulatory Authority. PV, biomass and wind plants
connected to the grid of Electricity Authority of Cyprus. Available at:
www.cera.org.cy/main/data/articles/res12_2015.pdf [Accessed 18 February 2016].
Czech Biogas Association, 2016. Biogas plants. Available at: www.czba.cz [Accessed
26 March 2016].
De Geest, 2016. Veronique de Geest. Biogas-e, platform for Anaerobic Digestion in
Flanders. Interviewed on 25.04.2016.
EBA, 2015. European Biogas Association. Biomethane and Biogas Report 2015 -
Annual statistical report of the European Biogas Association on the European anaerobic
digestion industry and market.
E-Control, 2015. Ökostrom-Jahresbericht 2015. Available at: www.e-
control.at/documents/20903/388512/Oekostrombericht-2015.pdf/592ed7a3-4913-
401d-a6d4-d57780c2776d [Accessed 13 March 2016].
e-cube, 2015. Assessment of the Biogas sector in France, 19.06.2015. Available at:
http://atee.fr/sites/default/files/2015-11-26_etat-des-lieux-biogaz_rapport_final.pdf
[Accessed 12 April 2016].
EIHP, 2011. Energy Institute Hrvoje Požar. Development of the biogas market in the
European Union and Potentials in Croatia. Available at:
www.biogasin.org/files/pdf/hr_interaktivni/2_Razvoj%20trzista%20bioplina%20u%20
EU%20i%20potencijali%20u%20RH.pdf [Accessed 27 March 2016].
Estonian Biogas Association, 2016. Production and use. Available at:
http://eestibiogaas.ee/tootmine-ja-kasutamine/ [Accessed 14 March 2016].
EurObservER, 2015: Country policy profile Malta. Available at: www.eurobserv-
er.org/pdf/res-policy/EurObservER-RES-Policy-Report-Country-Profile-2015-Malta.pdf
[Accessed 23 February 2016].
EurObserv’ER, 2014. Biogas Barometer 2014. Available at: www.eurobserv-
er.org/biogas-barometer-2014/ [Accessed 5 April 2016].
Eurofund, 2013: The greening of industries in the EU. Malta: WasteServ Malta.
Available at: www.eurofound.europa.eu/observatories/emcc/case-studies/the-
greening-of-industries-in-the-eu/malta-wasteserv-malta [Accessed 23 February
2016].
Gaduš, Ján, Giertl, Tomáš., 2015. Dry Fermentation-effective way of evaluation of
biodegradable waste. Available at: http://tinyurl.com/hbktl5m [Accessed 29 March
2016].
German Biogas Association, 2015a. Fachverband Biogas e.V. Biogas Segment
Statistics 2014/2015. Available at:
www.biogas.org/edcom/webfvb.nsf/id/DE_Branchenzahlen/$file/15-11-
19_Biogasindustryfigures_2014-2015_english.pdf [Accessed 28 February 2016].
HEA, 2015. Hungarian Energy and Public Utility Regulatory Authority. A biogáz
hasznosítás tapasztalatai és aktuális kérdései. Available at: www.biogas.hu
[Accessed 29 February 2016].
HROTE, 2016. Croatian Energy Market Operator. Annual Report on the support
scheme for the production of electricity from renewable energy sources and combined

Optimal use of biogas from waste streams
March 2017 I 103
heat power in the Republic of Croatia for the year 2015. Available at:
http://files.hrote.hr/files/PDF/OIEIK/GI_2015_HROTE_OIEiK_2015_za_WEB_v2.pdf
[Accessed 21 March 2016].
HROTE, 2015. Croatian Energy Market Operator. Annual Report on the support
scheme for the production of electricity from renewable energy sources and combined
heat power in the Republic of Croatia for the year 2014. Available at:
http://files.hrote.hr/files/PDF/OIEIK/GI_2014_HROTE_OIEiK_web.pdf [Accessed 21
March 2016].
HROTE, 2014. Croatian Energy Market Operator. Annual Report on the support
scheme for the production of electricity from renewable energy sources and combined
heat power in the Republic of Croatia for the year 2013. Available at:
http://files.hrote.hr/files/PDF/OIEIK/GI_2013_OIEiK_web.pdf [Accessed 21 March
2016].
Hungarian Biogas Association, 2015. Magyar Biogáz Egyesület. A kecskeméti Szakmai
konferencián elhangzott előadásanyagok. Available at: www.biogas.hu/1/frameset
[Accessed 22 February 2016].
IEA Bioenergy, 2015a. International Energy Agency Bioenergy. Country report
Denmark. Available at: www.iea-biogas.net/country-reports.html?file=files/daten-
redaktion/download/publications/country-
reports/2015/Denmark_Country_Report_Berlin_10-2015.pdf> [Accessed 23 February
2016].
IEA Bioenergy, 2015b. France Country Report of the French Agency for Environment
and Energy Management, 10.2015. Available at: www.iea-biogas.net/country-
reports.html?file=files/daten-redaktion/download/publications/country-
reports/2015/France_Country_Report_Berlin_10-2015.pdf [Accessed 20 April 2016].
IEA Bioenergy, 2015c. International Energy Agency. IEA Bioenergy Task 37. Country
Report Ireland. Available at: http://www.iea-biogas.net/country-reports.html
[Accessed 26 March 2016].
IEA Bioenergy, 2014. International Energy Agency. Biomethane – Status and Factors
Affecting Market Development and Trade. A Joint Study by IEA Bioenergy Task 40 and
Task 37. September 2014. Available at: www.bioenergytrade.org/downloads/t40-t37-
biomethane-2014.pdf [Accessed 23 February 2016].
IEA Bioenergy, 2013. International Energy Agency. Energy Technology Network. Up-
grading plant list. Available at: http://www.iea-biogas.net/plant-list.html [Accessed 12
April 2016].
Keep on Track, 2014. Analysis of Deviations and Barriers 2013/2014. Available at:
www.keepontrack.eu/contents/publicationsanalysisdeviationsbarriers/kot_deviations-
and-barriers-report-2014.pdf [Accessed 29 February 2016].
Klima Aktiv, 2014. Entwicklung von Biogas in Österreich. Available at:
www.klimaaktiv.at/erneuerbare/biogas/EntwicklungBiogasAT.html [Accessed 13 March
2016].
Lampinen, Ari, 2015. RES-T methane markets in Finland 1941-2014. Available at:
www.cbg100.net/products/res-t-methane-markets-in-finland-1941-2014/ [Accessed
17 March 2016].
LNEG, 2015b. National Laboratory for Energy and Geology. A Situação Atual e o
Potencial do Biometano em Portugal”, 02.07.2015. Available at:
www.lneg.pt/download/10614/ISABEL%20MARQUES_BioMetanoWorkshop%20020720
15.pdf [Accessed 23 March 2016].
Optimal use of biogas from waste streams
March 2017 I 104
Meesters, K.P.H., Castillo A., Ravella S.R., Scholz M., Vries S.C. de, Batidzirai B.,
Elbersen W.E., Vries S. de, Ree R. van etc., 2013. Biogas 2 Market. Final report.
MoA, 2013. Ministry of Agriculture of the Czech Republic. Current update of biogas
plants in CR. Available at: http://eagri.cz/public/web/mze/zivotni-
prostredi/obnovitelne-zdroje-energie/bioplyn/bps/aktualni-prehled-bioplynovych-
stanic-v.html [Accessed 6 April 2016].
Mužik, Oldřich/Kára, Jaroslav, 2009. Possible use of biogas in the Czech Republic.
Available at: http://biom.cz/cz/odborne-clanky/moznost-vyroby-a-vyuziti-bioplynu-v-
cr [Accessed 26 March 2016].
NBU, 2013. Biogas production of active sludge of Stara Zagora wastewater treatment
plant. Available at: http://ebox.nbu.bg/eko14/pdf1/6.pdf [Accessed 21 March 2016].
RES LEGAL Europe database, 2016. Available at: www.res-legal.eu
Sternberg, Kristin/Erdmann, Georgia/Kirchmeyr, Franz/Collins, David/Hofmann,
Frank/Pieroni, Carlo/Schlienger, Marc/Verney, Marie/Kovacs, Attila/Scholwin, Frank,
2015. BIOSURF. Fuelling Biomethane. Report on current and future sustainable
biomass supply for biomethane production, 13 January 2015.
Stroiteli, 2015. Инсталации за обезвреждане на сметищен биогаз, July 2015.
Available at: http://stroiteli.elmedia.net/sti/bg/2015-7/PR-modules/инсталации-за-
обезвреждане-на-сметищен-биогаз_03740.html [Accessed 21 March 2016].
Szunyog, I./Horánszky, B. 2014. Biogázok alkalmazási feltételei háztartási
gázberendezésekben. Available at:
www.dunagaz.hu/UserFiles/File/konf2014/!Dunagaz%202014%20ea%20Szunyog%20
Horanszky%20publikus%2020140417.pdf [Accessed 29 February 2016].
Swedish Energy Agency, Swedish Gas Association, 2014. Energimyndigheten,
Energigas Sverige. Produktion och användning av biogas och rötrester år 2014. Online
available at: www.energimyndigheten.se/globalassets/nyheter/2015/produktion-och-
anvandning-av-biogas-och-rotrester-ar-2014.pdf [Accessed 25 February 2016].
Technical University of Denmark, 2014. Experiences with biogas in Denmark. Available
at: http://orbit.dtu.dk/files/97911958/Experiences_with_biogas_in_Denmark.pdf
[Accessed 23 February 2016].
University of Eastern Finland, 2015. Biogas register No. 18. Available at:
http://biokaasuyhdistys.net/media/Biokaasulaitosrekisteri2014.pdf [Accessed 17
March 2016].
ValBiom, 2014b. Liste des constructeurs de digesteurs de micro-biométhanisation en
Région wallonne, July 2014. Available at :
www.valbiom.be/files/library/Docs/Biomethanisation/140724_ValBiom_ListeMicrobiom
ethanisationConstructeurV02.0-CH.pdf [Accessed 30 March 2016].
VREG, 2016. Vlaamse Regulator voor de Energie en Gasmarkt. Aantal uitgreikte
groenestroomcertificaten en garanties van oorsprong. Available at:
www.vreg.be/sites/default/files/statistieken/groenestroom/20160407_-_gsc_-
_uitgereikte_certificaten_2.pdf [Accessed 24 April 2016].
Wolf, Andreas, 2016. Vortrag über das österreichische Biomethanregister. Available
at: www.youtube.com/watch?v=49jrmO1zFmg [Accessed 13 March 2016].
Zagrebačka banka, 2016. How to invest in biogas installations. Available at:
www.zelenazona.hr/home/wps/wcm/connect/zelena/zona/gospodarstvo/obnovljivi_izv
ori_energije/kako_ulagati_u_bioplinska_postrojenja [Accessed 22 March 2016].

Optimal use of biogas from waste streams
March 2017 I 105
Appendix A Country factsheets
Appendix A.1 Austria
Current production and consumption of biogas and biomethane
In Austria, biogas is deployed in 436 plants in total, with the highest number of 201
plants in the agricultural sector followed by the bio and industrial waste sector (125
plants), the sewage sector (95 plants) and the landfill sector (15 plants). In general,
Austria has maintained its number of biogas plants in the recent years and is
considered one of the leaders in the EU when it comes to plants running on industrial
waste and bio waste. Due to investments into heat use technologies, the fuel
efficiency of the biogas plants has been constantly raised up to 60%. Following
Austrian legislation, this has been obligatory in order to become eligible for a potential
successive feed-in tariff after the original eligibility period of 15 years has ended.
Concerning the biomethane sector, 14 plants were operating in Austria as of 2015,
from which 3 were not connected to the natural gas grid and 8 were linked to CHP
plants. The installed capacity of biomethane production amounted up to approx. 100
GWh in 2015, whereas its potential performance sums up to 7.6 million Nm³.
The actual focus lies on the refurbishment of the existing plants with the objective of
increasing capacities or building biomethane upgrading units with grid injection.
Further, the current trend is moving toward improving efficiency and
diversifying/adapting feedstock use.
There is a clear upwards trend for biomethane production in Austria. Also the research
will give greater attention to biomethane deployment. It is expected that the research
focus will lie inter alia on the conversion of the separated carbon dioxide into
biomethane.
Biogas and biomethane supporting schemes
Both biogas and biomethane for electricity generation are mainly supported through
a feed-in tariff, regardless of the plant’s capacity. The plant operators are entitled to
the conclusion of a contract for the purchase of and payment for electricity as long as
funds set by the government are available. There are several preconditions in order to
receive the tariff. First, the plant’s efficiency shall reach at least 60%. Second, the
share of pure agricultural substrates and animal manure deployed shall be greater
than 30%. If other feedstocks are used, the tariff will be cut by 20%. The tariff rates
are differentiated by technology, mainly biogas, landfill and sewage gas as well as
biomethane. The guaranteed tariff is granted for 15 years.
In Austria, CHP is an outstandingly fostered technology, which is reflected through a
supplementary premium to the basic feed-in tariff (CHP bonus). In addition to the
tariff, investment subsidies may be granted for the construction or revitalisation of a
CHP-plant with a capacity >100 kW which deploys sewage or waste and contributes to
the district heating supply. Companies, other entrepreneurial organisations,
confessional facilities and associations can profit from investment subsidies granted for
the installation of CHP off-grid power installations for the purpose of self-supply.
Where biomethane is not used for electricity generation and does not receive a feed-in
tariff, it becomes eligible for support reimbursing the eligible environmental
investments up to 30% compared to fossil fuel production. According to the expert,
the eligibility criteria for this type of support are often unclear. Therefore, the system
installer can barely rely on it when an investment is planned.
In the transport sector, emission-reduction measures are fostered under the
scheme of ‘klimaaktiv mobil’, providing investment grants or operating grants for
Optimal use of biogas from waste streams
March 2017 I 106
environmental friendly refurbishment of vehicle fleets. Projects are eligible for support
if upgraded biogas/biomethane with a minimum share of 50% is deployed.
Finally, there are several research programmes in Austria which foster the optimal use
of biogas and biomethane, such as the project ‘Virtual Biogas’, analysing the whole
value-added chain of biogas utilisation since 2007 in a pilot plant situated near
Bruck/Leitha which has been finalised successfully. Research funds are constantly
available within the Energy Research Programme.
Key drivers for biogas and biomethane developments
In Austria, a successful development of the biogas sector has been achieved through
cooperation of relevant stakeholders such as energy supply companies, industrial
businesses and private individuals. Concerning biomethane, the establishment of the
biomethane register with a data platform (offers inter alia marketing and international
networking possibilities) fosters the development of the sector. Furthermore, a
consortium within the framework of the EU-project ‘BIOSURF’ aims to foster the
deployment of biomethane and to enable its cross-border trade. Since June 2016,
there is a bilateral agreement in place between the Austrian biomethane register and
the German DENA which should support the latter and foster the recognition of related
certificates between participating states.
Key barriers to biogas & biomethane growth
In general, the experts criticize that renewable energy sources have not been
recognized within the Act on Energy Efficiency which foresees the reduction of energy
consumption. The deployment of RES as a carbon dioxide free alternative has not
been taken into account at all within the legislation.
In the electricity sector, inefficient support schemes and follow-up regulations
have been identified as barriers to further developments in the biogas sector. Interest
groups urge the implementation of efficient follow-up regulations within the upcoming
amendment (expected by the end of 2016) of the Green Electricity Act in order to
avoid the shut-down of further biogas plants in Austria. First plants commissioned
under the Feed-in Tariff scheme will receive no support anymore and operators might
be forced to make new investments to amortize the costs of maintaining a biogas
plant. This development also reflects the fact that there have not been enough
incentives for efficiency measures in the past years. Furthermore, the existing
disagreements on the successive feed-in tariff rate have led to planning
uncertainty and loss of credibility for the renewable energy objectives.
Within the heat sector, complications with the grid connection might occur. Most
of the Austrian biogas plants are not situated in the area of the natural gas grid
making grid extensions inevitable in the near future. This might require additional
financial support from the Government.
In the transport sector, a lack of official recognition for biomethane as a
renewable fuel has been identified as a barrier. This has a noticeable impact for
example on taxation policy and administrative processes, where biomethane is treated
like a fossil fuel at the moment. In the view of plant operators, the focus of current
policies on electricity generation from biogas impedes the development of the
biomethane sector.
Key policy amendments planned
In Austria, ongoing negotiations about the successive rate of the feed-in tariff or even
a scrapping bonus for non-efficient operations have resulted in huge uncertainties in
recent years. However, the respective amendment of the Green Electricity Act should
be passed by the end of 2016, and negotiations with relevant stakeholders will be
launched in mid-2016. According to the industry, it is time to modify the current feed-

Optimal use of biogas from waste streams
March 2017 I 107
in tariff system or elaborate a green electricity model for Austria, which is foreseen by
the EU for the long-term perspective. However, the industry is concerned that the
planned amendments might lead to a decrease in the number of the domestic biogas
plants.
Appendix A.2 Belgium
Current production and consumption of biogas and biomethane
In 2014, the total primary energy production from biogas in Belgium amounted to
8,637 TJ, among which 6,598 TJ was produced from anaerobic digestion. Landfill gas
represented 1,122 TJ, whereas sewage sludge gas amounted to almost 917 TJ. Over
85% of the gross electricity production from biogas was covered by cogeneration
plants in 2013.
In total, there are currently 1 biogas installation in Brussels-Capital, 40 in Flanders
and 43 in Wallonia. In this regard, Flanders and the Walloon Region have different
biogas production profiles: In Flanders, biogas is produced in large industrial facilities,
whereas the Walloon biogas production rather comes from agricultural plants, using
mainly food waste and agricultural residue streams. Regarding the production
purposes: the biogas plants cogenerate electricity and heat (sometimes they produce
only electricity). Most of the time, electricity is fed into the grid; sometimes it is used
on site for self-consumption. Heat is used on site or sold to houses, plants, municipal
buildings, etc.
Biogas and biomethane supporting schemes
In all 3 regions, biogas plants producing electricity may benefit from green
certificates (GC). In the Walloon region, the total amount of GC available per
technology is determined on a yearly basis by the Walloon Government, according to a
trajectory aiming at reaching a total electricity production from renewable energies of
8,000 GWh by 2020. In Brussels-Capital, the number of GC depends on the amount of
electricity generated in proportion with the CO2 saved: 1 certificate is issued for every
217 kg of CO2 saved. In Flanders, the amount of electricity to be produced for 1
certificate is calculated by multiplying 1 MWh with a technology-specific ‘banding
factor’, ranging between 0 and 1 and depending on the feedstock used.
In addition, the Walloon and the Flanders region provide financial support to
companies willing to develop R&D projects. In Flanders, funding is granted through the
Environment and Energy Technology Innovation Platform for interdisciplinary
cooperative research and feasibility studies. In Wallonia, companies can benefit from
an advance amounting to up to 70% of their investment costs for projects of applied
research or technological development.
In the electricity and heating sectors, all regions provide investment subsidies for
companies willing to invest in renewable energy projects. In Wallonia the support
corresponds to 20% to 40% of the investment costs, depending on the company size.
The investment shall amount to at least € 25,000. In Brussels-Capital, biogas CHP and
trigeneration plants may be supported in the amount of 20% to 40% of the
investment costs. In Flanders, the amount of subsidy depends on the company size
and the ecological performance of the relevant technology.
Finally, in the transport sector a bonus of € 1,000 is in place in Belgium for the
purchase of cars running on CNG.

Optimal use of biogas from waste streams
March 2017 I 108
Key drivers for biogas and biomethane developments
In the Walloon region, the GC system as well as the investment subsidies are
currently considered as quite efficient by stakeholders. The amendments to the GC
implemented in 2014 have provided for a greater visibility regarding the amount of
expected support as well as a greater stability of the GC market. In addition, the
investment subsidies provide an interesting financial support when coupled with green
certificates. Thanks to their stability, visibility and financial arguments, both support
schemes encourage producers to invest in biogas plants and are therefore important
drivers for biogas.
In Brussels-Capital, the high share of natural gas in primary energy consumption is
a non-negligible opportunity for the development of biogas and biomethane
production. From 22,3 TWh primary energy consumed in 2013, 43% came from
natural gas, 25% from electricity and 21% from fossil fuels.
In Flanders, the availability of technical know-how ensures a profitable management
of biogas production. Moreover, the excess of animal manure and its related energy
potential also represents a driver for further biogas deployment.
Since January 2016, the Belgian royal federation of natural gas (ARGB), has launched
a campaign for the support of CNG. The support consists in a bonus in the amount of
€ 1,000 for the purchase of cars running on CNG. In 2014 and 2015, a similar
campaign had already been launched by the ARGB, with a bonus respectively
amounting to € 2,000 and € 1,000. This campaign seems to be bearing fruits, since
over 1,000 NGV were ordered in Belgium in January and February 2016. Such
measures represent a non-negligible driver for the production and consumption of
biomethane as a biofuel, since biomethane has the same properties as natural gas and
could be therefore used in NGV.
Key barriers to biogas & biomethane growth
In all regions, the crisis following the excess of green certificates for PV on the market,
as well as the temporary lack of visibility regarding the support conditions have
resulted into a lack of confidence towards renewable energies, especially in the
banking sector. In 2014, changes to the green certificate system have provided for a
greater certainty as to the expected support. Moreover, legislative amendments
regarding the allocation of the building permit allow an easier installation of biogas
units. Despite these positive regulatory changes since 2014, banks are still reluctant
to participate in biogas projects. The persistent lack of confidence of banks may be
due to a lack of targeted communication, which results into a lack of knowledge about
the technologies and prospects of biogas.
Another barrier concerns the legal status of digestate, which represents no less
than 90% of the output of an anaerobic digestion plant (the remaining 10% being
biogas). The status of the digestate depends on the nature of the feedstock used in
the biogas unit, whether it is waste or not. Therefore, only the production of biogas
currently contributes to the profitability of a biogas project, while the economic
potential of digestate remains untapped.
Finally, only a few service stations in Belgium are equipped with a CNG pump.
As of January 2016, there were approximately 40 service stations in Flanders and 6 in
Wallonia. Currently, there are no service stations offering CNG in the Brussels-Capital
Region. The further deployment of CNG service stations is strongly correlated with the
deployment of vehicles fuelled with CNG. In order to stimulate the demand for CNG
vehicles, it is required that a certain number of gas stations offering CNG already
exist. The lack of CNG fuelling stations is probably due to the fact that the legislative
framework for on-site sale is not defined yet. In this regard, difficulties relating to
jurisdictional matters may arise when elaborating regulations, considering that the
Optimal use of biogas from waste streams
March 2017 I 109
federal level is responsible for the transport policy, whereas regions are responsible
for the energy policy.
Key policy amendments planned
No major new policies or policy amendments are currently being planned in Flanders.
This is partly due to the fact that that the green certificate policy was amended
recently, in 2013. As far as Wallonia is concerned, the regional government is
currently examining the introduction of support instruments to address the lack of
incentives for the injection of biomethane into the gas grid. The reflection on this
matter should lead to concrete measures in the coming months. At present, projects
involving the injection of biomethane in the gas grid are still at the stage of feasibility
study. Although technically feasible and legally possible, the lack of financial support
makes the execution of such projects difficult.
Appendix A.3 Bulgaria
Current production and consumption of biogas and biomethane
Bulgaria is one of the countries with the lowest biogas production in the EU. The total
number of biogas plants in Bulgaria in 2013 and in 2014 amounted to 11: 8 biogas
plants produced biogas from agricultural waste, 2 from biodegradable waste and 1
from sewage. The total installed capacity of all these plants in 2014 amounted to 13.6
MW and in 2015 to 20 MW, which is equivalent to 160 GWh/a electricity and approx.
180 GWh/a heat.
As of January 2015, the number of working plants reached 21, including 18
agriculture, 2 co-fermentation and 1 sewage biogas plants. Currently, there is no
biomethane production in Bulgaria.
Biogas and biomethane supporting schemes
In the electricity sector, new biogas plants are not eligible under the Feed-in Tariff
scheme from January 2016. The existing CHP plants working with thermal gasification
of timber biomass or biodegradable fraction of industrial and municipal waste and
having a capacity up to 5 MW may still receive the feed-in tariff. The National Long-
Term Programme to Encourage the Use of Biomass (2008–2020) indicates a huge
potential for energy production from solid agricultural by-products – up to 2.9% of the
gross domestic consumption in Bulgaria.
In the heat sector, the use of renewable energy is promoted through loans from the
Bulgarian Energy Efficiency Fund and through an exemption for building owners from
property tax. Eligible for loans are also biogas and biomass installations with an
installed capacity of less than 5 MW electric output (for biomass heat only boilers with
a thermal input higher than 10 MWh). Buildings using renewable energy technologies
(covers also biogas) with ‘A’ certificates for energy performance are exempted from
tax for 10 years, and buildings with ‘B’ certificates for 5 years.
There are no direct biogas supporting schemes in the transport sector in Bulgaria.
Biofuels are supported under the quota system, however, it is not clear if the definition
of biofuels covers also biogas. It has to be highlighted that Bulgaria has a potential for
the production of biofuels from raw materials without causing any negative impact on
the food and beverage industry. According to the forecast for biofuel production, the
needed area to grow energy crops in order to achieve the target of 10% biofuels by
2020 corresponds to 509,001 ha, which accounts for 16.3% of the arable land in
Bulgaria (3,128,210 ha).

Optimal use of biogas from waste streams
March 2017 I 110
According to the industry, the Bulgarian government has recently been sending rather
negative signals to the biogas sector. To mention in this context is the termination of
feed-in tariffs for electricity from biogas producing installations from January 2016.
Another example refers to the Operational Programme “Environment 2014-2020”,
approved by the European Commission on 15 June 2015. The Programme envisages
the funding of biogas production in wastewater treatment plants and grants for the
construction of biogas plants in the agriculture sector. Grants amount to 50-70% of
the construction cost, depending on the region and certain other conditions. The
programme envisages strong restrictions for substrates from stockbreeding and
agriculture waste. Moreover, there is no possibility to use biodegradable waste e.g.
slaughterhouse waste. Finally, the whole produced energy should be used only for own
purposes. However, there is currently no information as to when such projects will be
financed.
Key drivers for biogas and biomethane developments
The implementing measures of the Operational Programme “Environment 2014-2020”
cover the construction of installations for the preliminary treatment of municipal
waste, as well as composting facilities for the separate collection of biodegradable and
green waste. The programme aims to reduce the amount of waste going to landfills in
the less developed regions from 2,323,000 to 2,038,000 tonnes by 2023. In July
2015, the Ministry of Environment and Water published a tender for the design and
construction of composting facilities for separately collected green and/or
biodegradable waste. Such tenders represent a significant driver for the deployment of
biogas producing technologies, since the production of biogas could be easily
combined with the construction of composting facilities. However, it has to be noted
that the announced measures of the Operational Programme “Environment 2014-
2020” have their focus on the improvement of waste and water management in
Bulgaria, without putting an emphasis on biogas production.
Key barriers to biogas & biomethane growth
There is a lack of incentives for biogas in Bulgaria. After the abolition of the
preferential prices for electricity from biogas, no other support mechanism has been
introduced in order to stabilize the development of the sector. The current situation
makes it difficult, if not nearly impossible, for biogas projects to receive any financing.
The future development of the biogas sector is highly dependent on the Government
responsible for introducing an appropriate legislative framework.
In addition, no funds under the current Bulgarian Rural Development Programme
(RDP) are envisaged for biogas production.
Furthermore, the information on the actual situation in the biogas sector in the
current National Renewable Energy Action Plan (NREAP) is not accurate. In line with
the RED (2009/28/EC) the Ministry of Economy and Energy has sent to the European
Commission its "Second National Report on Bulgaria’s Progress in the promotion and
use from renewable energy sources-2013". The report states that Bulgaria has
reached its binding national target of 16% renewable energy in the final energy
consumption in 2012. However, according to the report published by the Association
of Producers of Ecological Energy in 2013, Bulgaria has only reached a RES-share of
14.7% in the gross final energy consumption by 2012.
Further barrier for the biogas project developers is the local opposition. The lack of
awareness among the people living near the planned biogas plants leads to an
incomprehension, scepticism and resistance. As an example, the road between the
towns of Strelcha and Hisar was blocked by protesters in 2013, who believed that the
planned biogas plant would pollute the air in the region. This happened despite
investors’ prior explanations that the installations will cause no odour or noise and
Optimal use of biogas from waste streams
March 2017 I 111
that the newly created jobs will have a beneficial impact on the local employment in
the region.
Key policy amendments planned
The Operational Programme “Environment 2014-2020”, approved by the European
Commission on 15 June 2015, envisages the funding of biogas installations in
wastewater treatment plants. There are ongoing discussions on the construction of
such installations among the Bulgarian authorities. However, there is currently no
information as to when such projects will be developed.
Appendix A.4 Croatia
Current production and consumption of biogas and biomethane
In Croatia, the production of biogas from anaerobic digestion is predominantly used
for the operation of electric power plants. By June 2016, there are 11 registered
biogas installations with a total capacity of at least 29,62 MW in Croatia. These biogas
installations predominantly use waste from livestock production (manure), animal
slaughter, agricultural industries (e.g. maize silage) and the food industry.
The processing of biogas to biomethane quality is planned, but not yet realised. By
now, LNG filling stations do not exist and there are only three CNG filling stations for
the estimated 200 gas-driven vehicles in Croatia.
Biogas and biomethane supporting schemes
In the electricity sector, power plants using biogas are supported with a feed-in
premium since January 2016. Although the new Act on Renewable Energies and High-
efficiency Combined Heat and Power (RES Act) does not mention explicitly biogas or
other renewable energy sources as eligible technologies, it is virtually certain that
biogas installations are eligible, which use agricultural crops and organic residues,
wastes of plant and animal origin, biodegradable waste, including landfill gas and
sewage gas for the electricity production. The exact form and further details of this
support mechanism will be regulated in a special Rulebook on Renewable Energies and
High-efficiency CHP.
Both for the electricity and the heating sector, the Environmental Protection and
Energy Efficiency Fund (EPEEF) invites to tender for interest-free loans and financial
subsidies for projects (invitation to tender is dependent on the Fund’s Annual work
program), which generate electricity or heat or combination of both from renewable
energy projects including biogas.
In addition, the Croatian Bank for Reconstruction and Development (HBOR) has
launched the Loan Programme for Environmental Protection, Energy Efficiency and
Renewable Energy, which, among others, offers low-interest loans for renewable
energy projects. This also includes the construction of biogas installations. Finally, the
Rural Development Programme of the Republic of Croatia for the period 2014-2020
has implemented subsidy measures in 2016 aimed at the use of renewable energies in
the agricultural sector, which also encompasses biogas power plants.
Regarding the transport sector, there are measures to encourage the use of
biofuels. Firstly, biofuels are exempt from excise tax. Biofuels in terms of the Excise
Tax Act are liquid or gaseous fuels for transportation purposes produced from
biomass, which also comprises biogas, as long as it was purified to natural gas quality.
Secondly, the National Action Plan to promote the Production and Use of Biofuels in
Transport for the Period 2011-2020 sets the goal of 9.18% of biofuels, which the
distributors (i.e. traders) of fuel are obliged to place on the market by the year 2020.
The total goal of 9.18% shall mainly be achieved with biodiesel (7.53%) and only to a

Optimal use of biogas from waste streams
March 2017 I 112
lesser degree with bioethanol (1.03%) and biogas (0.62%). So far, subsidizing system
does not cover CBM.
Key drivers for biogas and biomethane developments
Croatia has a significant agricultural sector and therefore farmers mostly can use
potentials from agricultural waste for the energy production. Croatia has half of its
agricultural land out of function which could be an opportunity for utilizing it for
growing biomass (either as energy crops, perennial grasses or SRC). Yet, a clear
strategy towards biofuels and achieving 2020 goal is still missing. Livestock sector
cannot cope with the EU standards and prices which is reflected in shrinkage of total
number of pig and dairy farms.
Compared to neighbouring countries, Croatia offered relatively high incentive prices
for electricity from biogas installations, which led to a steady growth in this area. It is
not clear yet, how the new support scheme (premium tariff) will affect the further
implementation.
Key barriers to biogas & biomethane growth
At the present, it is difficult to predict the concrete content of the future sub-
statutory provisions of the RES Act, which will specify and regulate the premium
tariff support scheme. Moreover, the newest political events led to a collapse of the
government under Tihomir Orešković and new parliamentary elections will be held in
autumn 2016. Energy experts estimate that the first tenders for the premium tariff will
not be launched before 2017. The delays of the awaited regulatory provisions cause
insecurities for potential investors. Additionally, the premium tariff will probably not be
a serious driving force for the biogas sector, since the existing approx. 7-8 MW of the
quota of 70 MW for biogas should be exhausted after the first tendering process.
One of the greatest obstacles for the development of biogas projects in Croatia is that
potential investors and plant operators often have no awareness of the economic
(and environmental) benefits of the use of biodegradable waste. Especially in
the traditionally important agricultural sector, farmers tend to shy away from
considering the construction of (even smaller) biogas installations. The main reason
for that is a missing technical and commercial understanding of the potentials of
biogas usage. Although Croatian biogas plant supplier have achieved considerable
success with the construction of several biogas installations, these very recent success
stories are not well known yet and could not have proven their profitability by now.
Considering the low amount of only two CNG filling stations, the infrastructure for
biogas/biomethane in the transport sector might be described as almost non-
existing. Furthermore, in Croatia there is no production and no selling of LNG and
(political) efforts to change this situation are not in sight at the moment.
The existing support schemes for the use of RES in the transport predominantly focus
on electric cars and only marginally incentivize the purchase of gas powered
vehicles. Private investors of gas filling stations will be reluctant to expand the
infrastructure as long as a sufficient number of gas station consumers hold out the
prospect of a profitable operation.
Key policy amendments planned
Given that the new RES Act only represents the basis for the regulation of renewables
in Croatia, more specifying sub-statutory provisions will have to be adopted. The
above-mentioned Rulebook on Renewable Energies and High-efficiency Combined Heat
and Power will determine the specific conditions for public tendering, the eligible
technologies, details on the Register of renewable energy producers, the conditions of
acquiring the status of privileged producer and the support scheme of premium tariffs
as such. A public discussion on the first draft with the experts in the field of energetics

Optimal use of biogas from waste streams
March 2017 I 113
and the interested public is ongoing. Moreover, pursuant to the RES Act the
government will issue a special Decree on the Determination of Quotas for the
Promotion of Electricity Production from Renewable Energy Sources for the period of
2016 to 2020.
Appendix A.5 Cyprus
Current production and consumption of biogas and biomethane
Cyprus has shown a moderate improvement as far as biogas deployment is concerned,
mainly during the period 2010-2014. Currently, there are 13 biomass/biogas plants on
the island. Their installed capacity remained stable since 2015 (9,714 kW). However,
the number of plants almost doubled during the period 2010-2014, while their
installed capacity almost tripled during that period (3,555 kW in 2010, additional
6,159 kW during 2010-2014). Concerning the feedstock used, manure accounts for
50%, while slaughter house material and other biowaste account for 30% and 20%
respectively.
There is currently no biomethane production in Cyprus.
Biogas and biomethane supporting schemes
There are currently no specific support schemes for biogas/biomethane in Cyprus in all
three sectors - electricity, heating and cooling, transport. The existing support
schemes ‘Energy Upgrading of Enterprises Scheme 2014-2020’ and ‘Energy Upgrading
of Residential Buildings Scheme 2014-2020’ support solely the purchase of biomass
installations for heating.
The Cyprus Energy Regulatory Authority (CERA) Decision 913/2013 could be seen as
the last indirect support for biomass/biogas installations in the electricity sector.
According to the Decision, CERA implemented a scheme for the autonomous
production of electricity from PV and biomass/biogas plants. Electricity production
from those autonomous producers was destined exclusively for their own consumption
purposes i.e. plant operators would not be compensated in any way for electricity fed
into the grid. The net electricity consumption by those plants had to be measured and
the electricity supplier (Electricity Authority of Cyprus - EAC) had to impose the
respective charges such as charges for ancillary services, for the stability of the
transmission system and distribution network. In contrast with PV, biomass/biogas
plants had no cap as far as the maximum installation capacity was concerned. The
scheme was in place until 20 December 2013.
Key drivers for biogas and biomethane developments
Despite the slowdown of biogas deployment since 2015, there is a number of crucial
factors that could facilitate the further development of biogas sector in Cyprus. The
first driver that could boost the deployment of biogas on the island is the supply of
feedstock that is currently available. Currently, only <20% of pastoral feedstock is
processed in biogas plants. This signifies a great potential, as that feedstock can be
exploited in a cost-efficient and environmental friendly manner. Apart from feedstock
from animal farms that currently supply biogas plants in Cyprus, a potential biogas
source may come from landfills. Despite the fact, that landfills promote the
sorting/separate collection of organic residues, this potential remains unexploited.
More specifically, almost 150,000 tonnes of organic residue streams are collected by
landfills every year and are processed with € 40/tonne. This equals to many additional
MW of biogas plants on Cyprus.

Optimal use of biogas from waste streams
March 2017 I 114
Key barriers to biogas & biomethane growth
Lack of support scheme. There is currently no support scheme for the promotion of
biogas in the electricity sector in Cyprus. Moreover, there seems to be no intentions
for the introduction of such a scheme in the future. The same applies to the heating
sector, despite the fact that the existing biogas plants have a great heat potential.
Currently, only 60% of the produced heat is used for the heating needs of the plants,
while the 40% remain unexploited.
Unreliable policy framework. The previous government planned to revise its NREAP
projection for 2020 and to foresee in the new plan an increase in the capacity of
biomass/biogas plants (from the currently envisaged in the NREAP 10MW to 14 MW).
For that reason, a Ministerial Decree was issued and a respective support scheme was
designed. However, as the government changed, the Ministerial Decree was not
implemented and no support scheme was announced, leaving the capacity of biogas
plants stable. It can also be said that Cyprus lacks an ambitious policy with regards to
biogas. It is viewed as one of the renewable energy technologies without taking into
consideration its additional environmental advantages. Apart from that, there has
been no holistic study concerning the biomass/biogas potential on the island.
Grid parity. Grid parity for biogas cannot be currently implemented in Cyprus.
Without the premium provided within the previous support schemes, the EAC
remunerates the electricity fed into the grid with the market price (so-called avoidance
cost). As the electricity market price in Cyprus is correlated with the price of fossil
fuels, avoidance cost is low (approx. €ct 6). Such a low price discourages potential
investors to invest in that sector. To mention is that only maintenance cost amounts
to €ct 2.1.
Key policy amendments planned
It is not clear whether there will be amendments concerning the support for
biogas/biomethane in Cyprus. It is obvious that there will be further calls under the
existing support schemes, i.e. ‘Energy Upgrading of Enterprises Scheme 2014-2020’
and ‘Energy Upgrading of Residential Buildings Scheme 2014-2020’. However, it is
uncertain if biogas/biomethane will be offered the necessary incentives.
Appendix A.6 Czech Republic
Current production and consumption of biogas and biomethane
In the Czech Republic, biogas is mostly produced by anaerobic digestion. The number
of biogas plants in the Czech Republic in 2014 was 554, where 383 were agricultural
biogas plants, 98 were waste water treatment plants, 55 plants in landfills and 17
biowaste and industrial waste biogas plants. Biogas production in the Czech Republic
in 2014 in electricity and heat amounted to 6,642 GWh, with 2,566 GWh of generated
electricity and 134.9 GWh generated heat.
There is currently no biomethane production in Czech Republic.
Biogas and biomethane supporting schemes
The only supporting policy applying to new biogas plants in the electricity and heat
sector are the subsidies from the Operational Plan “Enterprise and Innovation for
Competitiveness for 2014-2020”. The remaining support schemes, namely the Feed-in
Tariff and the Green Bonus, apply to the already existing installations. The conditions
for the feed-in tariffs were amended for the existing installations from January 2016.
According to these amendments, supported are only CHP plants put into operation
between 1 January 2013 and 31 December 2015, and that generate electricity using
biogas from no more than 30% energy crops and secure the efficient use of at least

Optimal use of biogas from waste streams
March 2017 I 115
50% of the primary energy generated by the biomass from which the biogas is
produced. In addition, the Green Bonus was abolished for renewable energy
installations including biogas installations put into operation from 2014 onwards.
Concerning the transport sector, there is currently no supporting measure for the
production or the consumption of biogas and biomethane as a biofuel in the Czech
Republic.
Key drivers for biogas and biomethane developments
Since the political climate in the Czech Republic is not in favour of renewable energy,
but rather supports the deployment of nuclear power, no political drivers have been
communicated for biogas and biomethane production by the relevant stakeholders
interviewed.
Key barriers to biogas & biomethane growth
Unavailability of information. Information regarding biogas and/or biomethane
(e.g. feedstock availability) is not sufficient. Only the Energy regulatory office
conducted a large survey regarding the biogas plants in the Czech Republic in 2014.
However, the information was not disclosed to the public, with one exception - energy
consumption. Therefore, the information about biogas plants in the Czech Republic is
mainly based on estimations.
Technological barriers. The Czech biofuel market is unexperienced in dealing with
advanced biofuels. One of the main problems is the lack of flexifuel vehicles and the
presence of too much old vehicles. The flexifuel vehicles, which are able to run on E85,
were produced only between 2012 and 2014. Due to the old fleet of vehicles, trade
with another biofuel E10 is very limited. This type of biofuel can only be used by
vehicles produced after the year 2000. Furthermore, the distribution from biofuel
producers to gas stations is not well developed yet. Moreover, the quality of
biomethane does not reach the quality of natural gas and there is no infrastructure to
upgrade biogas into biomethane with natural gas quality.
Another barrier concerning all three sectors is that the Czech media do not create a
positive image of renewable energy sources. Moreover, Czech politics focuses rather
on other energy carriers. President Miloš Zeman claimed in 2014 that renewable
energy is just a burden on the state budget and that an emphasis should be put on
nuclear energy.
Key policy amendments planned
There seems to be no planned policy amendments.
Appendix A.7 Denmark
Current production and consumption of biogas and biomethane
In 2013, biogas was produced in a total of 154 plants with an overall production of
1,218 GWh, with the highest number of facilities and production level in the
agricultural sector (67 plants producing 861 GWh) followed by sewage sludge
(57 plants/250 GWh), landfills (25 plants/56 GWh) and the industrial sector (5 plants/
51 GWh). In the same year, biogas provided 1.1% of the energy consumption in
Denmark. An amount of 1,400 GWh was used for electricity purposes, representing a
share of 79% of the total biogas production, followed by 250 GWh for the heating
sector (20%).
An increasing political and public interest in using biogas as a transport fuel can be
stated, especially concerning the use in public transport and heavy-duty vehicles.
Optimal use of biogas from waste streams
March 2017 I 116
A total number of 6 biogas upgrading plants with a capacity of 18 million Nm³ was
operated and fed into the grid in Denmark in 2013.
Biogas and biomethane supporting schemes
Already since 2008, Electricity production from biogas is mainly promoted through a
feed-in premium, which currently amounts to a fixed tariff of 11 €ct per KWh or to
5.4 €ct per KWh paid as a premium in addition to the current market price of
electricity. The tariff is net-price indexed and calculated every year on 1 January and
based on 60% of the increase in the net price index of the previous year as compared
to 2007.
In the heating sector, the use of biogas is indirectly subsidised by an exemption of
taxes, which are normally levied on the production, processing, possession, receipt
and dispatch of fossil fuels for heating purposes, for example the energy tax on
mineral oil products, taxes on coal, lignite and coke or the carbon dioxide tax on
certain energy products.
Denmark supports the use of biogas in the transport sector through a direct
premium tariff granted to sellers of biogas to end consumers for transport purposes.
The funding consists of the sum of three tariffs DKK 39 (approx. € 5.23), DKK 26
(approx. € 3.5) and DKK 10 (approx. € 1.34). As of 1 January 2016, the tariff
amounting to DKK 10 (approx. € 1.34) per GJ biogas will be annually decreased by
DKK 2 (approx. € 0.27) and will cease by the end of 2019.
Key drivers for biogas and biomethane developments
As an important driver for the deployment of biogas in Denmark, the 2012 Energy
Agreement’s increased operating support for the use of biogas for electricity
generation and upgrading can be identified. Furthermore, the investment support
scheme, being established in 2009 as a part of the “Green Growth” strategy, should
be mentioned. However, final decisions have been made so far only for a limited
number of projects, as the production expansion is 1.5 PJ. According to the biogas
taskforce initiated by the Danish Energy Agency, the biogas production is expected to
more than double until 2020 under the current framework conditions (from 4.3 PJ to
approx. 10 PJ).
Ambitious biogas targets have been formulated in the “Green Growth” strategy,
stating the objective that 50% of the livestock manure is to be used for green energy
in 2020. In addition, the Energy Agreement 2012’s aim was to have 35% of the
energy supply renewable by 2020 as well as to make Denmark fossil fuels-free by
2050.
Key barriers to biogas & biomethane growth
Insufficient financial incentives for the establishment and operation of biogas
plants. Linked to the fact that several new subsidies are being phased out and
probably disappear completely after 2020 if the natural gas price’s development is as
expected, the financial situation for biogas plants remains uncertain. Also contributing
to the financial burden, biogas plants have to deal with are the high costs occurring
from upgrading and grid connection. In addition, it is difficult for the plants to obtain a
sufficiently high price when selling their biogas for CHP, which leads to the fact that
the full value of indirect subsidies is rarely achieved.
Limited access to suitable biomass feedstock. Difficulties regarding the expansion
of biogas could occur because of the problems in finding suitable biomass for
supplementing slurry in order to achieve adequate gas production. Biomass consisting
of deep litter and straw is available for the replacement of energy crops and industrial
waste as the basis for the biogas expansion, however, there is a lack of specific long-
Optimal use of biogas from waste streams
March 2017 I 117
term experience and documentation regarding the economic durability of these raw
materials.
Missing competitiveness of biogas. Compared to alternatives such as heat pumps,
solar heating, wood chip-fired boilers and geothermal energy, biogas is not yet a
financially competitive technology for enterprises, as the average production costs
amount to € 17.5 per GJ and € 20.7–22.3 per GJ in upgraded form. According to the
biogas taskforce, it is estimated that the current biogas framework conditions will not
be sufficient for a continuous expansion.
Key policy amendments planned
After 2020, some of the subsidies will phase out. Even though there is no expiration
date defined by law, the aid approval is only valid for a period of 10 years (except
electricity and upgrading valid until 2023), according to the European Commission.
Thereafter, the aid is going to be renotified to the Commission, which could involve
changes. Also to the power generation accompanying the generation of heat, the
given subsidies for electricity cannot be granted.
Appendix A.8 Estonia
Current production and consumption of biogas and biomethane
Currently, there are 18 biogas plants in Estonia. All of them produce heat and/or
electricity: 5 plants running on agricultural input, 4 plants running on sewage
treatment, 3 plants running on industrial wastewater treatment, 6 plants running on
landfill gas.
Biomethane is currently not produced in Estonia. However, there are five operational
CNG stations at the moment and an additional three under construction. The
development plan of AS Eesti Gaas anticipates further construction of natural gas
filling stations and the launch of specialised filling stations for transport enterprises if
necessary.
Biogas and biomethane supporting schemes
In Estonia, renewable energy sources in the electricity and heating sector are
mainly supported with the feed-in premium. The Electricity Market Act stipulates that
where a renewable electricity producer sells renewable electricity on the free market
and exports it to the electricity grid, the transmission grid operator shall pay a bonus
on top of the selling price (a feed-in premium). Supported under this mechanism is
also electricity from biomass in CHP plants, electricity from waste and other renewable
electricity generated in an efficient CHP mode (for latter the maximum capacity is
limited to 10 MW). From 31.12.2010, producers who have started generating
electricity from biomass can only get the subsidy for electricity generated in efficient
CHP mode.
The (re)construction of infrastructure and technology to enhance the building of CHP
plants and to encourage the wider use of renewable energy sources is eligible for the
investment support. Supported measures cover the construction CHPs, the
reconstruction of boiler-houses to enable their operation on renewable energy sources
and for the reconstruction of the district heating network to improve the energy
efficiency.
In the transport sector, biomethane is eligible for subsidies. This financial measure is
the first of its kind that Estonia has adopted to promote the production and the
consumption of biomethane in this sector. One of the sub-targets is to support the use

Optimal use of biogas from waste streams
March 2017 I 118
of buses in the public transport systems that are fuelled by biomethane. The support
is available on first come first served basis.
It has to be noted that the support mechanisms currently in place in Estonia will not
allow the biogas to enter the market at a competitive price, not to mention the
biomethane. The country should follow the model of other Member States applying a
differentiated support for renewable technologies. The possible criteria could be the
source of the renewable energy, the raw material used, the size of the installation,
and its location.
A stronger effort is necessary in the transport sector, where the measures for the
significant increase in biomethane do not exist at the moment.
Key drivers for biogas and biomethane developments
The key driver for the production and consumption of biogas in the electricity and heat
sector is the feed-in premium envisaged in the Electricity Market Act. The supporting
measure for the promotion of biomethane in public transport is too recent to assess its
effectiveness in the increase of biomethane deployment in the transport sector.
Key barriers to biogas & biomethane growth
The key barrier negatively affecting biogas/biomethane in Estonia is the low price of
natural gas imported from Russia, Latvia and Lithuania (the share of Russian imports
should decrease to around 30% in the end of this year). At the moment there are no
measures in place that would help to overcome this price gap. The low price of natural
gas especially hinders the use of biomethane in pipelines and selling it to consumers
at a reasonable price. In addition, despite the newly launched subsidy scheme for
biomethane in the public transport is a positive development, it might not have an
expected impact in the sector. Therefore, to achieve the 10% RES-share in the
transport sector by 2020 extra measures are currently being developed in Estonia.
In the electricity sector, a complex authorisation process is a severe barrier. The
preparatory work to obtain a grid connection permit and to be eligible for the support
scheme is extremely difficult (micro-operators (<100 kW and <15 kW) get several
exceptions). The process foresees several tests that are unique and not required in
any other EU Member State. Also the length of the procedure is unpredictable, as it is
not very well regulated.
In the heating sector, smaller heat producers have problems with the access to
finances. Banks are reluctant to provide financing because heat consumption in some
networks is relatively low and therefore the risks are too high.
Public perception constitutes a further barrier for biogas/biomethane project
developers. The increasing share of renewable energy is a heavy burden for the
energy consumers as the renewable energy fee is already very high. Consumers are
very price sensitive and are not willing to pay for higher heating prices.
Key policy amendments planned
The Estonian support scheme for renewable energy sources is currently being
amended. The fundamental change would be the dependence of renewable energy
subsidies upon the stock exchange prices of electricity, the market prices for biomass,
or the market prices for CO2. However, the conditions on subsidising biogas production
should remain the same.
A specific measure that is meant for the achievement of the 10% RES-share is the
blending mandate for biofuels. When in force, this measure would require liquid fuel
suppliers to provide fuels that include bio-components. A draft of this measure is in
development since 2012 and is expected to come into force in 2018.
Optimal use of biogas from waste streams
March 2017 I 119
There are also plans to revise the excise duty policy to impose an excise duty on
natural gas, which currently does not exist.
Appendix A.9 Finland
Current production and consumption of biogas and biomethane
In Finland, biogas has been produced since 1902 in demonstration plants and since
1910 in commercial plants. Biogas has been utilized for residential heating, industrial
process heating, cooling, illumination and mechanical power production since 1932.
Electricity production at CHP plants began in 1936. Since 1941 biogas has been
utilized as vehicle fuel.
In 2015, 153 million Nm³ (about 0.76 TWh) of biogas was produced at 84 commercial
plants. Of these, 44 were reactor biogas plants (46% of production) and 40 were
landfill gas plants (54% of production). Biogas is mainly used to generate heat and
electricity in CHP plants that are located at the biogas production sites.
Thermal energy utilization was 483 GWh of which about 90% was low temperature
use (heating) and the rest was high temperature use (industrial processes). All
electricity production, 147 GWh, originated from CHP plants. Vehicles consumed 23
GWh that was delivered by 24 public CBG100 stations (100% Compressed BioGas).
Final end-use of biogas totalled 653 GWh, of which 98 GWh was upgraded biogas
originating from 9 commercial upgrading plants. Of upgraded biogas, 23% was
consumed as vehicle fuel and the rest for thermal energy applications. Amount of
unused biogas combusted by flares at production sites was 91 GWh.
Biogas and biomethane supporting schemes
In Finland, producers of electricity from biogas receive a premium tariff on top of the
wholesale electricity price for a period of 12 years. The premium tariff comprises of
the difference between the target and the market prices. A biogas plant is considered
eligible for receiving the premium tariff if it is a new power plant, has a minimum
nominal capacity of 0.1 MVA (no maximum nominal capacity is established), and has
not received state subsidy before. Biogas plants with the minimum efficiency of 50%
(75%, when nominal capacity of generator exceeds 1 MVA) may receive a heat
premium on top of the basic feed-in premium of € 50 per MWh.
In addition, a state grant called “energy aid” is available for investments in biogas
facilities as well as related research projects. “Energy aid” targets projects promoting
the use or production of renewable energy, advance energy efficiency and reduce the
environmental effects caused by energy production and use. Projects including
innovative energy generating technologies are eligible for an aid against a fixed asset
investment with eligible costs exceeding EUR 5 million. The incentive promotes among
others also the generation of electricity or heat from biogas and investments of biogas
upgrading plants and filling stations.
Biogas is exempt from excise duty in all applications, including electricity, heat and
vehicle fuel.
Key drivers for biogas and biomethane developments
The existing support schemes might not have a very substantial effect on the biogas
sector in Finland compared to other renewable technologies, nevertheless they have
helped to promote the use and production of biogas/biomethane.
Energy aid, i.e. investment subsidy, has helped to realize many biogas plants and
upgrading plants. But only 3 biogas plants, representing 20% of electricity production,
received feed-in tariff in 2015. The tax exemption for biofuels that is in place in
Finland can be seen as a good driver for biomethane development, because it
Optimal use of biogas from waste streams
March 2017 I 120
alleviates the financial burden of biomethane operators. But since 2011 biogas
vehicles have been subjected to an additional annual vehicle tax, of which gasoline
vehicles are exempt.
Key barriers to biogas & biomethane growth
Inadequate support instrument. The RES in the national primary energy
consumption is high in Finland. However, almost all of it is covered by the logging
waste and old hydropower that are highly competitive even without any financial
support from the state. The rest is mainly covered by the blending of liquid biofuels
(gasoline and diesel) as required by the mandatory blending scheme. So far, diverse
support instruments used have been inadequate to get any other renewable energy
technology to play a significant role in Finland. However, even more important than
the lack of support for renewables, are the support schemes for fossil fuels.
Another major issue is the failure to address biogas-related issues adequately in
municipal policies. This can be seen as the most important barrier for a successful
development of the biogas sector in Finland. Without addressing the role of local
administrations (both municipal and provincial), the development of the sector will
remain hindered.
Finally, existing policies fail to simultaneously address the multiple benefits of
biogas. Biogas technology simultaneously addresses several core issues: waste
management, health and public transport; recycling of digestate as fertilizer and
production of energy in electricity, heating and transport sectors. To maximise the
resource-efficiency, all of them should be addressed simultaneously in policies, but
this is not the case. For example, one target of the Finnish National Renewable Energy
Action Plan is to end utilization of biogas for transportation and to concentrate mainly
on the use of biogas in heating. However, biogas utilization has been growing the
most in the transport sector.
Key policy amendments planned
The main amendment currently in progress concerns the establishment of a new
support scheme for the renewable energy sector. The keyword in the new scheme will
be “technology-neutral”, meaning that no technology should be in a better position
than others in receiving subsidies. The Ministry of Employment and Economy has put
together a working group that will present its proposals by the end of April 2016.
However, these changes in the support scheme will not have a strong impact on the
biogas sector.
In November 2016, a national plan to implement the Directive on Clean Transport
Infrastructure (2014/94/EU) will be released. It will contain support schemes for
methane, hydrogen and electricity in the transport sector. This will also have a
positive effect on biogas utilization in the transport sector. Finland is also working on a
new energy and climate strategy. It is, however, hard to say what kind of impacts this
document will have on the biogas and biomethane sector, since the new strategy is
scheduled to be completed at the end of this year.

Optimal use of biogas from waste streams
March 2017 I 121
Appendix A.10 France
Current production and consumption of biogas and biomethane
Most of the biogas produced in France is produced through anaerobic digestion, where
the biogas is used in CHP plants. In 2014, there were 502 biogas plants in the
country, with a total installed capacity of 293 MW, producing approximately 1,500
GWh electricity and 1,600 GWh heat. As far as the feedstock is concerned, small
biogas plants tend to use more livestock manure, whereas large biogas plants rather
use organic waste. The annual production of biomethane amounted to 300 GWh by
the end of 2015, among which 160 GWh were injected into the network. In October
2016, there were 24 sites injecting biomethane into the network. As stipulated in the
energy transition law (law n°2015-992), 10% of all natural gas consumption shall be
replaced by biomethane by 2030.
In the transport sector, the best way to currently upgrade biomethane for use as a
fuel is by compressing it into BioCNG. Upgrading biogas to biomethane and then to
bio-LNG is still experimental. There is currently one pilot plant called BioGNVAL, which
produces and distributes liquified biomethane from a waste water treatment plant in
the Val-de-Marne Region. This technology is aimed at long-distance heavy goods
vehicles rather than for local fleets. Certain service stations, such as in Morsbach,
already offer blended BioNGV and NGV or even 100% BioNGV.
Biogas and biomethane supporting schemes
The Act on Energy Transition for green growth from 17 August 2015 foresees a
thorough reshaping of the existing support scheme for electricity from RES.
According to this reform, the new support system for RES in France shall be composed
of two main schemes: a feed-in tariff (“obligation d’achat”), and a premium tariff
(“complément de remuneration”).
On 29 May 2016, an implementation decree was published setting out the
technologies eligible to the feed-in tariff and to the premium tariff. According to this
decree, biogas plants producing electricity may be supported either through a
premium tariff or through a feed-in tariff, depending on the plant size and location.
Biogas plants with an installed capacity under 500 kWe located in metropolitan France
as well as biogas plants with an installed capacity under 12 MWe located outside
metropolitan France are eligible to benefit from the feed-in tariff. Biogas plants with an
installed capacity between 500 kWe and 12 MWe located in metropolitan France are
eligible to the premium tariff. However, pending the publication of bylaws determining
the amount of support per technology, the current conditions for the feed-in tariff for
biogas plants still apply.
Moreover, the purchase price of electricity produced by existing biogas cogeneration
plants was revaluated in October 2015, in order to improve their profitability. This
measure is mainly destined to support farmers in view of their operating and financial
difficulties with biogas plants.
In addition, the support for biogas plants with an electric capacity over 500 kWe is
allocated through a tender scheme allowing for a financial compensation guaranteed
over 15 years. In this regard, a call for tenders was published in February 2016 for
biogas plants, for a total capacity of 10 MWe.
For the heating sector, a Heat Fund (Fonds Chaleur) administered by the French
Energy Agency (ADEME) is in place to support the production of heat through
renewable energy plants. This fund was endowed with a budget of € 220 million for
2014, allocated through two subvention types: on the one hand a national call for
tenders, which is published yearly only for large biomass plants, on the other hand the
support of local RES projects including biogas.
Optimal use of biogas from waste streams
March 2017 I 122
Moreover, a feed-in tariff is in place for the injection of biomethane into the gas grid.
The tariff varies between € 45 and € 95/MWh depending on the type of feedstock used
and the maximum capacity of the installation. Moreover, producers may benefit from
premiums depending on the type of feedstock used for their biomethane production.
These measures currently span a period of 15 years.
Regarding the transport sector, there is currently no support scheme directly
supporting the use of biomethane as a biofuel in France. However, there are numerous
initiatives at regional level, which successfully encourage the use of biomethane in the
transport sector. For example, the ADEME Rhônes-Alpes and the gas distribution
operator GRDF jointly supported 50% to 70% of the additional costs induced by the
purchase of 15 NGVs in the region. In 2014, GRDF also partnered with the city of
Paris, the French Post and the Ile de France Region to develop alternative mobility
concepts to diesel vehicles. The partnership consisted among others in equipping the
vehicle fleets of Paris and the Post Offices with NVG and installing CNG fuelling
stations across the region.
Key drivers for biogas and biomethane developments
Currently, some regions in France still suffer from a poor electricity supply resulting
from an imbalance between electricity production and consumption. As those regions
often have a strong agricultural profile and their farmers are facing economic
difficulties, the deployment of biogas and biomethane plants in such regions
represents a good opportunity for ensuring both a better electricity supply and
additional revenues for farmers. It also allows a local production in line with the
ambition of creating a truly circular economy, and enables a re-qualification of soils
that could otherwise be mismanaged.
Moreover, the national climate ambitions enshrined in the energy transition law which
states an objective of 10% renewable gas in the network by 2030, and the binding
targets for greenhouse gas reductions at EU level also constitute important drivers for
the development of biomethane.
Finally, experts estimated that a total amount of 16,000 direct and indirect jobs could
be created in the biogas and biomethane sector by 2020. In view of the high
unemployment rate France is currently facing, these figures represent a significant
driver for the French government.
Key barriers to biogas & biomethane growth
There is a general lack of knowledge about biogas and biomethane
technologies among financial stakeholders. As a result, the granting of loans is
conditioned to high guarantee requirements of banks, which makes it very difficult for
biogas project developers to obtain financing.
Lack of public acceptance. Biogas projects which are subject to authorisation by the
regional prefect shall first undergo a public inquiry. In several cases, public inquiries
issued a negative opinion, which prevented the projects from obtaining their building
authorisation. Such negative opinions are often based on fears and received ideas
regarding odour nuisance or explosion risks of biogas plants.
Lack of support schemes for the direct liquification or compression of
biomethane. Biomethane used as a biofuel may be either liquified/compressed, or it
may be first injected into the gas grid in order to supply fueling stations connected to
the grid. Since only the injection into the gas grid benefits from a support in the form
of a FIT, most producers prefer their biomethane to be injected into the grid.

Optimal use of biogas from waste streams
March 2017 I 123
Biomethane plants located too far from the gas grid. Around 40% of the
applying biomethane projects do not benefit from feed-in tariff for technical reasons,
mostly because the production plants are too far from the gas grid. Transporting
biomethane by trucks over short distances may be an option for certain sites.
Key policy amendments planned
In France, the legal framework for biogas plants is sufficiently developed to enable
their deployment. However, the current legislation regarding the agricultural use of
digestate as a fertilizer is not enough elaborated. Regulatory changes shall be made in
the near future to clarify the legal value of digestate, namely to recognize it as a
valuable fertilizer instead of waste. This work is crucial to ensure that the whole
production of anaerobic digestion is taken into account and valued for its true
potential. In this regard, a decree of 4 June 2015 provides for an end-of-waste status
for materials which either benefit from marketing authorization, or comply with the
technical specifications defined by the Ministry of Agriculture. However, the bylaw
defining these technical specifications has not been published yet.
Appendix A.11 Germany
Current production and consumption of biogas and biomethane
By the end of 2015, 8,928 biogas plants were installed in Germany. 190 of them have
the capacity of upgrading the biogas to biomethane. The total capacity of biogas
plants amounts to 4,177 MWel. In 2015, about 200 new biogas plants were developed,
which is a considerable decrease of new installations in comparison to the years 2009-
2011 when over 1000 new plants were erected yearly. In 2014, the 185 biomethane
plants have produced a volume of 688 million Nm3 injected biomethane, the
equivalent of 7,489 million kWh. These numbers increased by 37% in comparison to
2013.
The main feedstock used is energy crops (51%), followed by agricultural residue
streams (46%), biowaste (2%) and industrial waste (1%). The main used energy crop
is maize in form of silage, followed by cereals (grains and whole plants), and grass.
From the 1.5 million ha agricultural land, on which feedstock for the production of
biogas is grown on (approx. 10% of the overall German agricultural area), 1 million ha
is dedicated to maize. This has fuelled a vivid public debate and a public protest has
emerged against the rising use of maize and further food crops for energy production.
Biogas and biomethane supporting schemes
The utilization of biogas and biomethane is particularly supported in the electricity
sector which was the key driver for development of biogas installations in recent
years. The main support schemes, which are laid down in the Renewable Energy
Sources Act 2014 (EEG), are Feed-in tariff for systems with a capacity of up to 100 kW
and a premium tariff (Market Premium) for systems with a capacity of up to 20 MW.
Until 2011, the old feed-in tariff scheme was the main reason for the robust
development. Following changes of the structure of the tariff, however, led to the
strong decrease of new installations. In addition to that support scheme, there are
first experiences to reimburse electricity producers not for the production of electricity
but for the provision of on-demand capacities (flexibility surcharge). Other support
schemes are a loan program and a tax instrument.
In the heating sector, the main support scheme for biogas is a building obligation
under the Renewable Energies Heat Act (Erneuerbare-Energien-Wärmegesetz -
EEWärmeG): house owners have to use a particular share of energy for heating and
cooling from renewable energy sources when constructing a new building or
renovating an existing one. The installation of CHP biogas heating systems is only one
Optimal use of biogas from waste streams
March 2017 I 124
of many options to fulfil this obligation and the obligation is not applicable to existing
buildings.
The main instrument in the transport sector is a GHG quota that also covers the
usage of biogas/biomethane, aside from other technologies and resources. The same
holds true for the KfW Environmental Programme, a loan system that applies to the
purchase of low-emissions cars that are powered by biogas/biomethane.
Key drivers for biogas and biomethane developments
The most efficient policy for the support and promotion of biogas and biomethane in
the electricity sector by far is the EEG, even though the support tariffs have been
gradually reduced in 2012 and 2014 and compared to the flourishing conditions of
2009 are not so attractive anymore.
Most relevant policy in the heating sector is the EEWärmeG. This regulation,
however, concerns only biogas with CHP installations and applies only for new
buildings or structural renovations. Therefore, its impact is difficult to assess.
The share of biogas/biomethane is almost insignificant for the transport sector
because the existing support schemes do not function as effective drivers. There is no
incentive to feed in biomethane into the natural gas grid. Since 1 January 2016 there
is no tax exemption for biomethane anymore. By far the biggest incentive for bio-
methane in the transportation sector is the GHG quota system.
Key barriers to biogas & biomethane growth
Weak(-ened) political and economic framework. The main barrier to the further
development of biogas in all three sectors (electricity, heat and transport) are the lack
of support schemes that sufficiently promote the extended usage of biogas. Regarding
the electricity sector, the reforms of the EEG in 2012 and 2014 drastically reduced the
tariffs and introduced a cap of 100 MW/year. The same applies for the heating sector
to the EEWärmeG and for the transport sector to the GHG quota which both have
limited impact on biogas deployment.
Lack of grid access. The German biogas sector suffers from the difficulty to be
connected to the existing energy infrastructure. Biogas plants are mainly located in
the rural area; in some remote areas the infrastructure is underdeveloped making a
connection to the grid harder. The current support scheme structure does not
incentivize the upgrading of biogas to biomethane and to feed biomethane into the
natural gas grid. In case of biogas upgrading plants, when connection to the natural
gas grid is up to 1 km 75% of the connection cost are borne by the grid operators and
the remaining 25% by the connectee (however no more than € 250,000).
Insufficient market structure. The third main set of barriers is connected to the
structure of the biogas market in Germany. The development of feedstock prices is
unpredictable and there are no sufficient regulatory provisions to mitigate this risk.
The demand for biomethane especially as a fuel is very low. Stakeholders also
mention that the connection of biogas heating units to local district heating networks
is very difficult and too complex for most local authorities.
Lack of public support. Another barrier to the further development of biogas is its
ambiguous reputation in the German society. The acceptance of biogas has decreased
in the past years due to the fear of rising crop prices and land use change.
Optimal use of biogas from waste streams
March 2017 I 125
Key policy amendments planned
A new amendment of the EEG is planned to be published by the end of 2016,
becoming effective as of 2017. According to the current plan, the support system is
being transformed. In the future the level of the feed-in/market premium tariffs will be
decided through an auctioning system. In particular operators of existing plants favour
the introduction of an auctioning system because they hope for an increase of tariffs.
Furthermore, an amendment to the EEWärmeG is also expected during this legislative
period; the plan is to restructure and expand this law. However, further details are still
pending.
Appendix A.12 Greece
Current production and consumption of biogas and biomethane
The total number of biogas plants in Greece in 2015 was 18. More specifically, 3 plants
are operating at municipal waste landfills, 9 plants at municipal wastewater treatment
facilities, 4 plants produce biogas from agricultural wastes, while there are 2 plants in
food industries that produced only heat. Total installed capacity amounted to 52MWe
and to almost 30MWe thermal capacity, amounting biogas production to 168 million
m3/year in 2015. The Regulatory Authority on Energy has issued 83 production
licences for biogas plants above 1 MW (cumulative capacity 441.4 MW). Apart from
that, in relation to grid connection, the Hellenic Distribution Network Operator
(HEDNO) has already given priority to 127 applications (cumulative capacity 132 MW),
while 21 plants (cumulative capacity 33 MW) have already signed a connection offer.
There is currently no biomethane production in Greece.
Biogas and biomethane supporting schemes
In the electricity sector, Greece introduced a coherent legislative framework for the
development and implementation of renewable electricity projects in 2006. Four years
later Law No. 3851/2010 transposed the majority of the provisions of the RED
(2009/28/EC) into the Greek law and reaffirmed the Feed-in Tariff system as the basic
support mechanism for the further development of RES in Greece. However, the tariff
rates were reduced in 2014 as a result of liquidity problems of the financing
mechanism managed by the Greek Electricity Market Operator (LAGIE). Biogas plants
are basically promoted though the Feed-in Tariff scheme.
Furthermore, as far as the issue of production license, connection offer and approval
of the Environmental Impact Assessment (EIA) is concerned, biogas/biomass plants
that are managed by the solid waste management agencies have a priority over the
RES plants that are managed by the land reclamation organisations.
In the heating sector, support for biogas plants may be provided under the
provisions of the Investment Law (General Investment Plans). The law distinguishes
between the following types of general investment plans: (1) General
Entrepreneurship, (2) Technological Development and (3) Regional Convergence
plans. RES projects are eligible for funding if they fall under one of these categories.
There are three different subsidy types available: income tax relief, subsidised
expenditure and leasing subsidy.
Optimal use of biogas from waste streams
March 2017 I 126
Key drivers for biogas and biomethane developments
One of the key and most crucial drivers for the deployment of biogas in Greece is the
fact that it is considered a new market. In contrast with other RES technologies,
biogas is a fairly new technology in Greece. It should be noted that during the “boom”
of the RES market in 2010-2013, biogas was expected to take the lead from the PV
sector. However, after the reform of the Feed-in Tariff scheme in 2014 (“New Deal on
RES”), those projections were minimised. As Greece is currently introducing a new
support scheme for RES in the electricity sector that is going to substitute the existing
Feed-In Tariff with a sliding Feed-In Premium, it remains to be seen if with the new
support scheme biogas will be further deployed. A positive sign is that the revised
support scheme for RES that foresees a Feed- In Premium for all RES technologies
provides the same level of support to biogas plants as within the Feed-in Tariff
scheme.
Key barriers to biogas & biomethane growth
As far as the electricity sector is concerned, the main barrier for the deployment of
biogas in Greece is the lack of a relevant support scheme in the heating sector.
In contrast to the electricity sector, biogas in heating sector lacks the necessary
incentives for its further deployment.
Lack of an efficient and reliable supply chain. This is the main problem that
plagues the biogas sector in Greece. More specifically, feedstock as the primary input
for biogas production is located in numerous places. However, their location is
fragmented and in most of the cases almost unknown. Small animal farms are
situated in places that are difficult to locate. In addition, the morphology of the
country (many mountainous areas) renders the identification and location of feedstock
sources almost impossible. Possible feedstock is always identified locally and regionally
only after a potential investor expresses his interest to proceed with an investment for
that kind of technology.
Lack of reliable information sources. This is a barrier that is directly correlated
with the previous barrier. There are more than 100 Secretariats in charge of collecting
data on available feedstock. Those different Secretariats do not cooperate and they
are reluctant to exchange this data. Consequently, information remains fragmented,
even on similar organic residue streams. This obstructs a comprehensive and holistic
evaluation of the feedstock potential in the country, let alone their identification.
Lack of expertise. Another barrier that hinders the quality of information sources is
the personnel at the respective Ministries and Secretariats. The majority of them do
not have the necessary academic background so as to evaluate the quality of the
information provided and process the information accordingly. The same is applicable
also to the personnel of the administrative regions that are responsible for the
authorisation of the construction of the installation and electricity production. Biogas
plants are regarded just like another RES source, without considering additional
environmental advantages that this technology brings.
Key policy amendments planned
Radical changes concerning the support for biogas/biomethane are expected to take
place in Greece. Firstly, Greece is obliged to introduce a new support scheme for RES
in the electricity sector. This new support scheme should be in line with the ‘Guidelines
on State aid for environmental protection and energy 2014-2020’. A first draft of the
revised support scheme was open for public consultation until 14 March 2016. It
foresees the introduction of a Feed-in Premium scheme, as far as renewable electricity
is concerned. Secondly, the new investment law that will be approved in June 2016
foresees support for the development of biogas in the electricity and heating sector.
The new investment law foresees a “bundle” of different support mechanisms that
Optimal use of biogas from waste streams
March 2017 I 127
could be used alternatively such as income tax relief, subsidised expenditure, leasing
subsidy, stabilisation of income tax coefficient or the subsidy of investment risk. In
addition, a working group on biomass has been recently established by the Ministry of
the Environment and Energy that is responsible for drafting a bill concerning solely
provision concerning the deployment of biomass in Greece.
Appendix A.13 Hungary
Current production and consumption of biogas and biomethane
In Hungary, biogas is deployed in around 70 plants in total. Half of the plants operate
within the agricultural sector with a capacity of 30 MWel, followed by the landfill sector
(20 plants) and the sewage sector (13 plants). The outstanding technologies used are
anaerobic digestion (mesophilic and thermophilic) and sludge dewatering. The overall
capacity amounts up to approx. 40 MW as of 2015. It is not expected that Hungary
will reach the target of 100 MW installed capacity set in the National Renewable
Energy Action Plan 2010-2020. However, higher capacities would be available to
strengthen the biogas sector, especially in the field of waste from food processing with
an estimated potential capacity of 25 MWel, which is unused.
Taking all the currently available sources for biogas in Hungary into consideration,
there is an annual potential production level of 121-177 million m³ for biomethane.
This amounts to 1.1-1.6% of the Hungarian natural gas consumption. However, the
biomethane sector is considered a niche segment in the field of renewable energy in
Hungary. It received no support recently and has barely any market, with less than
5% of the total estimated capacity for biomethane utilised. In 2015, only two
upgraded biomethane plants were operating throughout the country.
Biogas and biomethane supporting schemes
In the electricity sector, biogas with the installed capacity greater than 50 kW is
eligible for the feed-in tariff. The eligibility period and the maximum amount of eligible
electricity are determined for each eligible electricity producer by the Hungarian
Energy and Public Utility Regulatory Authority (HEA). For biogas (<5 MW) and landfill
gas, there are benchmark feed-in periods which can be shortened if other investment
schemes are used for the individual project. There are three different tariff rates
depending on the time of the day. These time periods are defined by law, depend on
the area the electricity is generated in and vary for weekdays and weekends/holidays
as well as for summer and wintertime. The tariff level also depends on a plant's
installed capacity and the generation technology employed. It is to be noted that the
Hungarian feed-in tariff with an average amount of 99.5 €/MWh (in Germany: approx.
237.3 €/MWh) is the lowest in the EU.
A number of programmes under the main ‘Széchenyi Plan 2020’ may provide non-
repayable financial means (subsidies) for the electricity or heat generation from
biogas. To mention here are such programmes like the Environment and Energy
Efficiency Operational Programme (EEEOP) or the Rural Development Programme
(RDP). Both can provide subsidies through tenders to foster biogas deployment for
electricity or heat generation.
In addition, within several sub-programmes of the EEEOP and the Economic
Development and Investment Operational Programme (EDIOP) favourable loans are
provided for the deployment of renewable energy sources, also for biogas both in the
electricity and heating sector.
Theoretically, biogas/biomethane is eligible under the obligatory biofuel quota
obligation of 4.9% in the transport sector. However, the biogas/biomethane
deployment is given little importance in Hungary. The NREAP of 2010 for example

Optimal use of biogas from waste streams
March 2017 I 128
prescribes only a share of 0.9% for biogas of all the renewable sources used in that
segment.
Key drivers for biogas and biomethane developments
No drivers have been communicated by the industry with regards to the biogas
deployment in Hungary. This is due to the lack of political will which is experienced by
the actors on the free market.
Key barriers to biogas & biomethane growth
Concerning the electricity sector, the feed-in tariff scheme is associated with a
high administrative burden and disadvantages for the plant operators in
Hungary. Inter alia, there is an obligation for the producer to hand in an extensive
prognosis of the plant’s electricity generation and penalties have to be paid if it is
missed. Furthermore, there is no defined cap of feed-in quantities and the eligibility
period for the feed-in tariff is calculated on the individual basis. This might lead to the
uncertainty with regards to the investment planning. In general, the Feed-in Tariff
scheme sets not enough incentives to invest into the installation of biogas plants.
Moreover, investments in CHP are not supported in Hungary. The heat, which
results during the electricity generation process in biogas plants, remains mainly
unused due to a lack of financial incentives to invest into the efficient use of heat
energy. Further, the investment cost for biogas upgrading to produce
biomethane is too high for the plant operators. For the support under financial
mechanisms other than the Feed-in Tariff, only new projects are eligible.
The lack of political support also negatively affects the biomethane sector which is
underdeveloped in Hungary. The use of biomethane is allowed but not supported and
the administrative burden is high. As of 2016, approx. 24-25 permits are required for
the construction and operation of a plant. However, there are ongoing negotiations
between interest groups and the relevant authorities. Since the Hungarian gas
distribution system is well developed and provides a good basis to feed-in biomethane,
the government might incentivise investments for upgrading of biogas in the future.
Key policy amendments planned
The implementation of the new mandatory renewable and alternative energy
purchasing scheme (METÁR) was already planned for 2011. It is meant to replace the
current feed-in tariff scheme. The new scheme should foster the greater deployment
of renewable heat in Hungary, focusing on appealing tariffs for that sector and taking
the waste disposal costs for the biogas plant operators into consideration. In general,
support should only be granted through tendering procedures in the future. However,
the long lasting discussions about the introduction of the new scheme have led to
investment uncertainty in the entire renewable energy sector in Hungary.
Furthermore, it remains unclear, who will bear the costs for the new system, since
reduction of household energy bills is still one of the main priorities of the Hungarian
government.
Appendix A.14 Ireland
Current production and consumption of biogas and biomethane
The total number of biogas plants in the Republic of Ireland in 2014 was 31. More
specifically, there are 3 agricultural, 14 sewage plant facilities and 7 industrial landfills
(18.4 MW) and 7 waste/industrial waste biogas plants. Their cumulative capacity
amounted to 47 MW, generating 206 GWh of electricity in 2014, while 8.1 ktoe of
thermal energy were generated respectively.
There is currently no biomethane production in the Republic of Ireland.
Optimal use of biogas from waste streams
March 2017 I 129
Biogas and biomethane supporting schemes
In Ireland, biogas in electricity sector is mainly promoted through a Feed-in Tariff
scheme (Renewable Energy Feed-In Tariff - REFIT). More specifically, landfill gas is
eligible under REFIT 2 and anaerobic digestion is eligible under REFIT 3. It should be
noted that REFIT 2 and 3 has closed to new applications on 31 December 2015.
In addition, there is a grant scheme with a focus on the cultivation of willow as energy
crop in place. The scheme is issued yearly and the aid consists of a once off capital
grant based on a percentage of approved establishment costs. Grant is available for
up to 40% of approved costs but not exceeding a maximum of € 1,040 per hectare.
The minimum allowable area per applicant eligible for the establishment grant is
3 hectares and the maximum allowable area is 50 hectares.
There are currently no support schemes for biogas/biomethane in heating and
transport sectors in Ireland.
Key drivers for biogas and biomethane developments
There is a number of drivers that might lead to a steady and constant increase of the
biogas/biomethane sector in Ireland. Primarily, there is an adequate, reliable and
sufficient feedstock supply that could be used as a primary output for the production
of biogas in the country. Currently, due to a lack of biogas processing plants, almost
60% of the available feedstock is exported to the United Kingdom and Northern
Ireland. A further factor that is mainly related to the promotion of biomethane, is the
demand from the side of the costumers for the “green gas”. Such demand may prove
decisive for the deployment of biomethane in Ireland, as there are prospects for its
promotion. A Renewable Heat Incentive (RHI) has been consulted on and is in
development with the expectation it will be implemented in 2017.
Key barriers to biogas & biomethane growth
Concerning the electricity and heating sector, there has been no recognition of
additional carbon benefits of biogas/biomethane by the authorities in charge,
particularly with regard to the agriculture sector which is responsible for circa 33% of
Ireland’s emissions. The full potential of both technologies is not fully recognised
in the Republic of Ireland. Such technologies bring about spillover effects, as they do
not only produce clean energy but also have additional positive effects, such as
reduction of GHGs and waste output. Nevertheless, those additional positive effects of
those technologies are not properly recognised by the respective public administration
authorities.
As far as the electricity sector is concerned the main barrier for the deployment of
biogas is the limited capacity for anaerobic digestion CHP within the REFIT 3
support scheme and the insufficient subsidy for non-gate fee feedstock for
biogas production. Other renewable electricity technologies such as onshore wind
can be developed for a lower subsidy than anaerobic digestion CHP but these cannot
effectively address the heat and transport sectors, whereas biomethane can be
injected into the natural gas network decarbonising the heat sector and in time the
transport sector through CNG vehicles. Biogas technologies were supported through a
Feed-in Tariff (REFIT3) until the end of 2015. Currently, a public consultation on the
new support scheme is pending and is expected in 2017. It is envisaged that the new
electricity support scheme could support a biomethane CHP located and a natural gas
end-user site remote from the biogas production facility. The CHP Directive is
transposed to Irish Law and the requirements for high efficiency CHP render the
certification of biomass CHP facilities extremely difficult as those requirements are
mainly applicable to CHP from natural gas.
Optimal use of biogas from waste streams
March 2017 I 130
The heating sector is confronted with an even larger barrier, i.e. the lack of a
relevant support scheme. Despite the fact that a support scheme for the promotion
of biogas was foreseen as early as 2014, such a scheme is not yet introduced. Public
consultation on the introduction of the Renewable Heat Incentive (RHI) was initiated in
2015. Although the consultation process was accelerated, the RHI could not be
introduced at the beginning of 2016, as it was planned and is now due in 2017.
Key policy amendments planned
Two crucial policy developments are expected to take place in 2017. The first one
relates to the introduction of the RHI. Ireland’s Draft Bioenergy Plan from 2014
foresaw the introduction of the RHI with the aim of boosting renewable energy
sources, covering also biogas, in the heating sector. The Department of
Communications, Climate Action and Environment (DCCAE) carried out an initial
consultation in September 2015 so it is likely that the RHI will be introduced in 2017.
However, the RHI is not yet in place. Apart from that, the existing support scheme for
renewable electricity is expected to be revised. For that reason, it is likely that a public
consultation on a new renewable electricity scheme will be launched in 2017.
Appendix A.15 Italy
Current production and consumption of biogas and biomethane
Italy is ranked very high in the EU in terms of the production of biogas. The intensive
and large livestock and agriculture production in the north of Italy has contributed to a
great extent to the deployment of biogas. Agro-industrial biogas dominates the biogas
energy output. In 2013, there were about 410.8 ktoe of landfill biogas, 48.5 ktoe of
sewage sludge biogas and 1,356.1 ktoe of biogas produced in decentralised
agricultural plants, municipal solid waste methanisation and centralised co-digestion
plants.
Biogas and biomethane supporting schemes
In the electricity sector, biogas is mainly supported through a Feed-in Tariff, the so-
called Tariffa onnicomprensiva, and a Premium Tariff schemes. The Feed-in Tariff
supports small-scale biogas plants with an installed capacity between 1 kW and 1 MW,
which are entitled to choose between the feed-in tariff and the premium tariff. Biogas
plants with an installed capacity between 1 MW and 5 MW (and those with a capacity
below 1 MW not opting for the feed-in tariff) are supported by the premium tariff. The
premium tariff is calculated from the difference between the basic feed-in tariff and
the hourly zonal electricity price. On top of the basic feed-in tariff, bonuses may be
granted to the plant. The digression rate for the basic feed-in tariff from 2014 onwards
is set at 2%.
Under the Feed-in Tariff and Premium Tariff schemes, biogas plants with a capacity up
to 100 kW can access the incentives directly, while plants with a capacity between 100
kW and 1 MW have to be listed in a register first. For biogas plants with a capacity
above 5 MW, the described premium tariff is granted through a tendering process. The
incentives range between € 85 and € 122 per MWh and are granted for 20 years.
It has to be noted that since 1 January 2016 the feed-in tariff and premium tariff
regulation for biogas in the electricity sector is not in place anymore, and currently
Italy is waiting for a new law on renewable energy sources.
In 2015, the Energy Regulatory Authority approved two incentive schemes for
biomethane – Premium Tariff for biomethane injection into the grid and Certificates of
Release for Consumption of Biofuels (CIC) for biomethane for vehicles (the value of
the certificate has still to be issued). The premium tariff for biomethane is calculated
based on the amount of biomethane injected into the grid and equals the difference

Optimal use of biogas from waste streams
March 2017 I 131
between twice the annual average price of natural gas and the average monthly price
of natural gas, in every month that biomethane is injected into the grid. The tariff is
granted for 20 years. Biomethane use to produce electricity and heating in co-
generation is also encouraged under the Premium Tariff scheme. It has to be noted
that since 2013 it is already allowed to inject biomethane in natural gas transmission
and distribution grids, as well as in methane distribution plants for natural gas
vehicles. However, in practice it is still not possible to use biomethane for the injection
into the gas grid and for natural gas vehicles, as the technical rules have not yet been
issued. They are expected in 2016.
Key drivers for biogas and biomethane developments
The biogas development in Italy started with the approval of a national regulatory
framework on the use of the digestate in the agriculture. The framework went beyond
regional differences and confirmed the importance of the anaerobic digestion in the
national agricultural sector. The use of digestate in agriculture allows companies to
produce food, energy and biofuels as well as to give back important fertilizer value to
the land. Still, the most significant driving force to promote biogas was the first Feed-
in Tariff scheme that was launched in 2008 and expired in 2012. In fact, most of the
biogas plants in Italy were installed in 2008-2012 and since then the number of new
biogas plants installed decreased, as a result of the reduction of the feed-in tariffs.
Regarding biomethane, the possibility to inject biomethane into the natural gas grids,
as well as in methane distribution plants for natural gas vehicles was initiated by the
Fiat Chrysler Automobiles group that urged the government to promote the use of
biomethane for cars and reduce natural gas imports.
Key barriers to biogas & biomethane growth
Lack of biomethane technical rules. In practice, the possibility to feed in biogas
into the natural gas grids is still not operational. Although since 2013 biomethane
producers are allowed to inject biomethane in natural gas transmission and
distribution grids, as well as in methane distribution plants for natural gas vehicles and
in 2015 a support scheme for the biomethane injected into the grid was approved, the
technical rules have not yet been issued. Technical rules and conditions for the
injection of biomethane are expected to be issued by the national government in
2016.
Lack of legal framework in the electricity sector. Since 1 January 2016, the feed-
in tariff and premium tariff regulation for biogas is under revision. Therefore, currently
there is no support scheme in place for new biogas plants. However, the decree
launching the new Feed-in Tariff and Premium Tariff is supposed to come in force
anytime this year.
Thermal biogas plants are still not well known by the general public. Thermal biogas
plants are not well known among citizens. In addition, renewable energy installers
have still little information on thermal biogas plants. Thus there is a need for
increasing the general awareness and specific information on the opportunities of
biogas in the heating and cooling sector.
Certification of installers is not yet very developed. Although there are some
certification bodies that have launched their own certification mechanisms, the interest
towards certification of biogas/biomethane installers is still very limited. In fact, the
importance of installers’ certification in the biogas/biomethane sector is not yet
acknowledged.

Optimal use of biogas from waste streams
March 2017 I 132
Key policy amendments planned
Since 1 January 2016, the feed-in tariff and premium tariff regulation is not in place
anymore. For new biogas plants, a new feed-in tariff and premium tariff decree will
come into force this year. It is expected that the tariffs will be very similar to the
previous ones.
In 2016, the technical rules to feed-in biomethane into the natural gas grid should
come into effect. The government expects that after the issue of these rules the
annual biomethane output will increase to 5-8 billion m³. For the coming years, it is
foreseen to use selective membrane separation to upgrade biogas into biomethane.
Appendix A.16 Latvia
Current production and consumption of biogas and biomethane
There were only minor developments in the Latvian biogas sector in the recent years.
In 2014, there were 58 biogas plants across the country with an overall installed
capacity of 54.92 MW and with a total biogas production of 765 GWh. 48 out of the 58
biogas plants were agricultural plants, 1 plant used sewage and 7 plants used landfill
gas as a substrate. In 2014, these plants produced 333,1 GWh electricity; its share in
total electricity production was 5,8%. In the same time, over 165 GWh of heat from
biogas was generated for self-consumption or injection into the district heating
network. Almost 80% of the feedstock used for biogas production in Latvia are energy
crops.
Currently, there is no biomethane production in Latvia.
Biogas and biomethane supporting schemes
In Latvia, biogas generation in electricity sector is stimulated through investment
grants for plant construction and a feed-in tariff, which is acquired through a
mandatory procurement, as set in the Electricity Market Law. Under the latter support
mechanism, the public trader purchase electricity from merchants, which have been
granted the right to sell electricity produced from renewable energy resources within
the scope of mandatory procurement for electricity prices determined in accordance
with the price formulas set in Cabinet Regulations No. 221/2009 and No. 262/2010.
The feed-in tariff for biogas plants is guaranteed for 10, 15 or 20 years. The eligibility
period depends on the installed capacity of the plant.
It is to highlight that currently there is no possibility to receive a feed-in tariff in
Latvia. The Feed-in Tariff scheme is under revision since 2011 due to concerns about
corruption and a lack of transparency in the way it was carried out since 2007. No
mandatory procurements will be organized for feed-in tariffs in Latvia for biogas and
biomass until 2020. A new long-term renewable energy strategy and a new support
scheme for RES is awaited. The latter is not expected earlier than the end of 2018.
No support schemes are currently in place for biogas/biomethane in heating and
transport sectors in Latvia.
Key drivers for biogas and biomethane developments
As there is a high insecurity about the future of the Latvian biogas sector, caused by
the lack of long-term predictability and availability of both financial and legislative
support, it is very hard to identify the drivers for the biogas deployment within the
country.
A potential driver for biogas/biomethane in the near future could be the currently
being drafted regulations on "Requirements for the injection of biogas and gas from
biomass, as well as liquefied natural gas into the natural gas transmission system” and
Optimal use of biogas from waste streams
March 2017 I 133
the possibility to distribute biogas through the natural gas transmission system, if the
requirements will be approved by the government.
Key barriers to biogas & biomethane growth
The key barrier affecting biogas/biomethane in the electricity, heat and transport
sectors is the absence of policy instruments since 2011 as well as a long-term
RES strategy. Lack of a long-term predictability leads to a barely no investments in
renewable energies, also biogas, in Latvia.
In addition, a new tax - Subsidised Energy Tax - was introduced in Latvia as of
January 2014. This tax effectively reduces remuneration for electricity fed into the
electricity grid by renewable electricity producers. The following tax rates are applied:
10% for the electricity produced from renewable energy sources and a reduced tax
rate of 5% for high efficiency CHP units. The Subsidised Energy Tax is a temporary
one and is scheduled to be in place until 2018.
Regarding biomethane the main barriers to its deployment in gas market and
transport sector is the lack of market structure and infrastructure and
technology issues, such as lack of experience in biogas purification and
compression/liquefaction as currently there are no such plants in Latvia.
Key policy amendments planned
According to the Latvian Ministry of Economy, a new support scheme for renewable
energy sources is under discussion. The objective is to create a new support scheme
which will be transparent and understandable for both energy users and producers will
be able to respond to market signals, to reduce costs and avoid over-compensation of
energy producers. More clarity and predictability of the planned support scheme for
energy production from renewable energy sources will give investors a clear long-term
vision. Taking into account that burden of the existing support costs for electricity
consumers rises till 2018; initiation of a new support instrument till the end of 2018 is
not expected.
Finally, a new long-term renewable energy strategy is expected in Latvia.
Appendix A.17 Lithuania
Current production and consumption of biogas and biomethane
The total number of biogas plants in Lithuania in 2013 and 2014 was 21: 1 biogas
plant produced biogas from agricultural wastes, 8 plants from sewage, 9 plants from
landfill gas; the remaining 3 plants included biowaste and industrial waste biogas
plants. The total installed capacity of all these plants in 2014 amounted to 21.1 MWel.
They generated 32.7 GWh of electricity and 26.7 GWh of heat (data for 2013).
At the end of May 2016, the number of biogas plants reached 36. Their installed
thermal capacity amounted to 9,481 MWth and installed electrical capacity to 30,218
MWel.
Currently, there is no biomethane production in Lithuania.
Biogas and biomethane supporting schemes
In the electricity sector, power plants using biomass, biogas derived from anaerobic
digestion or other biodegradable organic waste or substrates and power plants using
landfill gas are supported with a feed-in premium. Power plant operators are eligible
for a flexible bonus - the difference between a guaranteed tariff and the sale price for
electricity generated from biogas or landfill gas. Different procedures are applicable
according to the total installed capacity of a plant. While electricity generated by
plants up to 10 kW is purchased at a guaranteed price set by the National Commission

Optimal use of biogas from waste streams
March 2017 I 134
for Energy Control and Prices (NCC), operators of plants above 10 kW may acquire a
guaranteed tariff by taking part in tenders organised by the NCC. The Law on Energy
from Renewable Sources (RES Law) introduced a cap on feed-in premium payments
for each eligible technology. For biofuel power plants, covering biomass and biogas,
the cap is set at 105 MW until 2020. Currently, this cap is already reached.
Biogas projects (both for electricity and heat generation) are also eligible for subsidies
and loans under the Climate Change Special Programme (if no feed-in premium is
received). For applicants not engaged in economic/commercial activity a subsidy of
max. € 1,450,000 is available and for applicant engaged in economic/commercial
activity max. € 200,000 (max. 80% of eligible project cost). No budget is envisaged
for biogas projects under this programme for 2016. In addition, electricity from biogas
is exempt from the excise duty.
Biogas in the heat sector is promoted through several support schemes. The RES
Law obliges gas system operators to purchase biogas and inject it into the natural gas
system. The biogas produced is purchased at the tariffs set by the NCC. In addition,
operators using biogas are exempt from environmental pollution tax for all emissions
resulting from used liquid biomass. Finally, the National Heat Sector Development
Programme has an objective of additional 43 MW of electric power from biomass
and/or biogas cogeneration plants in district heating systems of Lithuanian cities by
2021.
In the transport sector biogas/biomethane is promoted through an exemption from
environmental pollution tax and an exemption from excise duty. The latter is
applicable only to biogas/biomethane used as a fuel in public transport.
Finally, the Rural Development Programme 2014-2020 supports production of biogas
from agricultural waste and other waste, heat and electricity production in biogas
plants, biomethane production and compression, as well as production of degassed
substrate. Eligible for support are farmers as well as micro and small enterprises
engaged in livestock or poultry operations. Supported installations may not exceed
1 MW.
Key drivers for biogas and biomethane developments
Biogas deployment in Lithuania has mainly been driven by the feed-in premium
(previously feed-in tariff). However, since the 105 MW cap for biofuels has already
been reached, no support for biogas is currently available under this scheme.
In the transport sector, inclusion of biomethane into the currently drafted Renewable
Energy Resources Development Programme for 2016-2020 could drive its deployment
forward. The current draft foresees that in order to achieve the 2020 target of 10% for
the RES-share in the transport sector, biomethane shall account for at least 1%.
Finally, the Ministry of Environment sees a set of measures, which could incentivise
the use of biogas/biomethane in the transport sector, e.g. introduction of a vehicle
taxation based on CO2 emissions, obligation to public institutions to use biomethane in
their means of transport or subsidies for natural gas refuelling stations. According to
the industry, the main driver for biogas and biomethane deployment would be EU
regulation on mandatory use of waste.
Key barriers to biogas & biomethane growth
The key barrier affecting biogas/biomethane in electricity, heat and transport sectors
is lacking long-term national vision for RES. There is no long-term strategic
thinking in the policy-making. So far, Lithuania has no strategy for the development of
renewable energy. According to the industry, a RES strategy should be developed in
order to see how much of country’s energy demand can be covered by local renewable

Optimal use of biogas from waste streams
March 2017 I 135
energy sources and what other energy sources should be used to meet the remaining
energy demand.
In addition, some incentives intended to support biogas/biomethane do not
function (well) in practice. For example, the requirement of the Lithuanian Rural
Development Programme for 2014-2020 that 50% of the electricity generated from
biogas has to be self-consumed makes the receipt of support under this programme
difficult. Lithuanian farms are too small to meet this requirement.
Limitation of biogas/biomethane supply by consumer demand. In Lithuania,
biogas/biomethane producers may connect either to the gas transmission or
distribution network. If a plant is connected to the transmission network, all
biomethane produced is purchased by the gas network operator, however, the
connection to the gas grid is relatively expensive. If a plant is connected to the
distribution grid, the connection is cheaper, however, biomethane supply may exceed
the consumer demand. Thus during the warm season biogas/biomethane production is
economically not viable.
Removal of the excise duty relief for biomethane for vehicles. Excise duty relief
for biomethane used for vehicles, except in public transport, has been removed from
January 2016. There are plans to remove this exemption also for biomethane used in
public transport.
Key policy amendments planned
In Lithuania, the Public Service Obligation (PSO) Fund reimburses feed-in premiums
paid to RES-producers by the energy suppliers. There are government plans to
abandon the PSO system, having regard to the European Commission’s ‘Guidelines on
State aid for environmental protection and energy 2014-2020’. Furthermore, there are
ongoing discussions on the replacement of the Feed-in Premium scheme with financial
support for investments.
Currently, a new Renewable Energy Resources Development Programme for 2016-
2020 is being drafted. The current draft foresees that in order to reach the 10% RES-
share in the transport sector by 2020, biomethane shall account for at least 1%.
However, it is not clear if this provision will remain in the final version of the
Programme.
Finally, there are ongoing discussions on removing the excise duty exemption for
biomethane used as a fuel in public transport.
Appendix A.18 Luxembourg
Current production and consumption of biogas and biomethane
In Luxembourg, biogas was produced in a total number of 30 plants in 2014, whereof
26 facilities were located in the agricultural sector. A total biogas production of 149
GWh was achieved, with a major share of 55.3 GWh of generated electricity and a
minor share of 12.8 GWh of generated heat.
The biomethane sector is emerging, as three plants were producing 26 GWh
biomethane in 2014. Roughly 300 gas driven vehicles are registered in Luxembourg
being fuelled in 7 petrol stations offering CNG.
Biogas and biomethane supporting schemes
In Luxembourg, electricity from biogas is mainly promoted through a feed-in tariff.
The amount of the tariff depends on the size of the plant and amounts currently to €ct
15.3-19.2 per kWh (the lower the nominal capacity of a plant, the higher is the tariff).
It is guaranteed for a period of 15 years starting on the day of the first electricity

Optimal use of biogas from waste streams
March 2017 I 136
export. The tariff for new plants depends on the year of commissioning and is subject
to a yearly degression rate, which is legally defined.
In addition to the feed-in tariff, two subsidies are in place in order to support
companies in the field of environmental protection and the rational use of natural
resources for electricity and heating purposes. The subsidies can be allocated in
form of capital grants or of interest-rate subsidies and may cover up to 40% of the
eligible investment costs.
Key drivers for biogas and biomethane developments
The goal of the Ministry of Economics is to have additional 100 biogas plants in
Luxembourg until 2020. The Biogas Association (Biogas Vereenegung Asbl) and the
“Mouvement Écologique”, an environmental protection agency, who are involved in the
enhanced biogas production in the country for years, can be named as important
drivers of the biogas sector.
Key barriers to biogas & biomethane growth
Too severe requirements for obtaining investment aid. In 2011, the new
Agriculture Act (Loi du 18 avril 2008 concernant le renouvellement du soutien au
développement rural) entered into force, only entitling biogas plants to investment aid
if they meet strict criteria, inter alia on the geographic origin of agro-industrial waste
materials being used for the production of biogas as well as on the length of supply
contracts for biomass. Due to this ministerial decision, the scope of action concerning
the biomass subsidy is substantially limited. The average investment aid for
agricultural biogas plants amounts to approx. 50%. Without this aid, an economically
viable operation of the biogas plants is not possible.
Prices for substrates too high. The rising prices for animal food also let to a sharp
rise of the substrate costs for biogas plant operators during recent years. For systems
in which a specific target has to be achieved in order to meet their heat supply
contracts, an additional acquisition of substrates is unavoidable. On average, the
substrate inputs cause half of the total cost of the biogas operation.
Governmental support too low. The support from the Ministry of Agriculture is
assessed too low. In particular, there is no specific premium for the use of manure. To
this end, the Centrale Paysanne Luxembourgoise calls for a clear commitment of the
Minister to the National Action Plan on Renewable Energy from 2007. The National
Renewable Energy Action Plan generally foresees a significant expansion of the use of
biomass with a potential of 10,000 ha energy crops.
Key policy amendments planned
Currently, no policy amendments influencing the deployment of biogas and
biomethane are planned. However, the Biogas Association has recently published a list
of recommendations on how to improve the enhancement of biogas.
Adjustment of the feed-in tariff rates for biogas. Tariffs between €ct 16.4 and
19.4 per kWh were recommended in order to guarantee an economical and cost-
effective operation both with new and existing biogas plants.
Introduction of a liquid manure bonus. Due to the increased use of agricultural
residues in biogas plants, the production costs increased significantly. Such additional
costs result primarily from the lower energy content of liquid and solid manure.
According to calculations made by the Biogas Association, the share of manure in
biogas plants is approx. 50% (mass fraction). Therefore, the introduction of a liquid
manure bonus between € 30 and 70 per MWh is recommended, depending on the

Optimal use of biogas from waste streams
March 2017 I 137
share of manure and slurry. The bonus shall be paid in addition to the applicable rates
of remuneration.
Appendix A.19 Malta
Current production and consumption of biogas and biomethane
In Malta, all renewable electricity and heat produced from biogas is generated through
anaerobic digestion of the organic part of municipal waste. The renewable energy
production from biogas in Malta in 2012 amounts to 0.7 ktoe.
Biogas and biomethane supporting schemes
Currently and historically, no support measures for the promotion of biogas have been
in place in Malta. Due to a lack of space, the country has no indigenous resource of
fossil fuels and the development of biomass energy crops as a renewable energy
source cannot be considered suitable for Malta given existing technologies and
resource potential. Malta's NREAP does not mention future policies regarding the
deployment of biogas. However, Malta’s 2020 biogas aim is to generate approx. 50
GWh (4ktoe) of renewable electricity and 2 ktoe of renewable heat from biogas.
Biogas is only produced through the treatment of waste at Sant' Antnin Solid Waste
Treatment Plant, which includes the Mechanical Biological Treatment Plants (MBT)
producing biogas through anaerobic digestion of the organic part of municipal waste.
The biogas produced in this facility is used for the generation of electricity by
combustion in a CHP plant, while any excess electricity will be fed into the grid. The
biological treatment plant was put into operation in 2010 and the project was funded
through € 27 million, while € 16.7 million were secured through EU co-funding from
the European Union Cohesion Fund. The CHP plant running on the biogas produced,
generates enough electrical power for 1,400 Maltese households of four persons each,
in addition to the heat required to run the plant.
Key drivers for biogas and biomethane developments
As renewable energy generated from biogas is not considered to contribute essentially
to the renewable energy mix in 2020, no drivers can be named here.
Key barriers to biogas & biomethane growth
The main barrier for biogas development in Malta is the complete lack of drivers such
as additional feedstock and support schemes.
Key policy amendments planned
No further amendments are currently planned.
Appendix A.20 The Netherlands
Current production and consumption of biogas and biomethane
The Netherlands dispose of a total of 252 biogas plants (agriculture: 105; sewage: 82;
landfill: 41; bio waste/industrial waste 24) producing roughly 300 million m³/of biogas
a year. In addition, 25 installations (membrane separation: 11; water scrubbing: 5;
pressure swing absorption: 2; chemical scrubbing: 6; cryogenic separation: 1) are
upgrading biogas to biomethane with a total yearly production of roughly 100 million
m³.
In 2014, the total primary production of biogas amounted to 13,094 TJ. The
transformation output, i.e. the conversion of biogas to another energy carrier such as
electricity or heat, amounted to 8,121 TJ, while 4,973 TJ of biogas were available for
the final energy consumption in the industry (1,056.0 TJ), the agricultural and forestry

Optimal use of biogas from waste streams
March 2017 I 138
sector (2,014.0 TJ) as well as the service sector (1,903.0 TJ). There is currently no
direct use of biogas in the transport sector in the Netherlands. Upgraded biogas in
form of biomethane is fed into the gas grid and used in the transport sector for CNG
vehicles.
The outlook on future developments, based on an estimation of the Green Gas Forum,
of which the Dutch government forms part, indicates that by 2020 around 1.2 billion
m³ or 0.75 billion m³ of natural gas equivalent shall be generated; by 2030, this
number shall rise to 3.7 billion m³ of biogas or 2.2 billion m³ of natural gas equivalent.
Biogas and biomethane supporting schemes
In the Netherlands, the generation of biogas for the electricity and the heating sector
as well as the generation of biomethane is promoted through a premium tariff in form
of the SDE+ scheme (Stimulering Duurzame Energieproductie). The scheme grants a
premium on top of the market price, which shall compensate the difference between
the price of electricity from renewable sources (base amount) and the wholesale price
for electricity from fossil sources (correction value). The premium is thus variable and
annually corrected in dependency to the price developments of fossil energy. The
support of the SDE+ is made available in two rounds with four bidding stages each.
Support is made available on a first-come-first-serve-principle, resulting in conditions,
where applicants at a later bidding stage may risk to be rejected due to a depletion of
funds. Biogas projects may request support at all four support stages of the two
bidding rounds. The overall SDE+ budget for 2016 is € 8 billion, which is an increase
of the support scheme budget of more than 50% in relation to 2015 (€ 3.5 billion).
The maximum budget for auxiliary and co-firing of biomass is € 4 billion.
For biogas and biomethane there are in addition two tax regulations in form of fiscal
subsidies; namely, the EIA Energy Investment Allowance Scheme as well as the VAMIL
Environmental Investment Allowance Scheme. Both schemes allow private companies
to write off investments in biogas plants against their income tax, respectively to
deduct an extra amount from the taxable profit for investments.
Furthermore, the Dutch government introduced the public-private support
programmes Green Deal and Green Gas Foundation to further support the
development of biogas projects, by providing financial support as well as expert advice
throughout the realization phase. In the transport sector, a general quota obligation
applies, not specifically addressing biogas as such. Companies importing or producing
petrol, gas or diesel fuels are obligated to ensure that biofuels make up a defined
percentage of the company’s total annual sales. For 2016, the quota is set to 7%. As
outlined above, there is currently no direct use of biogas in the transport sector;
however, biomethane is used via the general gas grid for CNG vehicles.
Key drivers for biogas and biomethane developments
A driver for the development of biogas and biomethane projects in the Netherlands
may be identified in the public-private support programmes Green Deal and the Green
Gas Foundation. Both programmes aim at supporting entrepreneurs during the
development phase of biogas project, through the provision of expertise and guidance
as well as attractive financing options.
Key barriers to biogas & biomethane growth
A dominant barrier is the reliability of the general RES strategy and the related
support schemes. In the past however, every new cabinet in the Netherlands
introduced its own support scheme and strategy and adapted or stopped previous
ones, resulting in conditions, where a long-term planning concerning the revenue
stream was difficult for investors and developers in renewable technologies.
Optimal use of biogas from waste streams
March 2017 I 139
Furthermore, the focus of the SDE+ scheme on the efficiency criteria is a further
distorting factor. The support approach of the SDE+ scheme focuses and awards
predominantly higher efficiencies of projects. GHG reductions and resource use are no
factors that are considered for the calculation of the subsidy amount. Considering the
first-come-first-serve-principle of the SDE+ scheme, projects with a lower efficiency
might be excluded though they would contribute to a high GHG emission avoidance.
The general access to finance is a dominant barrier for the RES projects in the
Netherlands. Developers of large scale commercial biogas & biomass installations are
confronted with high difficulties to realise financial closures with commercial banks.
Credit institutions remain reluctant to finance renewable projects and show a high risk
aversion towards new technologies and projects. The Dutch government addressed
this barrier by introducing the public-private support programmes mentioned above.
The effectiveness will have to be evaluated throughout the upcoming months.
For biomethane, a barrier is identified regarding the different gas specifications
existing in the different regions. Around Groningen the calorific value is lower than
in the South. Biomethane injectors in the South thus have a disadvantage. Increasing
the calorific value of biomethane is very costly. In the upcoming years the gas in the
distribution grids in the Netherlands will need to shift to high calorific gas due to the
lower production level and eventual depletion of the Groningen gas field.
Key policy amendments planned
In the National Energy Survey (NES) 2015, the Dutch Minister of Economic Affairs
outlined on future development for the RES sector: in regards to biogas/biomethane,
the NES 2015 foresees an amendment regarding a special policy for mono-
fermentation of animal manure. The new policy shall especially address the required
high capital costs of this technology and the fact that currently such a support can
only be acquired in the latest stage of the SDE+ premium tariff, which often is not
available due to the depletion of the overall funds (first come, first serve principle).
The Dutch government is focusing on the digestion of animal manure to address the
very amounts of this feedstock as well as to drive down GHG emissions of this carrier.
The new policy shall enable a public-private innovation programme for the mono-
fermentation of animal manure.
In addition, there are also changes foreseen to the SDE+ application process. The
foreseen amendment shall increase the flexibility of the procedure. To this end, an
extra application around shall be introduced to shorten the waiting period for rejected
projects. Furthermore, a free category will be added to each phase, wherein producers
can apply for a subsidy in tenths of eurocents allowing them to make a more
competitive business case; leading ultimately to a higher efficiency of the SDE+
scheme.
Appendix A.21 Poland
Current production and consumption of biogas and biomethane
In Poland, anaerobic fermentation is the main process used to produce biogas. Biogas
is almost exclusively produced in the heating and electricity sectors. There is
practically no biomethane production. In 2014, there were 277 biogas plants installed
(an increase of about 30%) in comparison to 2013 with an overall capacity of 209.3
MW: 60 biogas plants produced biogas from agricultural wastes, 96 plants from
sewage, 101 plants from landfill gas, and remaining 20 plants included biowaste and
industrial waste biogas plants. Altogether these plants achieved a production of
3,758.4 TJ, most of it being generated electricity.
Optimal use of biogas from waste streams
March 2017 I 140
Biogas and biomethane supporting schemes
The main support scheme for the use of biogas in the electricity sector and in
general is a quota scheme. The quota scheme is technology neutral in the sense that it
does not offer a different amount of certificates depending on what technology has
been used. Each technology is eligible for the same amount of certificates for the
same amount of energy. On 1 July 2016, the quota scheme shall be replaced by an
auctioning system. For small installations with the capacity between 3 kW and 10 kW,
there will be a feed-in tariff. However, this reform is currently implemented by the
new Polish government. The new amendment is not published yet.
Both for the electricity and the heating sector the loan program Priority
Programme RES Stork applies, which provides a credit with a particular low interest
rate. The overall budget of this program amounts to PLN 570 million (approx. EUR 130
million) for the timeframe 2015-2023. The loan is established through the National
Fund for Environmental Protection and Water Management. Another program that is
financed through the very same fund is the Priority Programme Prosumer, which
grants low interest loans together with subsidies to support the purchase and
installation of small and micro-RES-installations for the needs of residential single-
family or multi-family houses in electricity and heating sectors. The overall budget of
this program amounts to PLN 249.8 million (approx. EUR 56.87 million) for subsidies
and PLN 467.2 million (approx. EUR 106.36 million) for loans for the timeframe 2015-
2022.
There is no support scheme for biogas in the transport sector.
According to industry stakeholders, none of the above described policies were very
effective. This is reflected by the gap between biogas objectives and actually
developed biogas installations. The ‘Polish Energy Policy until 2030’, adopted by the
Council of Ministers in 2009, establishes the long-term objectives of the energy policy.
It assumes that there will be on average one biogas plant per community, which
means at least 2,478 biogas plants in the whole country until 2020. Currently, there
are only around 207 biogas plants in Poland.
Key drivers for biogas and biomethane developments
Despite its shortcomings, the main driver for the development of the sector was the
support of biogas in the electricity sector through the quota system. According to the
Council of Ministers, an important driver might be the amount of agricultural waste
and the need to make the agriculture more rentable.
Key barriers to biogas & biomethane growth
Insecure investment conditions. The most predominant barrier is the current legal
insecurity that is created by the amendments of the RES-Act (adopted in February
2015) in December 2015 and probably once again in the coming months. According to
the RES-Act, the installations launched in the first half of 2016 should be covered by
the new support system. However, the amendment postponed the entry into force of
the law. The new government has announced further amendments that currently
remain unknown. As a consequence, biogas investors struggle with a new and
unknown situation.
Grid access issues. Another serious barrier is the tiresome grid connection process
for biogas installations. The legal position of installers is weak, for example the
connection is not sufficiently guaranteed and only the waiting time for the decision on
the conditions of connecting the installation can amount to 150 days.

Optimal use of biogas from waste streams
March 2017 I 141
Lack of public support. In addition, the construction of biogas plants faces a lot of
public protest and lack of acceptance. The main concern of people is how their
everyday life is impacted through the increased usage of biogas, particularly the smell
of biogas.
The legal regulations concerning the use of fermented mass from agricultural
materials and of agricultural origin in fertilising is excessively restrictive. Post-
fermentation mass from agricultural biogas plants is treated equally in terms of legal
approach as the sludge mass and thus it may not be used directly for fertilisation.
After the methane fermentation process, the mass becomes a waste.
Key policy amendments planned
The main announced amendment in the electricity sector is the introduction of the
auction system on 1 July 2016. The subject of the auction will be the amount of
electricity generated from renewable energy sources. Separate auctions will be held
for RES installations with capacities up to and over 1 MW. There will be a feed-in tariff
for small installations with the capacity between 3 kW and 10 kW. Within 15 years
following the beginning of RES energy production, owners of RES installations will be
able to choose between the old quota system and the new auction system. However,
the substitution fee will be set at the level of 2014, i.e. PLN 300.03 (approx. EUR 70)
per 1 MWh. In addition, on 19 February 2016, the Ministry of Energy announced a
thorough amendment of the RES-Act. The regulation will differentiate the support for
energy production for citizen’s own purposes and for energy production as a business
activity. In the first case, the support will consist on refunding of investments. In the
latter, the feed-in tariff is being weighed up. The draft of the amendment has not been
published yet.
Appendix A.22 Portugal
Current production and consumption of biogas and biomethane
Portugal has still a large unexploited biogas potential. There is a total of 65 biogas
(only 51 connected to the electric grid) plants with a total installed capacity of 83 MW,
producing only electricity. This represents a production level of 3,432 TJ by the end of
2014. In Portugal, the most used technology is anaerobic digestion. Gasification for
biogas production is only used in a pilot unit in Tondela and small units for research
purposes. Biogas comes usually from landfills, sewage, industrial and agro-industrial
digesters as well as from the digestion of municipal solid waste. Yet, Portugal could
take advantage of still unexploited sources to produce biogas like residue streams
from forests and certain industrial sectors such as paper and cork producers as well as
dedicated crops.
In Portugal, biomethane has not been developed yet.
Biogas and biomethane supporting schemes
In the electricity sector, biogas has been mainly promoted through a feed-in tariff.
However, the Feed-in Tariff regime ended in 2012 for large scale units, being applied
currently only to the plants with permits issued before this year. For existing biogas
plants, the following indicative average rates are in place:
fermentation of solid municipal waste, sewage sludge from waste water treatment,
waste water and waste from the agricultural as well as food industries: € 115-117
per MWh;
landfill gas plants: € 102-104 per MWh.
The payment for existing biogas installations is for the first 15 years of operation.
Optimal use of biogas from waste streams
March 2017 I 142
A new regime for Small Production Units (UPP) and Self-consumption Units (UPAC)
was approved in 2014 and enacted in 2015. UPPs can have an installed capacity of up
to 250 kW, whereas UPACs can have an installed capacity of more than 1 MW. The
most important changes of 2015 are that UPPs are based on a bidding scheme, while
UPACs are able to have more capacity and are allowed to connect to the national grid.
For biogas UPPs, the feed-in tariff consists of 90% of the reference tariff, as set by
Ordinance 15/2015. The reference tariff for the year 2016 is € 95/MWh, thus the tariff
for biogas UPPs amounts to € 85.5/MWh. In the case of UPACs, they are supposed to
meet individual consumption needs. Nevertheless, UPACs that are connected to the
grid and have a capacity of up to 1 MW can feed their excess of electricity into the
national grid, receiving a remuneration tariff that is 10% less than the market price.
No support schemes for biogas in the heat and transport sectors are in place in
Portugal.
Key drivers for biogas and biomethane developments
The biogas sector is not widespread in Portugal, yet there are some opportunities that
could lead to a greater development of biogas in the future. One of the most
important potential drivers is the national legislation, which transposes EU Directives,
and the National Waste Management Plans (PERSU) I, II and 2020 that promote the
treatment and valorisation of organic wastes. The legal framework governing waste
management has been consolidated over the last few years with systems for
managing certain specific flows of wastes and placing the onus on producers to pursue
targets for energy recovery and other management systems.
In addition, the CO2 emission-based taxes for conventional vehicles under the Reform
of Green Taxation, the establishment of tax incentives in the use of less polluting
vehicles, including natural gas/biomethane, and the existence of national projects for
the production of fuels from biomass represent opportunities for a major deployment
of biogas.
Last but not least, the large unexploited potential in the rural areas of Portugal
represents a potential driver. The deployment of biogas and biomethane in the rural
regions is a good opportunity for the improvement of the energy supply, especially
heating and cooling, as well as make some other revenues for impoverished areas.
Key barriers to biogas & biomethane growth
Uncertainty regarding new support mechanisms. Decree-Law 215-B/2012 has
set a moratorium for all large RES-E projects introduced by Decree-Law 25/2012. New
biogas plants should from now on be paid according to wholesale electricity market
price (MIBEL). Support schemes were therefore extinguished, and can only be
envisaged via a specific power granting tender to be launched by the competent
energy authority. However, an ordinance defining the details of these tenders is still to
be published. This represents a severe barrier, considering the fact that renewable
electricity projects are being pushed into a marginal market in which prices have been
historically so low that makes it impossible to build any power plant under this general
remuneration regime.
Lack of financing worsened by high capital costs. The country risk, due to the
economic and financial crises, induced a lack of capital available to finance renewable
energy projects and when available, implicates high cost.
Lack of effective heating strategy for renewable energy sources. The 2020
target set for renewables in the heating and cooling sector (RES-H&C) in the NREAP is
very low (35.9%). Moreover, the share of renewable energy in the heating mix has
been dropping in the last years. This shows that the RES-H&C sector has been
abandoned lately and this has a negative impact on the development of
Optimal use of biogas from waste streams
March 2017 I 143
biogas/biomethane in the heating sector. The drafting of a RES-H&C Strategy is
necessary to boost the ambition and the deployment of the sector. Moreover, both the
Green Growth Commitment and the Reform of Green Taxation have not proposed
measures for the RES-H&C sector.
Legislative issues related to gas quality standards. Currently, in Portugal
Decree-Law 231/2012 allows the injection of gas from unconventional sources (biogas
and gas from biomass or other gases) in the natural gas grid if quality and safety
standards as well as licencing procedures are guaranteed. However, the standards as
well as the licencing procedures have not yet been published in the Portuguese
legislation, so it is still not possible the injection of biomethane in the natural gas grid,
which is considered an important barrier to the development of the biogas sector in
Portugal.
Key policy amendments planned
There are no planned policies or amendments to support biogas/biomethane
investments by 2020. New regulations and policies are required to stimulate and boost
the sector. In fact, experts agree that the annual volume of gas as a fuel (biogas +
syngas) that could be produced from biomass is estimated at approximately
900 million Nm3. This could be doubled after introducing anaerobic digestion in the
gasification process, thus reaching a production of 1,700 million Nm3/year.
Appendix A.23 Romania
Current production and consumption of biogas and biomethane
Romania’s biogas sector is one of the most underdeveloped ones in Europe. While the
environment for renewable energy sources is quite well established in Romania, with
the target of 24% in gross final renewable energy consumption by 2020 having been
already achieved (and even surpassed), the biogas sector is almost inexistent. While
at the end of December 2015, the total installed capacity for electricity from RES was
approx. 4,662 MWel, the share of biogas was only 12 MWel. Further 5 MWel represented
the amount of further sludge gases and 89 MWel of installed capacity for (solid)
biomass.
The installed capacity of 12 MWel is being divided according to the National Regulatory
Energy Agency (ANRE) among 12 economic operators and 13 biogas plants, only three
of these being bigger than 1 MW. Most of the biogas plants function with a mix of
feedstocks: 5 employ among others also energy crops, while the majority utilize
animal manure and slurry; one plant is based on municipal waste.
While some of the energy is being produced in high efficiency CHP plants, the heat is
being used only for self-consumption.
Biogas/biomethane is not being used in the transport sector.
Biogas and biomethane supporting schemes
In Romania, renewable energy sources in the electricity sector are supported
through a quota system based on quota obligations and tradable certificates.
Electricity suppliers and producers are obliged to present a certain number (or quota)
of green certificates. These tradable certificates are allocated to the producers of
electricity from renewable sources. The share of electricity from renewable energy
sources to be delivered is defined on an annual basis by the energy regulator ANRE.
The annual quota for 2016 has been set at 12.15%. New plants put into operation
from 2004 onwards are eligible for support for 15 years.
The operators of biogas plants are eligible for green certificates only if they present
certificates of origin for the biogas used.
Optimal use of biogas from waste streams
March 2017 I 144
The number of green certificates issued depends on the technology used:
Biogas, biomass, liquid biofuels for energy generation: 2 certificates per MWh
of electricity generated. Highly efficient CHP and plants fuelled by energy crops are
eligible for one additional certificate.
Gas produced from anaerobic digestion of waste and sewage sludge: 1
certificate per MWh of electricity generated. Highly efficient CHP plants based on
anaerobic digestion and plants based on anaerobic digestion that use biomass from
energy crops or deadwood are also eligible for one additional certificate per MWh.
However, the quota system has proved detrimental to the development of the biogas
sector in Romania. Firstly, with an expected surplus of 18 million green certificates at
the end of 2016, their value has been nullified. Secondly, the quota system does not
benefit biomass plants, since they have relatively small investment costs (approx.
20%) but high operational ones (approx. 80%) in comparison to wind and solar
projects, for which the proportion is reversed.
The quota system ceases on 31 December 2016.
Additionally, the new National Rural Development Programme for 2014-2020 foresees
the financial support for investments (subsidies) in installation for the production of
electricity and/or heat, by using biomass (from waste and other secondary
products resulting from own agricultural activity) as a secondary component,
embedded into an investment project. The generated energy, both thermal and
electricity, shall however be used for self-consumption only.
There are no support schemes for biogas/biomethane in the transport sector in
Romania.
Key drivers for biogas and biomethane developments
Given the low numbers of biogas plants and the insignificant amount of MW installed,
no drivers have been communicated by the stakeholders with regards to
biogas/biomethane deployment in Romania.
However, the country has a huge potential for biogas. The country already had a
strong biogas sector in the 80s. After the energy crisis of 1973, Romania had a
national biogas programme and solid investments both in R&D and the erection of
biogas plants. The number of rural installations for households and small collectives
was estimated at around 5000 at the end of 1989.
Key barriers to biogas & biomethane growth
The barriers identified for Romania with regard to all sectors are usually accounted to
the deficient (barely existing) legislative framework, the lengthy administrative
procedures and the lack of coordination and information between ministries (Energy,
Agriculture, Environment).
More specifically, there is no legislative framework supporting the deployment
of biogas in the heating sector, including no quota for the use of biogas as part of
the building regulations. However, it is expected, that a new heating law would
address these shortages. Furthermore, there are no support incentives such as tax
exemptions or technical norms for biomethane, which makes the production and
injection of it highly unlikely.
In addition, both heating and electricity grids are deficient in Romania, with tens
of thousands of households, especially in the rural area, having no access to it. While
biogas plants might provide for a very good local power supply solution, especially in
the rural areas, the high costs of biogas plant construction and the lack of
information on the potentials, financing possibilities or technology itself are
hampering the progress in the sector.
Optimal use of biogas from waste streams
March 2017 I 145
Key policy amendments planned
There are three key policy amendments planned, which are expected to have an
impact on the biogas sector in Romania.
The National Energy Strategy 2016-2030, with a perspective up to 2050 is expected
by the end of September 2016. In addition, a new Heating Law has been under debate
in the Romanian Parliament. It aims at implementing the Energy Efficiency Directive
(2012/27/EU) into the national legislation and is expected to provide the legal
framework for granting a guaranteed access to the heat distribution network
(currently there is no obligation of the network operators to accept the heat from
renewable energy sources) and setting a quota for heat from renewable energy
sources. The new law should also introduce a subsidy for heat from renewable
sources.
Given that the main support scheme for renewable energy sources ceases at the end
of 2016 and the 2020 RES-targets have already been achieved, the future of the RES-
sector in Romania is highly uncertain. However, there seems to be a consensus that
biomass (incl. biogas) will be further financially supported due to its huge potential
and almost inexistent development. Discussions are currently ongoing on whether to
extend the quota system beyond 2016 for biomass only or to introduce a feed-in tariff
scheme.
Appendix A.24 Slovakia
Current production and consumption of biogas and biomethane
In Slovakia, the number of biogas plants in 2014 was 139; of these 110 were
agricultural biogas plants, 16 waste water treatment plants, 11 plants in landfills and 2
biowaste and industrial waste biogas plants. The biomass used for biogas production
comes mainly from agricultural sector (agricultural waste) or food processing (food
waste). Biogas production in Slovakia in 2014 in electricity and heat amounted to
2,786 TJ, with 734.4 TJ of generated electricity and 121.3 TJ generated heat.
Currently there is no biomethane production in Slovakia.
Biogas and biomethane supporting schemes
Biogas in the electricity sector is mainly promoted by a Feed-in Tariff that consists
of two components: the price of electricity for losses (market price) and a surcharge.
The surcharge is billed by the plant operator for the electricity generated, less the
internal technological consumption of electricity. Additionally, the legislative
framework sets certain limitations for the support. First, the market price is paid for all
electricity supplied from renewable energy facilities up to a support limit of 125 MW.
Second, only plants whose total installed capacity does not exceed 5 MW are eligible
for the surcharge. Plants whose total installed capacity exceeds 5 MW (15 MW in case
of wind power) are eligible for a payment of the proportion of 5 (or 15) MW to the
total installed capacity. All electricity produced above the maximum installed capacity
of 5 or 15 MW will be purchased at the price for electricity to cover grid losses.
Furthermore, there are CHP-specific regulations in place. The obligation period for all
eligible renewable technologies is limited to 15 years and starts in the year in which a
plant is put into operation or in the year of reconstruction or upgrade of a plant. In
addition, the feed-in tariff will not be granted if the project is co-funded by the
Government, except where Government grant was used for measures to achieve the
required GHG emission goals at EU level.
Apart from that, the consumption of electricity from biogas is exempt from the excise
duty.
Optimal use of biogas from waste streams
March 2017 I 146
Concerning the heating and cooling sector, the Operational Programme
Environmental Quality for 2014-2020 allocates investment grants from the European
Regional Development Fund (ERDF) for small, medium and large enterprises.
Renewable energy projects including biogas are eligible under Priority Axis 4 ‘Energy
efficient low-carbon economy in all sectors’. Eligible activities under this target include
the replacement of inefficient solid fuel fired boilers with heat generating plants fired
by biomass as well as the construction of biogas plants. The amount of the subsidy is
to be determined in an individual call for applications.
There are no support schemes for biogas/biomethane in the transport sector in
Slovakia.
Key drivers for biogas and biomethane developments
According to the industry, the Slovak government offers no drivers and incentives
concerning biogas deployment within the country. One of the reasons is different
priorities with regards to the energy sector, such as building of the 3 and 4 block of
Nuclear power plant Mochovce. Government representatives, on the other hand,
advocate that the Feed-in Tariff scheme might be seen as the only long-term driver for
the production and use of biogas.
Key barriers to biogas & biomethane growth
Size of the country. The great majority of biogas plants in Slovakia (85%) use corn
silage as a feedstock to produce biogas. This requires greater areas of land to be used
for corn planting. Therefore, the potential number of biogas plants using corn silage is
exhausted.
Grid connection limitations. The possibility to connect new renewable energy plants
(covering also biogas plants) to the electricity grid is limited in Slovakia, as the
capacities in the grid are not sufficient for electricity from renewable energy sources.
So far, mainly photovoltaic installations are connected to the grid.
Potential negative impact on electricity prices. In contrast to the electricity from
nuclear power plants, biogas power plants are dependent on state support such as
feed-in tariffs. The additional financial support might lead to an increase in operational
and maintenance cost of distribution network and therefore increase electricity prices
to end consumers. Therefore, construction of new biogas plants might receive no
support in the future.
Key policy amendments planned
Currently, no new policies or policy amendments with regards to biogas and
biomethane are being planned in Slovakia. However, certain changes affecting biogas
sector might be undertaken by the new Government formed in the beginning of 2016.
Appendix A.25 Slovenia
Current production and consumption of biogas and biomethane
The total number of biogas plants in Slovenia in 2013 was 31 and in 2014 - 26: 24
biogas plants produced biogas from agricultural wastes and 2 plants included biowaste
and industrial waste biogas plants. The total installed capacity of all these plants in
2014 amounted to 27.2 MWel. Altogether these plants achieved a production of 141.0
GWh, most of it being generated electricity.
Currently, there is no biomethane production in Slovenia.
Optimal use of biogas from waste streams
March 2017 I 147
Biogas and biomethane supporting schemes
In Slovenia, biogas/biomethane deployment is supported through a series of support
policies. In the electricity sector, the main support mechanisms are the feed-in tariff
for biogas installations up to 1 MW and feed-in premium for biogas installations
exceeding 1 MW. The tariff and premium level is dependent on the total installed
capacity of the plant and the type of fuel source. In 2014, both schemes were
overhauled and are currently being revised in a tender process. Under the new tender
system, the feed-in tariff and feed-in premium will be set on a case-by-case basis.
This is still to be determined by the new regulations.
Due to insufficient funds no tender for feed-in tariff and feed-in premium was initiated
in 2015. Thus no tariffs and premiums have been granted to plants, which were
connected to the grid after 22 September 2014. For 2016 the overall tendered funds
are capped at € 10 million. However, the tender is still waiting for the approval by the
European Commission. The tendered funds shall favour biomass and wind energy.
Furthermore, the Eco Fund regularly publishes public calls/tenders offering financial
incentives in form of subsidies and soft loans to renewable electricity and heat
producers, covering also biogas producers. The calls subsidize the reconstruction and
renovation of plants. Public calls usually target at natural and legal persons (residents
of Slovenia and enterprises registered in Slovenia) as well as local communities
(municipalities etc.). Details on the amount, method of payment, credit rate,
maximum allocated funds, length of repayment period, etc. are specified in each
respective public call.
Production of biogas and biomethane for heat and electricity from agricultural waste
and other waste was supported through several programmes under the Rural
Development Programme in the period 2007-2013 but most of them were ceased for
the 2014-2020 period or are running out.
In the transport sector, the only support scheme in place is the quota obligation
imposed by the Energy Act. The Act imposes obligations on fuel distributors to offer
biofuels. The definition of biofuels covers also biogas/biomethane. The minimum
percentage of biofuels in the Slovenian fuel market is set on a yearly basis. The
obligation level for 2015 was set at 7.5%. The obligation level for 2016 has not yet
been set.
Key drivers for biogas and biomethane developments
The key drivers for biogas deployment in Slovenia are the financial incentives
described above - the Feed-in Tariff and Feed-in Premium schemes, subsidies and
loans from the Eco Fund and the quota obligation. The installed capacity of biogas
covered under the Feed-in Tariff and Feed-in Premium schemes capped in 2012
following a big increase in the years 2010-2012. The reason for this increase was the
extra premium support for CHP installations.
Since biogas/biomethane is still economically not viable without state support, it is
very important to have an effective and stable policy in place to encourage the
deployment of both technologies. The recent suspension of the Feed-in Tariff scheme
and the transition to a tendering scheme has shown that there is little to no interest
for the technology without state support, especially in the heating and transport
sectors.
Key barriers to biogas & biomethane growth
Biogas deployment in Slovenia is mainly hindered by difficult planning procedures.
Under the aspect of environment protection certain landscapes such as Natura 2000 or
landscapes with a "special environmental value" are deemed not suitable for the
construction of plants. Even if a suitable site is selected an environmental impact
Optimal use of biogas from waste streams
March 2017 I 148
assessment needs to be carried out, which can lead to considerable delays.
Furthermore, a project developer needs to wait for the local municipality to change its
local spatial plan and sometimes even the national state spatial plan needs to be
amended respectively. Depending on the authorities involved in the planning process,
the project development can take up to 10 years.
Furthermore, there is a lack of political support from the Government, which should
clearly define the mid- and long-term goals for renewable technologies. According to
the industry, the full potential and spectrum of renewable technologies is not being
exploited; for instance, the potential of research in the field of renewable energy or
the potential of new jobs and economic growth, etc.
The new model for the support schemes foresees the introduction of public tender
rounds with which investors will be invited by public call to apply to the Energy Agency
with their renewable electricity projects. The Agency will rank the applications
according to the project’s economic rentability, its contribution to environment
protection, the available funds allocated for that year, etc. This will bring some
uncertainty within the support scheme as not all projects that would formally qualify
might be given the support. Moreover, it is nearly impossible to compare different RES
technologies based on some pre given "objective" criteria.
Economic feasibility. A great deal of project developers in Slovenia opted or still opt
for large biogas installations (>1 MWp) rather than smaller ones. Many plants produce
not enough biomass to be used as an on-site energy generation source and therefore
plant operators are forced to buy biomass (mainly maize silage) on the market. This
makes the investments dependent on the market developments and therefore
economically unpredictable.
Key policy amendments planned
In 2014, the Feed-in Tariff and Feed-in Premium schemes were overhauled and are
currently being revised into a tender process. The tender scheme is currently waiting
for the confirmation by the European Commission and is as such currently on hold.
No policy developments that might have an impact on the biogas/biomethane
development in the heat and transport sector are currently being planned.
Appendix A.26 Spain
Current production and consumption of biogas and biomethane
Spain is a country with great potential for the production of biogas, as it has an
intensive agriculture activity. Nevertheless, biogas production levels are still low
accounting to about 14,791 TJ in 2014, coming mainly from landfills, through biogas
digesters. The amount of agroindustrial biogas is very low. In 2013, there were about
124,000 ktoe of landfill biogas, 29,800 ktoe of sewage sludge biogas and 102,000
ktoe of biogas produced in decentralised agricultural plants, municipal solid waste
methanisation plants and centralised co-digestion plants. The used biogas technologies
are anaerobic digestion in closed tanks, biogas purification and dehumidification.
In Spain, biomethane has not been developed yet.
Biogas and biomethane supporting schemes
In the electricity sector, no direct support scheme for biogas is in place. The price
regulation system for renewable energy sources, including biogas, was suspended
through Royal Decree-law 1/2012. Under the price regulation system, biogas plant
operators could choose between a feed-in tariff and a bonus, which was paid on top of
the electricity price achieved in the wholesale market. The bonus for biogas plants
(14 €ct kW/h) was not enough to guarantee profits and only about 30 plants were
Optimal use of biogas from waste streams
March 2017 I 149
constructed under this scheme. Royal Decree-law 9/2013 replaced the former
retribution system (feed-in tariff or bonus) by a new system which consists of two
payments: 1) Return of the investment (not real but determined by the Government)
plus 7.35% profit to be recovered in 25 years; 2) Compensation of the OPEX (not real
but determined by the Government) which has zero impact on profits. This new
retribution system affects the 30 plants which were already under the former
retribution system. Since 2012, no direct support scheme for new biogas projects is in
place.
In the heat sector, no support schemes for biogas are in place in Spain.
In the transport sector, biogas/biomethane is supported under the biofuel quota.
The biofuel quota is the support mechanism for the use of biofuels and other
renewable fuels like biogas/biomethane in transport means. Wholesale and retail
operators of fuels, as well as consumers of fuels not supplied by wholesale or retail
operators, are obliged to sell/consume a minimal quota of biofuels. Each obligated
subject will have to present a number of certificates to the National Energy
Commission (CNE) to prove compliance. In case of non-compliance with the goals, a
penalty fee applies. In case of over-compliance, the amounts collected from the
penalty fees are redistributed by the CNE proportionally to the subjects that
sold/consumed biofuels exceeding their quota obligation. Order ITC/2877/2008 sets a
value of € 763 per certificate. Each certificate indicates that the obligated party has
sold or consumed 1 toe of biofuels in one year. Addressees must deliver to the CNE a
yearly amount of certificates that allow meeting, from 2013 onwards, 4.1% minimal
amount of sold or consumed biofuels.
Finally, biogas production is indirectly supported through the Climate Projects
programme. The programme provides basically a compensation for the avoided
emissions of CO2-equivalent, which is received among others by biogas facilities for a
period of 4 years. It is a supplement to the income of the installation, though it is not
enough to justify an investment.
Key drivers for biogas and biomethane developments
In Spain, a potential driver for biogas and biomethane for the next future is the
extensive gas network with the possibility for connecting plants. Such option was even
suggested by Fenosa, the largest natural gas company in Spain, as of 2016. In the
heating sector, it could be possible to develop biogas/biomethane through large plants
due to largely uncovered demand, but currently with the suspension of the support
schemes under Royal Decree 413/2014 and Order IET 1045/2014, it is difficult to
invest in biogas/biomethane.
Spain is a country with large potential for the production of biogas/biomethane, as it
has an intensive agriculture activity. Many regions in Spain (especially Catalunya,
Aragon, Castilla y Leon, Andalucia and Murcia) are large producers of pork and beef
and have an uncovered demand in the heating sector. The deployment of
biogas/biomethane in these regions represents a good opportunity to increase the
thermal energy supply.
Key barriers to biogas & biomethane growth
Lack of a framework in the electricity sector. RD 413/2014 and MO IET
1045/2014 eliminated the concept of "special regime", used before for the electricity
production from renewable energy sources, cogeneration and residual wastes with
retroactive effects already from 2013. The reason is that due to the widespread
penetration of renewable energy it is no longer meaningful to have a specific
regulation for RES. Therefore, in the adopted system, renewable plants are considered
exactly the same as the rest of the technologies present in the market. As a result,
banks are reluctant to new investments and revise their refinancing options
Optimal use of biogas from waste streams
March 2017 I 150
(sometimes with no other option than repossess or sell the installation at a loss). It is,
thus, currently extreme difficult to invest in biogas in Spain, as there is a lack of
confidence in the government's agreements and of finance available to invest in new
projects.
Restriction of priority access and dispatch in the electricity sector. The 2014
Electricity Law, approved in June 2014, introduced an "equality of economic conditions
in the market" principle, which restricts the priority access and dispatch for renewable
electricity. The principle means that such priority would be granted only in times that
biogas producers would offer their electricity in the market at lower or equal prices as
conventional players. It breaches the RED (2009/28/EC), which stipulates priority
access and dispatch for renewable electricity independently of the price offered in the
wholesale power market or the degree of dispatchability of certain power sources.
Lack of production based support instruments. The lack of implementation of
production based support instruments for biogas installations in the heating sector
mainly affects the operational level. The consequence is that no new biogas plants in
the heat sector exists.
Insufficient targets for biofuels in the transport sector. The main barrier for the
development of biofuels is the low level of the national targets. The Spanish
Government approved in February 2013 a severe reduction in the biofuels
consumption mandates from the year 2013 onwards. Biofuels mandate has been
reduced from 6.5% to 4.1%, whereas biodiesel and bioethanol targets have been
reduced to 4.1% (from 7%) and 3.9% (from 4,1%), respectively.
Key policy amendments planned
The Spanish National Renewable Energy Action Plan 2011-2020 envisages that the
installed capacity of biogas should reach 220 MW in 2015 and 400 MW by 2020.
However, as of 2015, the capacity for biogas represented only 20 MW.
No information on new planned policies, amendments or regulations to support biogas
investments exists. There are only some R&D projects related to biogas that have
been announced. In the last call of the LIFE programme, the European Commission
has approved 28 projects for Spain. From these projects, five are related to biogas
and one to the production of synthetic gas from wastes of the cork industry.
Appendix A.27 Sweden
Current production and consumption of biogas and biomethane
In 2014, about 277 biogas facilities were installed in Sweden that produced biogas of
altogether 1,783 GwH. The greatest share of biogas was produced in facilities that
used sewage sludge and co-digestion plants. Most of the produced biogas (57%) was
upgraded and used as automotive fuel. Only 24% were used for production of heat
and even only 3% for the production of electricity.
Biogas and biomethane supporting schemes
In contrary to most European biogas markets one of the most important support
schemes is a tax regulation mechanism: The Energy tax legislation provides the
framework for energy and CO2 taxes as well as reductions for biofuels. Biogas
currently receives 100 percent reduction of both energy and CO2 tax, while tax
reduction for biogas for transportation is conditioned with fulfilment of sustainability
criteria. Also, there are specific support schemes for the production of biogas,
including from manure, in the form of investment support within the various state
programs.

Optimal use of biogas from waste streams
March 2017 I 151
In the electricity sector, the most important support scheme is a quota system
(Electricity Certificate System) that awards the producers of electricity from renewable
energy sources such as biogas with green certificates. The power producers receive
one certificate for each megawatt hour of renewable electricity produced in the plant,
over a maximum 15 years. These certificates can be purchased by electricity suppliers
and certain power consumers which are legally obliged to annually acquire such
certificates in due proportion to their electricity sales and their consumption by a set
date. The electricity end-users pay for the development of renewable electricity
production because the cost of the electricity certificates is included in the electricity
bill. Since 1st January 2012, Sweden and Norway have a common electricity certificate
market.
Key drivers for biogas and biomethane developments
A major driver for the development of biogas and biomethane in Sweden are the
national performance targets. The Swedish government has set the goal of no net
GHG emissions by 2050. Furthermore, there is a strategic vision of a fossil free vehicle
fleet by 2030. Another important driver is the ambitious goals by the industry. The
Swedish gas industry’s visions are the achievement of 100% biomethane in the
vehicle gas by 2030 as well as 100% biomethane in the gas grid by 2050.
In concrete terms, the key driver for further development is the above described tax
exemption for energy and CO2 tax.
Key barriers to biogas & biomethane growth
The main barrier is the discussion with the EU on the state aid procedure
regarding the tax exemption for energy and CO2 tax. It makes it hard for Sweden to
keep using the tax exemption for biogas as motor fuel as the major support scheme
for the development of biogas. The ongoing discussion has put a wet blanket on the
market today, due to the insecurity what will happen after 2020.
The ILUC regulations limit the production of biogas and biomethane from food-based
crops, even if these crops are produced in a sustainable way without having an ILUC
effect. From the perspective of the Swedish biogas sector, at the moment there is a
trend in the EU that electricity will cover all the transport sector which results in a
scepticism regarding biofuels.
Several years ago, Sweden has already reached their 2020 transport goal of a 10%
share of renewable fuels in the transport sector. Currently, a real driver for the
development of biogas for transport purposes is missing, as there is no EU transport
goal for renewable energy after 2020.
Key policy amendments planned
In December 2015, a draft for the national biogas strategy was published including a
list of measures and instruments aiming at an increased use of biogas in Sweden. The
following policy instruments are proposed and some of them already under
investigation:
maintain the tax exemption for biogas even after 2020;
introduce a nationally applicable definition of “environmental truck” to support
“heavy good vehicles”;
introduce a subsidy for gas-powered busses;
introduce a bonus-malus system for light vehicles, including a bonus given to
owners of vehicles with lower carbon dioxide emissions and an additional fee
(malus) for owners of vehicles with higher carbon dioxide emissions;
continue (but reduce) the benefits for company cars.

Optimal use of biogas from waste streams
March 2017 I 152
Appendix A.28 United Kingdom
Current production and consumption of biogas and biomethane
The United Kingdom is one of the front runners in the EU when it comes to biogas and
biomethane production. After more than ten years of steady development the sector
saw its biggest growth in 2014 (102 new plants commissioned). As of December 2015,
the number of operational plants reached 424. Of these, 378 were electricity/CHP
plants, 6 - heat-only plants and 40 - biomethane plants. Further 442 plants are
currently in planning: 419 electricity/CHP plants with a potential installed capacity of
424 MWe and 23 biomethane plants with a potential installed biomethane capacity,
m³/hr (some may not go ahead). In 2015, operational plants produced 7.4 TWh of
energy: less than 0.1 TWh for heat-only and transport, 1.5 TWh injection into the gas
grid and 5.9 TWh electricity and heat generation (2.2 TWhe electricity; 3.7 TWth
cogenerated heat).
In the United Kingdom, biomethane is mainly used for the injection into the gas grid.
However, to some small extent it is also used directly in transport.
Biogas and biomethane supporting schemes
In the electricity sector, biogas is mainly supported through a Feed-in Tariff scheme
and the quota system called ‘Renewables Obligation’ (RO). The Feed-in Tariff scheme
applicable in Great Britain, supports small-scale biogas producers up to 5 MW. Biogas
plants between 50 kW and 5 MW located in Great Britain can choose between the
Feed-in Tariff and RO schemes. All new installations applying for feed-in tariff on or
after 15 January 2016 are subject to a new system of caps. Deployment caps,
expressed in terms of aggregate total installed capacity of MW, are set on a quarterly
basis. For AD max. deployment cap amounts to 5.0 MW per quarter until April 2019.
Under the RO scheme, which is the main scheme for power plants > 5 MW, suppliers
of electricity are obliged to prove (by presenting certificates) that a certain percentage
of electricity supplied to final consumers within the United Kingdom was generated
from RES. On 31 March 2017 the RO scheme will close to all new capacities.
Since 2014, the Contracts for Difference (CfD) scheme are in place in Great Britain (to
be introduced in Northern Ireland this year). It is based on a difference between the
market price and an agreed “strike price”. CfD supports landfill gas, sewage gas, AD,
gas formed by gasification or pyrolysis of biomass or waste. A plant operator willing to
secure a contract has to take part in an allocation round. From April 2017 (when RO
schemes closes), the CfD will be the only support scheme for RES projects over 5MW.
Finally, biogas producers in GB are exempt from the energy tax called Carbon Price
Floor, which is levied on fossil fuels.
In the heat sector, biogas combustion and biomethane injection into the grid is
supported under the Non-Domestic Renewable Heat Incentive (RHI) providing a fixed
tariff per kWth produced. The payment is provided to industry, businesses and public
sector organisations. This scheme is available in England, Scotland and Wales. The
Northern Ireland RHI was closed to new applicants in March 2016.
In the transport sector, biomethane is supported under the quota system called
Renewable Transport Fuel Obligation (RTFO). Fuel suppliers are obliged to satisfy a
specified quota of biofuels in the total supplied fuel. One certificate may be claimed for
every litre of supplied sustainable renewable fuel. For biogas, 1.9 certificates/kg of
supplied biomethane may be claimed and 1.75 certificates/kg of supplied biobutane or
biopropane (or a combination of both). The number of certificates doubles if the
feedstock used is classed as a waste or residue.

Optimal use of biogas from waste streams
March 2017 I 153
Last but not least, biogas and biomethane production is indirectly supported through
the Landfill Tax, which is charged by weight and has to be paid on top of normal
landfill fees.
Key drivers for biogas and biomethane developments
In the United Kingdom, slow growth of biogas industry started in the 2000s. This was
due to the introduction of the RO scheme in 2002. An even greater driver for both
biogas and biomethane production was the launch of Feed-in Tariff (2010) and RHI
(2011). Launch of these incentives resulted in the biggest growth of the sector in
2014. This was the first year when biomethane-to-grid plants were constructed and
commissioned in such significant numbers. In addition, beneficial for biomethane was
the growing confidence in the technology and the resolution of some regulatory issues,
e.g. increasing max. permitted levels of oxygen in biomethane for injection from 0.2%
to 1% or agreement of an ownership model, where biomethane producer funds, owns
and operates the Grid Entry Unit.
Key barriers to biogas & biomethane growth
Lack of the right and stable framework. The support schemes are permanently
reviewed and revised. With regards to the Feed-in Tariff scheme, recent cuts in feed-in
tariffs resulted in reduced attractiveness of the scheme. RO will close to new capacities
from April 2017. It will be replaced by the CfD scheme. However, the 2nd CfD
allocation round scheduled for 2015 was postponed and as of June 2016 a new date is
yet to be set. Hence, there are uncertainties resulting from changing policies and
uncertainties regarding available budget beyond 2020, which remain a big concern to
the industry.
Availability of feedstock, especially food waste. Due to a lack of a mandatory
food collection in place – notably in England – availability of food waste is limited in
the United Kingdom. In addition, there are no incentives to use manure or slurries for
biogas production, no penalties for leaving manure and slurries unused or polluter
pays principle in this context. Manures and slurries are largely under-utilised by the
AD sector, mainly due to the low biogas yields of these wastes, which makes them
uneconomical to use as a stand-alone feedstock. As a result, manures and slurries are
typically used in relatively small volumes supplemented with high gas-yielding crops.
Sustainability criteria was incorporated into the RHI and the RO, and is likely to be
included in FIT too. This might to some extent discourage the use of crops in AD. On
the other hand, it is likely that the vast majority of crop material would meet those
criteria, if reasonable steps are taken to source supply chain data and ensure that
sustainable cultivation practices are undertaken. However, industry is concerned about
Government proposals to limit gas yield from energy crops to 50% (50% non-crop
materials).
Fall in wholesale prices of energy (gas and electricity) negatively affects
deployment of biogas and biomethane.
Key policy amendments planned
In May 2016, the Department of Energy & Climate Change (DECC) launched a public
consultation on the review of support for AD and micro-CHPs under the Feed-in tariff
scheme. Government proposals include: continued reductions of feed-in tariffs
(eliminating the tariff for AD plants above 500kW) and introducing a default
degression mechanism for AD, meaning that the tariff rates fall automatically every
quarter (also called pre-planned degression). Contingent degressions of 10% are to
continue to operate, if a quarterly cap is reached.
Optimal use of biogas from waste streams
March 2017 I 154
An assessment of RHI tariffs against expenditure will determine whether tariffs will
continue to degress in July and October 2016. Tariffs for biomethane under the RHI
were reduced dramatically last year. There are ongoing discussions in government
regarding whether to reset tariffs at a higher level from January 2017 next year in
order to make biomethane projects financially viable again.
Finally, the consultation on legislative amendments to the RTFO shall be launched in
2016. The scheme needs to be reviewed because of the EU agreement on ILUC. The
UK Government will not opt for options to meet the EU requirements by shifting from
crop-based biofuels towards renewable fuel from waste.

Optimal use of biogas from waste streams
March 2017 I 155
Appendix B Assumptions and references biogas model In this Appendix additional information on the CE Biogas model is provided. We give
an overview of the technologies in the model and the assumptions and settings for the
scenario calculations.
The gas quality specifications of biogas and biomethane is not uniquely defined. In this
report we used the following definitions when we refer to biogas, cleaned landfill gas
and biomethane:
biomethane: upgraded biogas to natural H-gas quality with a methane content of
97.6vol% and a Wobbe Index of 50.5;
biogas: biogas with a methane content of 60vol%;
landfill gas (cleaned): biogas from landfills with a methane content of 56vol% (ECN,
2011).
Appendix B.1 Technologies
The following table gives an overview of the technologies used in the model for the
scenario calculations in this report. Details on the parameters used in the calculations
can be found in the references.
In general, for discounting capital costs a depreciation period of 16 years is assumed,
with in most cases an annual capital charge of 6.2%. For determining the costs of
electricity consumption we used the electricity and natural gas price of the second half
of 2014 from EUROSTAT (EUROSTAT, 2015). Because these commodity prices are
hard to forecast, we assume the value of 2014 is applicable in all years. Taxes and
levies are not taken into account. No data is available for digestate prices per member
state and are thus not taken into account
In the case of land fill gas, the investments and costs for cleaning are taken into
account, not for recovering landfill gas from landfills. This is mainly because the
necessary information about costs and landfills in the EU are not available.
Furthermore it can be questioned if these costs should be accounted to the biogas or
seen as an emission reduction measure.
Table 4 Technologies used in the CE Biogas model for the scenario calculations in
this report
Category Technology Description Reference
Digestion Non-specific digester Installation for organic waste digestion. Parameters from reference.
Capacity: 950 Nm3 raw gas/h
(ECN & DNV GL, 2015)
Co-digester Installation for manure digestion. Parameters from reference.
Capacity: 505 Nm3 raw
gas/h
(ECN & DNV GL, 2015)
Mono-digester Installation for manure digestion (>95% manure). Parameters from reference.
Capacity: 20.5 Nm3 raw
(ECN & DNV GL, 2015)

Optimal use of biogas from waste streams
March 2017 I 156
Category Technology Description Reference
gas/h
Sewage sludge digester Installation for sewage sludge digestion (based on parameters of co-digester) with thermal pressure hydrolysis.
Parameters from references.
Capacity: 340 Nm3 raw
gas/h
(ECN & DNV GL, 2015)
(ECN & DNV GL, 2014)
(DHV/STOWA, 2011)
Landfill gas cleaning Installation for cleaning
landfill gas to biogas with a methane content of 56vol%. Parameters from reference.
Capacity: 150 Nm3 raw gas/h
(ECN, 2011)
Upgrading Water scrubber Installation for upgrading biogas with a given methane content to natural gas quality.
Capacity equals the capacity of the digester.
(CE Delft, 2010)
Transport fuels
CNG Compression and storage of biomethane to CNG
(CE Delft, 2010)
LNG Liquefaction plant of biomethane to bio-LNG; assumed 5% O&M costs
(SGC, 2013)
Utilisation CHP (biogas) Installation for cogeneration of electricity and heat from raw biogas. Parameters from reference.
Capacity: 1.1 MWe
(ECN & DNV GL, 2015)
CHP (cleaned landfill gas) Installation for cogeneration of electricity and heat from cleaned landfill gas. Parameters from reference.
Capacity: 0.3 MWe
(ECN, 2011)
In the case of cogeneration (CHP), it is assumed that 25% of the net heat produced
can be put on the market, the other 75% of the nett heat is lost (the heat consumed
in the process is already extracted from the gross heat production). The heat is sold at
the price of producing the same amount of heat with a natural gas boiler. The heat
which is sold on the market is accounted as a revenue to the costs of producing
electricity. The nett costs of the whole chain – digestion and the generation of
electricity by cogeneration – is used to calculate the production costs of electricity.
Because the generated heat can be used in digestion, there is no need self-
consumption of biogas for heating the digester, as a consequence the gross biogas
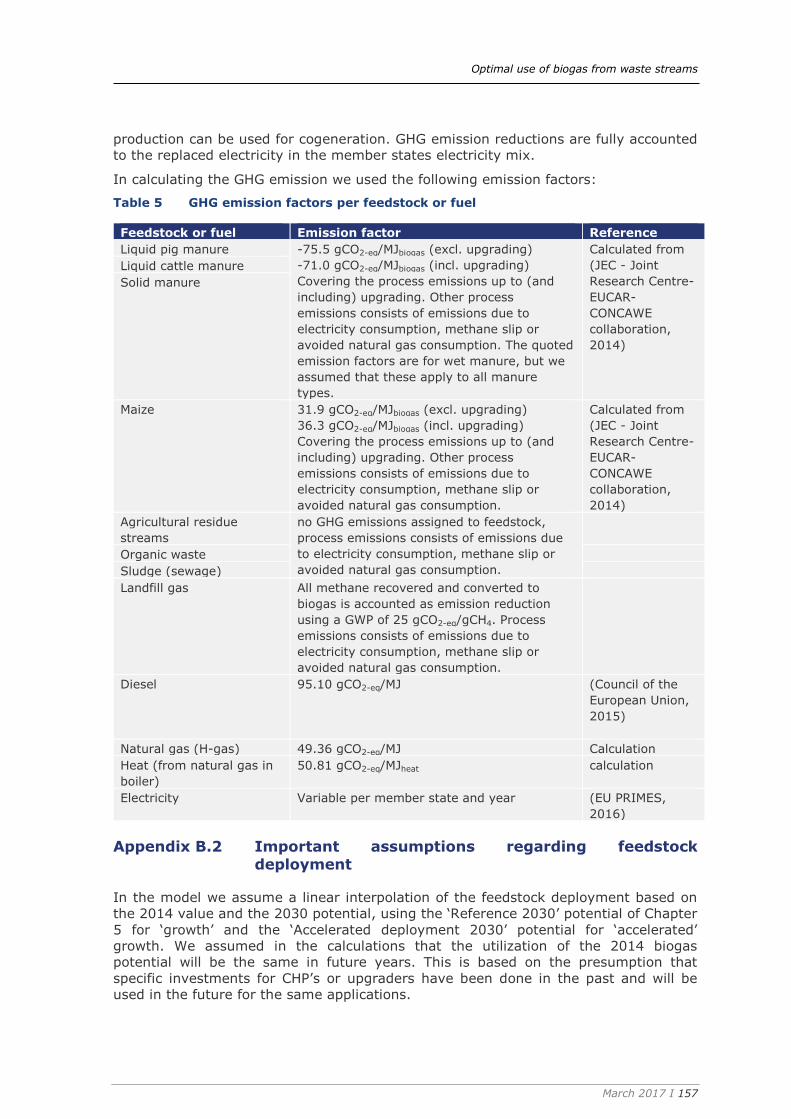
Optimal use of biogas from waste streams
March 2017 I 157
production can be used for cogeneration. GHG emission reductions are fully accounted
to the replaced electricity in the member states electricity mix.
In calculating the GHG emission we used the following emission factors:
Table 5 GHG emission factors per feedstock or fuel
Feedstock or fuel Emission factor Reference
Liquid pig manure -75.5 gCO2-eq/MJbiogas (excl. upgrading)
-71.0 gCO2-eq/MJbiogas (incl. upgrading)
Covering the process emissions up to (and
including) upgrading. Other process
emissions consists of emissions due to
electricity consumption, methane slip or
avoided natural gas consumption. The quoted
emission factors are for wet manure, but we
assumed that these apply to all manure
types.
Calculated from
(JEC - Joint
Research Centre-
EUCAR-
CONCAWE
collaboration,
2014)
Liquid cattle manure
Solid manure
Maize 31.9 gCO2-eq/MJbiogas (excl. upgrading)
36.3 gCO2-eq/MJbiogas (incl. upgrading)
Covering the process emissions up to (and
including) upgrading. Other process
emissions consists of emissions due to
electricity consumption, methane slip or
avoided natural gas consumption.
Calculated from
(JEC - Joint
Research Centre-
EUCAR-
CONCAWE
collaboration,
2014)
Agricultural residue
streams
no GHG emissions assigned to feedstock,
process emissions consists of emissions due
to electricity consumption, methane slip or
avoided natural gas consumption.
Organic waste
Sludge (sewage)
Landfill gas All methane recovered and converted to
biogas is accounted as emission reduction
using a GWP of 25 gCO2-eq/gCH4. Process
emissions consists of emissions due to
electricity consumption, methane slip or
avoided natural gas consumption.
Diesel 95.10 gCO2-eq/MJ (Council of the
European Union,
2015)
Natural gas (H-gas) 49.36 gCO2-eq/MJ Calculation
Heat (from natural gas in
boiler)
50.81 gCO2-eq/MJheat calculation
Electricity Variable per member state and year (EU PRIMES,
2016)
Appendix B.2 Important assumptions regarding feedstock
deployment
In the model we assume a linear interpolation of the feedstock deployment based on
the 2014 value and the 2030 potential, using the ‘Reference 2030’ potential of Chapter
5 for ‘growth’ and the ‘Accelerated deployment 2030’ potential for ‘accelerated’
growth. We assumed in the calculations that the utilization of the 2014 biogas
potential will be the same in future years. This is based on the presumption that
specific investments for CHP’s or upgraders have been done in the past and will be
used in the future for the same applications.

Optimal use of biogas from waste streams
March 2017 I 158
The amount of energy crops is virtually unlimited; its utilization is determined by
policy. In the model calculations we have assumed that energy maize is only used in
co-digestion with manure in a mass ratio of at least 80% manure and 20% energy
maize. The potential amount of energy crops is for every year at least equal to the
2014 amount or is increased with an amount determined by the manure/energy maize
mass ratio and the amount of manure in co-digestion. This ratio applied on the mass
of manure feedstocks used for co-digestion to determine the mass of energy crops for
co-digestion. The share of energy crops per manure type in 2014 is assumed to be
50% liquid pig manure and 50% liquid cattle manure;
Feedstock deployment per technology is assumed to be the following for all scenario
years, see Table 6.
Table 6 Feedstock deployment percentages per digestion/conversion technology
Digester type Non-
specific
digestion
Co-
digestion
Mono-
digestion
Sewage
sludge
digestion
Landfill
gas
cleaning
Liquid pig manure 80% 20%
Liquid cattle manure 80% 20%
Solid manure 100%
Energy maize 100%
Agricultural residue
streams
100%
Organic waste 100%
Sludge (sewage) 100%
Landfill gas 95%
Mono-digestion is a technology in development, therefore liquid manure is assumed to
be mainly digested in co-digesters along with energy maize. For 2014 we assumed
that energy maize is equally mixed with liquid pig manure and liquid cattle manure.
After 2014 the amount of energy crops and liquid manure is determined by the
manure-maize ratio. Solid manure is not digested in 2014, but we assume that it will
be digested in the future by state-of-the-art digesters, i.e. mono-digesters. We
assumed that 95% of the landfill gas potential is to be cleaned to biogas, because it is
difficult to recover all the methane emission from landfills economically.
The feedstock costs are assumed to be constant over the whole time window 2014-
2030. The same holds for gas and electricity prices.
Appendix B.3 New capacity
An increasing feedstock availability will result in a need for new capacity for the
production of biogas, leading to new investments. Investments are done without
foresight but in hindsight per two years period, i.e. every new feedstock amount of the
past two years results in new investments at exactly the capacity necessary. This
might not reflect the investment decision of a rational investor. Between periods the
production and variable costs can be reduced due to a decreasing feedstock potential,
but investments done in the past, and the accompanying O&M cost, cannot be reduced
since investments are depreciated over 16 years.
Because the model considers only new capacities, the total production in a certain
year must include the production of the previous years. The same holds for related
parameters as GHG emissions. Since the production costs of 2014 are not know, only
the production costs of the new investments (2015-2030) are taken into account.
Production costs are calculated without taxes and levies.


