
General rights Copyright and moral rights for the publications made accessible in the public portal are retained by the authors and/or other copyright owners and it is a condition of accessing publications that users recognise and abide by the legal requirements associated with these rights.
Users may download and print one copy of any publication from the public portal for the purpose of private study or research.
You may not further distribute the material or use it for any profit-making activity or commercial gain
You may freely distribute the URL identifying the publication in the public portal If you believe that this document breaches copyright please contact us providing details, and we will remove access to the work immediately and investigate your claim.
Downloaded from orbit.dtu.dk on: Oct 12, 2021
On the Absorption of Wave Power Using Ship Like Structures
Nielsen, Kim; Bingham, Harry; Thomsen, Jonas Bjerg
Published in:Proceedings of the Twenty-eighth (2018) International Ocean and Polar Engineering Conference
Publication date:2018
Document VersionPublisher's PDF, also known as Version of record
Link back to DTU Orbit
Citation (APA):Nielsen, K., Bingham, H., & Thomsen, J. B. (2018). On the Absorption of Wave Power Using Ship LikeStructures. In Proceedings of the Twenty-eighth (2018) International Ocean and Polar Engineering Conference(pp. 719-726). International Society of Offshore & Polar Engineers. Proceedings of the International Offshoreand Polar Engineering Conferencehttp://legacy.isope.org/publications/proceedings/ISOPE/ISOPE%202018/data/polopoly_fs/1.4194022.1525902622!/fileserver/file/893536/filename/18TPC-1390Nielsen.pdf#search=%22Absorption%20of%20Wave%20Power%20Using%22
On the Absorption of Wave Power Using Ship Like Structures
Kim Nielsen
Offshore Wind, Ramboll
Copenhagen, Denmark
Harry Bingham Mechanical Engineering, Technical University of Denmark
Lyngby, Denmark
Jonas Bjerg Thomsen Department of Civil Engineering, Aalborg University
Aalborg, Denmark
ABSTRACT
This paper presents a conceptual study of a wave farm based on ship-
like structures being developed under the acronym KNSWING. These
are attenuator Wave Energy Converters (WEC) integrating Oscillating
Water Columns (OWC) with side openings in the hull. This leads to
important advantages compared to solutions based on Point Absorbers
as described in (K. Nielsen, 2004) such as: large modular structures
with redundant PTO systems, simplicity with few moving parts, less
electrical equipment on the seabed and lower grid connection costs, a
main structural frame suited for mass production, high energy
absorption from waves, low mooring forces, low cost concerning tow
out for installation, and easy access to mechanical equipment which are
all located above water.
KEY WORDS: Wave energy; cost of energy; Wave Energy
Converter WEC; Attenuator OWC; Experimental performance
assessment; Marinet experiments; Numerical Modelling; Mooring
Loads; North Sea; Conceptual design; Technology Performance Level
TPL, Concrete structures; Cost of energy LCOE.
INTRODUCTION
The objective of this paper is to present a conceptual study of the
design of a wave farm composed of a large number of serially produced
Wave Energy Converters (WECs) and the experimental and theoretical
results related to the development of a ship-like structure to absorb
wave energy. The concept was first investigated following the energy
crises in 1973, when the UK set out research to develop alternative
energy solutions converting wave energy to electricity to meet part of
the UK electricity demand. A wide range of WEC’s resulted from this
R&D programme presented at the first international conference of
Wave Energy in 1979 in Gothenburg. Among these ideas was a ship-
like concept the I-beam OWC attenuator concept (Moody, 1979),
which had been tested at University of Edinburg by Stephen Salter, but
also the Kaimai an 80 meter long ship with OWC chambers which had
been tested in real seas in Japan was presented.
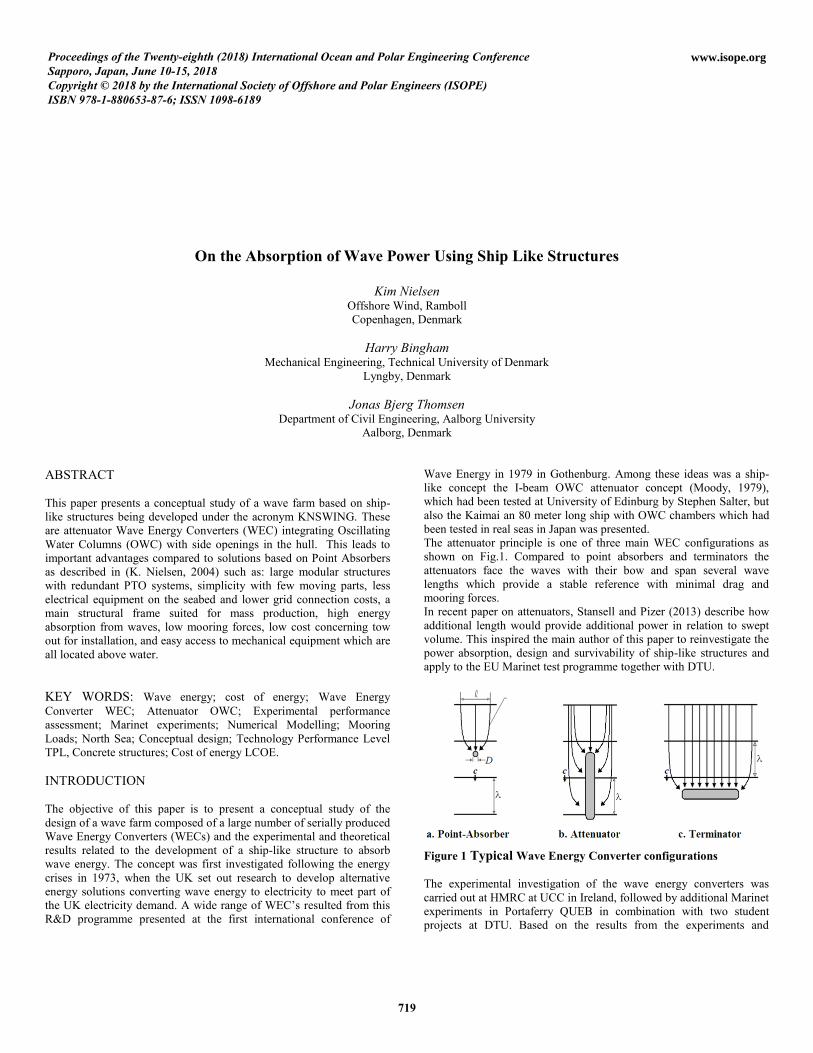
The attenuator principle is one of three main WEC configurations as
shown on Fig.1. Compared to point absorbers and terminators the
attenuators face the waves with their bow and span several wave
lengths which provide a stable reference with minimal drag and
mooring forces.
In recent paper on attenuators, Stansell and Pizer (2013) describe how
additional length would provide additional power in relation to swept
volume. This inspired the main author of this paper to reinvestigate the
power absorption, design and survivability of ship-like structures and
apply to the EU Marinet test programme together with DTU.
Figure 1 Typical Wave Energy Converter configurations
The experimental investigation of the wave energy converters was
carried out at HMRC at UCC in Ireland, followed by additional Marinet
experiments in Portaferry QUEB in combination with two student
projects at DTU. Based on the results from the experiments and
719
Proceedings of the Twenty-eighth (2018) International Ocean and Polar Engineering ConferenceSapporo, Japan, June 10-15, 2018Copyright © 2018 by the International Society of Offshore and Polar Engineers (ISOPE)ISBN 978-1-880653-87-6; ISSN 1098-6189
www.isope.org

numerical calculations for the system on energy absorption and
mooring loads, a conceptual design study is presented.
CONCEPTUAL DESIGN OF THE KNSWING
The KNSWING WEC shown in Fig. 2 is a 240 meter long ship-like
structure with Oscillating Water Columns (OWCs) along its sides. The
structure is proposed to be built in concrete to make the structure less
expensive compared to a structure built in steel. A serial production
using a continuous forming technique similar to the methodology to be
used at the Fehmarn Belt tunnel project is proposed. Located at
strategic sites such production facilities could be maintained for several
years supplying WECs to designated locations.
The size of the wave farm depends on how many structures will be
deployed side by side in an array. The WEC should be optimised to
suit the specific site i.e. the Danish part of the North Sea or more
exposed Atlantic sites or any other location with suitable wave
conditions and infrastructure.
The wave energy is absorbed by the OWC chambers in which the water
oscillates up and down. This up and down motion of the water in each
chamber pushes and pulls air in and out via air turbines that drive
electrical generators. High efficient air-turbines suited for the
conversion are under development in Portugal (Falcão, 2015).
The wave energy converter is moored at the bow of the structure using
a turret mooring system – and an additional optional mooring line can
be attached to the stern (aft) for practical or safety reasons. The wave
energy converter is intended to turn itself towards the incoming waves
– but a slight angle to the wave can often increase the overall
absorption by increased absorption on the side facing the incoming
waves.
Figure 2 Impression of the KNSWING WEC Concrete Structure
Main data and dimensions of the KNSWING WEC structure are shown
in Table 1 for two different characteristic length 150m and 240m long.
Table 1 Main dimensions and data of the proposed structure KNSWING L=150m L=240m
Rated absorbed Power @ Hs = 5m 2500 kW 10000 kW
Annual absorbed energy (North Sea) 6.557 MWh 13601 MWh
Length L 150 meter 240 meter
Beam B 19.5 meter 28.80 meter
Height H 12 meter 16.8 meter
Beam of buoyance chamber b 6.5 meter 8 meter
Draught D 8 meter 12.8 m
Freeboard: 2.5 meter 4 meter
Weight 12.000 ton 45.000 ton
Displacement 12.000 m^3 45.000 m3
LOCATION IN THE NORTH SEA
The wave energy resource increases with the distance from shore and in
the central part of the Danish Part of the North Sea. At 200 km distance
from the west coast of Jutland the wave energy resource reaches about
16 - 24 kW/m (Ramboll, 1999). The water depth at this distance is
typically between 40 and 60 meters and the maximum wave conditions
with a significant wave height of about Hs=12 meters.
Figure 3 Location of a conceptual 150km long WEC farm located
200 km from shore in the Danish part of the North Sea. Also the
directional distribution of waves are indicated with a wave rose.
As an example, a 1400 MW wave energy plant up to 150 km long is
indicated on Fig. 3. This wave plant consists of 7 modules of 200 MW
offshore transformer platforms and to which WECs are electrically
connected. An additional two platforms equipped with HVDC
equipment are located at each end converting the electricity from the
seven transformer platforms to DC power and transmitting it to the
shore over a distance of 200 km.
Other interests at sea such as oil and gas production, fisheries and
transportation must be considered in order to get the necessary permits
for energy production.
CONCRETE PRODUCTION FACILITIES
It is important for cost efficiency that the attenuators can be built in
series production. This could be achieved by adopting the production
and installation methodology used at projects such as the tunnel
element fabrication of the Fehmarn Belt crossing illustrated in Fig.4.
Figure 4 Fehmarn Belt Concrete fabrication facilities
720

The cost of reinforced concrete produced in such a rational way is
estimated in the order of 260 $/ton. With a production speed of 5000 m3
(12500 ton) concrete/week it will take one week to build one WEC unit
of 150 meter and about 3.75 weeks to build the 240 meter version.
POWER TAKE OFF (PTO)
The conceptual design of the WEC includes 40 air turbine-generators,
converting the wave-induced pneumatic power into electricity. The
airflow reverses its direction twice in a wave cycle, the amplitude of
each wave is largely random and the power varies with the sea state.
The twin-rotor air turbine concept illustrated in Fig. 5 developed by
Antonio Falcao is so far the most efficient self-rectifying air turbine,
proposed and tested, with a peak efficiency of 85% (Falcão 2015).
Figure 5 Twin-rotor self-rectifying turbine
The PTO technology is not completely developed, but it has the
potential to integrate sub-optimal control. Latching control implies that
the airflow is blocked for a period to allow pressure (or vacuum) to
build up and then letting the air flow with greater pressure and velocity
– leading to increased power absorption. Control of a multi-element
wave energy converter is a complex task, and control requires some
prediction of the excitation forces. In this case the row of OWC
columns placed after each other, allows the pressure monitored in the
front chambers to be used for prediction of the excitation upon the
following ones.
The valve position shown in (Fig. 5a) allows the airflow to flow out of
the OWC chamber, and (Fig. 5c) position allows the air to flow into the
OWC chamber maintaining the same direction of rotation on the
turbine and generator. To implement control strategies for the air
flow/water column motion Fig. 5.b shows the valve position that can
close the in- and outlet flow for a fraction of the wave period. The
closed position can also be used for safety reasons (Hs > 8.5 m) or for
maintenance.
In sea conditions with Hs >= 5 m the WEC will deliver the rated power
– the rated power is the average power produced over 30 minutes.
Power peaks might occur for short durations associated with individual
waves, this might temporary “overload” of the individual generators.
The rated power definition is used to normalize the CAPEX.
The 40 air turbines on the WEC each drive a variable speed generator.
The power from each generator is rectified to DC and stored in a
battery. Before transmitted from the WEC the power is converted back
to AC and transformed to 11kV before being transmitted from the
WEC to the sea bed via the umbilical shown on Fig. 9.
MOORING
The mooring system is being analyzed as part of a Danish Research
Project “Mooring Solution for Large Wave Energy Converters” led by
Aalborg University in which mooring solutions for four different
WECs are being investigated (Thomsen et al., 2015 and Thomsen J.B,
2016). The use of synthetic ropes for mooring materials is being
investigated and a scale model of such a mooring system has been
tested on the KNSWING as part of the second round of Marinet.
A conceptual design of the mooring system is shown in the Fig 6.
Figure 6 The conceptual design of the turret mooring system
The mooring system is composed of 6 mooring lines of synthetic rope
with a length of 200 m. A numerical model of the KNSWING has been
developed using the software package OrcaFlex (Orcina, 2016) and the
BEM code NEMOH (Barbarit 2015).
The survival condition was modelled using the Northsea design
conditions with a sea state of 50 year return period with Hs = 9.9 m and
Tp 14.1 s combined with a wind velocity of 39.9 m/s and current of
1m/s. All environmental loads were assumed to act in the same
direction. The WEC was allaowed to surge 44 meter with a waterlevel
variation of 1,6 meter. The model assumed the use of a braided nylon
rope with a non-linear stiffness curve corresponding to a Viking
Braidline Nylon rope Ø198mm (Bridon, 2016). Based on these
assumptions a maximum mooring load of 2456 kN was calculated
leading to a safety factor of 3. An optimization routine was
subsequently applied to the KNSWING to find optimial mooring layout
(Thomsen et al., 2018). Longer lines lead to a softer mooring system
and smaller loads, but this must be balanced against increased cost and
WEC spacing requirements. The morings are on a conceptual level
attached to drag embeded anchors.
A
B
721

INSTALLATION
The deployment plan includes the following major operations:
1. Installation of Grid connection cable(s) to shore
2. Installation of Transformer Platforms at site
3. Installation of mooring piles for the array
4. Interconnection cables for the WECs to platforms
5. Interconnection cables between the platforms
6. WEC Tow-out and connection to moorings and umbilical cables
The WEC will be towed in position using a combination of tugboats
and possibly its own propulsion unit. With a speed of 6 knots (12 km/h)
it will take about 20 hours from production facility to location. The
installation of the mooring system will need to be developed in such a
way that this is prepared and ready for attachment of the WEC.
GRID CONNECTION
The components involved in collecting the power from the WECs are
called the Wave Power Aggregation system and the part that transmits
the aggregated power is called the Electrical Wave Power Delivering
system. To create an overview, the parts involved in the Wave farm
have been given an identification number as shown in Table 2.
Table 2 Identification system for the Wave farm
ID
System,
Subsystem,
Component
Function
01 WEC DEVICE Convert wave energy into
transportable energy
02
WAVE POWER
AGGREGATION
SYSTEM
Aggregate power from the different
WEC devices
0200 Dynamic electrical
cables
Umbilical transport power from
WEC to sub-sea hubs
0210 Sub-sea hubs Aggregate power from WEC
0220 Intra-array
electrical cables
Transport power from sub-sea hub to
next hub’s and ultimately to Platform
0221 cables to platform 2*2.0 km 36kV 20.000kVA
0222 cables to platform 2*3.8 km 36kV 20.000kVA
0223 cables to platform 2*5.6 km 36kV 20.000kVA
0224 cables to platform 2*7.4 km 36kV 20.000kVA
0225 cables to platform 2*9.2 km 36kV 20.000kVA
0230 Substation/Platform
Platform that aggregate power from
the inter array cables and supports
the Trafo/Breaker
0240 Trafo station Trafo/Breaker 36/160kV 200MVA
0250 Intra-array
electrical cables
20 km Transport power from
previous Platform to next 160kV
03
ELECTRICAL
WAVE POWER
DELIVERING
SYSTEM
Deliver electrical power to the grid at
Point of Connection
0310 HVDC offshore
converter station
Platform Offshore transformer
(160/400kV) to convert 1400 MW to
HVDC (depending on the distance)
0320 Export cables 250 km DC cable to the shore
0330 HVDC Onshore
substation
Transform from DC to AC Condition
power for delivery to the grid
ID 0200 the Umbilical Cable from the WEC is shown on Fig. 7 and is
attached to the front of the WEC at the turret, and connected to a subsea
junction box and transformer 6kV/36kV. The umbilical will be
designed to export the rated power Prated from the WEC at a voltage of
about 6kV suited to the architecture of the Umbilical.
Figure 7 ID 0200 The umbilical
The ID 0210 submerged connecters and transformers (6/36 kV)
connect to ID 0220 Inter array submerged electrical cables of 36kV. ID
0221 to 0225 indicate that the submerged cables are of incremental
length (to each side of the aggregation platform) to collect wave power
over a distance of 20 km and deliver a maximum of 20 MW to a fixed
offshore 200 MW transformer platform ID 0230. On the platforms are
placed Transformer Breaker of 200 MVA given the ID 0240. The
above description is illustrated on Fig. 8. The number of platforms
depends on the total size of the Farm.
Figure 8 The inter-array power agregation system connecting the
WECs to the Subtation/Platform ID 0230
Th aggregation platforms are interconnected with ID 0250 160 kV AC
power cables designed to transport the total rated power of the plant.
The design of the Electrical Wave Power Delivering System ID 03 will
depend on the location and the distance to shore. In cases with a
distance larger than about 150 km, a High Voltage Direct Current
(HVDC) connection is proposed. If in addition the wave farm is very
large, two cables are proposed to transmit the full power to shore (as
shown on Fig. 3) thereby giving a redundancy in the power delivering
system. In this case the offshore platform ID 0310 includes,
transformer and converter station including the HVDC conversion
equipment. The DC power cables ID 0320 are designed to transport the
full rated power of the plant at 400 kV. It is also possible that the
HVDC transmission scheme connects with another country and
thereby enables power to be transmitted between countries in both
directions when and if the wave power plant is not running at its full
capacity. On the shore a HVDC station ID 0330 is connecting the farm
to the land based grid.
722

WEC FARM MAINTENANCE COST AND AVAILABILITY
The target cost of maintenance per year is about 2% of the CAPEX and
the target availability is 98%. This requires a suitable choice of durable
components combined with a strategic proactive maintenance plan.
The maintenance requirements of the WEC farm are typically related to
the mechanical components with a lifetime smaller than the design life
of the structure. This is the turbo machinery, the electrical equipment
and the mooring system.
The turbo equipment is foreseen to be periodically removed for
overhaul and replaced with newly maintained turbine/generator units.
The electrical equipment will be checked in relation to each overhaul –
and the mooring system monitored for tension in order to predict
maintenance.
PERFORMANCE
Depending on the target location, different generic linear relationships
between significant Wave Height Hs and Average Wave Period Tz can
be found to make an initial estimate of the device performance at a
specific location. Testing in just five sea states representing the most
frequently occurring sea states can provide a relatively accurate picture
of the device performance at that site as described in the report under
IEA-OES (Nielsen & Pontes 2010). A linear relation between the most
frequent wave period Te ave and the significant wave height is proposed
as Te ave = A*Hs + B [sec] relations for other sites such as Belmullet,
Norway, Atlantic and the North Sea. A summary of the calculated
performance combining the generic sea conditions with measured
energy absorption is shown in Table 3.
Table 3 Calculated performance based on scaled up test results to the
L=240 m and L=150 m KNSWING at different generic ocean sites. Belmullet Norway Atlantic North Sea
Pw Resource [kW/m] 72 42 26 20
Eabs L=240 [MWh/year] 30188 22504 16160 13601
ACWR L=240 0.20 0.25 0.30 0.32
CF L=240 0.34 0.26 0.18 0.16
Eabs L=150 [MWh/year] 12772 9960 7867 6557
ACWR L=150 0.13 0.18 0.23 0.25
CF L=150 0.42 0.32 0.26 0.21
The Average Capture Width Ratio (ACWR) is calculated as
8760** LPw
EabsACW R (1)
the average absorbed energy Eabs [kWh/y]
the average incident wave power resource Pw [kW/m]
the length of the structure L [m]
hours over a year (8760)
The Capacity Factor CF is calculated as:
8760*ratedP
AEPCF (2)
AEP is the Annual Energy Production from the Farm
Prated is the rated power or the plant (200MW)
LEVILICED COST OF ENERGY (LCOE)
The cost of energy calculation is important even at an early stage of
development to quantify the cost and identify the cost centres of the
WEC farm as described in the OES LCOE study (OES 2015).
The cost of an array of 200 MW has been considered, and the cost of
energy is simplified to the estimation of CAPital EXpenditure
(CAPEX), OPErational EXpenditure OPEX and Annual Energy
Production AEP combined with a financial interest at Fixed Charge
Rate FCR cost
AEP
OPEXFCRCAPEXLCOE
* (3)
The Rated Electrical Power is calculated based on measured absorbed
power in a scaled sea condition of Hs = 5m and the assumed PTO
conversion efficiency (at this stage 50%). Based on this value, the
number n of WECs needed to build a 200 MW wave farm is calculated.
In Table 4 below it is seen that it will require 40 WECs of length
L=240 m and 114 WECs of 150 m. The length of the 200MW
installation assumes that each device is placed side by side with one
device length interspacing (n * L).
The AEP per WEC is based on the values derived from model
experiments as shown in Table 3 for the North Sea location. The annual
energy production of the farm is calculated by multiplying with the
number of devices and their PTO efficiency and availability.
Table 4 per 200 MW wave farm module KNSWING L=150m L=240m
Rated Electrical Power of WEC Plant (MW) 200 200
Number n of WECs installed 114 40
Maximum absorbed Power per WEC [kW] (at Hs=5.5meter)
3500 10000
Rated Electrical Power per WEC [kW]
(at Hs=5.5meter)
1750 5000
Annual absorbed Energy per WEC (MWh/y) 6557 13601
Distance to shore (km) 250 250
Water depth (m) 45 45
Length of installation (km) 17 10
Mean Resource Level (kW/m) 20 20
PTO efficiency% 50% 50%
Availability% 98% 98%
AEP Annual Energy Production MWh/y 367.192 266.580
CAPEX (*1.000.000 $) (1$=6DKK) L=150 m L=240 m
Project development and production facility 79 79
Structure and prime mover 411 528
Power Take-off 83 83
Moorings and Foundations 86 107
Installation 50 67
Grid connection (200 km) 333 333
CAPEX Total 1043 1197
Project lifetime (years) 25 25
OPEX (50% CAPEX/lifetime) 18 21
FCR (%) 10% 10%
AEP [MWh/y] 367.192 266.580
CF 0.21 0.15
LCOE $/kWh 0,33 0,53
723

TECHNOLOGY PERFORMANCE LEVEL (TPL)
The described KNSWING system was used as an initial test case in the
Structured Innovation/Wave-SPARC Project by NREL and Sandia in
the US for the development of a TPL assessment methodology. The
origin of this methodology is described by Weber (2012, 2013) and has
been further developed with respect to questions about stakeholder
capabilities as described in (Barbarit et al. 2017). Each capability is
divided into a number of sub and sub-sub capabilities which from a
stakeholder point of view can be evaluated with a score from 1 – 9. The
score of each capability is then combined into an overall TPL score as
shown in the summary Table 5 below. The performance level in this
case to a score of 7.1 based on the combined individual capabilities.
Table 5 Technology Performance Level TPL assessment of Capabilities Summary: KNSWING 2016, TRL 1-2
Technology Performance Level: 7.1
C1 Have market competitive cost of energy 6.1
C1.1 Have as low CAPEX as possible 7.0
C1.2 Have as low an OPEX as possible 6.7
C1.3 Be able to generate large amount of electricity from
wave energy
4.7
C1.4 Have high availability 7.2
C2 Provide a secure investment opportunity 5.7
C2.1 Be survivable 5.1
C2.2 Be low risk under design conditions 6.3
C3 Be reliable for grid operations 7.5
C4 Be beneficial to society 7.9
C5 Be acceptable for permitting and certification 9.0
C6 Be acceptable w.r.t safety 7.3
C7 Be deployable globally 9.0
The assessment was in this case done by the developer (main author of
this paper). Experts are currently testing the TPL assessment
methodology to develop it further toward a robust, unbiased evaluation
methodology suitable for industrial guidance and use (Bull, et al. 2017).
EXPERIMENTAL/THEORETICAL DEVELOPMENT
The performance and mooring loads have been developed using a
combined experimental and numerical approach. In this section some of
the experimental results are presented.
Fig. 9 and10 shows the experimental model built in wood, it is 3 meter
long and including 40 OWC chambers (20 on each side). The damping
to be applied by the air turbine to each chamber is modelled by a hole
in the roof of each OWC chamber with an area of about 1 % of the
chamber water surface area (Ø14 mm).
Fig 9 Cross-section of the experimental model numbers in mm.
Figure 10 The experimental model
The initial tests were conducted at HMRC basin Ireland in 2013 and in
2015 two rounds of testing were carried out at QUB shallow water
basin in Portaferry to further investigate survival, mooring design and
optimization. Using the same physical model and model sea conditions
at both locations a comparison between the results obtained at the 1m
deep HMRC basin and the 0.55m deep Queens facility was possible.
This can be seen in Fig. 11 as a difference between the blue (0.55m
deep) and dashed green curve (1.0m deep)
Experimental Setup & Variables Measured
The waves were measured using four wave probes. The motion of the
WEC was monitored using a motion tracking system. The time series
included 211 data points with a sample period of 0.031 sec. The
experiments were structured in a series of regular and irregular waves.
The regular wave experiments of different periods and heights were
prepared in three groups of constant steepness (H/λ constant). However,
the waves generated in basins with different depth result in different
wave length for the same wave period. A wave with period T=2
seconds and a steepness of 2.5 % will in the 0.55m deep basin have a
length λ=4.2m, height 0.105m and energy flux 23.9W/m compared to
λ=5.2m, wave height 0.130m and energy flux 39.0W/m the 1m deep
basin. Experiments and theory (Fig. 11) indicate that the Capture Width
Ratio CWR is about twice as high in the shallow wave basin for these
longer wave periods of constant steepness. For shorter wave periods (<
1.5 second) results are very similar from both locations.
Figure 11 CWR in regular waves of steepness 2,5%
The influence of water depth on the wave length, group velocity and
power are fundamental and important to include when planning scale
experiments that replicate a certain location. Also in relation to
replicating the mooring geometry, the water depth is very important.
724
Theoretical and numerical validation
Following the initial testing at HMRC a numerical model was
developed for the system (Ducasse, 2014) and further described in
(Bingham, 2015) for comparisons with the performance in regular
waves. The 40-chamber I-Beam attenuator-type, oscillating water
column, wave energy converter is analysed numerically based on
linearized potential flow theory, and experimentally via model test
experiments. The high-order panel method WAMIT by Newman and
Lee (WAMIT; 2014,) is used for the basic wave-structure interaction
analysis. The damping applied to each chamber by the power take off is
modelled in the experiment by forcing the air through a hole with an
area of about 1 % of the chamber water surface area. In the numerical
model, this damping is modelled by an equivalent linearized damping
coefficient which extracts the same amount of energy over one cycle as
the experimentally measured quadratic damping coefficient.
The pressure in each chamber in regular waves of three different
height-to-length ratios is measured in the experiments and compared to
calculations. The model is considered in both fixed and freely floating,
slack-moored conditions. Comparisons are also made to experimental
measurements on a single fixed chamber. The capture width ratio CWR
express the Absorbed Power by the device over the incoming wave
power over a wave front with the same length as the length of the
device. The absorbed power is in each experiment calculated based on
the pressures measured in the OWC chambers. Fig. 11 show a good
agreement between the calculations and the experiments. The irregular
wave experiments were divided into 6 different series as shown in
Table 6, which would enable investigation of different aspects related
to seakeeping and performance and survivability, such as influence of
spectral shape, directional spreading and wave period variations at
constant Hs.
Table 6 Test series of irregular waves Series 1 Long crested Brechtschneider Spectrum
Series 2 Spectrum Variation of Period
Series 3 Long crested JONSWAP
Series 4 Short crested
Series 5 Variation of spreading
Series 6 Survival conditions
In general, the results of the scaled-up performance showed in (Fig. 12)
confirmed a good agreement between measurements carried out in
Portaferry and experimental results obtained at HMRC. At both test
locations the experiments showed that the structure absorbed 30 - 50%
more power in short crested irregular waves (wave spectrums that
included directional spreading) compared to long crested waves.
Figure 12 The experimental results in irregular waves
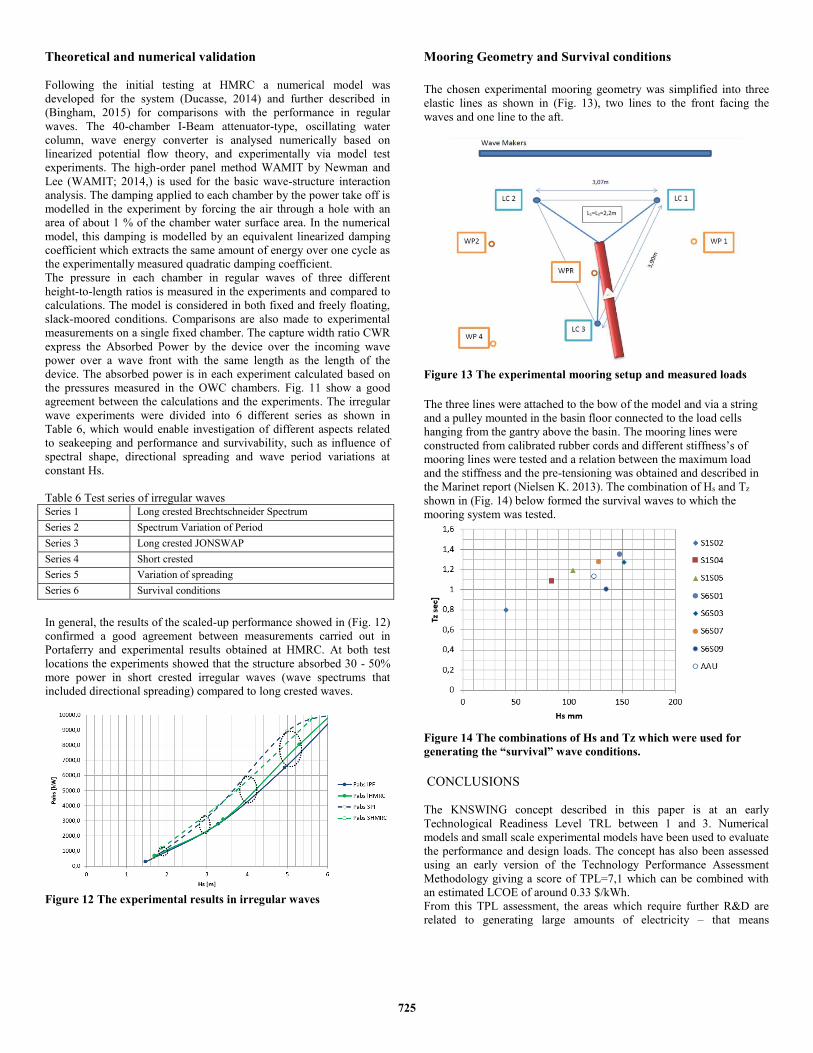
Mooring Geometry and Survival conditions
The chosen experimental mooring geometry was simplified into three
elastic lines as shown in (Fig. 13), two lines to the front facing the
waves and one line to the aft.
Figure 13 The experimental mooring setup and measured loads
The three lines were attached to the bow of the model and via a string
and a pulley mounted in the basin floor connected to the load cells
hanging from the gantry above the basin. The mooring lines were
constructed from calibrated rubber cords and different stiffness’s of
mooring lines were tested and a relation between the maximum load
and the stiffness and the pre-tensioning was obtained and described in
the Marinet report (Nielsen K. 2013). The combination of Hs and Tz
shown in (Fig. 14) below formed the survival waves to which the
mooring system was tested.
Figure 14 The combinations of Hs and Tz which were used for
generating the “survival” wave conditions.
CONCLUSIONS
The KNSWING concept described in this paper is at an early
Technological Readiness Level TRL between 1 and 3. Numerical
models and small scale experimental models have been used to evaluate
the performance and design loads. The concept has also been assessed
using an early version of the Technology Performance Assessment
Methodology giving a score of TPL=7,1 which can be combined with
an estimated LCOE of around 0.33 $/kWh.
From this TPL assessment, the areas which require further R&D are
related to generating large amounts of electricity – that means
725

demonstrating that the conversion efficiency can be increased above
50% and further that the structural design is survivable – that means
how the mooring system and concrete structure and reinforcement
should be designed to deal with the expected loads.
ACKNOWLEDGEMENTS
The work described has received support from MARINET, a European
Community-Research Infrastructure Action under the FP7 “Capacities”
Specific Programme. Thanks to dedicated assistance received from
HMRC with a special thanks to Florent Thiebaut, Nail, Tony Lewis and
Brian Holmes and from Queens University to Björn Elsäßer, Trevor
Whittaker, Paul Lamont-Kane and David Crooks, and the great effort
by the DTU students, Morten Simonsen, Frederik Pors, Oliver
Billeskov, Damien Ducasse and senior scientist Robert Read.
Acknowledgement also to EUDP the Energy Technology Development
and Demonstration Program funding the Danish RD&D project
“Mooring Solution for Large Wave Energy Converters”. Thanks to
Antonio Falcao for his advice concerning air-turbines and Stephen
Salter on the advice in pressure sensors. Thanks to the Structured
Innovation/Wave-SPARC team Jochem Weber, Ronan Castello, Diana
Bull, Aurélien Babarit, Ben Kennedy and Jesse Roberts for the
opportunity to help test and develop the TPL methodology. The support
of Ramboll is gratefully acknowledged including the development of
the conceptual design of the concrete structures by Peter Vangsgaard.
REFERENCES
Babarit, A, Delhommeau, G (2015). “Theoretical and numerical aspects
of the open source BEM solver NEMOH” In Proc. of the 11th
European Wave and Tidal Energy Conference (EWTEC2015),
Nantes, France.
Babarit, A, Bull, D, Dykes, K, Malins, R., Nielsen, K., Costello, R.,
Roberts, J., Bittencourt-Ferreira, C., Kennedy, B, Weber, J. (2017).
“Stakeholders requirements for commercially successful wave energy
converter farms” Renewable Energy, Elsevier,113, pp.742 – 755
Bingham B, H, Ducasse, D, Nielsen, K, Read, R. (2015).
“Hydrodynamic analysis of oscillating water column” J. Ocean Eng.
Marine Energy 1 (4) 405–419.
Bridon (2016). “Wire and Fibre Rope Solutions” [Online]. Available:
http://www.bridon.com/uk/.
Bull, D, Costello, R., Babarit, A., Nielsen, K., Bittencourt Ferreira, C.,
Roberts, J., Weber, J. (2017). “Scoring the Technology Performance
Level (TPL) Assessment”, Proc. Twelfth European Wave and Tidal
Energy Conference, Cork, Ireland, 2017
Bull, D, Costello, R., Babarit, A., Nielsen, K., Bittencourt-Ferreira, C.,
Roberts, J., Kennedy, B., Weber, J. (2017). Systems Engineering
applied to the development of a Wave Energy Farm”, Proc. 2nd
International Conference on Renewable Energies Offshore, Lisbon,
Portugal, 2017
Ducasse D. (2014). “A Theoretical and Experimental Study of an
Oscillating Water Column Attenuator” (Master’s thesis), Tech. U. of
Denmark, Lyngby, Denmark,.
Falcão A.F.O. Gato L, et al (2015). “A novel twin-rotor radial-inflow
air turbine for oscillating-water-column wave energy converters.”
Energy, http://dx.doi.org/10.1016/j.energy.2015.10.046
Moody, G.W. (1979). “The NEL Oscillating Water Collumn, Recent
Developments” Proceedings of the First Symposium on Wave Energy
Utilization. Gothenburg, Sweden
Nielsen, K and Bingham, H. (2015) “MARINET experiment
KNSWING testing an I-Beam OWC attenuator” International
Journal of Marine Energy, 12, 21–34
Nielsen, K. (2013). Marinet report, http://www.fp7-marinet.eu/access-
menu-post-access-reports_KNSWING.html.
Nielsen, K, and Pontes T. (2010) Report T02-1.1 OES IA Annex II
Task 1.2 Generic and Site-related Wave Energy Data, Ocean Energy
Systems IEA.
OES (2015). “International Levelised Cost Of Energy for Ocean
Energy Technologies” Ocean Energy Systems IEA
https://www.ocean-energy-systems.org/news/international-lcoe-for-
ocean-energy-technology/
Orcina (2016) https://www.orcina.com/SoftwareProducts/OrcaFlex/
Rambøll, DMI and DHI (1999). ”Kortlægning af bølgeenergiforhold i
den danske del af Nordsøen” Energistyrelsen.
Stansell, P. and Pizer DJ. (2013). “Maximum wave power absorption
by attenuating line absorbers under volume constraints” Applied
Ocean Research, 40:83–93
Thomsen, J. B., Ferri, F., & Kofoed, J. P. (2015). Assessment of current
state of mooring design in the Danish wave energy sector. In
proceedings of European Wave and Tidal Energy Conference
Thomsen, J.B, Kofoed J.P, Delaney M, Banfield S. (2016). Initial
Assessment of Mooring Solutions for Floating Wave Energy
Converters, Proceedings ISOPE.
Thomsen, J. B., Ferri, F., Kofoed, J. P., & Black, K. (2018). Cost
Optimization of Mooring Solutions for Large Floating Wave Energy
Converters. Energies, 11(1), 159.
Weber J.W. (2012) “WEC technology readiness and performance
matrix – finding the best research development trajectory” Proc. 4Th
International Conference on Ocean Energy (ICOE2012), Dublin,
Ireland
Weber J.W., Costello R., Ringwood J. (2013) “WEC Technology
Performance Levels (TPLs) – metric for successful development of
economic WEC technology” Proc. Of the 10th European Wave and
Tidal Energy Conference (EWTEC2013), Aalborg, Denmark
726


