Download - On Path to Long-Term Value

On Path to Long-Term Value
IVL Capital Markets Day 2018
February 22, 2018
2017 Financial Results
Sanjay Ahuja, CFO

2017 Financial ResultsDelivering On Expectations
3
+30%YoY
Core Net Profit
$459M
+68%YoY
Core EPS after PERP
THB 2.91
+63%YoY
EPS after PERP
THB 3.98X
+26%YoY
Core EBITDA$1,004M
Production9.1MMt
+4%YoY

4
Solid Financial PerformanceStrong Earnings Momentum Continues
EBITDA/ton ($/MT) EBITDA Margin (%)
ROCE (%) ROE (%)
82 91 91 89 110
2013 2014 2015 2016 2017
6% 8% 9% 11% 12%
2013 2014 2015 2016 2017
6% 8% 10% 11% 12%
2013 2014 2015 2016 20173% 6% 8%
13% 17%
2013 2014 2015 2016 2017
Note: Core Financials
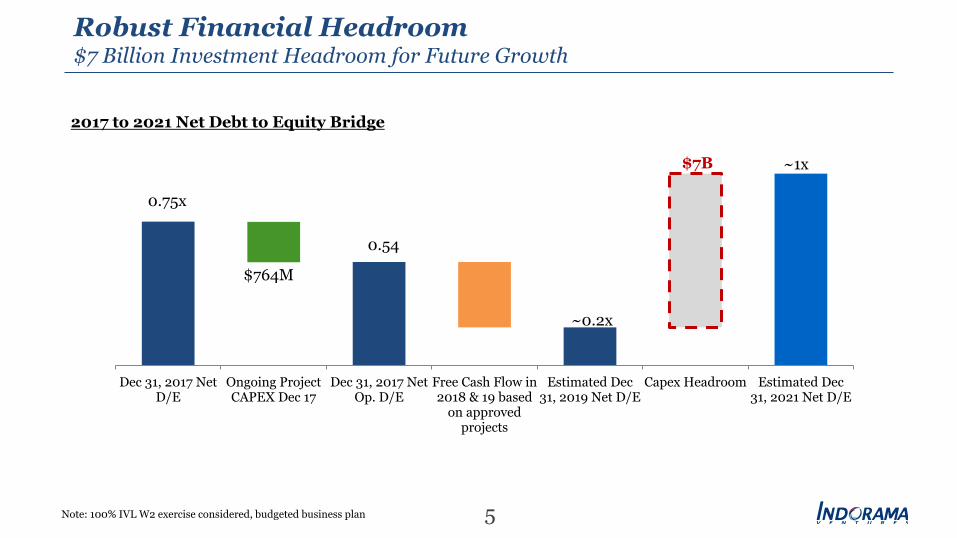
Robust Financial Headroom$7 Billion Investment Headroom for Future Growth
5
Dec 31, 2017 Net D/E
Ongoing Project CAPEX Dec 17
Dec 31, 2017 Net Op. D/E
Free Cash Flow in 2018 & 19 based
on approved projects
Estimated Dec 31, 2019 Net D/E
Capex Headroom Estimated Dec 31, 2021 Net D/E
Note: 100% IVL W2 exercise considered, budgeted business plan
0.75x
0.54
$764M
~1x$7B
~0.2x
2017 to 2021 Net Debt to Equity Bridge

Delivering On Our Business Strategy
D.K. Agarwal, CEO PET & Feedstock

Favorable Industry TrendsIndustry Fundamentals Reflect Positive Changes
7
Strong polyester consumption growth
China import waste ban creates more demand for virgin materials
Global capacity balancing
Asia PTA margin recovery with positive impact on global PTA and PET
Rising freight and duties further increasing import parity2H17-2021
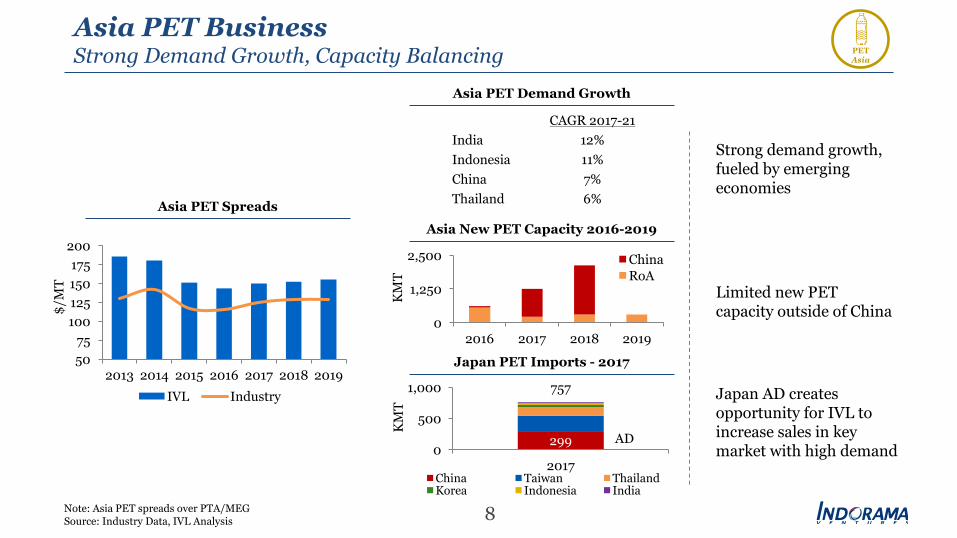
Asia PET BusinessStrong Demand Growth, Capacity Balancing
8
CAGR 2017-21India 12%Indonesia 11%China 7%Thailand 6%
0
1,250
2,500
2016 2017 2018 2019
ChinaRoA
299
757
0
500
1,000
2017China Taiwan ThailandKorea Indonesia India
KM
TK
MT
Asia PET Demand Growth
Asia New PET Capacity 2016-2019
Japan PET Imports - 2017
Strong demand growth, fueled by emerging economies
Limited new PET capacity outside of China
Japan AD creates opportunity for IVL to increase sales in key market with high demand
AD
PET Asia
5075
100125150175
200
2013 2014 2015 2016 2017 2018 2019IVL Industry
Asia PET Spreads
$/M
T
Note: Asia PET spreads over PTA/MEGSource: Industry Data, IVL Analysis

Asia PTA BusinessLower Inventory Levels, Higher Demand Growth, Capacity Balancing
9
0
5
10
15
20
25
30
Jan-14 Jan-15 Jan-16 Jan-17
4 days
20 days
29 days
0
50
100
150
200
250
300
China PTA Inventory
PTA
Spre
ads (
$/M
T)
Effective PTA Capacity – 2022 Basis(KMT)
2018 Demand69 KMT
2022 Demand86 KMT
Global PTA Cost Curve
Day
s
300
250200
150100
50
0
China's PTA inventory end-2017 at its lowest level in last 4 years
China import waste ban creates more demand for PTA
PTA industry spreads will need to continue to improve to justify new investment and plant restarts
PTA
Asia
5075
100125150175
2013 2014 2015 2016 2017 2018 2019
IVL Industry
Asia PTA Spreads
$/M
T
Note: Asia PTA spreads over PXSource: Industry Data, IVL Analysis

Asia Fibers BusinessChina Supply-Side Reforms, China Import Waste Ban
10
China PSF Production
China import waste ban increases demand for virgin fibers
Reducing China cotton supply supports fiber business
Rising recycle feedstock costs pushes virgin PSF margins up
4.06.08.0
10.0
2014 2015 2016 2017 2018 2019 2020 2021Virgin Recycle
MM
t
10,000
7,000
5,000
2000
0
RM
B/M
T
2016 2017 2M18
Virgin PSF PriceRecycle PSF Price
Virgin Raws
Fibers Asia
Asia PSF Spreads
100
150
200
250
300
2013 2014 2015 2016 2017 2018 2019
IVL Industry
$/M
T
China Cotton Supply (MMt)
0102030
13/14 14/15 15/16 16/17 17/18 18/19 19/20 20/21 Demand Imports Production Beginning stocks
China PSF Values
Note: Asia PSF (Polyester Staple Fiber) spreads over PTA/MEGSource: Industry Data, IVL Analysis

West PET BusinessIncreasing Import Parity with Higher Asia PTA, Rising Freight Rates
11
Asia to EU PET Import Parity Drivers-2017/16
US Non-NAFTA PET Imports - 2017
600
0
350
700
2017Brazil Indonesia KoreaTaiwan Pakistan Others
KM
TAD Case490 KMT
0
10
20
30
Asia PTA Margins Increase
Ocean Freights Increase
$/M
T Increase in Asia PTA margins, rising freight rates and other factors as import parity goes up
US PET AD case against 5 countries moving forward
PET West
West PET Spreads
100
150
200
250
300
2013 2014 2015 2016 2017 2018 2019
IVL Industry
$/M
T
Note: West PET spreads over PTA/MEGBased on IVL NAM and EMEA production mixSource: Industry Data, IVL Analysis

West PTA BusinessImport Substitution, Increasing Asian Margins and Freights
12Note: West PTA spreads over PXBased on IVL NAM and EMEA production mixSource: Industry Data, IVL Analysis
Well-established and balanced Western PTA marketplace
EU PTA with substantial import substitution potential (~1,000MMt ~1/3 of demand)
Artlant to partly replace imports
Increase in Asia PTA margins and rising freight rates with positive impact on EU PTA as import parity goes up
West PTA Producers - 2018
EU PTA Demand 2014-2017
Asia to EU PTA Import Parity Drivers-2017/16
0102030
Asia PTA Margins Increase
Ocean Freights Increase
$/M
T
0.0
3.0
6.0
NAM EUIVL BP Alpek PKN EMNCa
paci
ty (M
Mt)
3 producers4 producers
0%
25%
50%
0
1,000
2,000
3,000
2014 2015 2016 2017Domestic Imports Imports Share
KM
T
PTA
West
West PTA Spreads
100
150
200
250
300
2013 2014 2015 2016 2017 2018 2019
IVL Industry
$/M
T

<5 yrs
West MEG BusinessCapturing Integrated Margins in Upcycle Scenario
13Note: US MEG spreads over ethyleneSource: Industry Data, IVL Analysis
80% 82% 79% 80% 77% 80% 81% 80%
60%
70%
80%
90%
2012 2013 2014 2015 2016 2017 2018 2019
Global MEG Operating Rates
Util
izat
ion
(%)
1,6001,4001,2001,000
800600400200
0
Mid
dle
East
Nor
th A
mer
ica
Wes
t Eur
ope
Asia
(e
xcl.
Chin
a)
Chin
a
Oth
erLa
tin A
mer
ica
Rus
sia
& C
aspi
anCh
ina
MTO
/CTO
50,0000 100,000 150,000
1,400 2,500
IVOL New Greenfield0
1,0002,0003,000
Regional Ethylene Production Cost 2020
Brent: $75/bbl Henry Hub NG: $2.85/MMBTU
>7 yrsPayback
Cracker Investment Cost $/
MT
$/M
T Et
hyle
ne
Global MEG market tight for at least 2018-2019 due to project delays
China import waste ban creates more demand for MEG
IVL is investing in one of the most competitive regions
Rising crude makes investment even more accretive
Highly attractive investment vs new build and right-sized
West MEG
US MEG spreads
0100200300400500600700
2013 2014 2015 2016 2017 2018 2019
IVL Industry
$/M
T

220 218205 194
217234 230
0
50
100
150
200
250
2013 2014 2015 2016 2017 2018 2019
Asia PET West PET Asia Fibers
Asia PTA West PTA US MEG
Weighted Average Spread
14
IVL Necessity Business On Recovery PathIndustry Margins Have Bottomed-Out, IVL at Premium to Industry
Industry Necessities Spreads ($/MT) IVL Necessities Spreads ($/MT)
195 193176 169
197217
201
0
50
100
150
200
250
2013 2014 2015 2016 2017 2018 2019
Note: Both Industry and IVL weighted average spreads based on IVL Necessities production mix, US MEG in 2018&19 include crackerSource: Industry Data, IVL Analysis
Nece-ssities
15
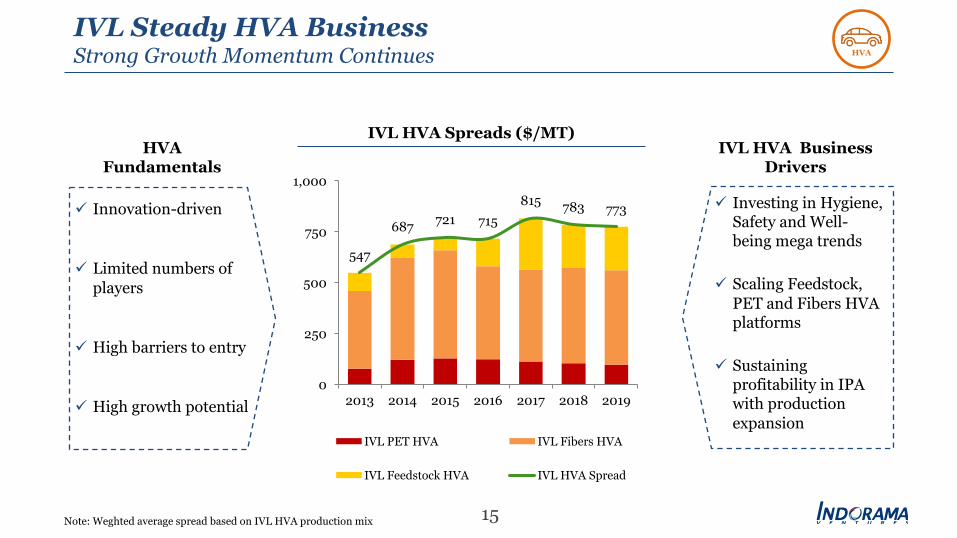
IVL Steady HVA BusinessStrong Growth Momentum Continues
ü Innovation-driven
ü Limited numbers of players
ü High barriers to entry
ü High growth potential
ü Investing in Hygiene, Safety and Well-being mega trends
ü Scaling Feedstock, PET and Fibers HVA platforms
ü Sustaining profitability in IPA with production expansion
HVA Fundamentals
IVL HVA BusinessDrivers
IVL HVA Spreads ($/MT)
547
687 721 715815 783 773
0
250
500
750
1,000
2013 2014 2015 2016 2017 2018 2019
IVL PET HVA IVL Fibers HVA
IVL Feedstock HVA IVL HVA Spread
HVA
Note: Weghted average spread based on IVL HVA production mix

16
IVL Necessities & HVA BusinessEnhancing Overall Margins
281 317 312
293 335 343 336
0
100
200
300
400
2013 2014 2015 2016 2017 2018 2019
Asia PET West PET Asia Fibers
Asia PTA West PTA US MEG
PET HVA Fibers HVA Feedstock HVA
Weighted Average IVL Spread (RHS)
Note: Weghted average spread based on IVL overall production mix, US MEG in 2018 and 2019 includes cracker
Nece-ssities
IVL Necessities & HVA Spreads ($/MT)
HVA

Creating Value with HVA
Uday Gill, CEO Fibers

IVL Ecosystem Fueled by Improving Customer ExperienceEnhanced Customer Experience Leads to Trust and Intimacy
Extra light composites for
automotive
Cuddly soft fibers for diapers
Recycled fibers for sustainability
IVL Select Solutions for Customer Experiences
in Fibers
18
IVL with Polyester at Our
Core
GDP++Growth
Hygiene
A&I
H&A
F&B
Propylene
IPA
Rayon
PA66
PP/PE
Packaging
Fabrics
Films
Ethylene
IPA
PX/MX
MEG
PTA
EU
Asia
NA ME&A
NDC

19
Global HVA Fibers Market with Strong Growth PotentialHVA Expected to Capture 50% of Incremental Demand by 2021
2 4 10
17 9
14
23
32
1980-1990 1990 – 2000 2000 – 2010 2010 – 2021
Industry Necessities Fibers
Industry HVA Fibers
Global Incremental Fiber Consumption (MMt)
Source: Industry Data, IVL Analysis

20
Expanding Our HVA Fibers PortfolioThrust on Auto, Industrial, Hygiene to Scale Up Capacities through M&A and Organic Growth
NAM EMEA Asia
IVL HVA Fiber Capacity by Region (KMT) IVL HVA Fiber Production by Segment (KMT)
0
100
200
300
400
2015
2016
2017
2018
2021
2015
2016
2017
2018
2021
2015
2016
2017
2018
2021
0
100
200
300
400
500
2015
2016
2017
2018
2021
2015
2016
2017
2018
2021
2015
2016
2017
2018
2021
Automotive Industrial Hygiene

21
Long Qualification Cycles Create Barriers to Entry HVA Boosts Brand Premium in Necessities Fibers
0 30 60 90 120 150
Tire cord fabric
Hygiene cover stock
Wipes and medical
Automotive interiors
Flame retardant fibers
Fillwell hygiene
Airbag yarn
2013 2014 2015 2016 2017
Qualification period
3 years
2.5 year
2 years
3 years
2.5 years
2 years
3 years
YoY volume growth (KMT)
Spre
ad ($
/MT)
HVA Fibers – Robust Value Driver for IVL Wide Economic Moats Created for Sustainable Growth
0
200
400
600
800
1,000
2014 2015 2016 2017
Published 1.4D Staple Fibers
IVL 1.4D Staple FibersIVL Essentials
IVL HVA
IVL Brand PremiumIVL Value Add
Premium
22
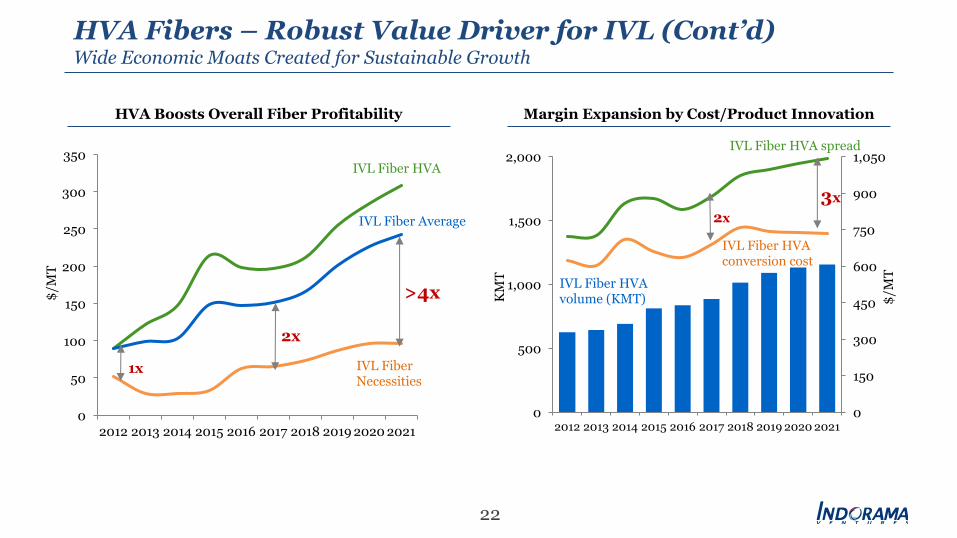
HVA Boosts Overall Fiber Profitability Margin Expansion by Cost/Product Innovation
0
50
100
150
200
250
300
350
2012 2013 2014 2015 2016 2017 2018 2019 2020 2021
IVL Fiber HVA
IVL Fiber Average
IVL Fiber Necessities
1x
2x
>4x$/M
T
0
150
300
450
600
750
900
1,050
0
500
1,000
1,500
2,000
2012 2013 2014 2015 2016 2017 2018 2019 2020 2021
IVL Fiber HVA conversion cost
IVL Fiber HVA volume (KMT)
3x2x
KM
T
$/M
T
IVL Fiber HVA spread
HVA Fibers – Robust Value Driver for IVL (Cont’d)Wide Economic Moats Created for Sustainable Growth
Growing Our Automotive and Tire Business
Arnaud Closson, MD Glanzstoff

IVL - A Global Leader in Tire ReinforcementAuto & Tire ~$0.9 Billion Business for IVL by 2019, Expanding at ~40% CAGR
24
0
250
500
750
1,000
2014 2015 2016 2017 2018 2019
~40%CAGR
IVL Auto & Tire Revenue ($m)
Note: Includes announced projects

Demographics and Wealth
Greater affluence amongst the middle class
Original Equipment Fitments
Integral part of vehicle Design
Increasingly Stringent Regulation
Regulations demanding higher fuel economy
New Product Developments
New technologies, specialized polymers, unique threads
Global Tire Market With Strong Growth PotentialCreates Opportunity for Investment through M&A and Organic Growth
25
Car Parc 2017-2021
(Million vehicles)1,306
1,475
2017 2021
Tire Production 2017-2021
(Million tires)1,697
1,913
2017 2021
Source: Industry Data, IVL Analysis
+170mn cars
Tire Yarn Demand - 2021(KMT)
16%
84%
IVL Share 2017
930KMT
+220mn
tires
Growth Drivers
Focus on Premium Segments
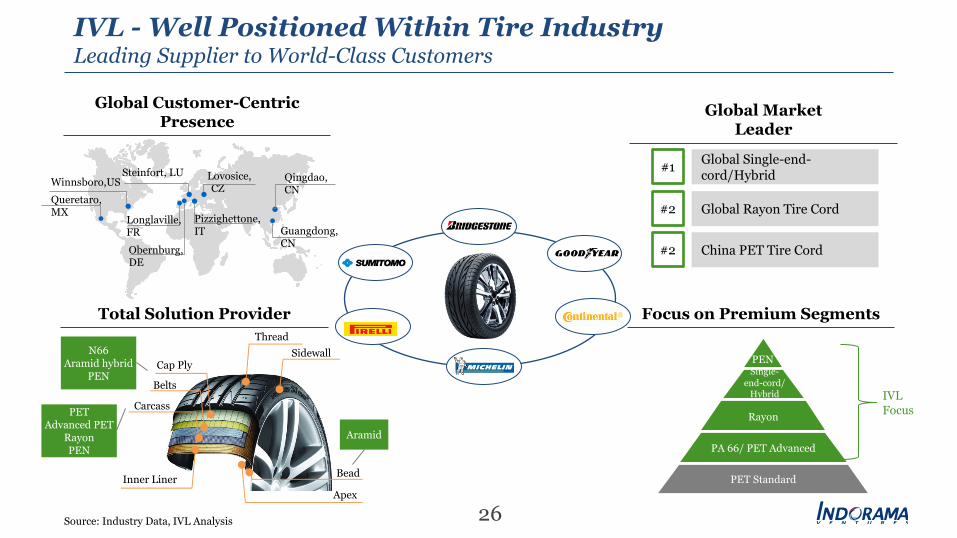
IVL - Well Positioned Within Tire Industry Leading Supplier to World-Class Customers
26Source: Industry Data, IVL Analysis
Global Customer-CentricPresence
Global Market Leader
Total Solution Provider
PENSingle-
end-cord/Hybrid
Rayon
PA 66/ PET Advanced
PET Standard
IVL Focus
China PET Tire Cord
Global Rayon Tire Cord
Global Single-end-cord/Hybrid
#2
#2
#1Lovosice, CZ
Steinfort, LU
Pizzighettone, IT
Obernburg,DE
Queretaro, MX
Longlaville,FR
Qingdao, CN
Guangdong, CN
SidewallThread
Cap Ply
Belts
Carcass
Inner Liner Bead
Apex
Aramid
PETAdvanced PET
RayonPEN
N66Aramid hybrid
PEN
Winnsboro,US

27
Strong R&D Capability and SynergyCutting-Edge Technology and Production Know-How
Leading technology example –Single-end-cord for Run-flat and High
Performance tiresElectrification
Lightweight materials
Connected vehicles
Shifts in mobility preferences
Autonomous vehicles
New tire design requirements offer an opportunity to partner
with world-class customers and deliver
best-in-class innovative solutions

28
Electric Vehicle Opportunities for Tires, Body and Interior Solutions
comfortable environment
safety features embedded
futuristic features
noise reduction
lightweightnew design opportunities
less complex engine
Taller TiresFuel Economy
Noise Control
Autonomous Driving
Electric Vehicle
Implications
Implications on reinforcement
materials
IVL Solution Platform
ü Passive safety features will prevail
ü Additional active safety features
ü New textile developmentsü Compositesü Insulation

29
Solid Platform for Future Growth and ExpansionIntegrating the Best
A global market leader in tire reinforcement with focus on premium segments
Partnering with world-class customers and delivering best-in-class solutions for their needs
Well positioned, innovation-driven, high growth business for IVL
Robust and long-term value driver for IVL

Clear Direction Towards 2021
Aloke Lohia, Vice-Chairman and Group CEO

Our Debut on DJSI Reflects Our Strong DeliveryIVL Ranks as #5 of all 2017 DJSI Listed Chemical Companies
2014
2015
2016
20%
69%
84%
95%IVL DJSI Score
2017
31Source: RobecoSAM, IVL

Delivering On Our Financial PlanDoubled Our EBITDA in Last 4 Years
32
478 568
640
775
1,004
2013 2014 2015 2016 2017
x2 EBITDA Increase
Core EBITDA ($M)

0.35
0.761.06
1.79
2.91
2013 2014 2015 2016 2017
Creating Superior Shareholder ReturnsStrong EPS Growth in Trough Business Environment
33
Core EPS After PERP (THB/Share)
~70%EPS
Growth

34
Countries 12 15 25
R&D Centers 2 6 11Patents Not material 250 564DJSI Score - - 95% (#51)Employees ~6,000 9,173 15,039
0
2
4
6
8
10
12
14
2010 2013 2017
NA PET
NA Olefins
NA Fibers
NA Aromatics
EMEA PET
EMEA Fibers
EMEA Aromatics
Asia PET
Asia Fibers
Asia Aromatics
34 sites
24 sites
17 sites
20 sites
15 sites
10 sites
15 sites
4sites4 sitesIV
L Ca
paci
ty (M
Mt)
3.7
6.8
11.7
1. Of all 2017 DJSI listed chemical companiesNote: Capacity data including JVs
Constantly Upgrading Our Value PropositionStrategy and Execution Delivered True Value Over Time
35
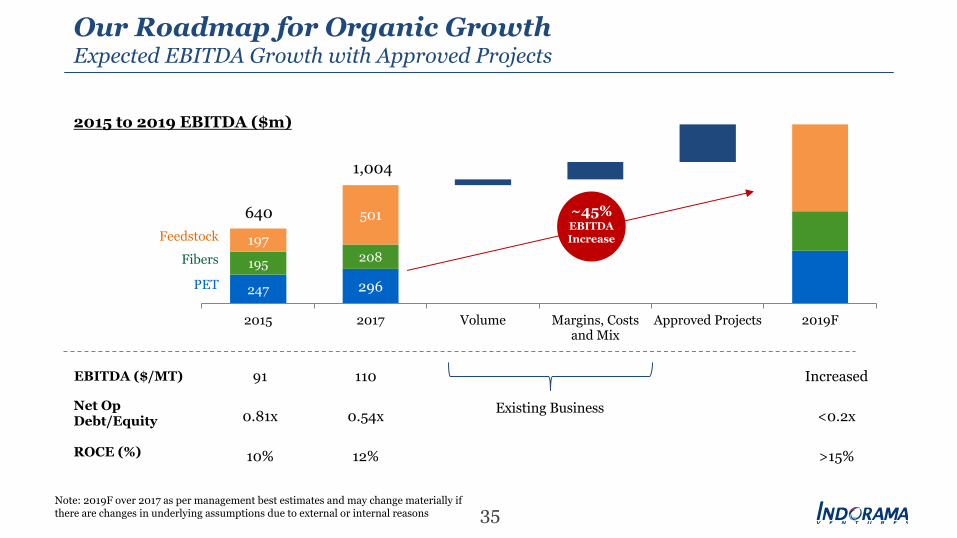
Our Roadmap for Organic GrowthExpected EBITDA Growth with Approved Projects
247 296195 208197
501
2015 2017 Volume Margins, Costs and Mix
Approved Projects 2019F
Feedstock
Fibers
PET
2015 to 2019 EBITDA ($m)
EBITDA ($/MT) 91 110 Increased
Net Op Debt/Equity 0.81x 0.54x <0.2x
ROCE (%) 10% 12% >15%
1,004
Note: 2019F over 2017 as per management best estimates and may change materially if there are changes in underlying assumptions due to external or internal reasons
640 ~45% EBITDAIncrease
Existing Business

36
IVLConsolidated
By Segment By Region
Increase in Production (%) ~25% ~25% ~20% ~30% ~10% ~40% ~35%
Increase in EBITDA (%) ~35% ~30% ~50% ~35% ~35% ~20% ~70
Growth Capex (2018 and 2019) $ 1.6b ~30% ~20% ~50% ~50% ~30% ~20%
Maintenance Capex (2018 and 2019) $0.3m ~20% ~20% ~60% ~40% ~30% ~30%
Total Capex (2018 and 2019) $1.8b
Simple Payback of Approved Projects ~4.5 yrs
Impact with Existing Business and Approved ProjectsExpected Increase in EBITDA of ~35% in 2019 over 2H17 Annualized
PET Fibers Feedstock NAM EMEA Asia
2H17 Annualized to 2019 EBITDA ($m)
Note: 2019F over 2H17 annualized as per management best estimates and may change materially if there are changes in underlying assumptions due to external or internal reasons, Out of $1.8B capex $764M is spent by 2017

Key Takeaways
37
On Path to Becoming a World-Class Chemical Company Making Great Products for Society
Delivering ~70% Annual EPS Growth in Trough 2013-2017 Business Environment
2H17 Marks a Positive Structural Shift for the industry and Business
~45% Expected EBITDA Growth in 2019 over 2017 with Existing Business and Approved Projects
$7b Investment Headroom by 2021 after $1.8b Committed Capex by 2019
Disclaimer
38
This presentation contains “forward-looking” statements of Indorama Ventures Public Company Limited (the “Company”)1 that relate to future events, which are, by their nature, subject to significant risks and uncertainties. All statements, other than statements of historical fact contained herein, including, without limitation, those regarding the future financial position and results of operations, strategy, plans, objectives, goals and targets, future developments in the markets where the Company participates or is seeking to participate and any statements preceded by, followed by or that include the words “target”, “believe”, “expect”, “aim”, “intend”, “will”, “may”, “anticipate”, “would”, “plan”, “could”, “should, “predict”, “project”, “estimate”, “foresee”, “forecast”, “seek” or similar words or expressions are forward-looking statements.
Such forward-looking statements involve known and unknown risks, uncertainties and other important factors beyond the Company’s control that could cause the actual results, performance or achievements of the Company to be materially different from the future results, performance or achievements expressed or implied by such forward-looking statements. These forward-looking statements are based on numerous assumptions regarding the Company’s present and future business strategies and the environment in which the Company will operate in the future and are not a guarantee of future performance.
Such forward-looking statements speak only as at the date of this presentation, and the Company does not undertake any duty or obligation to supplement, amend, update or revise any such statements. The Company does not make any representation, warranty orprediction that the results anticipated by such forward-looking statements will be achieved.
1Where the context requires, it means the Company, its subsidiaries, joint ventures and associated companies as a group or as members of such group.

Continue Shaping Our Industry LeadershipLeading The Market With Quality, Innovation, Reliability
39Note: Financials Excluding JVs
11R&D Centers
564Patents
$8.4 billionRevenue
15,039Employees
A global presence in
25 countries
75 operating sites
in Asia in EMEA in North America
34 24 17
34%HVA sales
IVL At A Glance - 2017


