
Oil market outlookOctober 2017
The rebalancing is in full swing: 75% of the overhang is gone
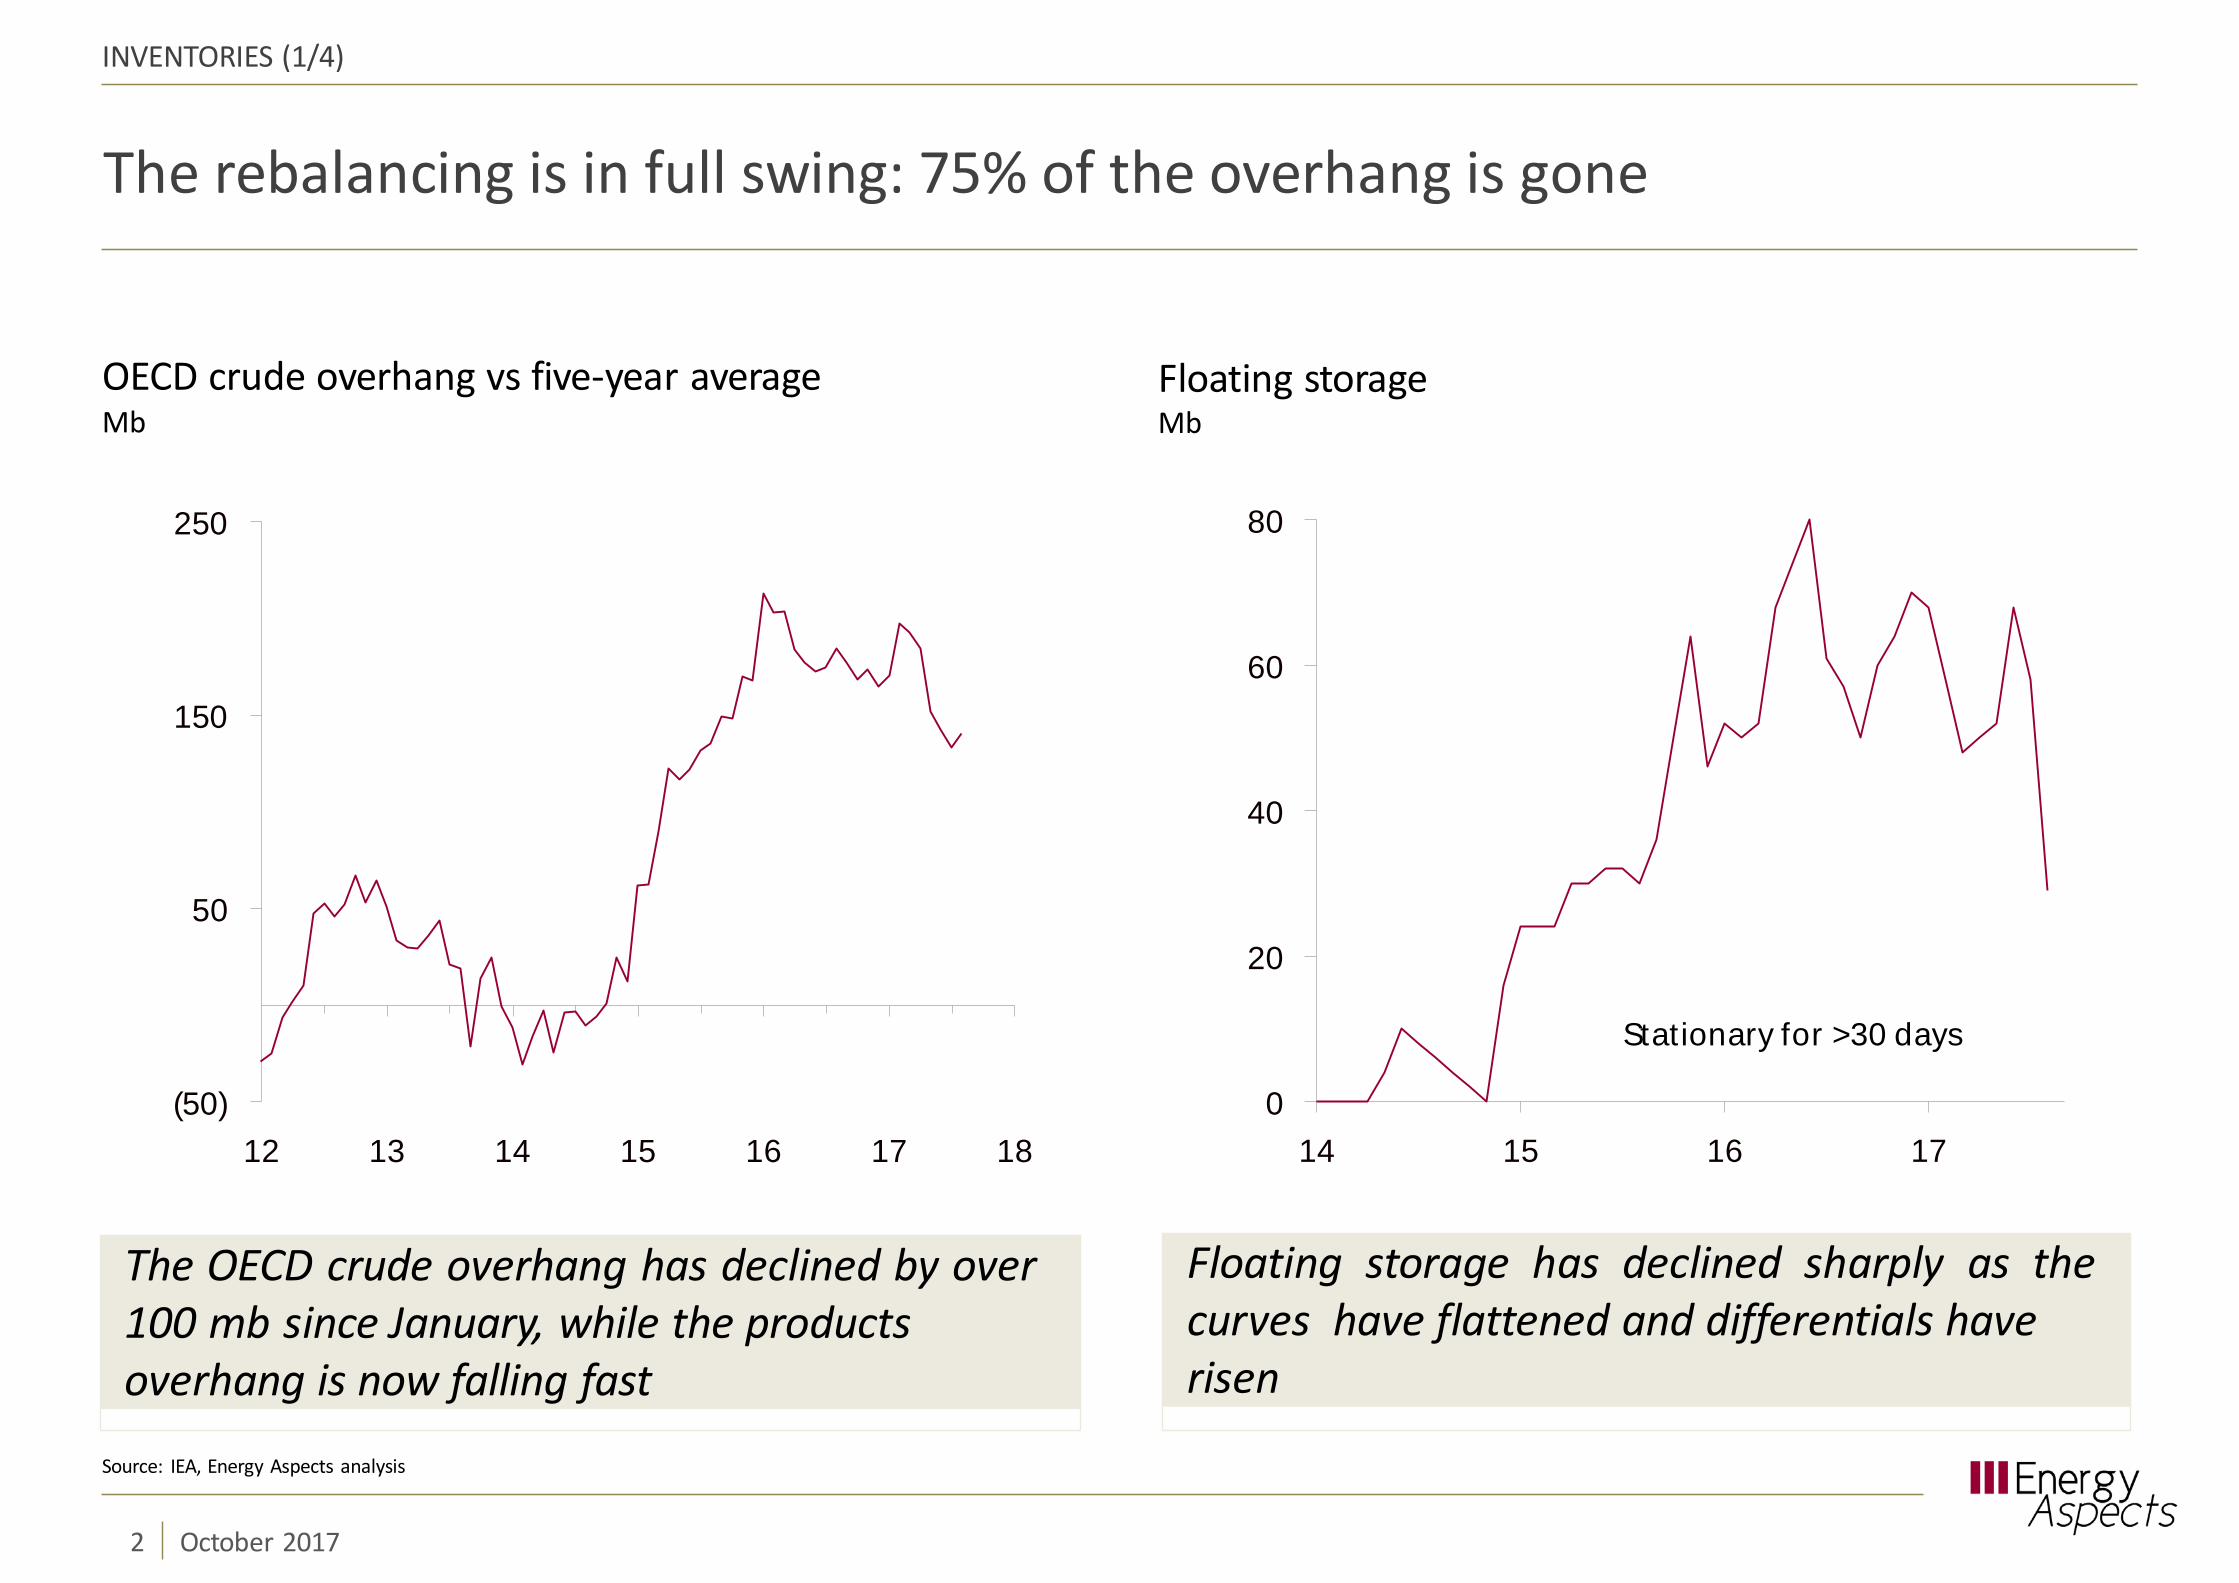
Floating storageMb
OECD crude overhang vs five-year averageMb
INVENTORIES (1/4)
The OECD crude overhang has declined by over100 mb since January, while the productsoverhang is now falling fast
Floating storage has declined sharply as thecurves have flattened and differentials haverisen
(50)
50
150
250
12 13 14 15 16 17 180
Source: IEA, Energy Aspects analysis
2 October 2017
20
40
60
80
14 15 16 17
Stationary for >30 days

OPEC destocking coming to an end
Iranian floating storageMb
Saudi crude stocksMb
340
320
300
280
260
240
22011 13 15 17
INVENTORIES (2/4)
Saudi crude stocks have fallen by nearly 100mb since their peak in Q4 16, and the destockinghas boosted exports
Around 35 mb of Iranian floating storagehas also been drawn down since Q4 16
0
Source: JODI, Reuters, Energy Aspects analysis
3 October 2017
5
10
15
20
25
30
35
40
Jan 15 Jul 15 Jan 16 Jul 16 Jan 17 Jul 17

Products stockdraws leading the charge, forward cover basis even tighter
German diesel stocksMb
Chinese total products stocksMb
INVENTORIES (3/4)
In theory, China stockpiled over 1 mb/d in H117, but several new pipes and tanks havestarted up
Stocks are falling across the rest of the worldwith product draws gaining momentum inrecent weeks
58
63
68
73
78
Jan Mar May Jul Sep Nov
2017 2016 5-year average
160
150
140
130
120
110
170
Jan Mar May Jul Sep Nov
2017 2016 2015
Source: NBS, China Customs,, IE, Energy Aspects analysis
4 October 2017
Backwardation breeds backwardation
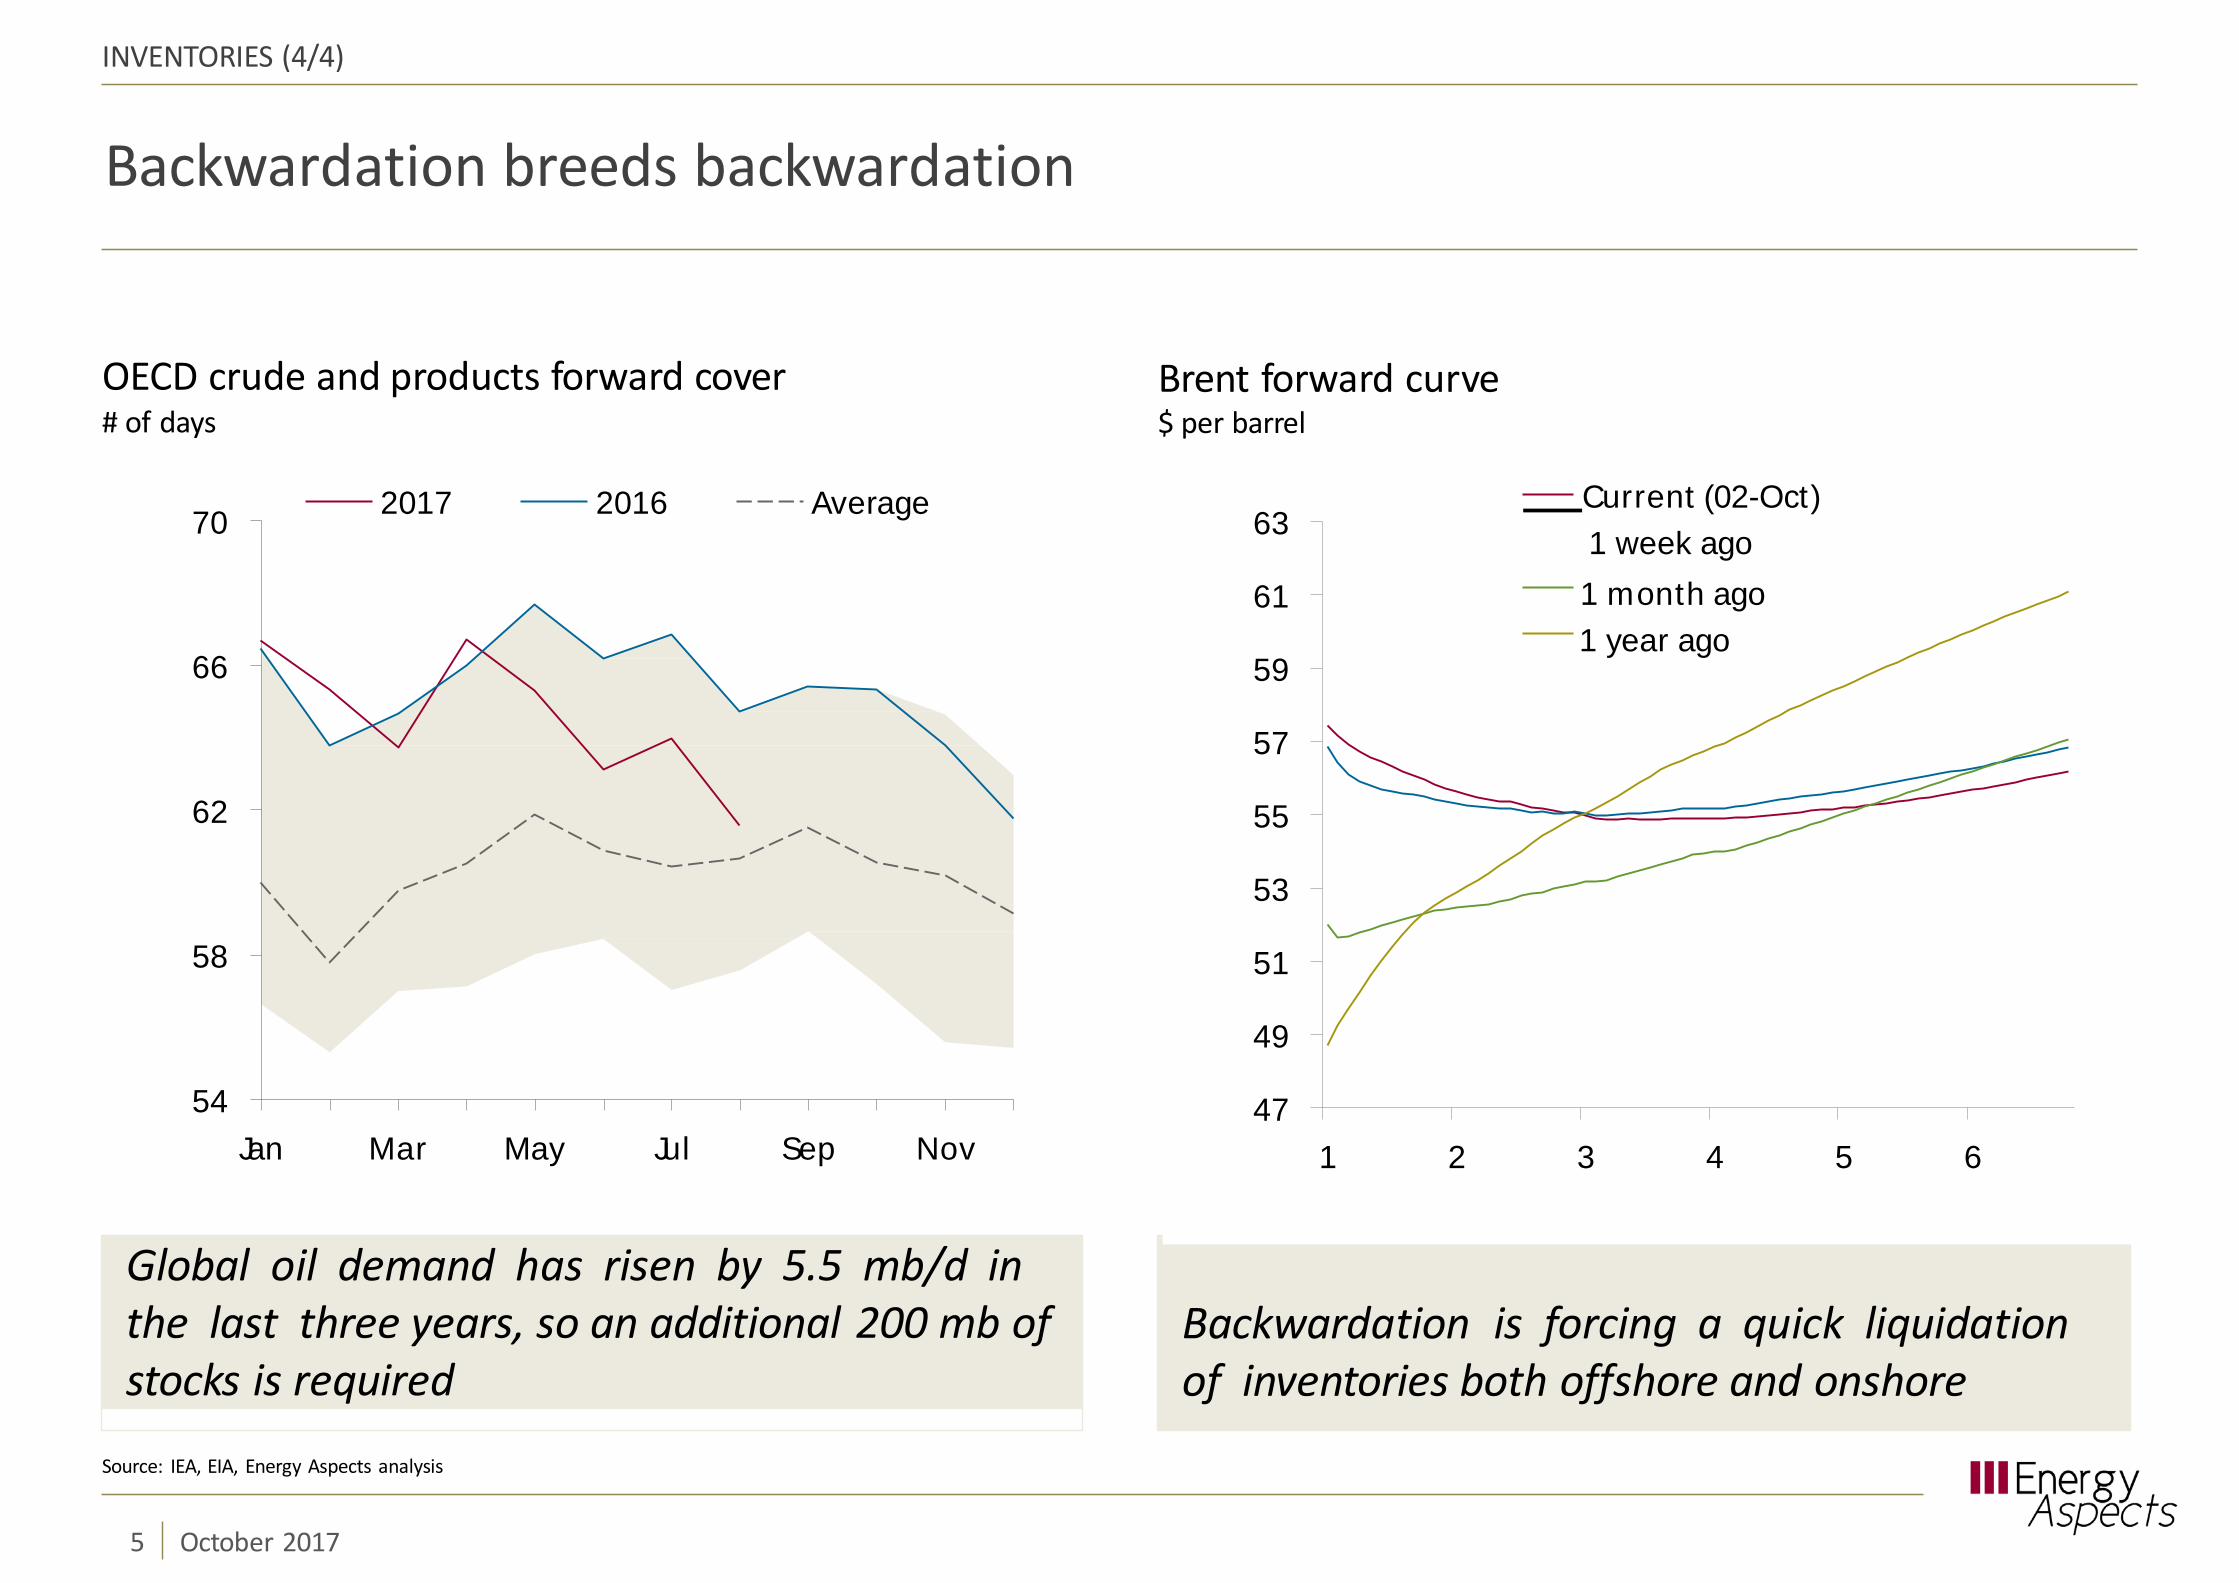
Backwardation is forcing a quick liquidationof inventories both offshore and onshore
54
58
62
66
Jan Mar May Jul Sep Nov
Brent forward curve$ per barrel
Current (02-Oct)1 week ago1 month ago1 year ago
OECD crude and products forward cover# of days
INVENTORIES (4/4)
Global oil demand has risen by 5.5 mb/d inthe last three years, so an additional 200 mb ofstocks is required
70 2017 2016 Average
47
49
51
53
55
57
59
61
63
1 2 3 4 5 6
Source: IEA, EIA, Energy Aspects analysis
5 October 2017

Unsurprisingly, physical differentials and crude structure are on fire
Oct 16 Jan 17 Apr 17 Jul 17 Oct 17(1.0)
Apr May Jun Jul Aug Sep Oct
Brent and Dubai prompt timespreads$ per barrel
Dubai M1-M2 Brent M1-M2
Argus USGC medium crude spreads$ per barrel
4
PRICES AND DIFFERENTIALS (1/3)
Light-heavy crude differentials have tightenedfurther amidst continuing OPEC cuts anddeclining LatAm output
Brent and Dubai structure have firmed acrossthe curve in recent weeks amidst strongfundamentals
0
(2)
(4)
(6)
2
Basrah LightEscalante
KuwaitiMars
Vasconia
(0.5)
0.0
0.5
1.0
Source: Argus, Energy Aspects analysis
6 October 2017

Even light crude differentials firm despite Libya, Nigeria and US shale
PRICES AND DIFFERENTIALS (2/3)
Nigerian differentials to Dated Brent$ per barrel
Bonny Light
Libya, Nigeria, and US output, y/y changeMb/d
Light crude differentials have firmed since mid-July as strong naphtha has helped absorb theexcess
The strength in light crudes is all the moreremarkable given the recovery in Libyan,Nigerian and US production
1.5
1.0
0.5
0.0
(0.5)
(1.0)
2.0
2.5
Apr May Jun Jul Aug Sep Oct
Forcados
Qua Iboe
(1.5)
(1.0)
(0.5)
0.0
0.5
1.0
1.5
2.0
Jan 16 May 16 Sep 16 Jan 17 May 17 Sep 17
Libya Nigeria US crude
Source: Argus, MEES, EIA, Energy Aspects analysis
7 October 2017
Crude being pulled higher by products
PRICES AND DIFFERENTIALS (3/3)
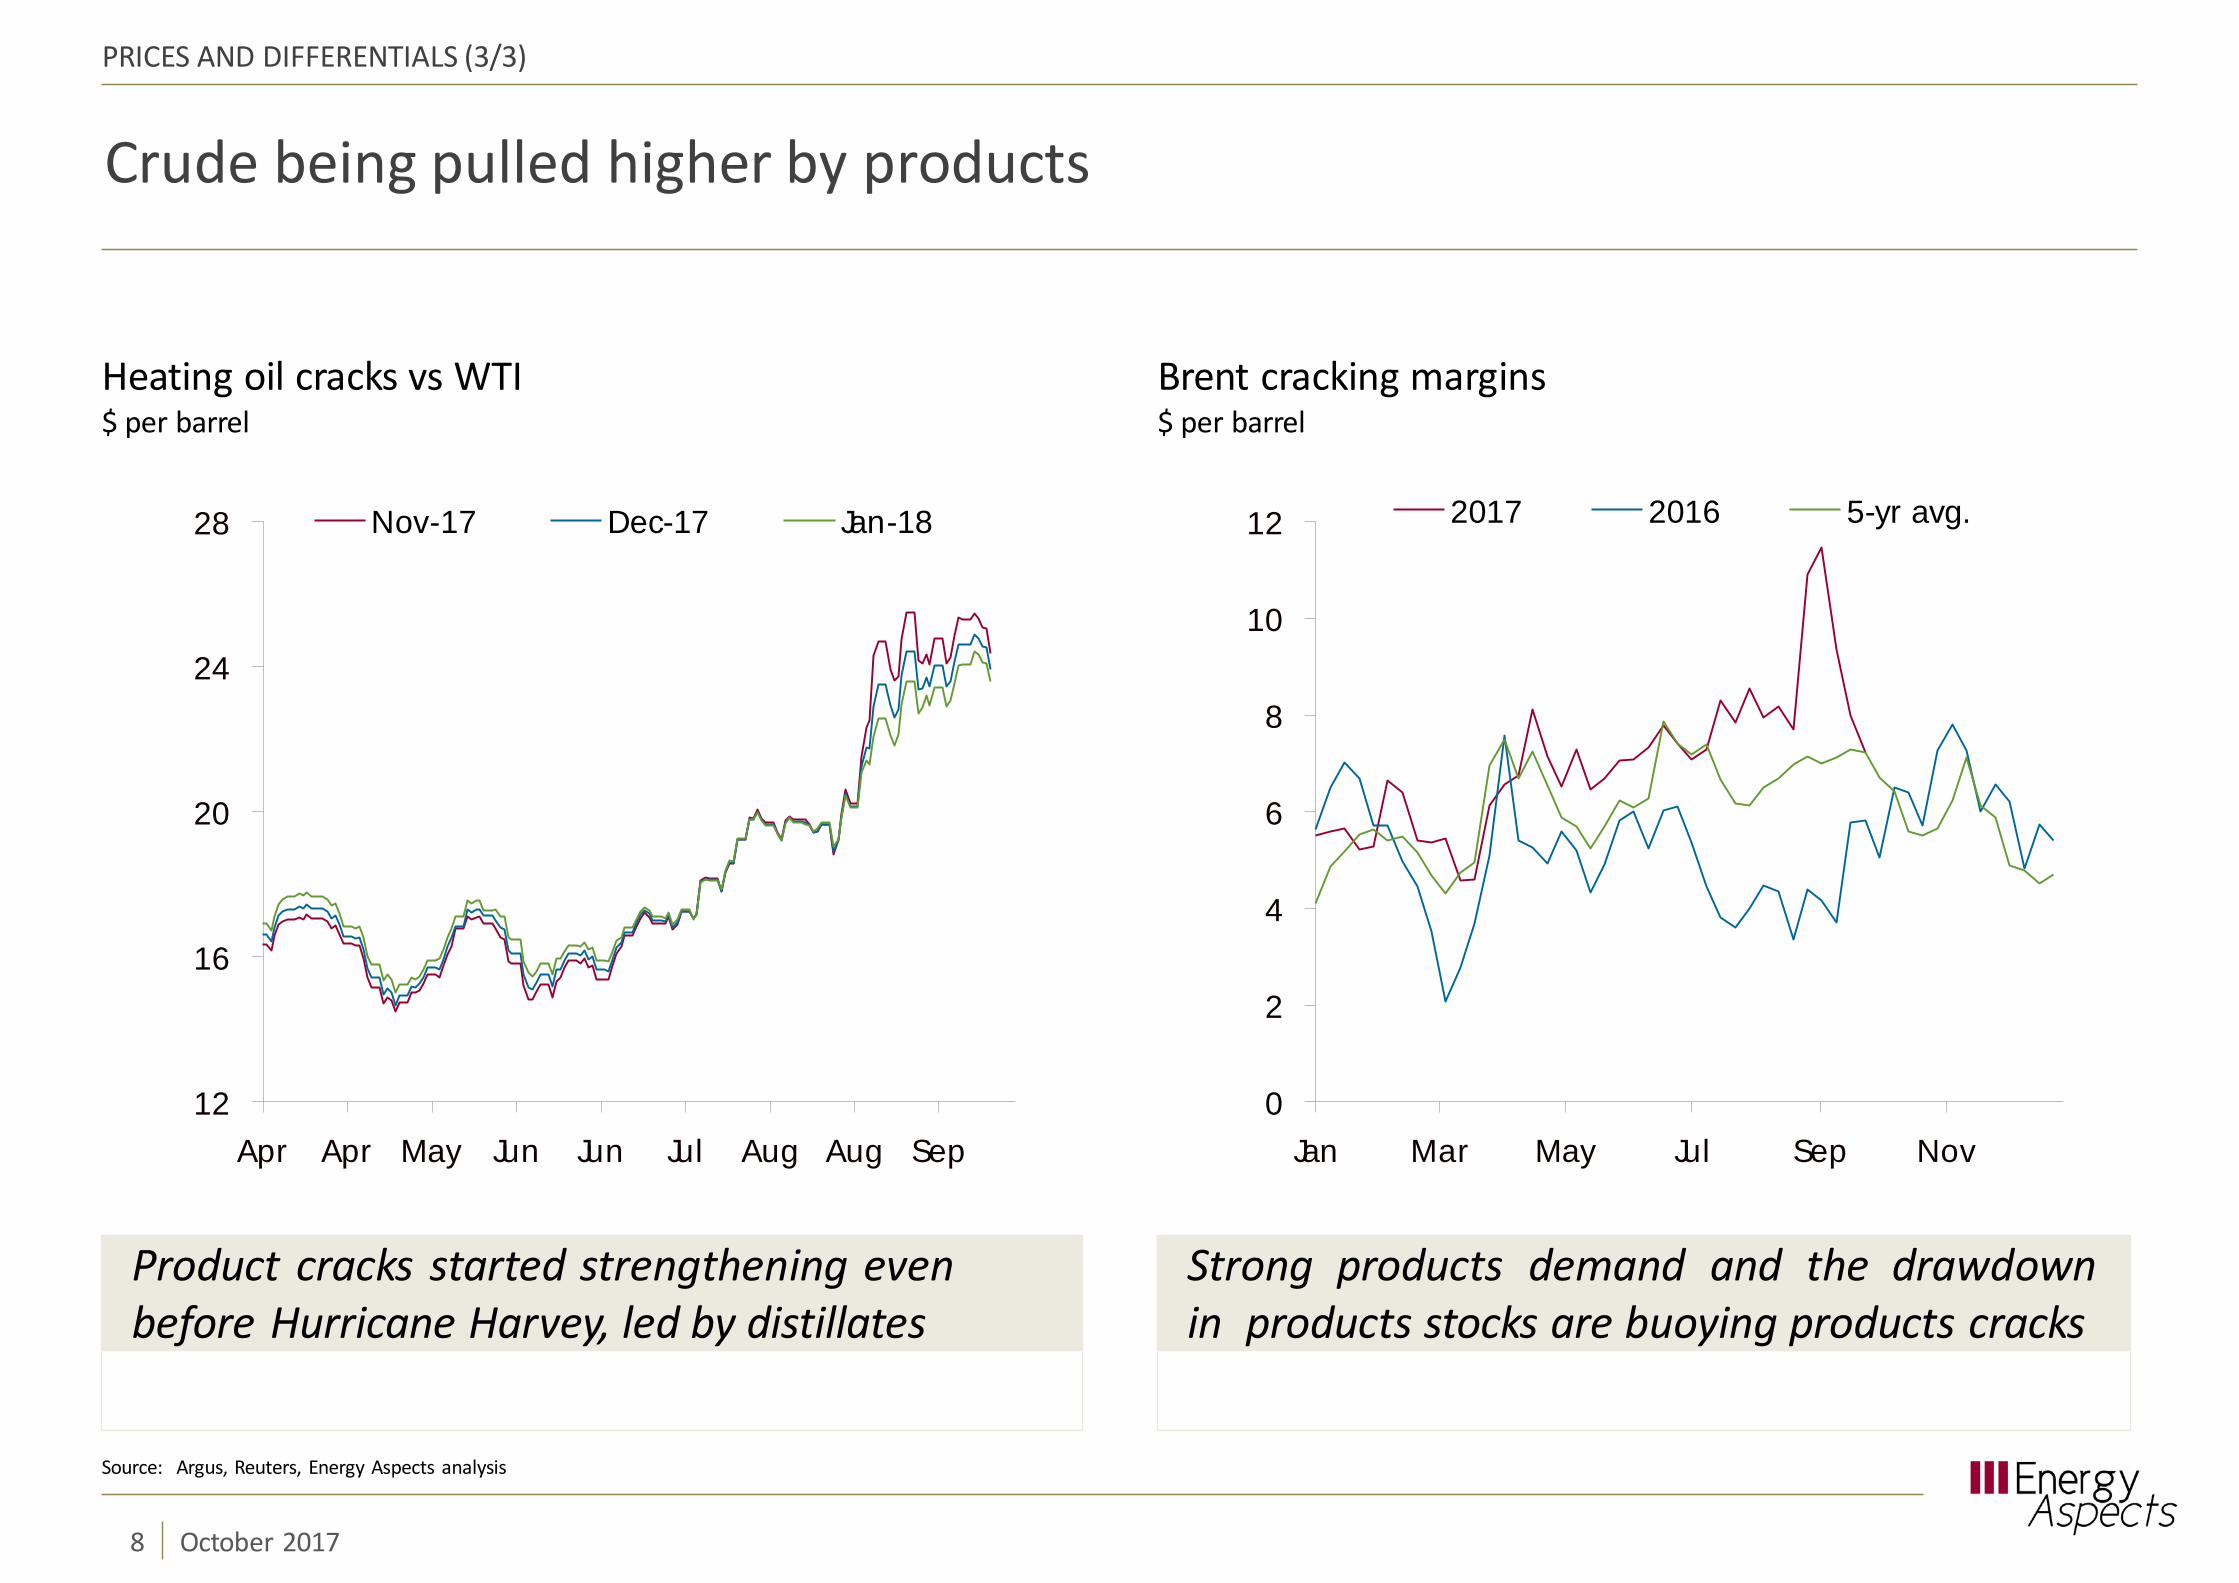
Heating oil cracks vs WTI$ per barrel
Brent cracking margins$ per barrel
Product cracks started strengthening evenbefore Hurricane Harvey, led by distillates
Strong products demand and the drawdownin products stocks are buoying products cracks
0
2
4
6
8
10
12
Jan Mar May Jul Sep Nov
2017 2016 5-yr avg.
12
16
20
24
28
Apr Apr May Jun Jun Jul Aug Aug Sep
Nov-17 Dec-17 Jan-18
Source: Argus, Reuters, Energy Aspects analysis
8 October 2017
But positioning is creating significant volatility
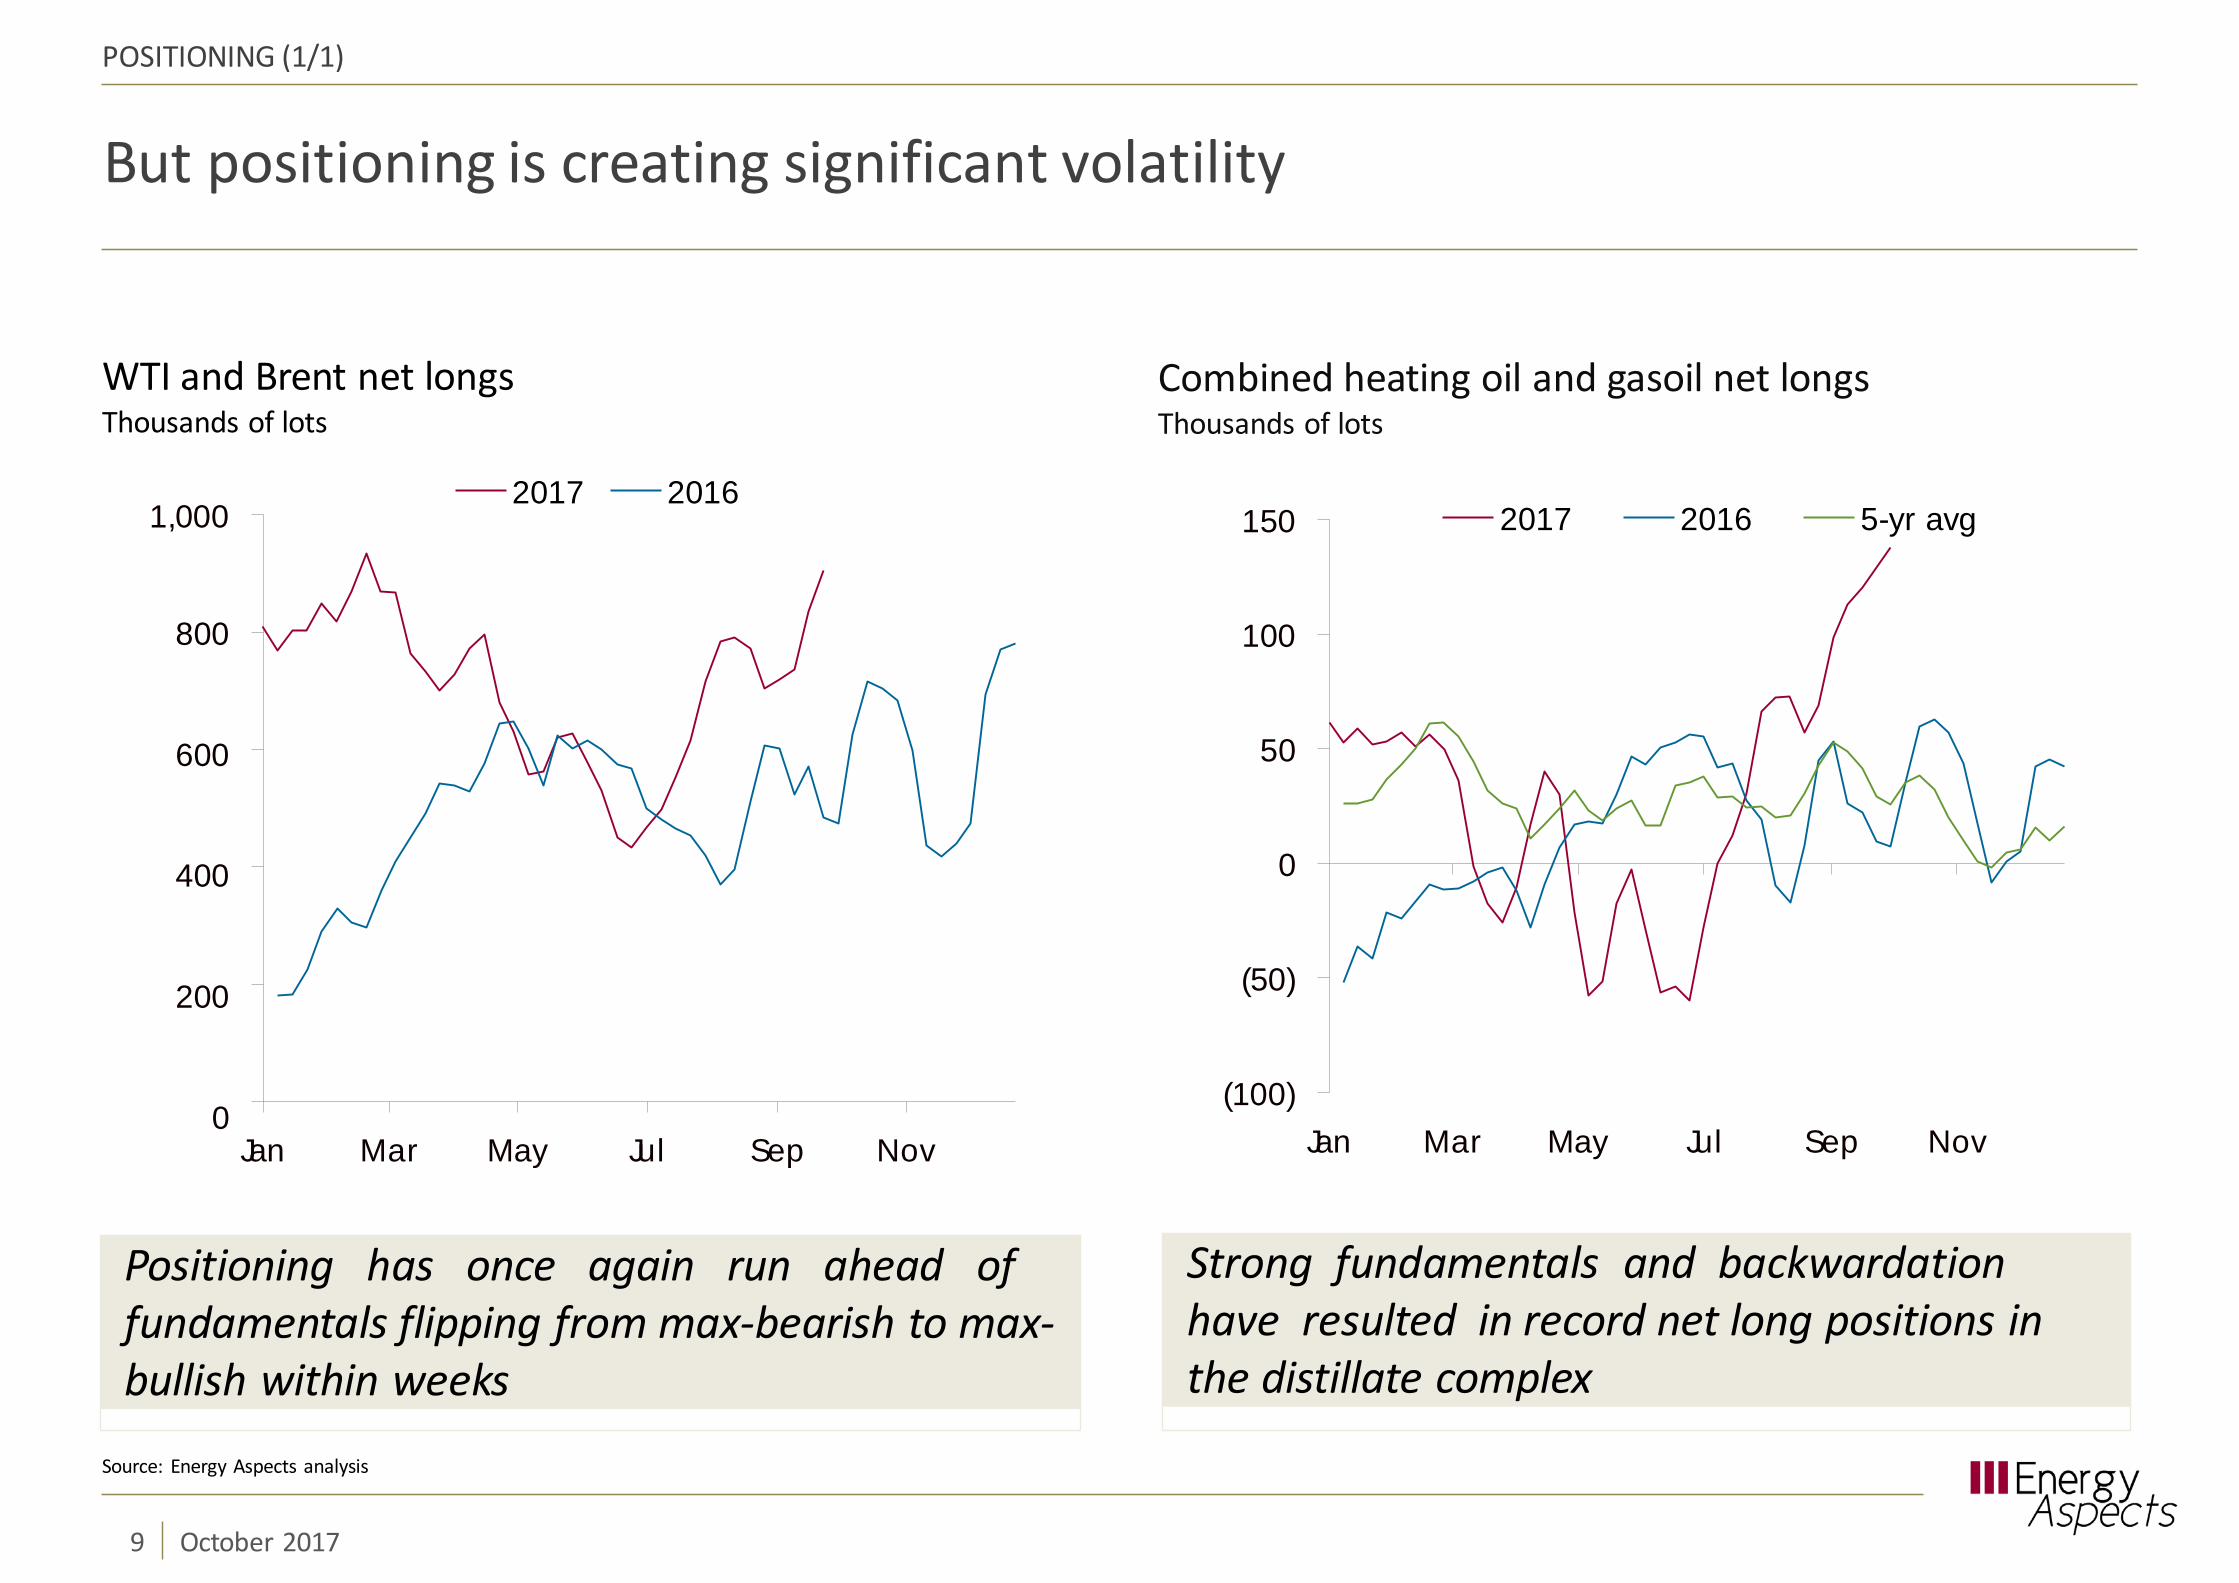
Combined heating oil and gasoil net longsThousands of lots
WTI and Brent net longsThousands of lots
POSITIONING (1/1)
Positioning has once again run ahead offundamentals flipping from max-bearish to max-bullish within weeks
Strong fundamentals and backwardationhave resulted in record net long positions inthe distillate complex
800
600
400
200
0
1,000
Jan Mar May Jul Sep Nov
2017 2016
(100)
(50)
0
50
100
150
Jan Mar May Jul Sep Nov
2017 2016 5-yr avg
Source: Energy Aspects analysis
9 October 2017

A products led rebalancing
REFINING (1/3)
Global refinery runsMb/d
83
82
81
80
79
78
77
76
75Jan 15 Jul 15 Jan 16 Jul 16 Jan 17 Jul 17 2018
Refinery additions vs demand growthMb/d
Net refining and splitter additions
Demand growth
Source: Government sources, Energy Aspects analysis
10 October 2017
Global refinery runs have risen by over 0.7mb/d y/y in the year to August, with Decemberruns set to hit a record…
…but since 2014, global refinery andsplitter capacity additions have lagged behinddemand growth
0.0
0.5
1.0
1.5
2.0
2.5
2014 2015 2016 2017

Tight refining capacity on strong demand and spec changes
REFINING (2/3)
Asia fuel specifications
By the end of 2016, the lack of capacity additions had started to catch up with the market and product stocksgradually began drawing. A slew of product spec changes over the last two years—in China, India, Pakistan,Indonesia and the US amongst others—also contributed to tightening refining capacity as several simplerefineries were effectively made redundant.
Australia (1)Australia (2)Bangladesh (1)Bangladesh (2)BruneiCambodia China (1)China (2)Hong KongIndia Indonesia JapanLaosMalaysia (1)Malaysia (2)MyanmarNepalPakistanPhilippinesSingapore (1)Singapore (2)South Korea Sri Lanka TaiwanThailandVietnam
2005 2010 2015 2020 2025
Note: (1) Gasoline (2) Diesel Source: Company reports, Energy Aspects research
11 October 2017
III IV VIII IV VI II IIII II IIIII IVII II III IV VII III IV VIII IV VII III IV VIIIIV VIIII IV VII VII IIII III II IVII IV VIII IV V VIIV VI IIII IV VIII IVI II IV V
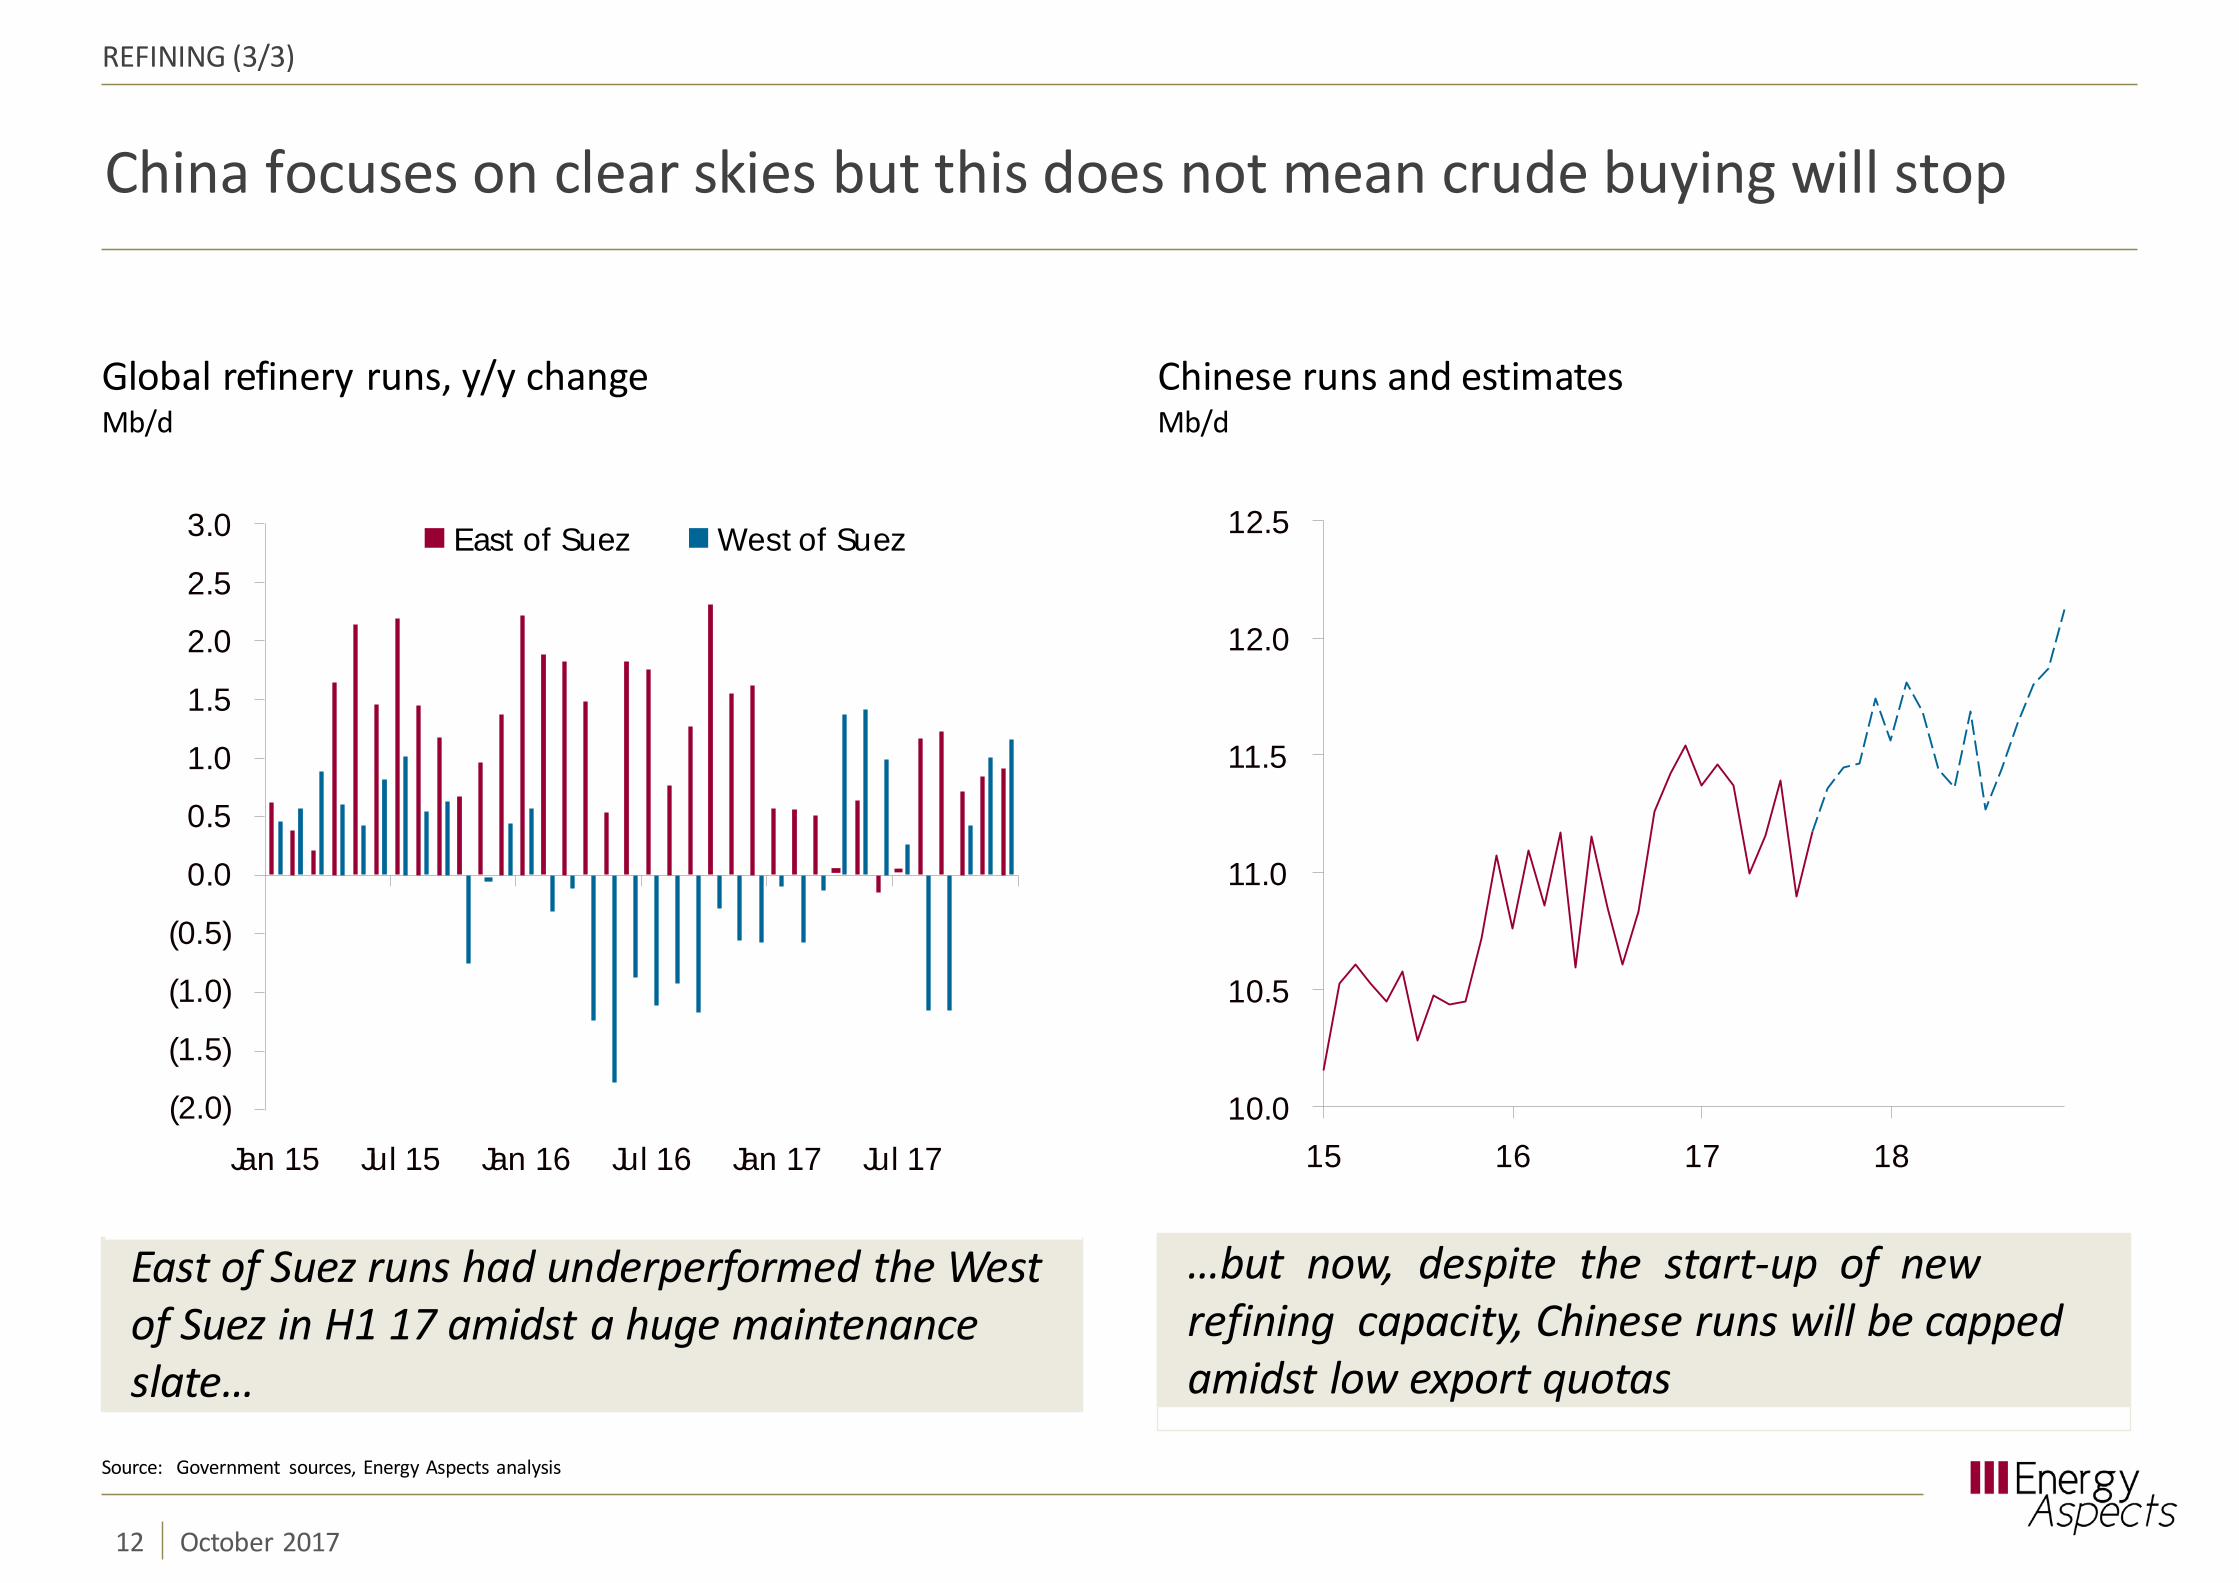
China focuses on clear skies but this does not mean crude buying will stop
REFINING (3/3)
Global refinery runs, y/y changeMb/d
Chinese runs and estimatesMb/d
East of Suez runs had underperformed the Westof Suez in H1 17 amidst a huge maintenanceslate…
…but now, despite the start-up of newrefining capacity, Chinese runs will be cappedamidst low export quotas
10.0
10.5
11.0
11.5
12.0
12.5
15 16 17 18
3.0
2.5
2.0
1.5
1.0
0.5
0.0
(0.5)
(1.0)
(1.5)
(2.0)Jan 15 Jul 15 Jan 16 Jul 16 Jan 17 Jul 17
East of Suez West of Suez
Source: Government sources, Energy Aspects analysis
12 October 2017

Stellar demand growth to still outpace runs increase…
Global oil demand growth by region, y/y changeMb/d
Global oil demand growth by product, y/y changeMb/d
DEMAND (1/4)
We forecast 2017 global oil demand growth at1.7 mb/d y/y, from 1.8 mb/d in 2016, and at1.5 mb/d y/y in 2018
Global oil demand growth has beenextremely uniform, discouraging opportunisticyield shifts
(1.0)
(0.5)
0.0
0.5
1.0
1.5
2.0
2.5
3.0
Q1 15 Q1 16 Q1 17
2.0
1.5
1.0
0.5
0.0
(0.5)
2.5
2015 2016 H1 17
LPG Gasoline Jet/Kero Diesel Fuel oil
Source: Government agencies, JODI, Bloomberg, Energy Aspects analysis
13 October 2017
LatAm Other Asia ChinaIndia ME FSUOECD
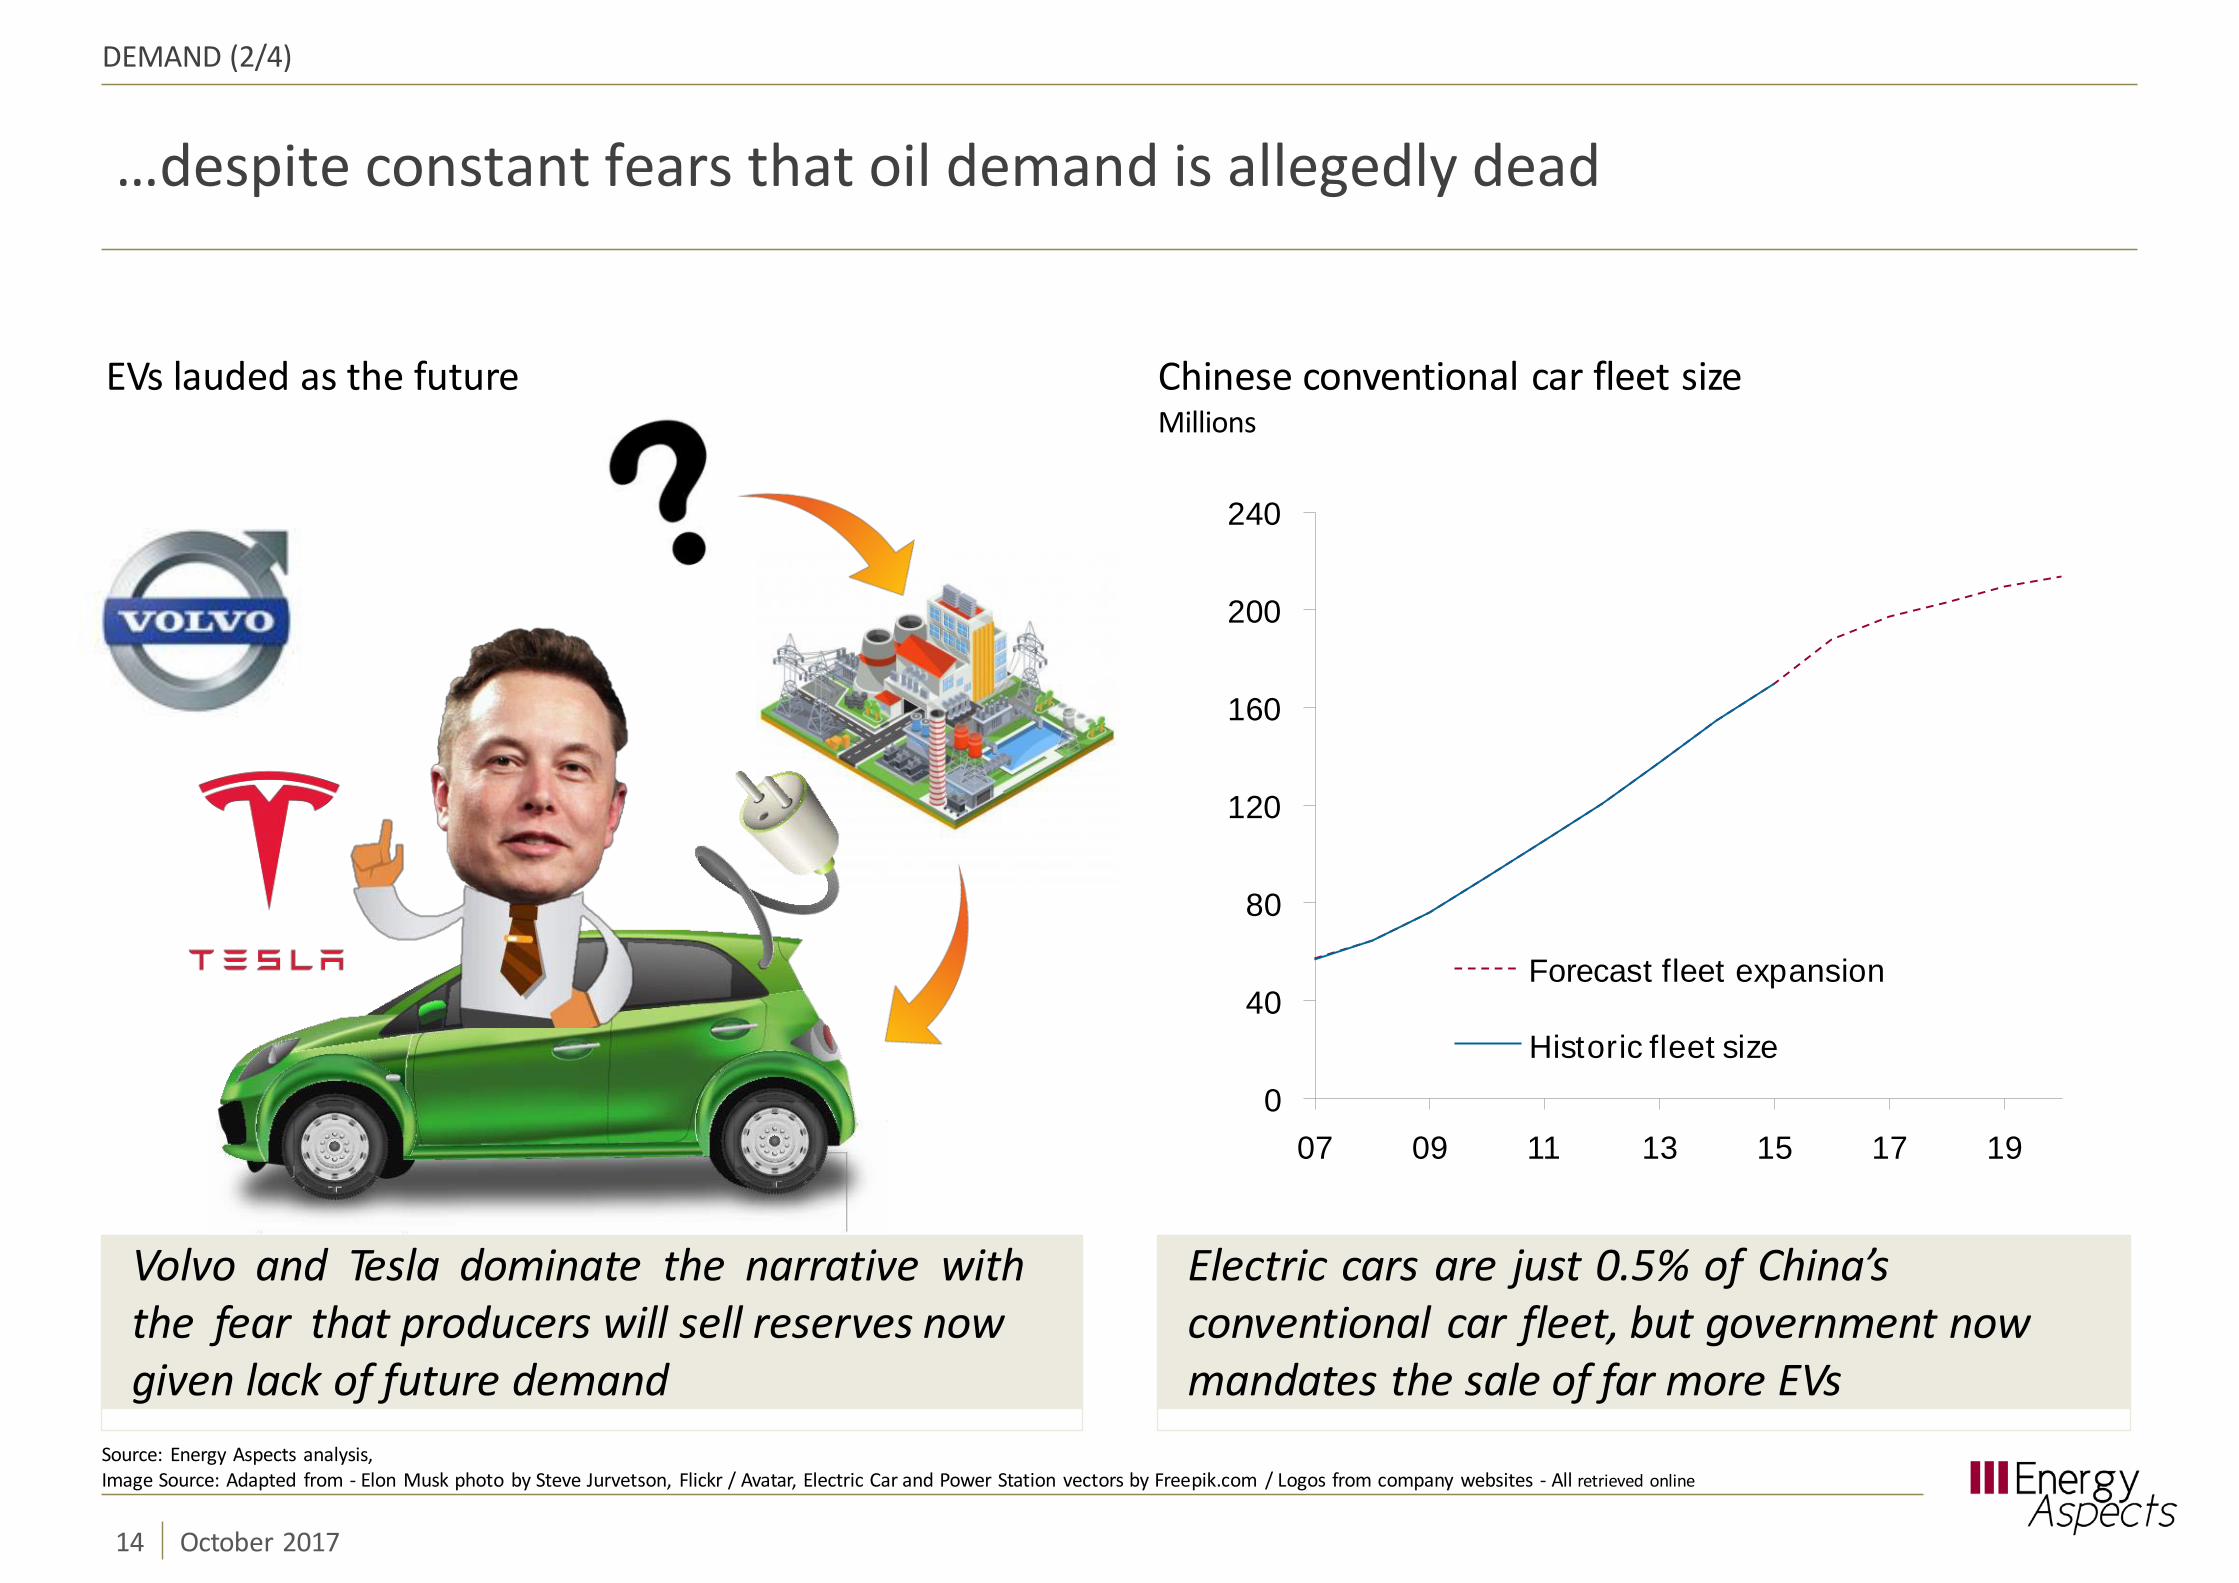
…despite constant fears that oil demand is allegedly dead
DEMAND (2/4)
EVs lauded as the future Chinese conventional car fleet sizeMillions
Source: Energy Aspects analysis,
Volvo and Tesla dominate the narrative withthe fear that producers will sell reserves nowgiven lack of future demand
Electric cars are just 0.5% of China’sconventional car fleet, but government nowmandates the sale of far more EVs
0
40
80
120
160
200
240
07 09 11 13 15 17 19
Forecast fleet expansion
Historic fleet size
Image Source: Adapted from - Elon Musk photo by Steve Jurvetson, Flickr / Avatar, Electric Car and Power Station vectors by Freepik.com / Logos from company websites - All retrieved online
14 October 2017
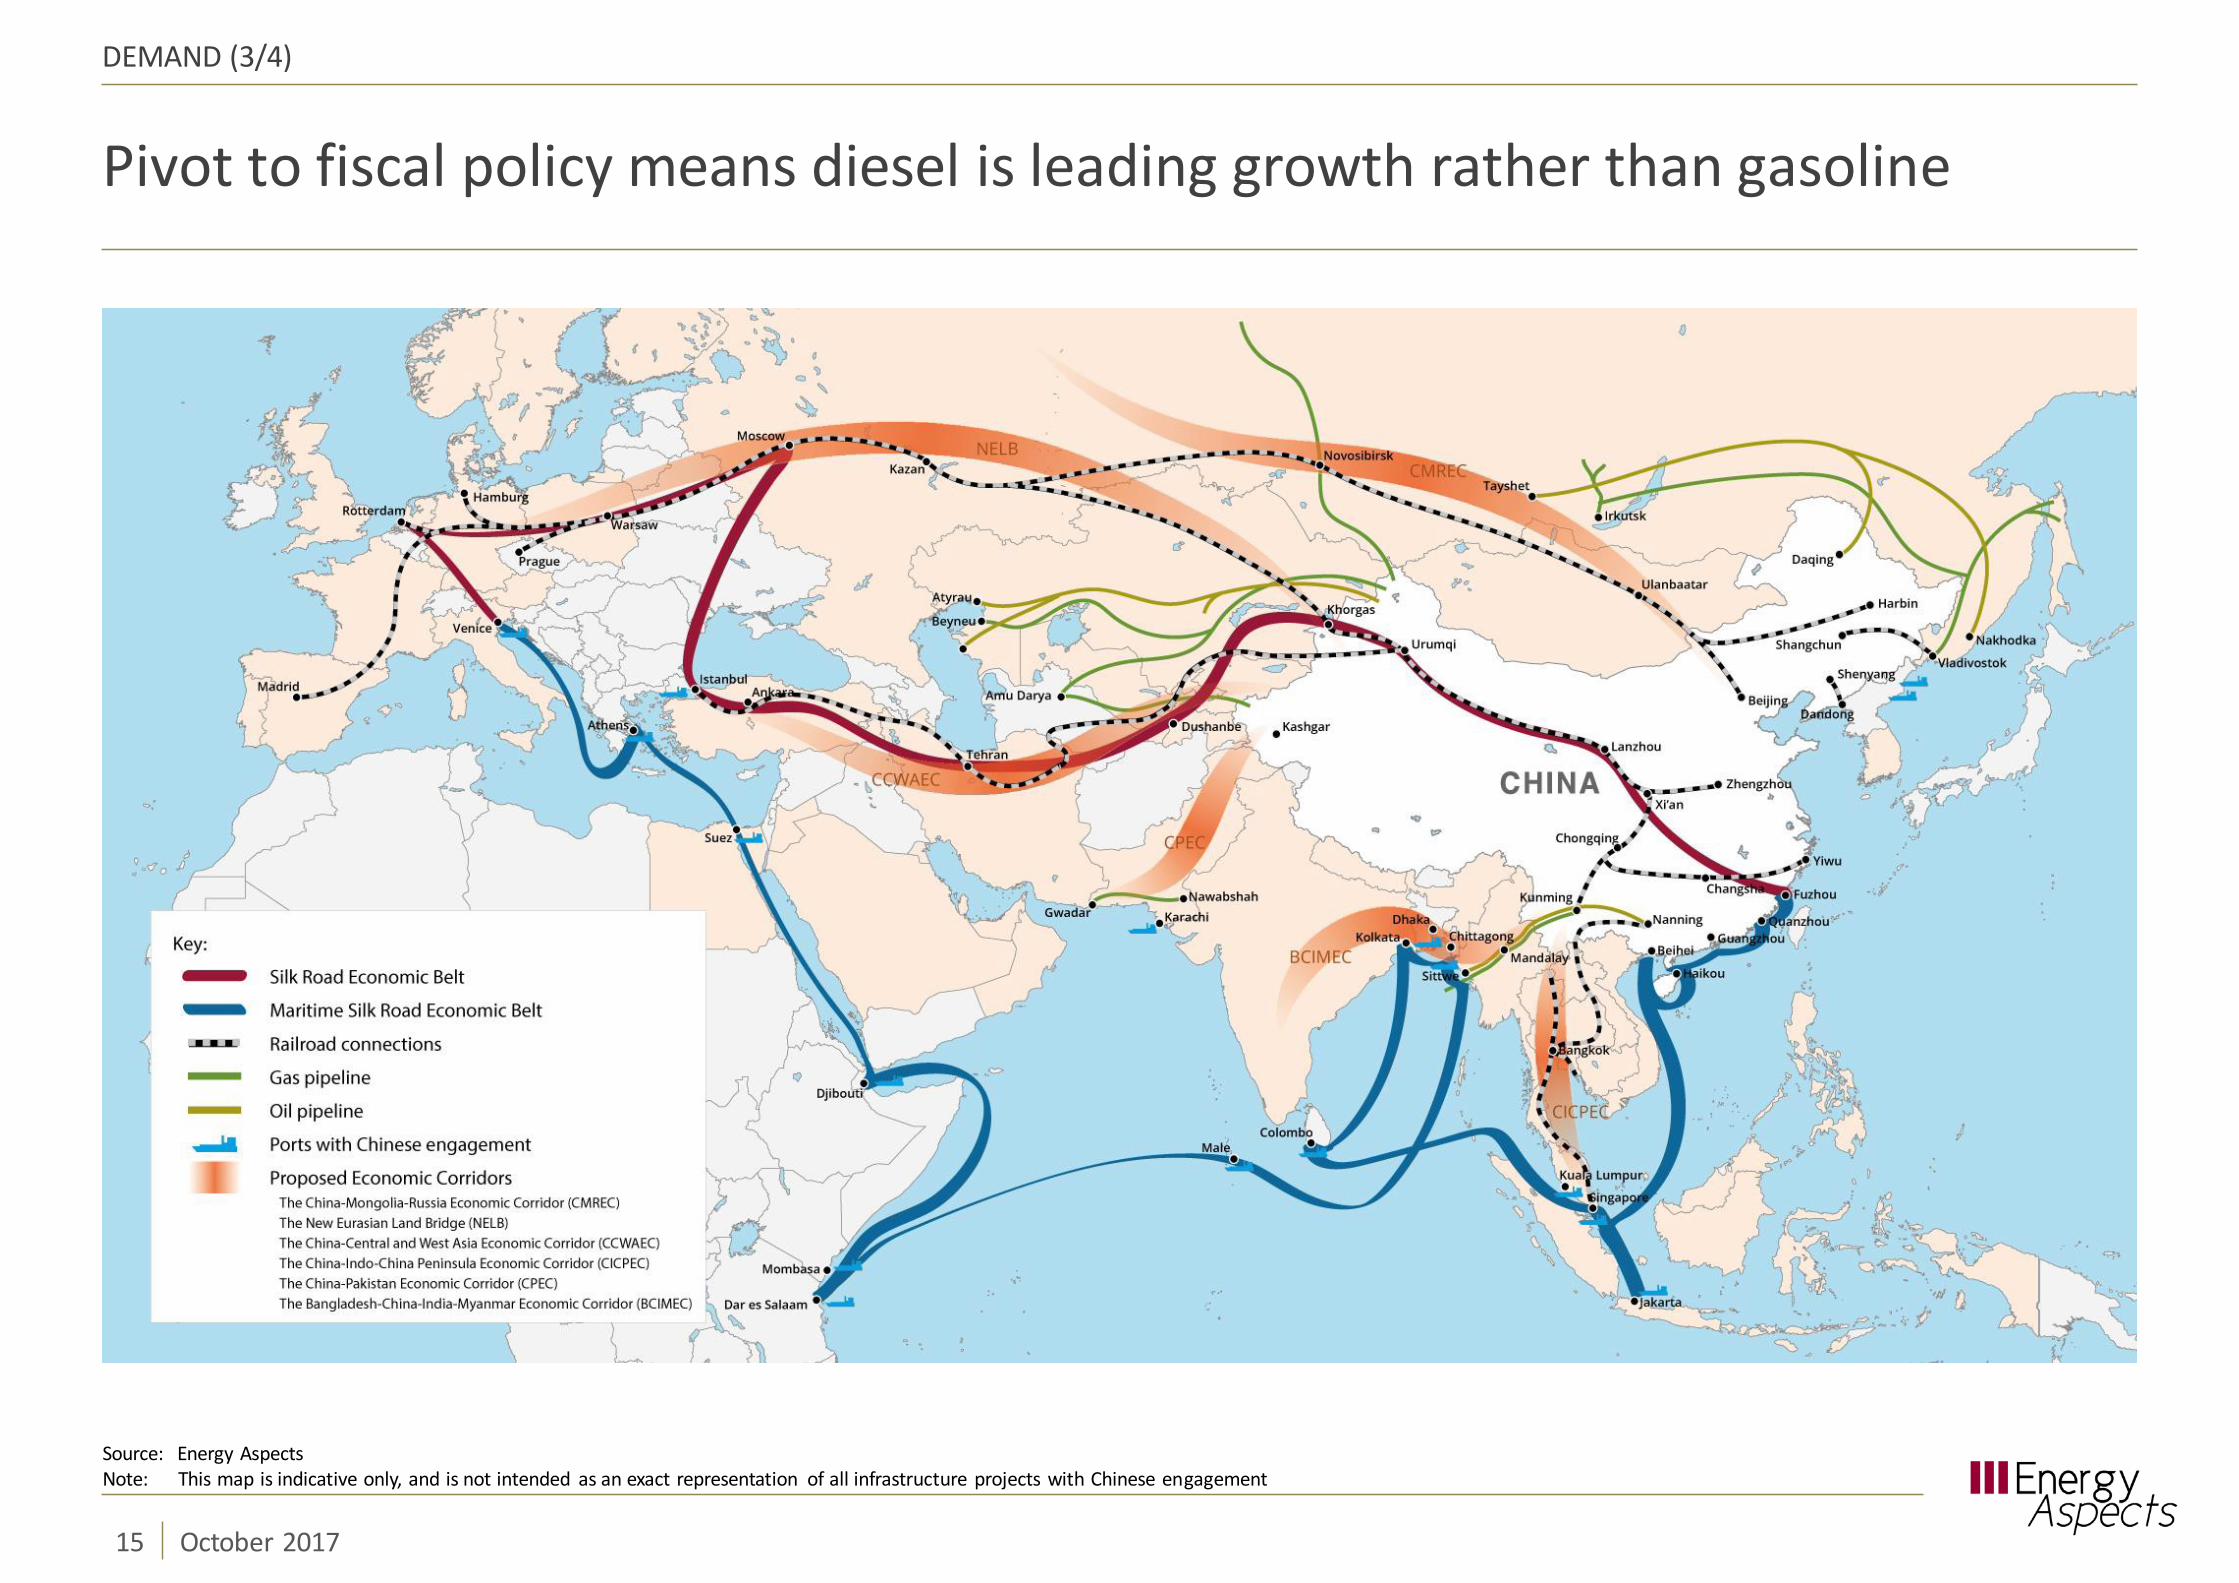
Pivot to fiscal policy means diesel is leading growth rather than gasoline
Source: Energy Aspects
DEMAND (3/4)
Note: This map is indicative only, and is not intended as an exact representation of all infrastructure projects with Chinese engagement
15 October 2017
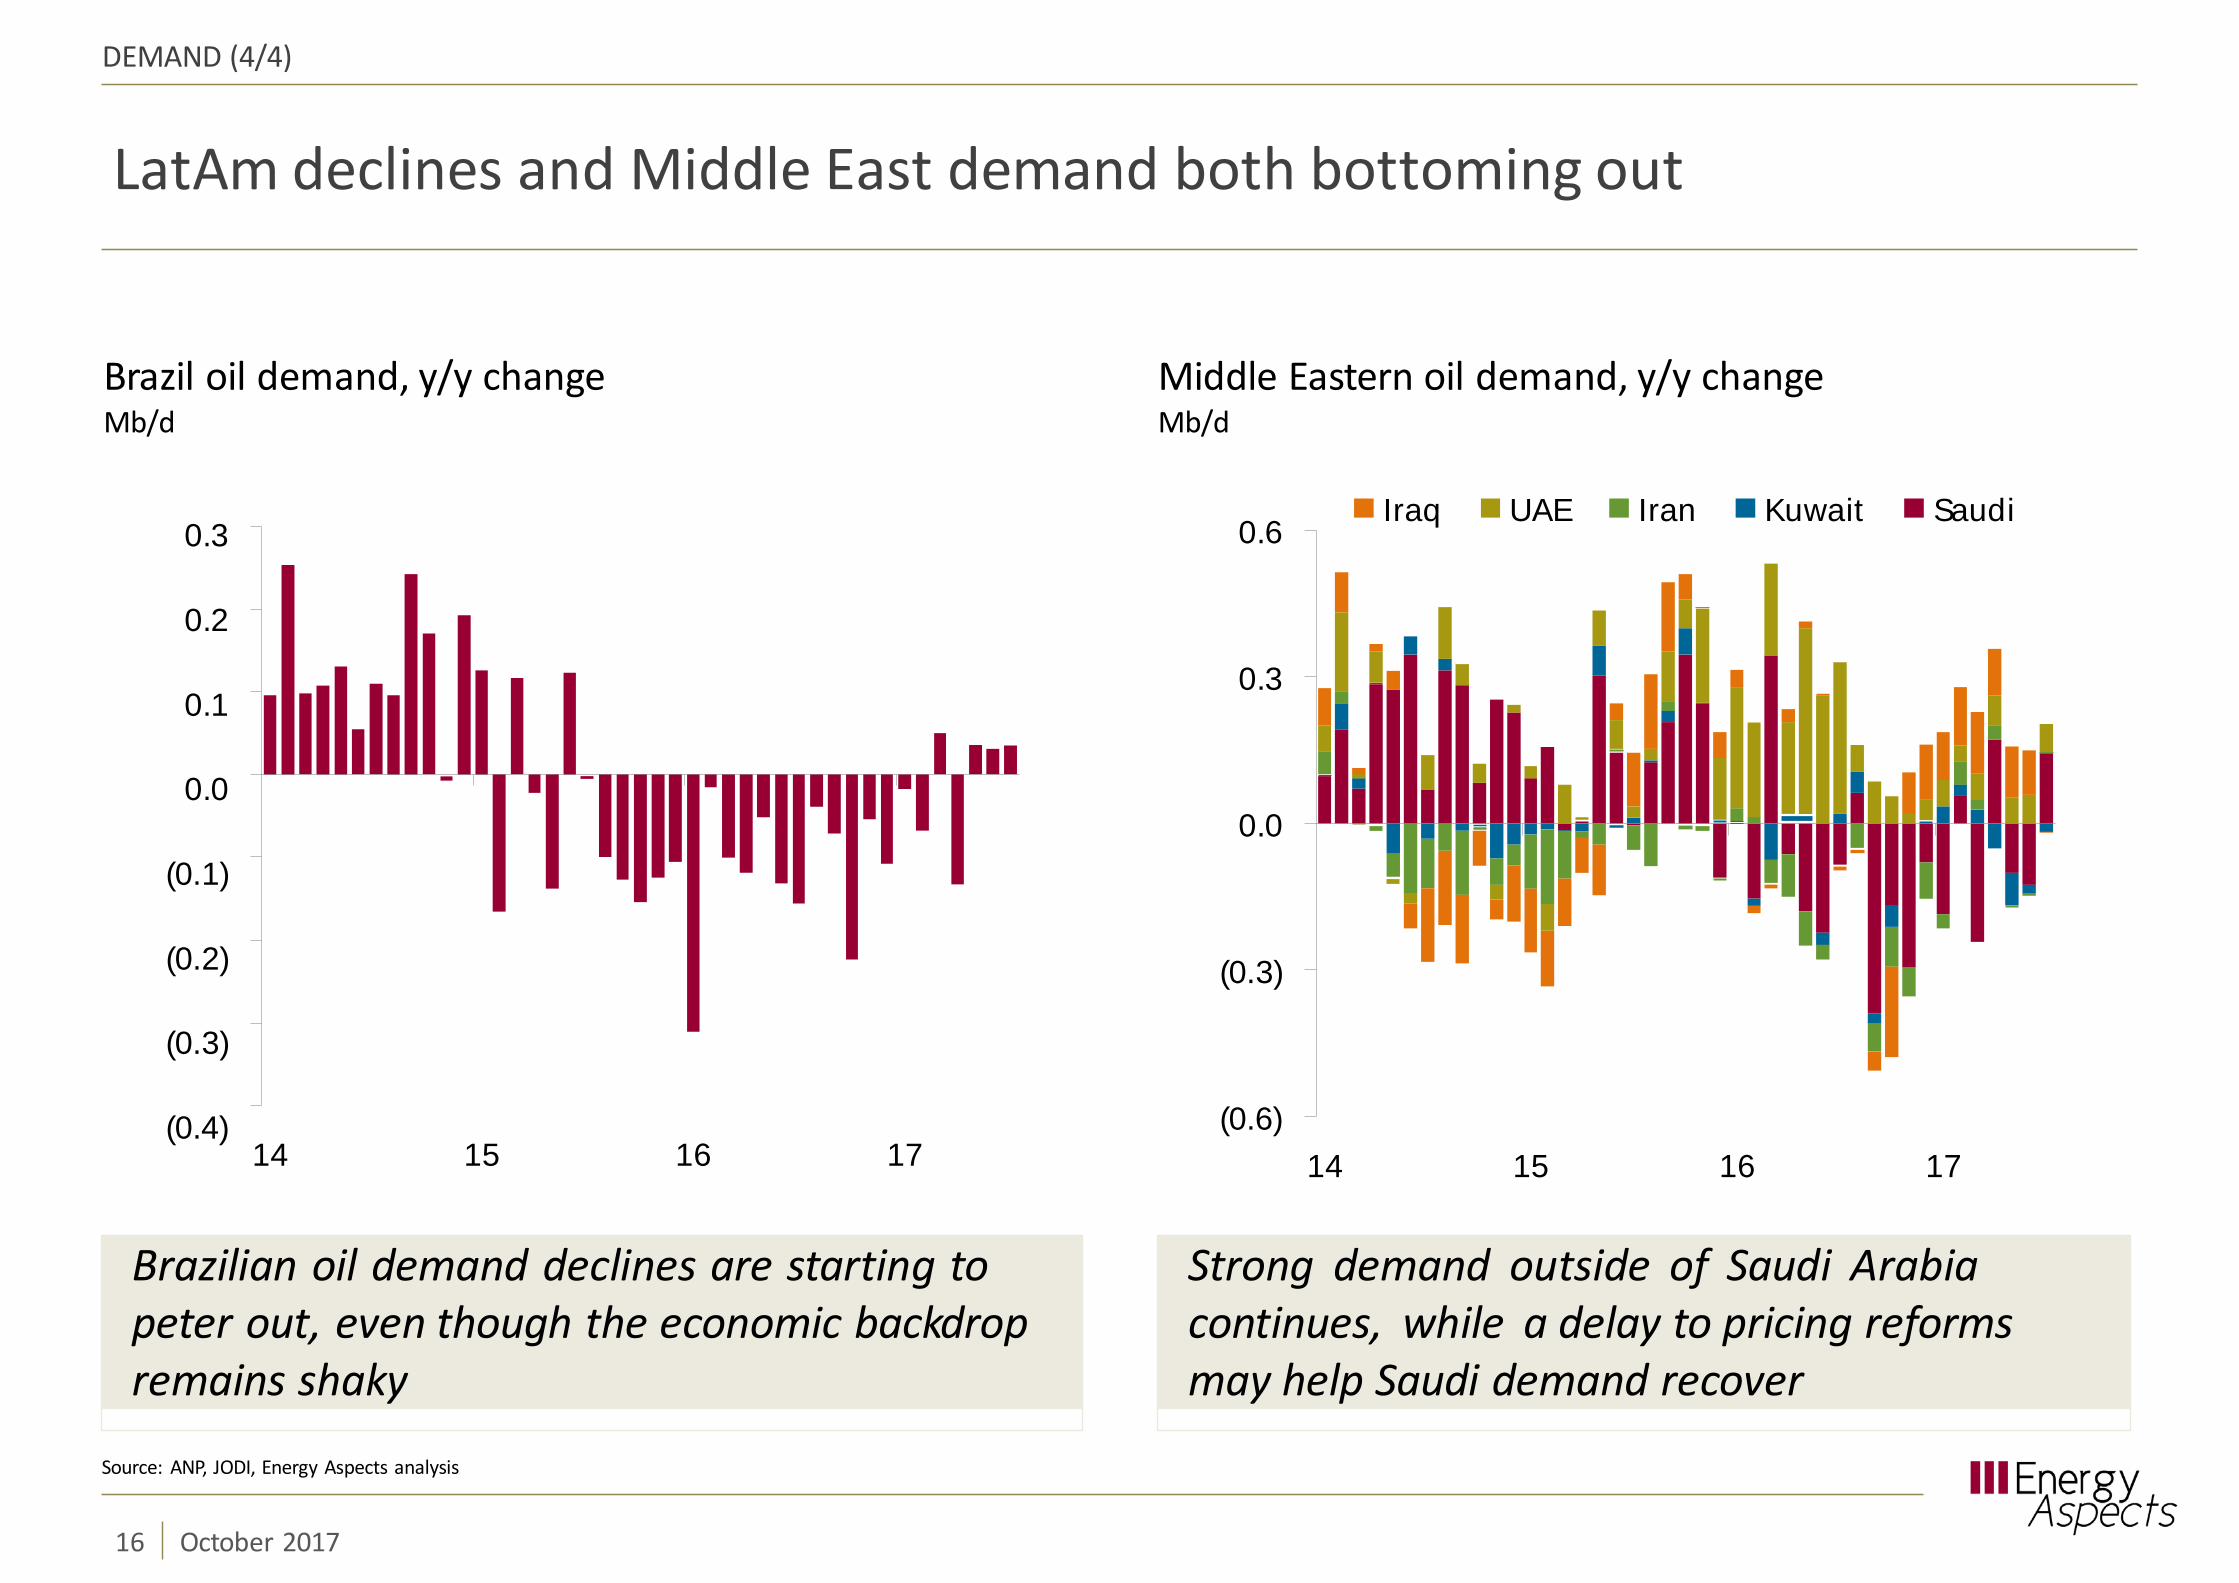
LatAm declines and Middle East demand both bottoming out
Middle Eastern oil demand, y/y changeMb/d
Brazil oil demand, y/y changeMb/d
0.3
0.2
0.1
0.0
(0.1)
(0.2)
(0.3)
(0.4)
DEMAND (4/4)
Strong demand outside of Saudi Arabiacontinues, while a delay to pricing reformsmay help Saudi demand recover
Brazilian oil demand declines are starting topeter out, even though the economic backdropremains shaky
14 15 16 17(0.6)
(0.3)
0.0
0.3
0.6
14 15 16 17
Iraq UAE Iran Kuwait Saudi
Source: ANP, JODI, Energy Aspects analysis
16 October 2017
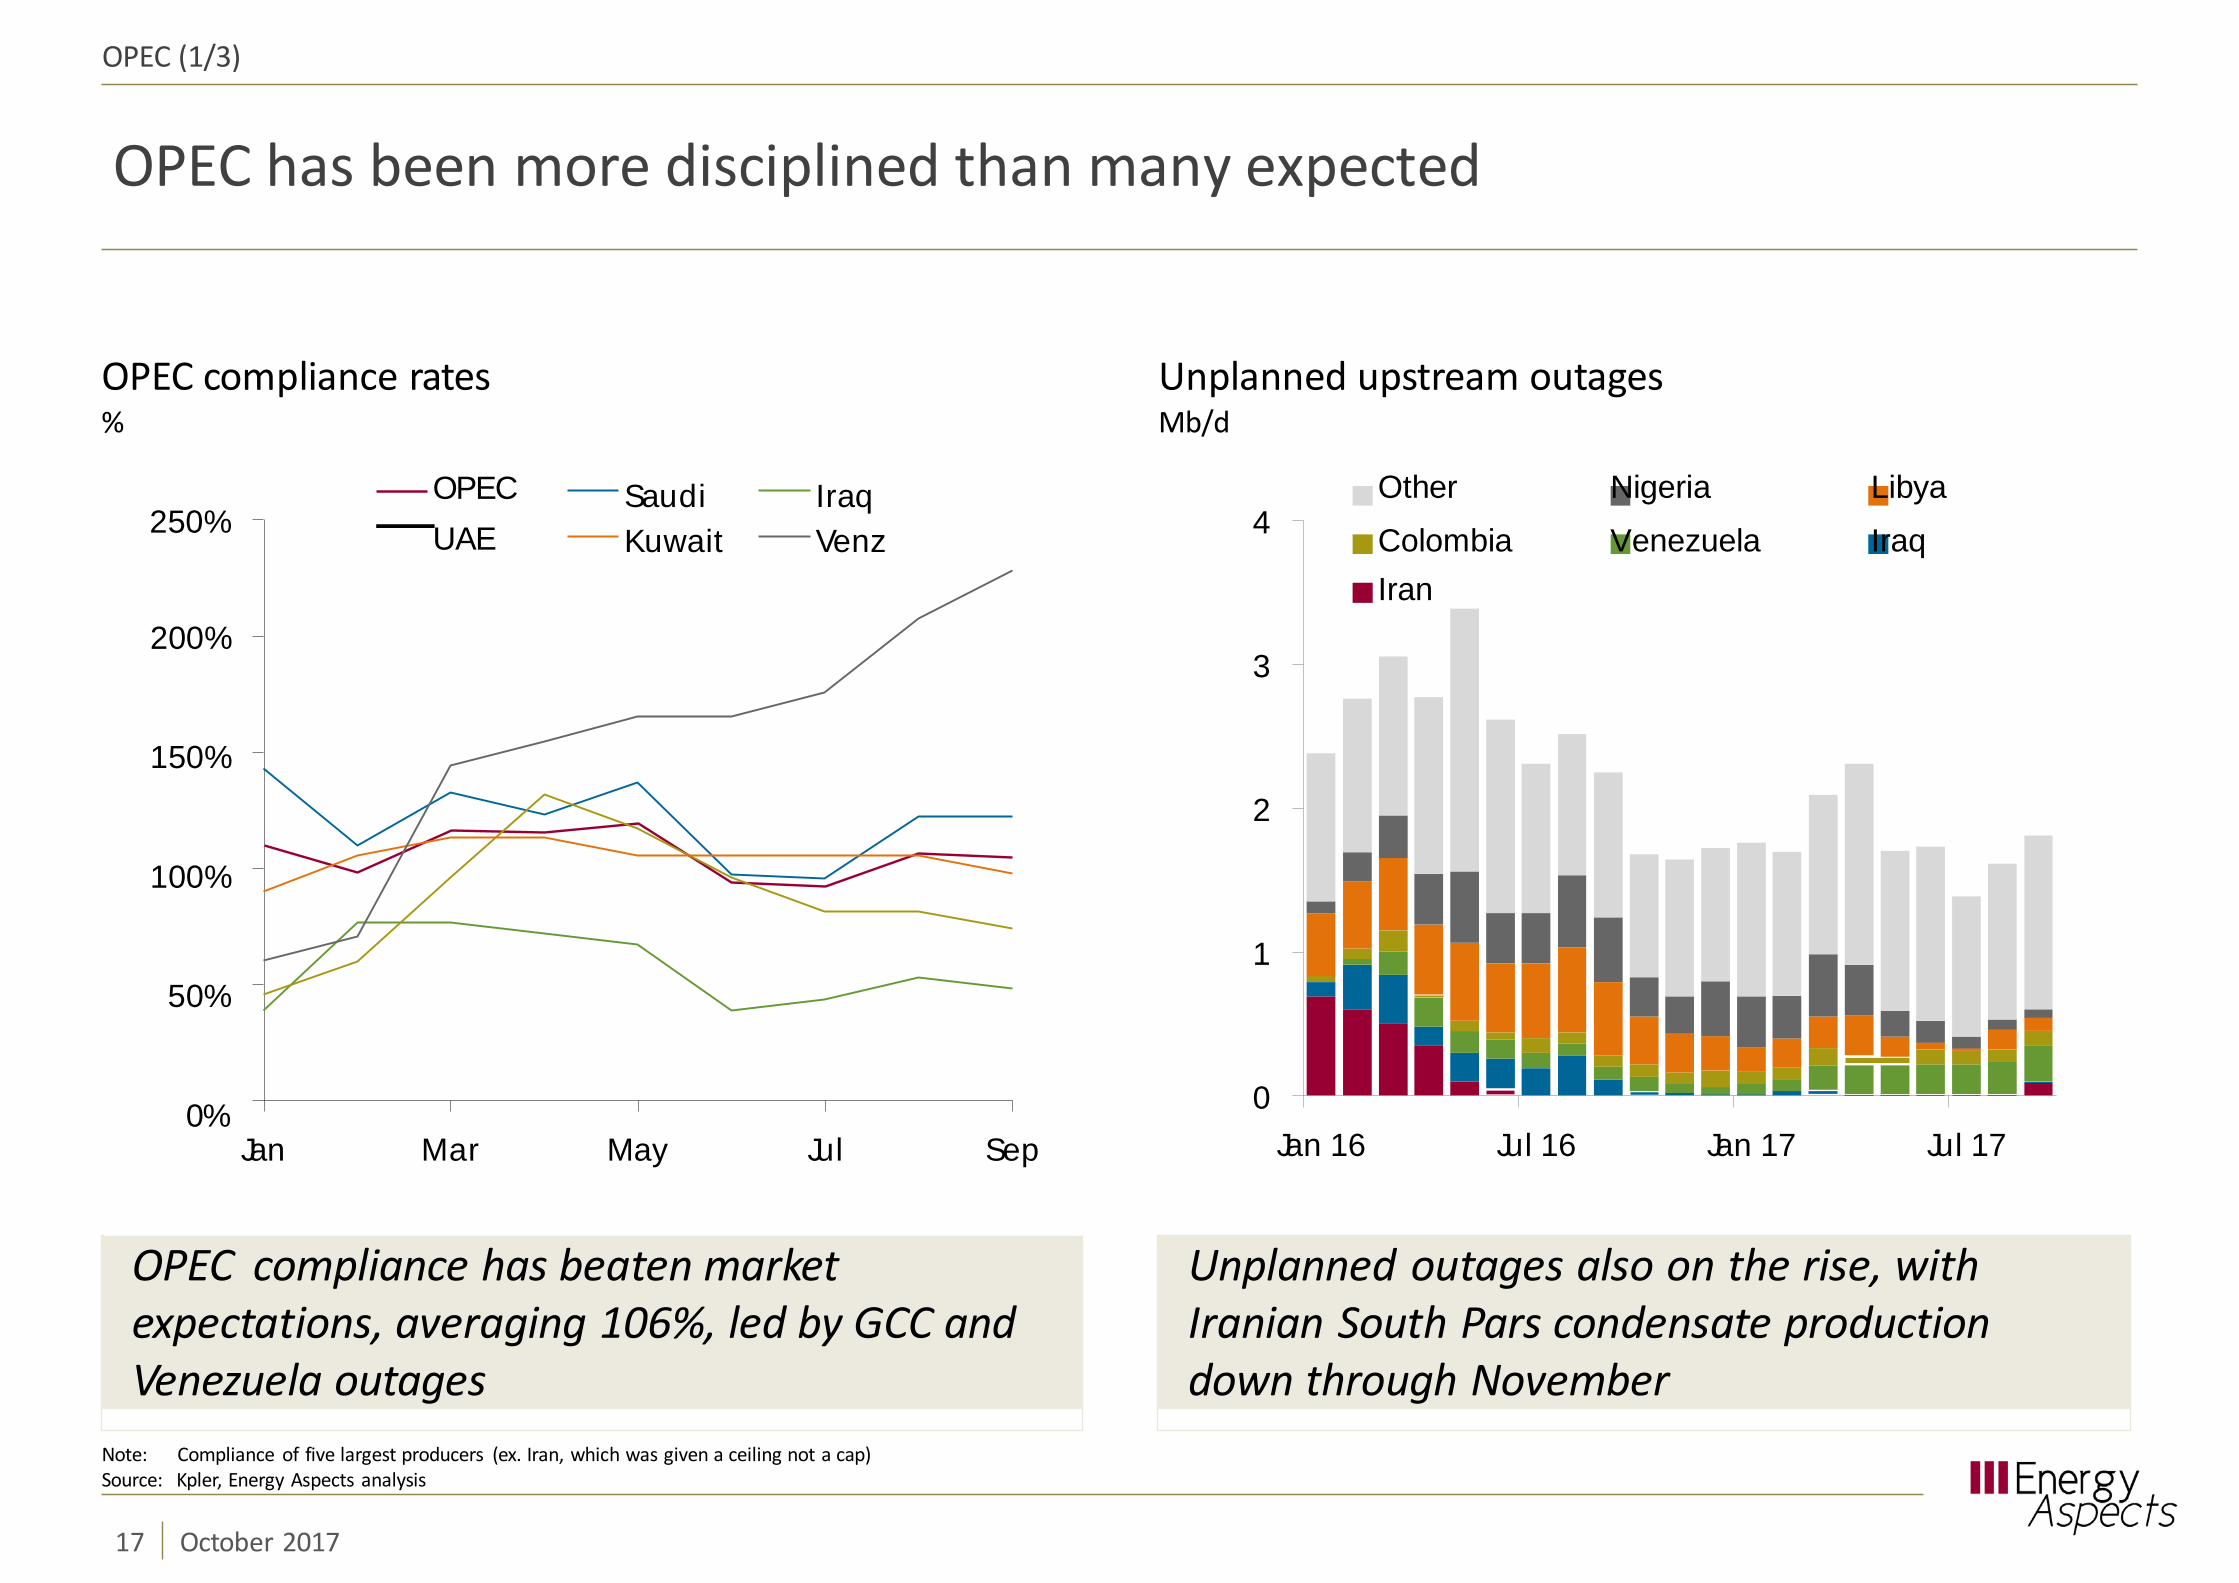
OPEC has been more disciplined than many expected
Unplanned upstream outagesMb/d
OPEC (1/3)
Unplanned outages also on the rise, withIranian South Pars condensate productiondown through November
OPEC compliance has beaten marketexpectations, averaging 106%, led by GCC andVenezuela outages
OPEC compliance rates%
200%
150%
100%
50%
0%
250%OPECUAE
Jan Mar May Jul Sep
SaudiKuwait
IraqVenz
0
1
2
3
4
Jan 16 Jul 16 Jan 17 Jul 17
Note: Compliance of five largest producers (ex. Iran, which was given a ceiling not a cap) Source: Kpler, Energy Aspects analysis
17 October 2017
Other Nigeria LibyaColombia Venezuela IraqIran
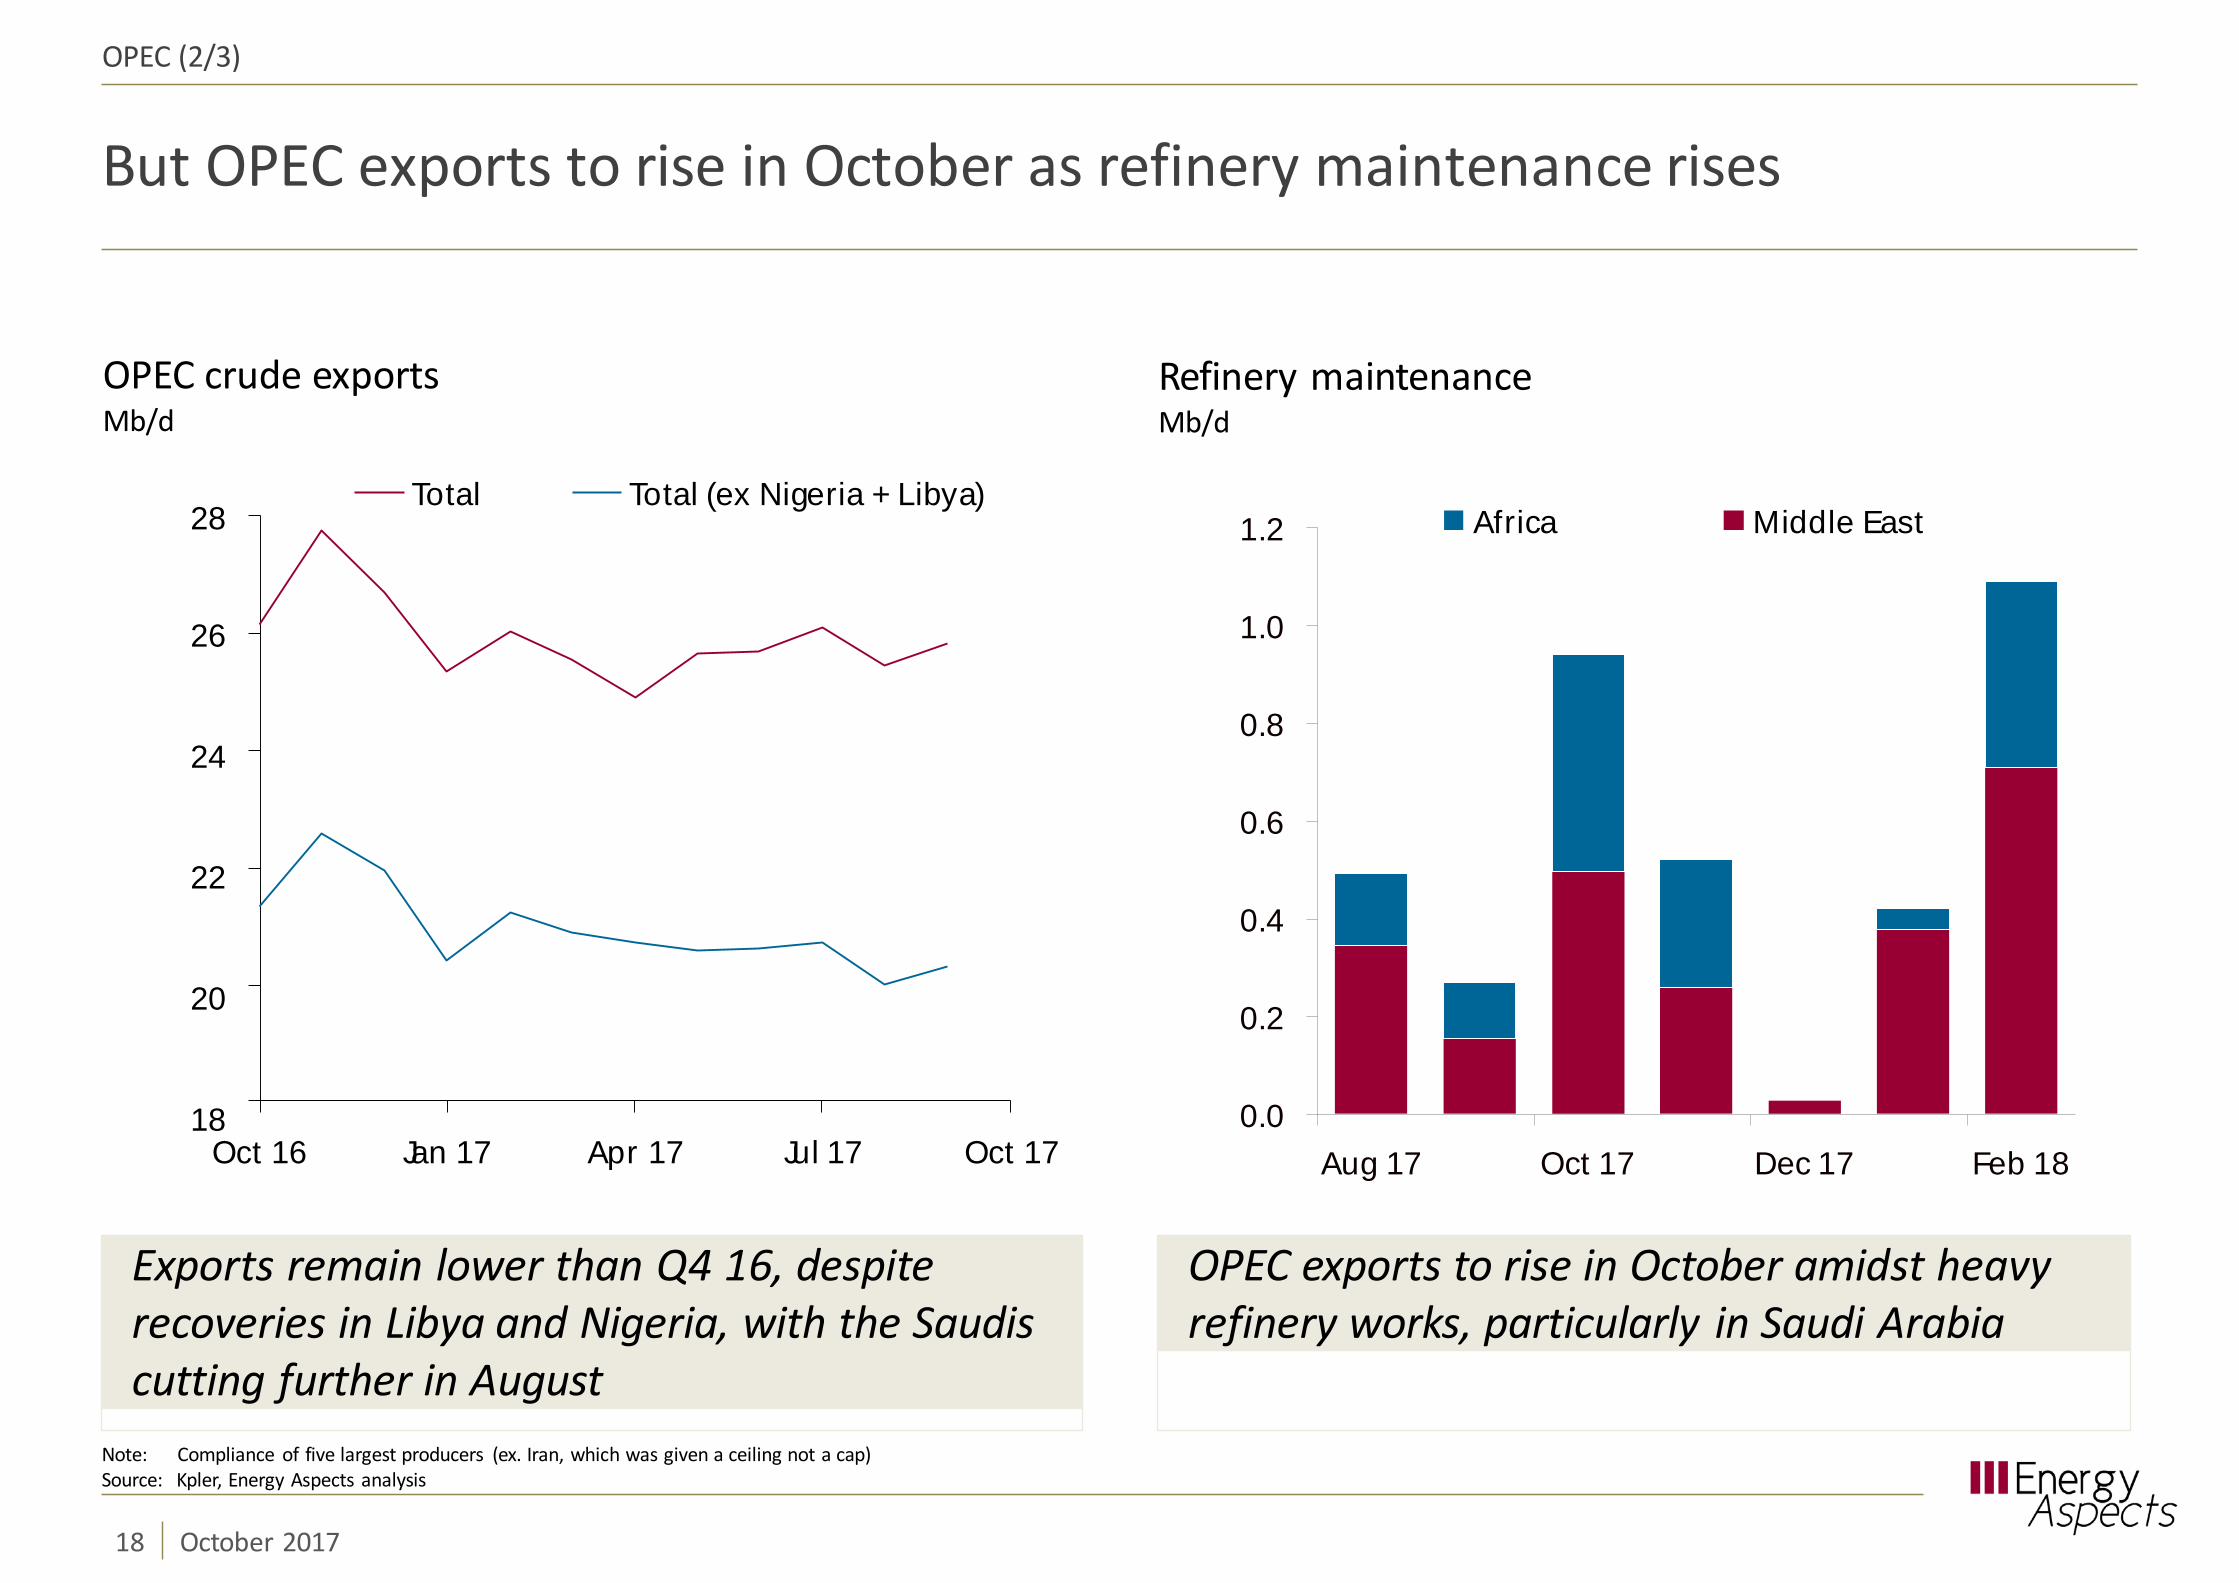
But OPEC exports to rise in October as refinery maintenance rises
Refinery maintenanceMb/d
OPEC (2/3)
OPEC exports to rise in October amidst heavyrefinery works, particularly in Saudi Arabia
Exports remain lower than Q4 16, despiterecoveries in Libya and Nigeria, with the Saudiscutting further in August
OPEC crude exportsMb/d
0.0
0.2
0.4
0.6
0.8
1.0
1.2
Aug 17 Oct 17 Dec 17 Feb 18
Africa Middle East
26
24
22
20
18
28
Oct 16 Jan 17 Apr 17 Jul 17 Oct 17
Total Total (ex Nigeria + Libya)
Note: Compliance of five largest producers (ex. Iran, which was given a ceiling not a cap) Source: Kpler, Energy Aspects analysis
18 October 2017

Extension of production deal will soon be in focus
(1.0)
(0.5)
0.0
13 14 15 16 17
Saudi and Iraqi output, y/y changeMb/d
Iraq
Saudi Arabia
OPEC (3/3)
Even Iraqi compliance has been better thanexpected, but whether they agree to anextension remains a question
Nigeria could be included in the deal, butadding Libya is unlikely especially given recentvolatility in Libyan production
0.5
1.0
1.5
2.0
2.5
Libyan productionMb/d
1.6
Source: MEES, Energy Aspects analysis
19 October 2017
0.0
0.4
0.8
1.2
12 13 14 15 16 17 18
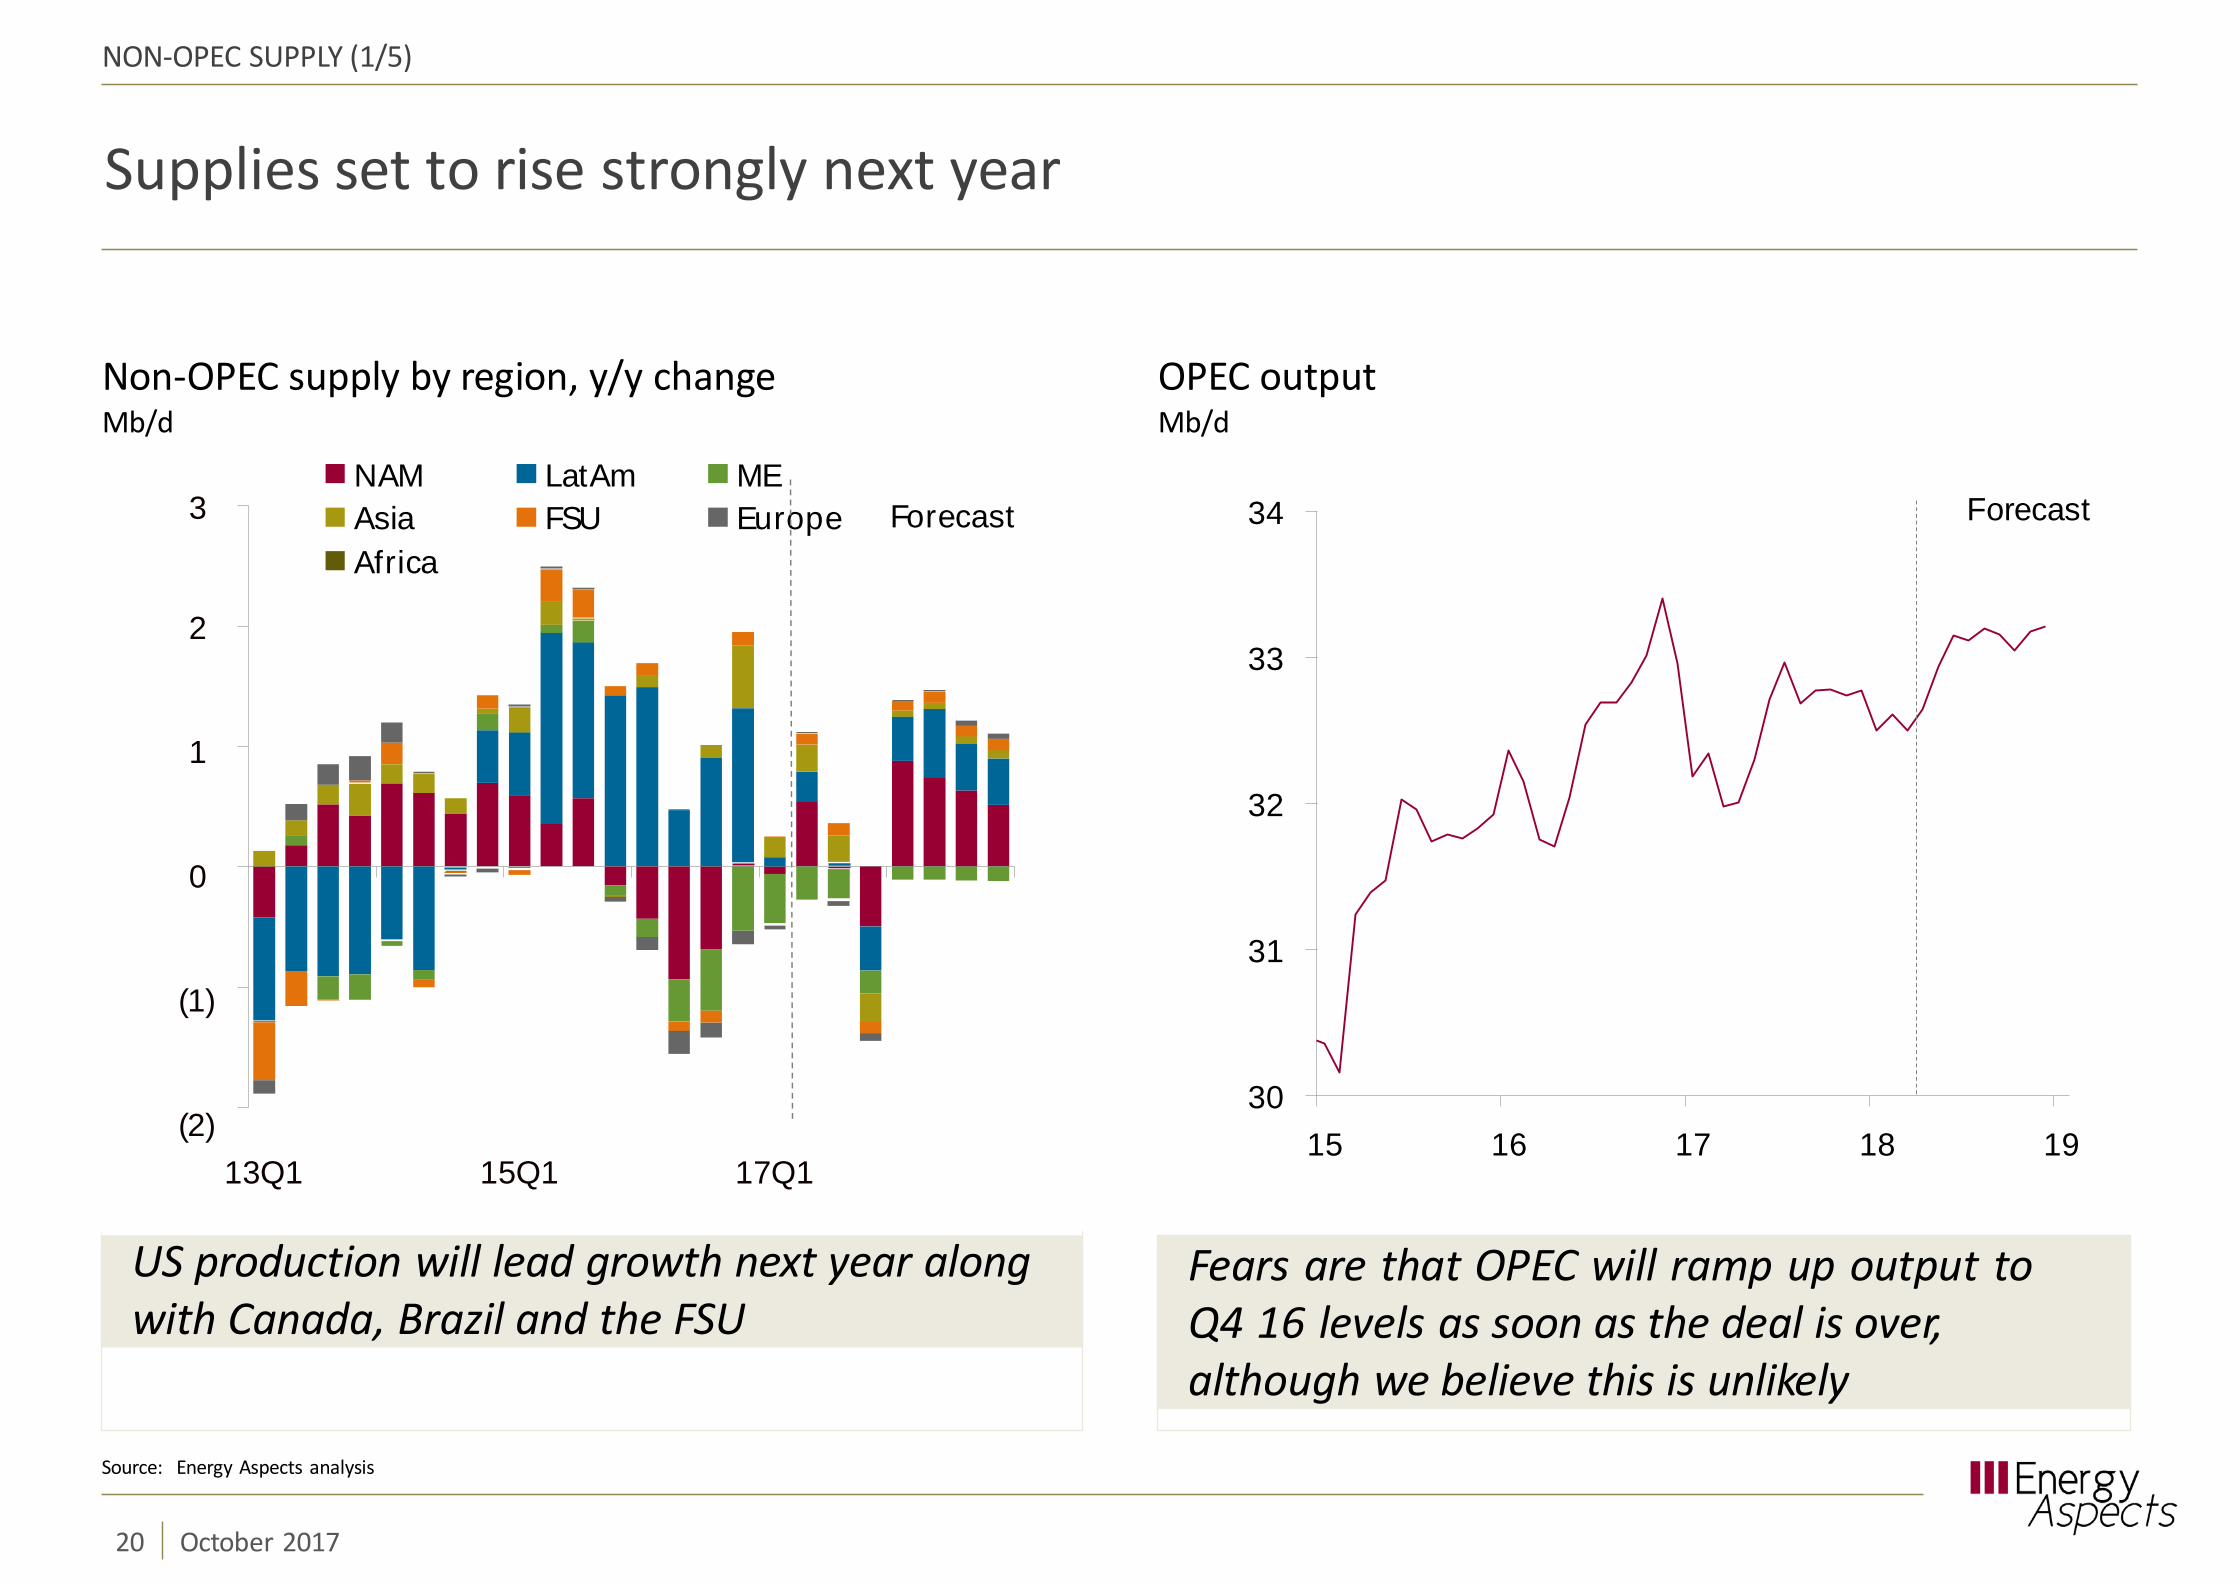
Supplies set to rise strongly next year
NON-OPEC SUPPLY (1/5)
Non-OPEC supply by region, y/y changeMb/d
US production will lead growth next year alongwith Canada, Brazil and the FSU
OPEC outputMb/d
2
1
0
(1)
(2)13Q1 15Q1 17Q1
3NAM LatAm MEAsia FSU Europe Africa
Forecast
Fears are that OPEC will ramp up output toQ4 16 levels as soon as the deal is over,although we believe this is unlikely
30
31
32
33
34
15 16 17 18 19
Forecast
Source: Energy Aspects analysis
20 October 2017
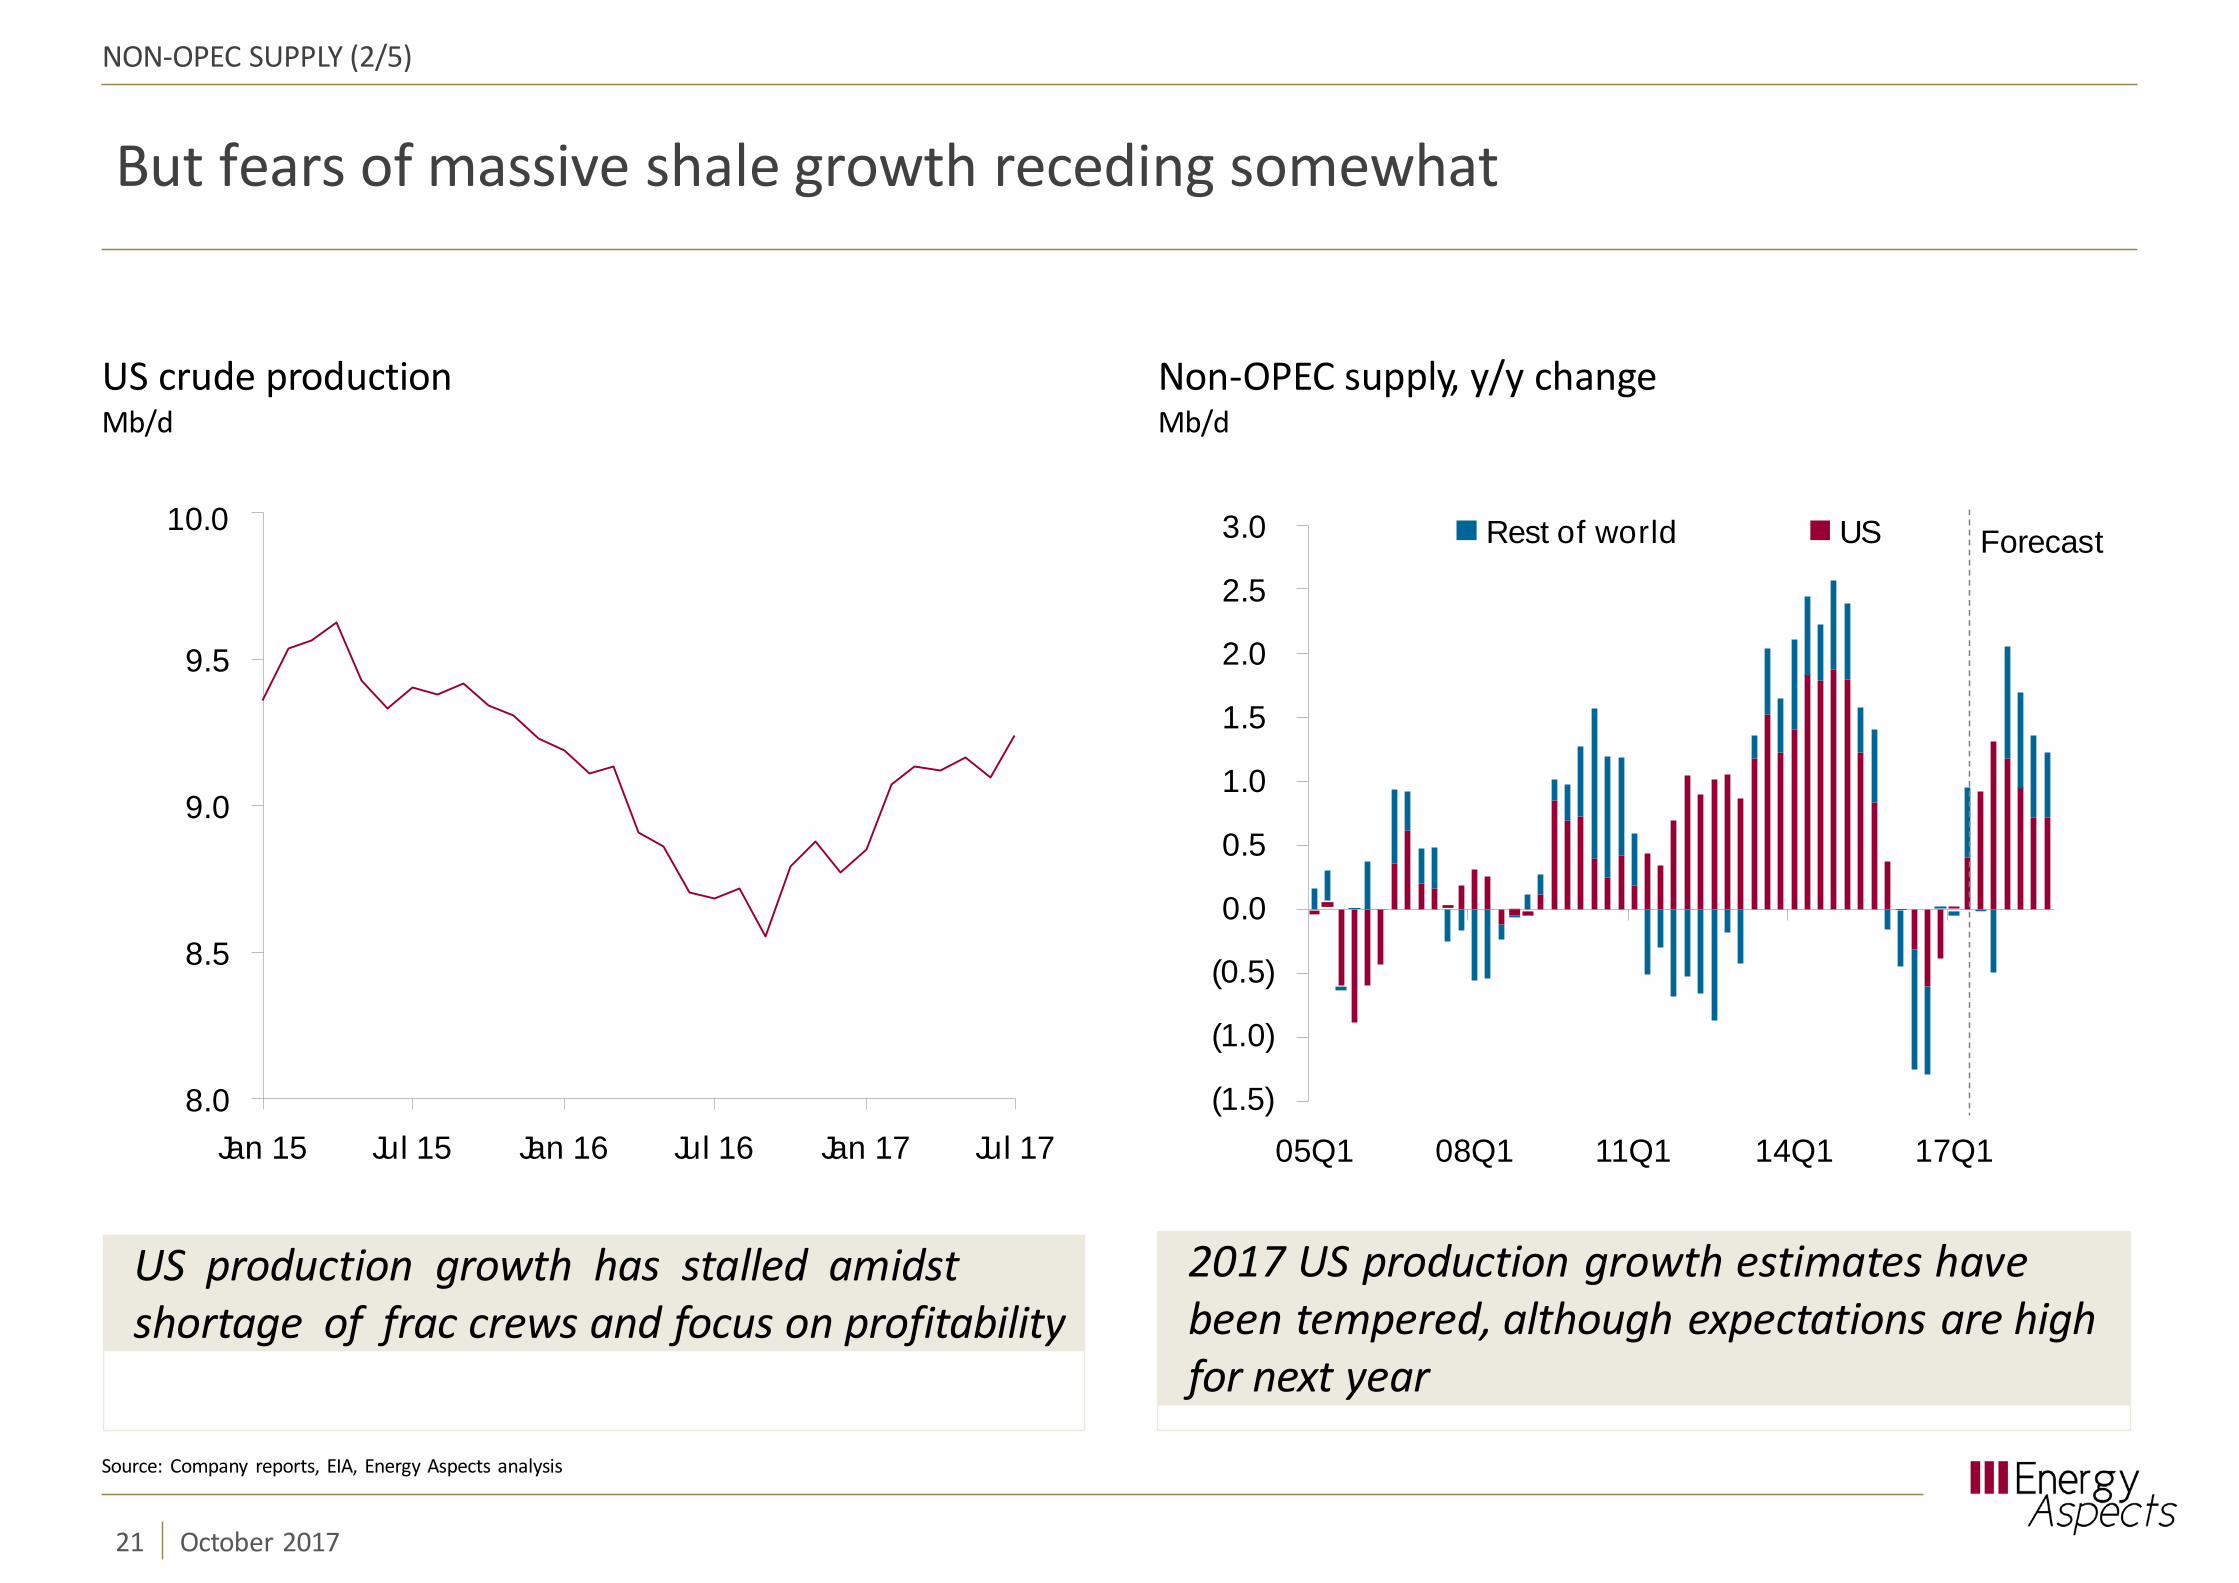
But fears of massive shale growth receding somewhat
NON-OPEC SUPPLY (2/5)
05Q1 08Q1 11Q1 14Q1 17Q1
US crude productionMb/d
10.0
Non-OPEC supply, y/y changeMb/d
US production growth has stalled amidstshortage of frac crews and focus on profitability
2017 US production growth estimates havebeen tempered, although expectations are highfor next year
3.0
2.5
2.0
1.5
1.0
0.5
0.0
(0.5)
(1.0)
(1.5)
Rest of world US Forecast
8.0
Source: Company reports, EIA, Energy Aspects analysis
21 October 2017
8.5
9.0
9.5
Jan 15 Jul 15 Jan 16 Jul 16 Jan 17 Jul 17
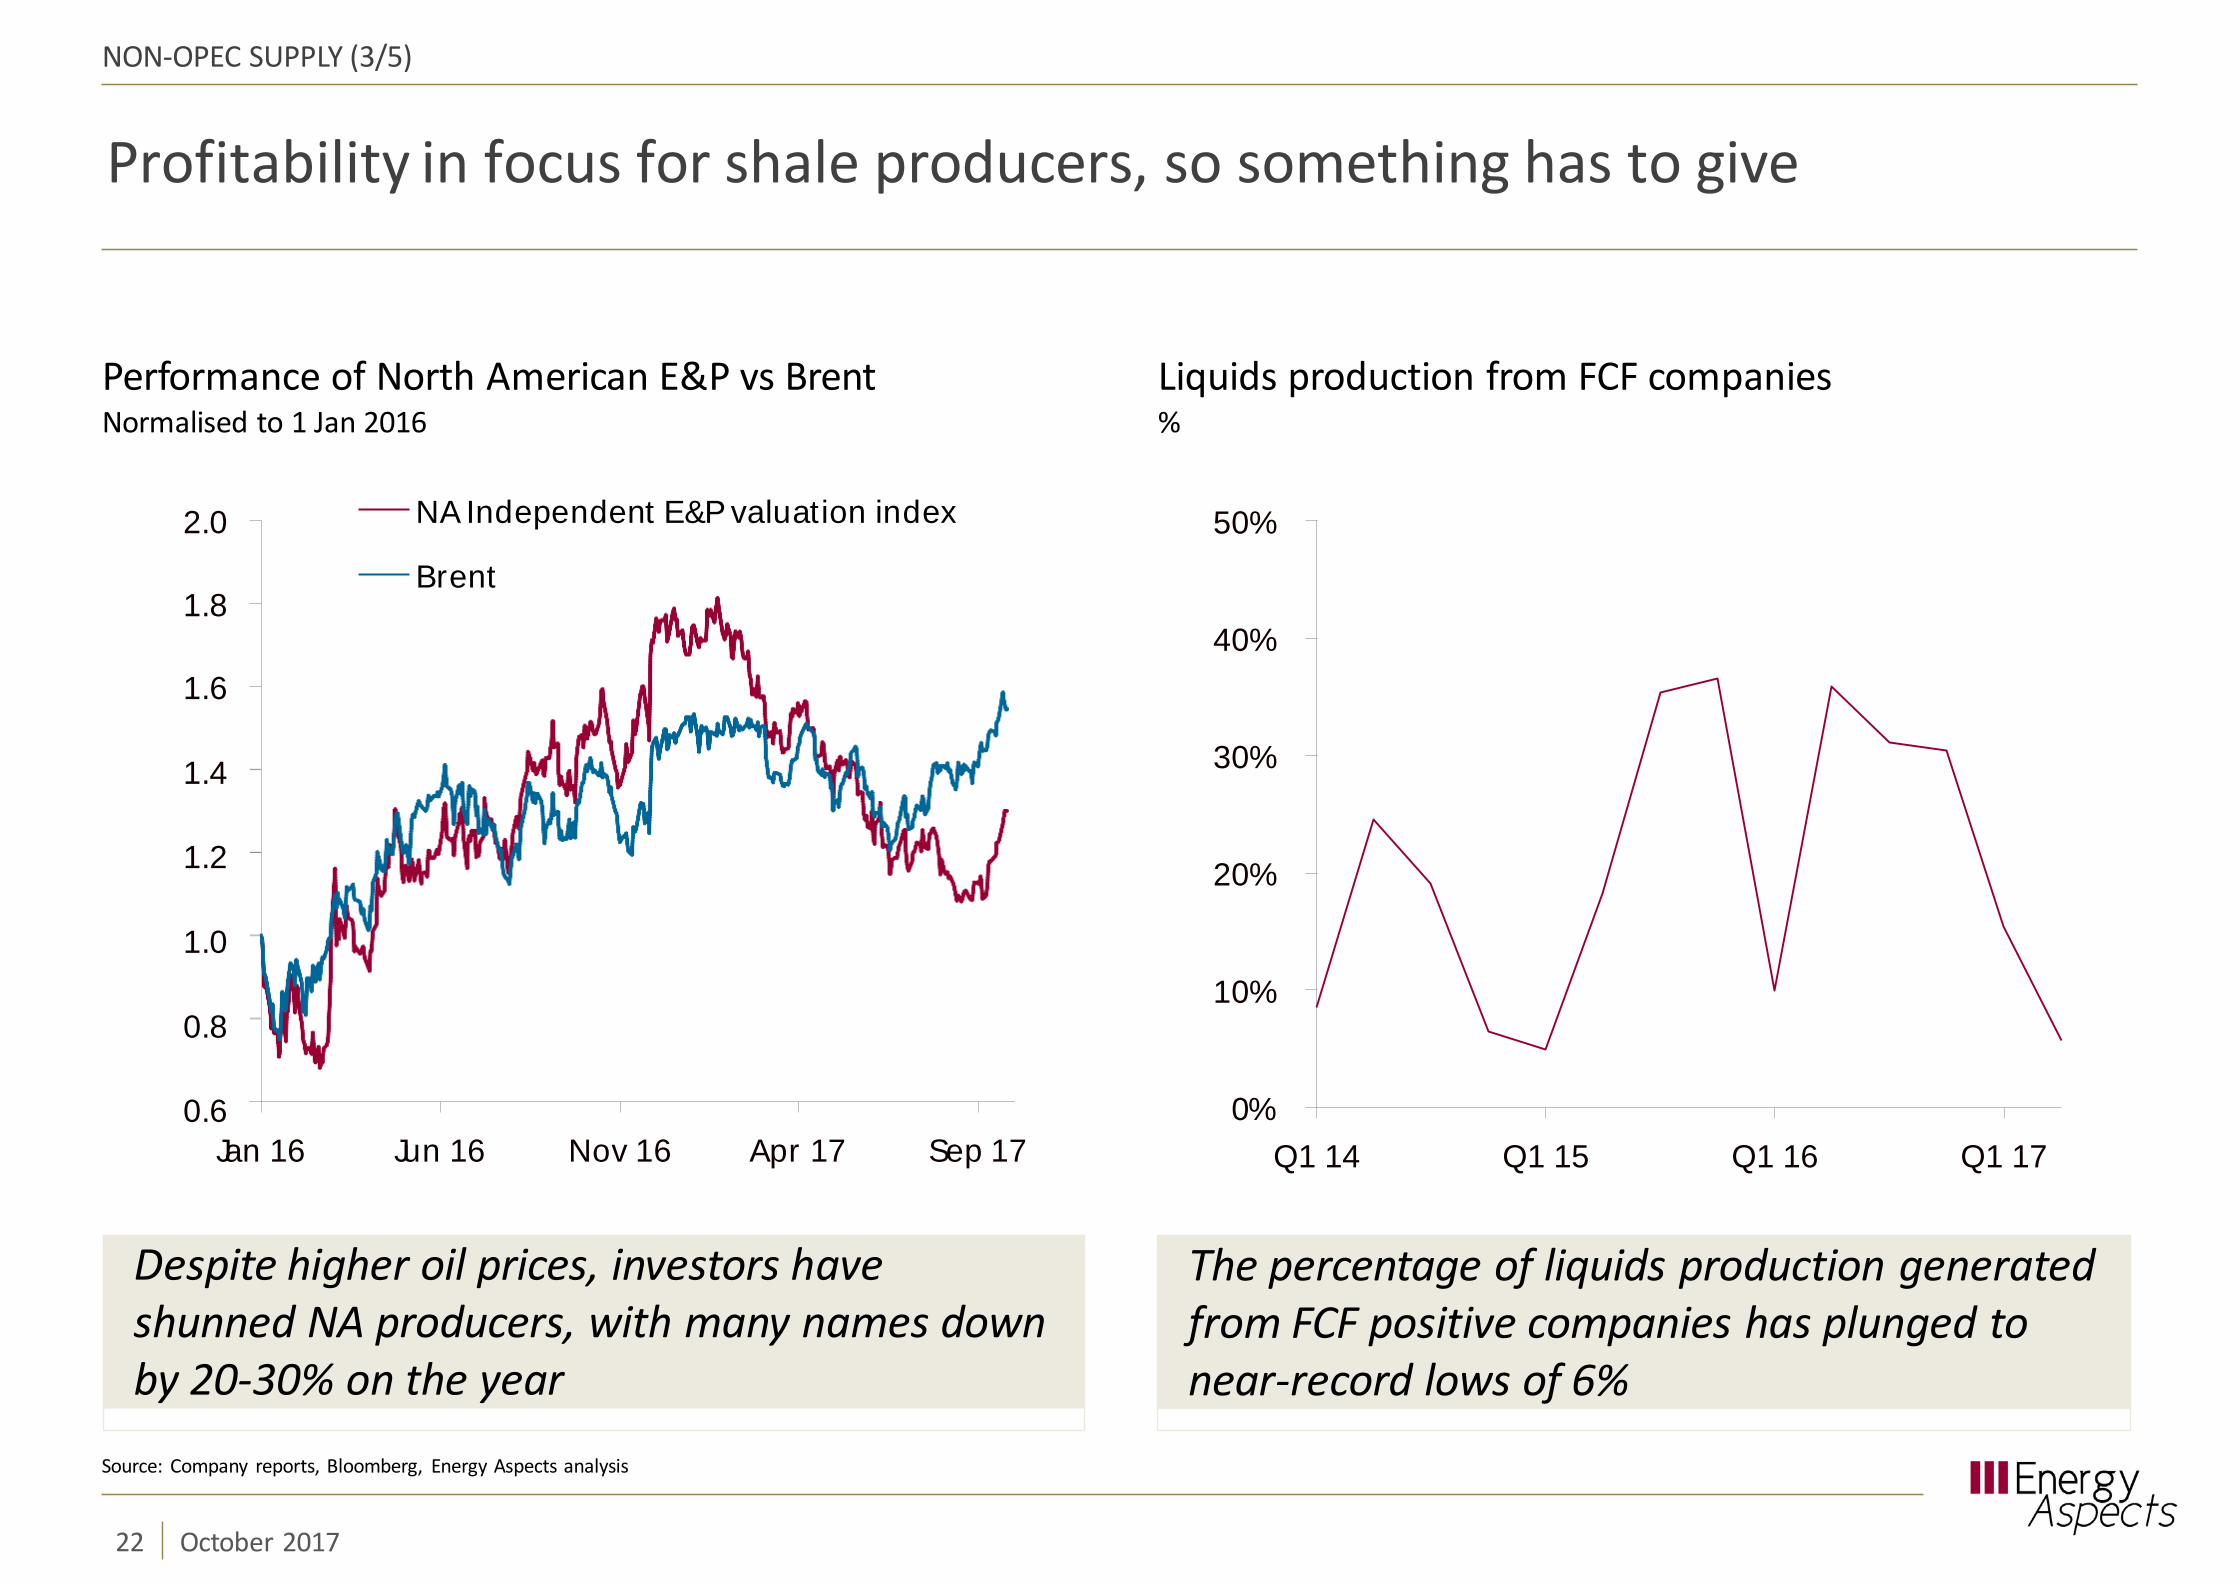
Profitability in focus for shale producers, so something has to give
NON-OPEC SUPPLY (3/5)
Performance of North American E&P vs BrentNormalised to 1 Jan 2016
Liquids production from FCF companies%
Despite higher oil prices, investors haveshunned NA producers, with many names downby 20-30% on the year
The percentage of liquids production generatedfrom FCF positive companies has plunged tonear-record lows of 6%
0%
10%
20%
30%
40%
50%
Q1 14 Q1 15 Q1 16 Q1 17
1.6
1.4
1.2
1.0
0.8
0.6
1.8
2.0
Jan 16 Jun 16 Nov 16 Apr 17 Sep 17
NA Independent E&P valuation index
Brent
Source: Company reports, Bloomberg, Energy Aspects analysis
22 October 2017

‘Growth at any cost’ is no longer being rewarded
H2 17 Capex and production trends for large caps$ billion and thousand boe/d
Note: Total excludes Anadarko as divestures at the company distort underlying trends
NON-OPEC SUPPLY (4/5)
Despite stated efficiency gains, growth still driven by rising Capex profile. To meet growth targets, Capex stillneeds to rise, which will worsen free cashflow trends if prices stay flat. Either output will be downgraded, orprices must increase to meet optimistic expectations for US growth
Source: Company reports, Bloomberg, Energy Aspects
23 October 2017
Capex - $ billionH2 17 H2 16y/y chg.
Production thousand boe/dH2 17 H2 16 y/y chg.
Anadarko 2,004 1,626 23% 630 778 --Apache 1,876 906 107% 460 429 7%Continental 965 535 81% 250 209 20%Devon 549 1,095 (50%) 550 557 (1%)EOG 1,927 1,395 38% 605 569 6%Hess 1,440 1,016 42% 308 313 (1%)Marathon 1,375 492 179% 365 413 (12%)Murphy 458 322 42% 164 169 (3%)Noble 1,235 729 69% 365 418 (13%)Oxy 1,769 1,533 15% 610 606 1%Pioneer 1,425 963 48% 285 240 19%Whiting 611 188 225% 125 119 5%
Total 15,633 10,800 45% 4,087 4,042 1%
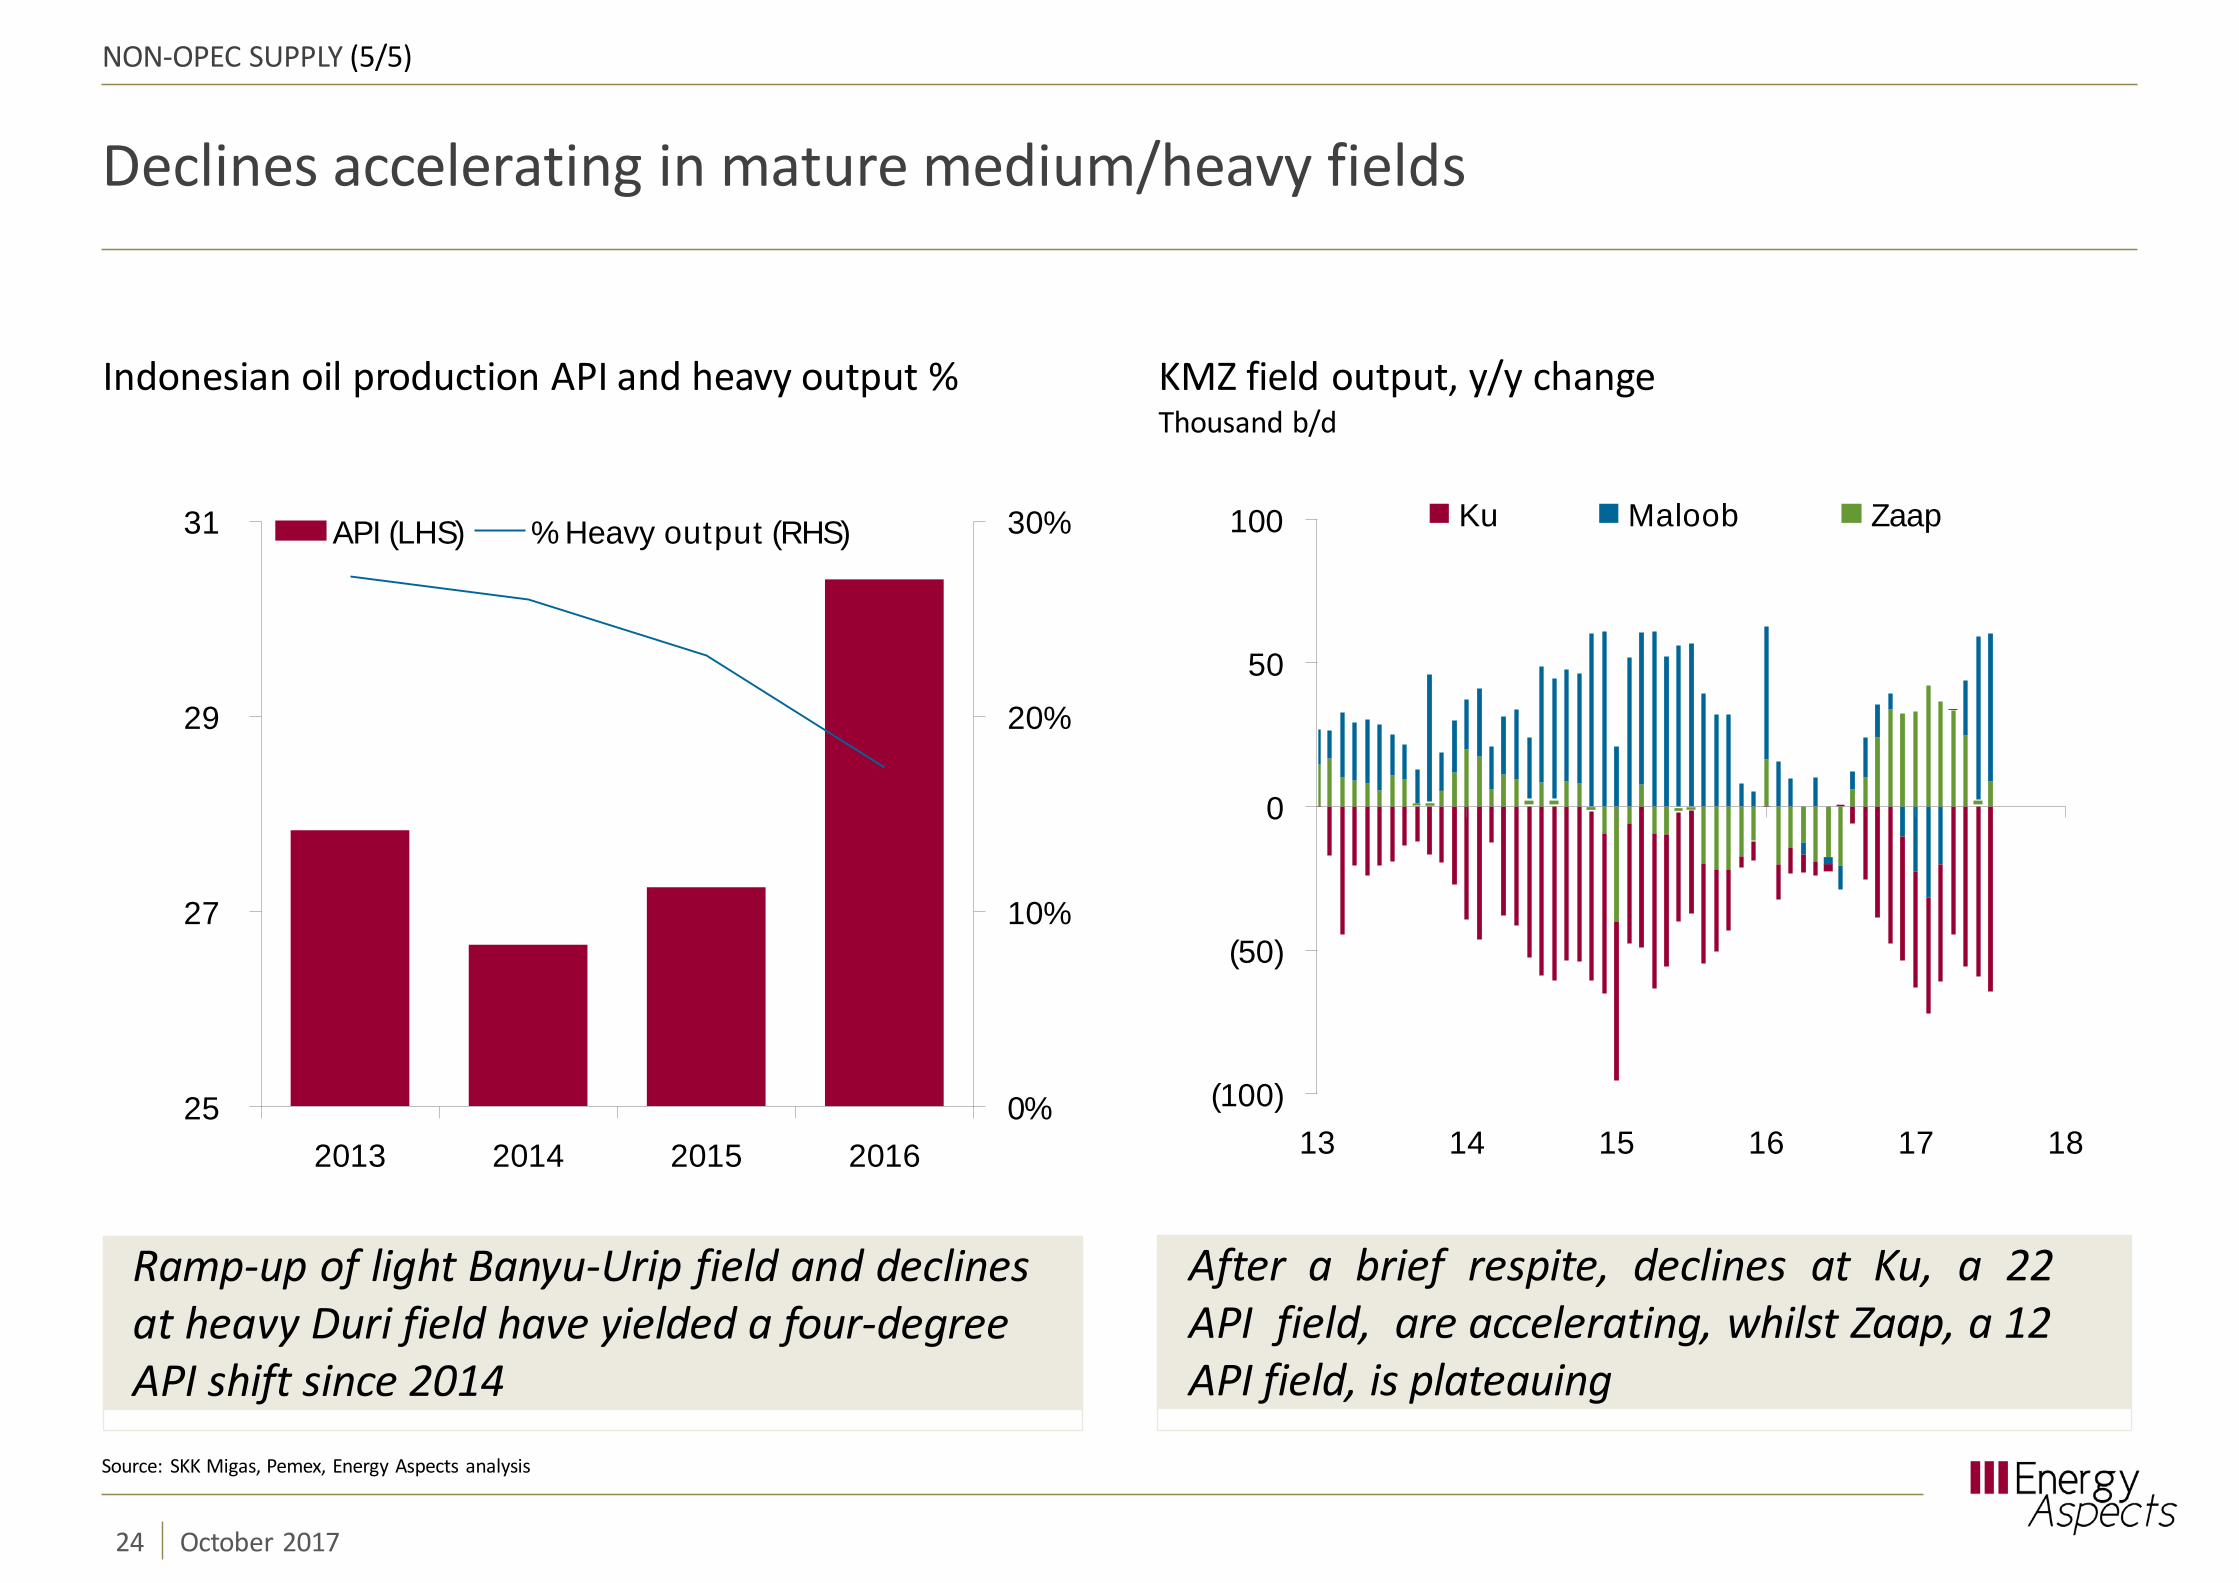
Declines accelerating in mature medium/heavy fields
NON-OPEC SUPPLY (5/5)
Indonesian oil production API and heavy output % KMZ field output, y/y changeThousand b/d
0%
10%
20%
30%
25
27
29
31
2013 2014 2015 2016
API (LHS) % Heavy output (RHS)
Ramp-up of light Banyu-Urip field and declinesat heavy Duri field have yielded a four-degreeAPI shift since 2014
After a brief respite, declines at Ku, a 22API field, are accelerating, whilst Zaap, a 12API field, is plateauing
(100)
(50)
0
50
100
13 14 15 16 17 18
Ku Maloob Zaap
Source: SKK Migas, Pemex, Energy Aspects analysis
24 October 2017
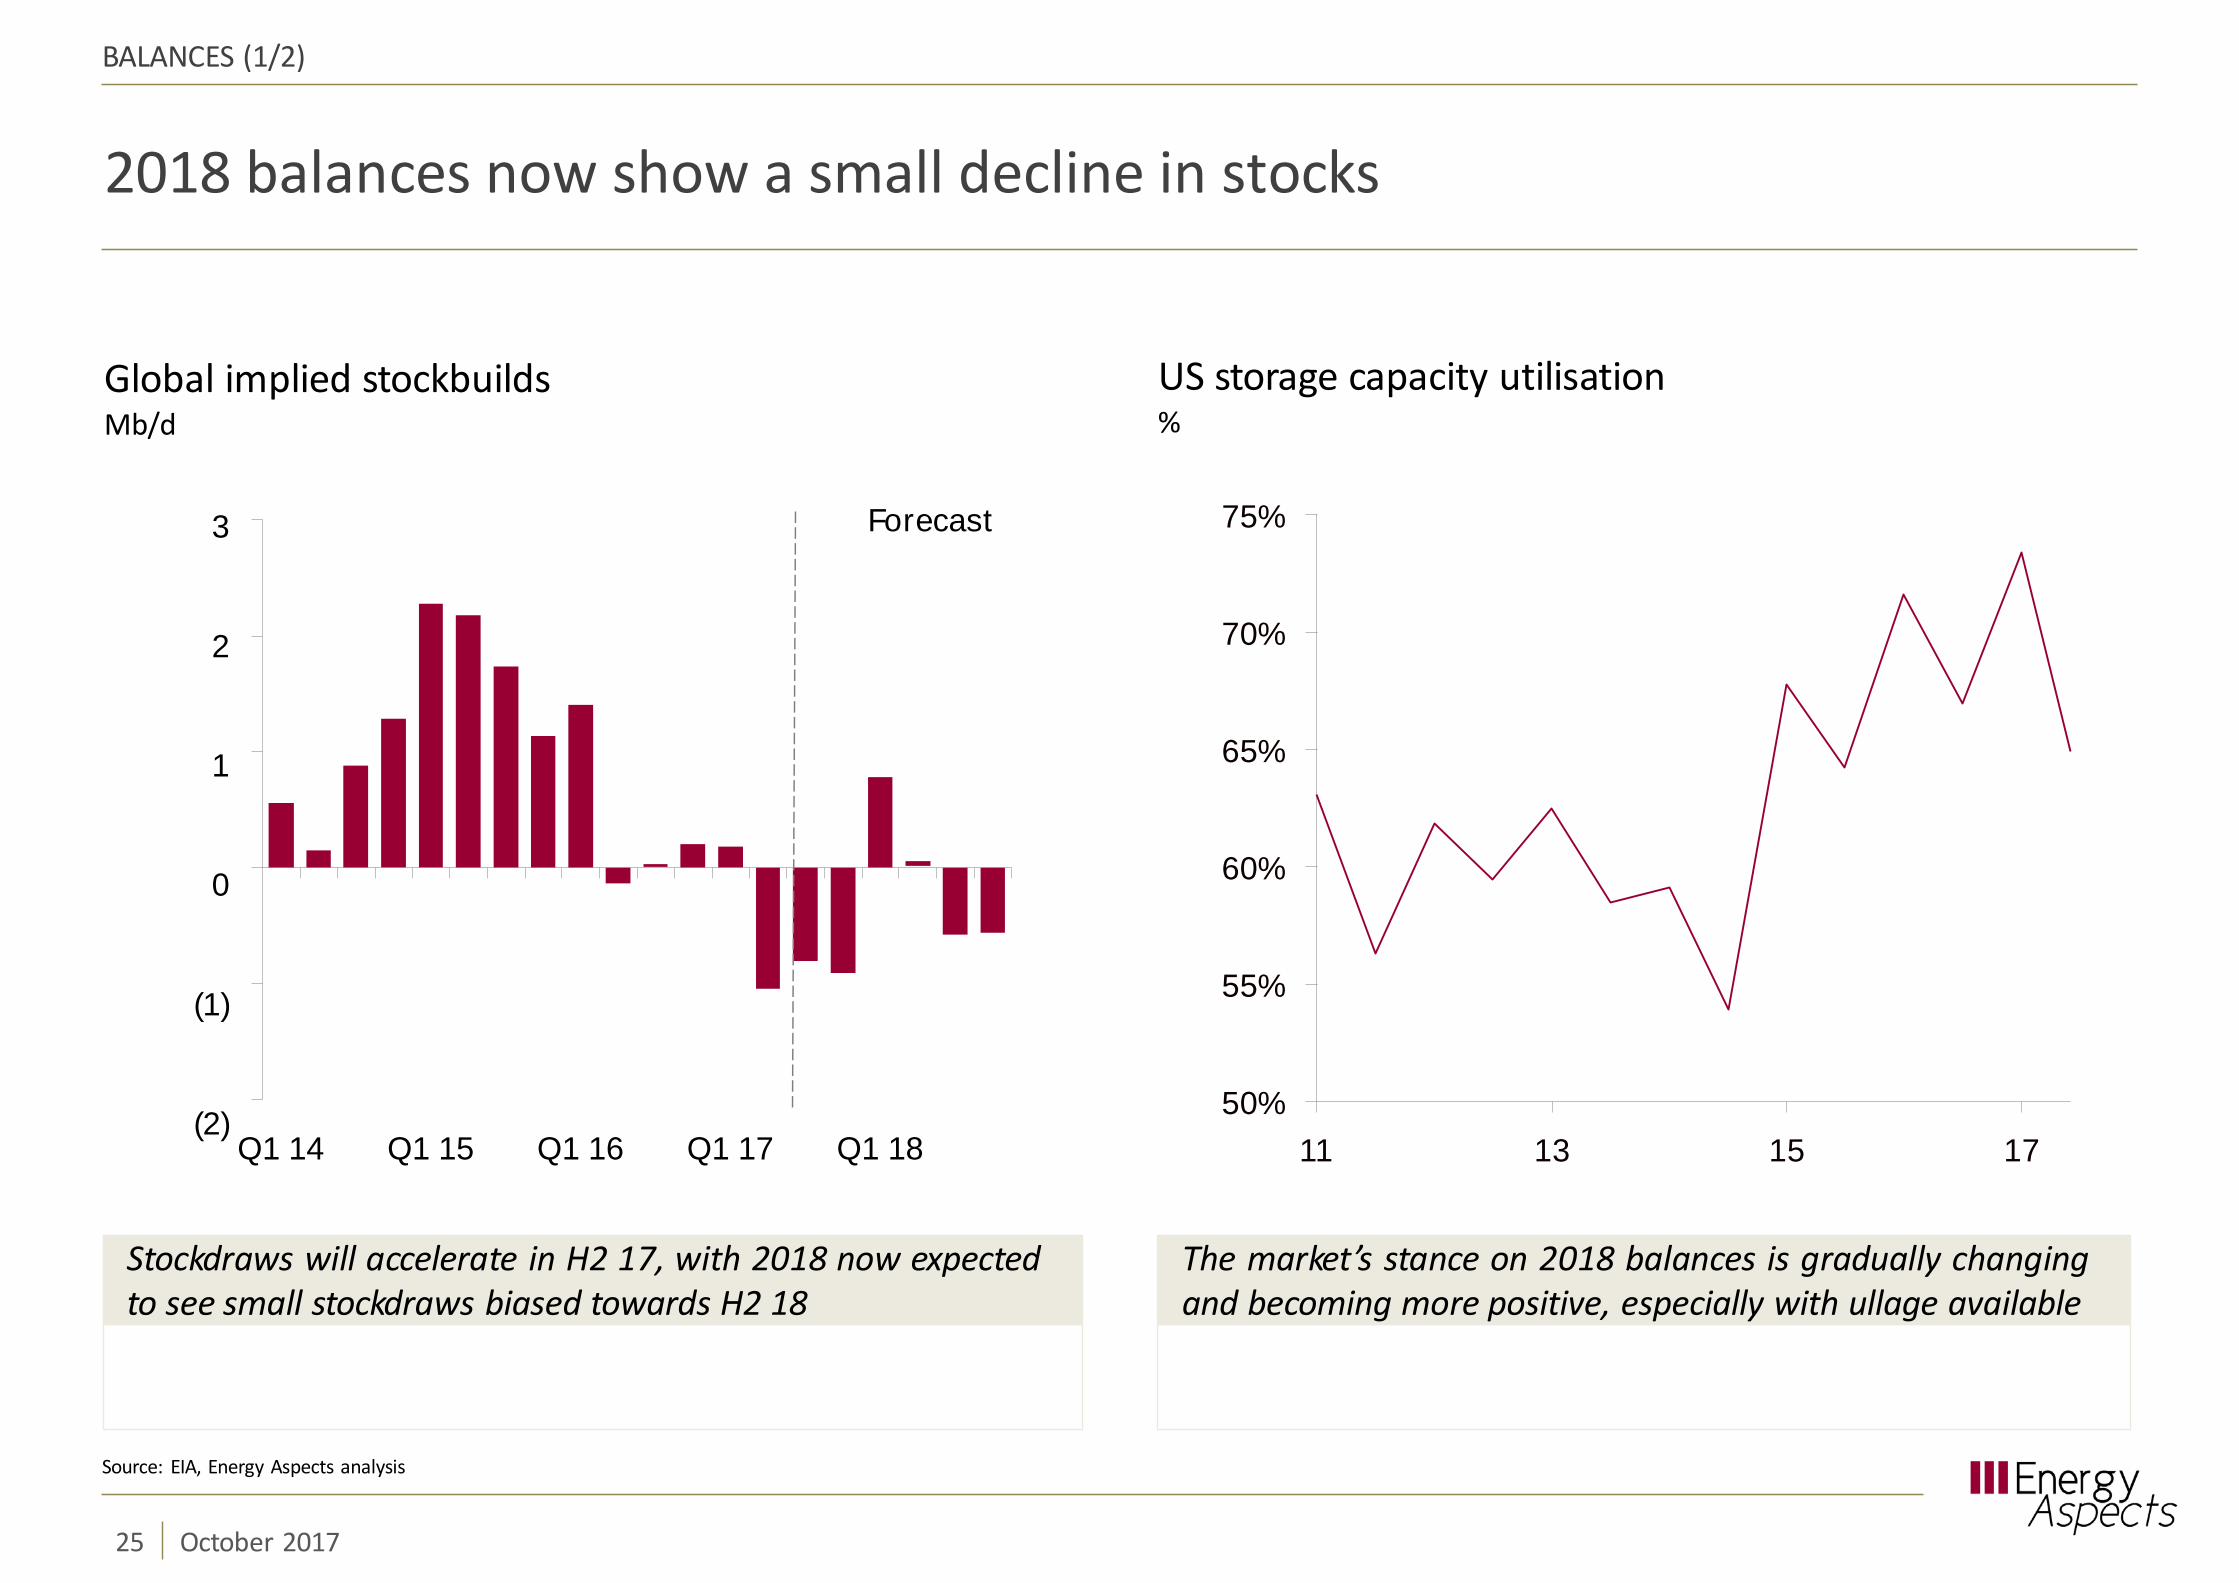
2018 balances now show a small decline in stocks
US storage capacity utilisation%
Global implied stockbuildsMb/d
3
2
1
0
(1)
(2)
BALANCES (1/2)
Stockdraws will accelerate in H2 17, with 2018 now expectedto see small stockdraws biased towards H2 18
The market’s stance on 2018 balances is gradually changingand becoming more positive, especially with ullage available
Q1 14 Q1 15 Q1 16 Q1 17 Q1 18
Forecast
50%
Source: EIA, Energy Aspects analysis
25 October 2017
55%
60%
65%
70%
75%
11 13 15 17
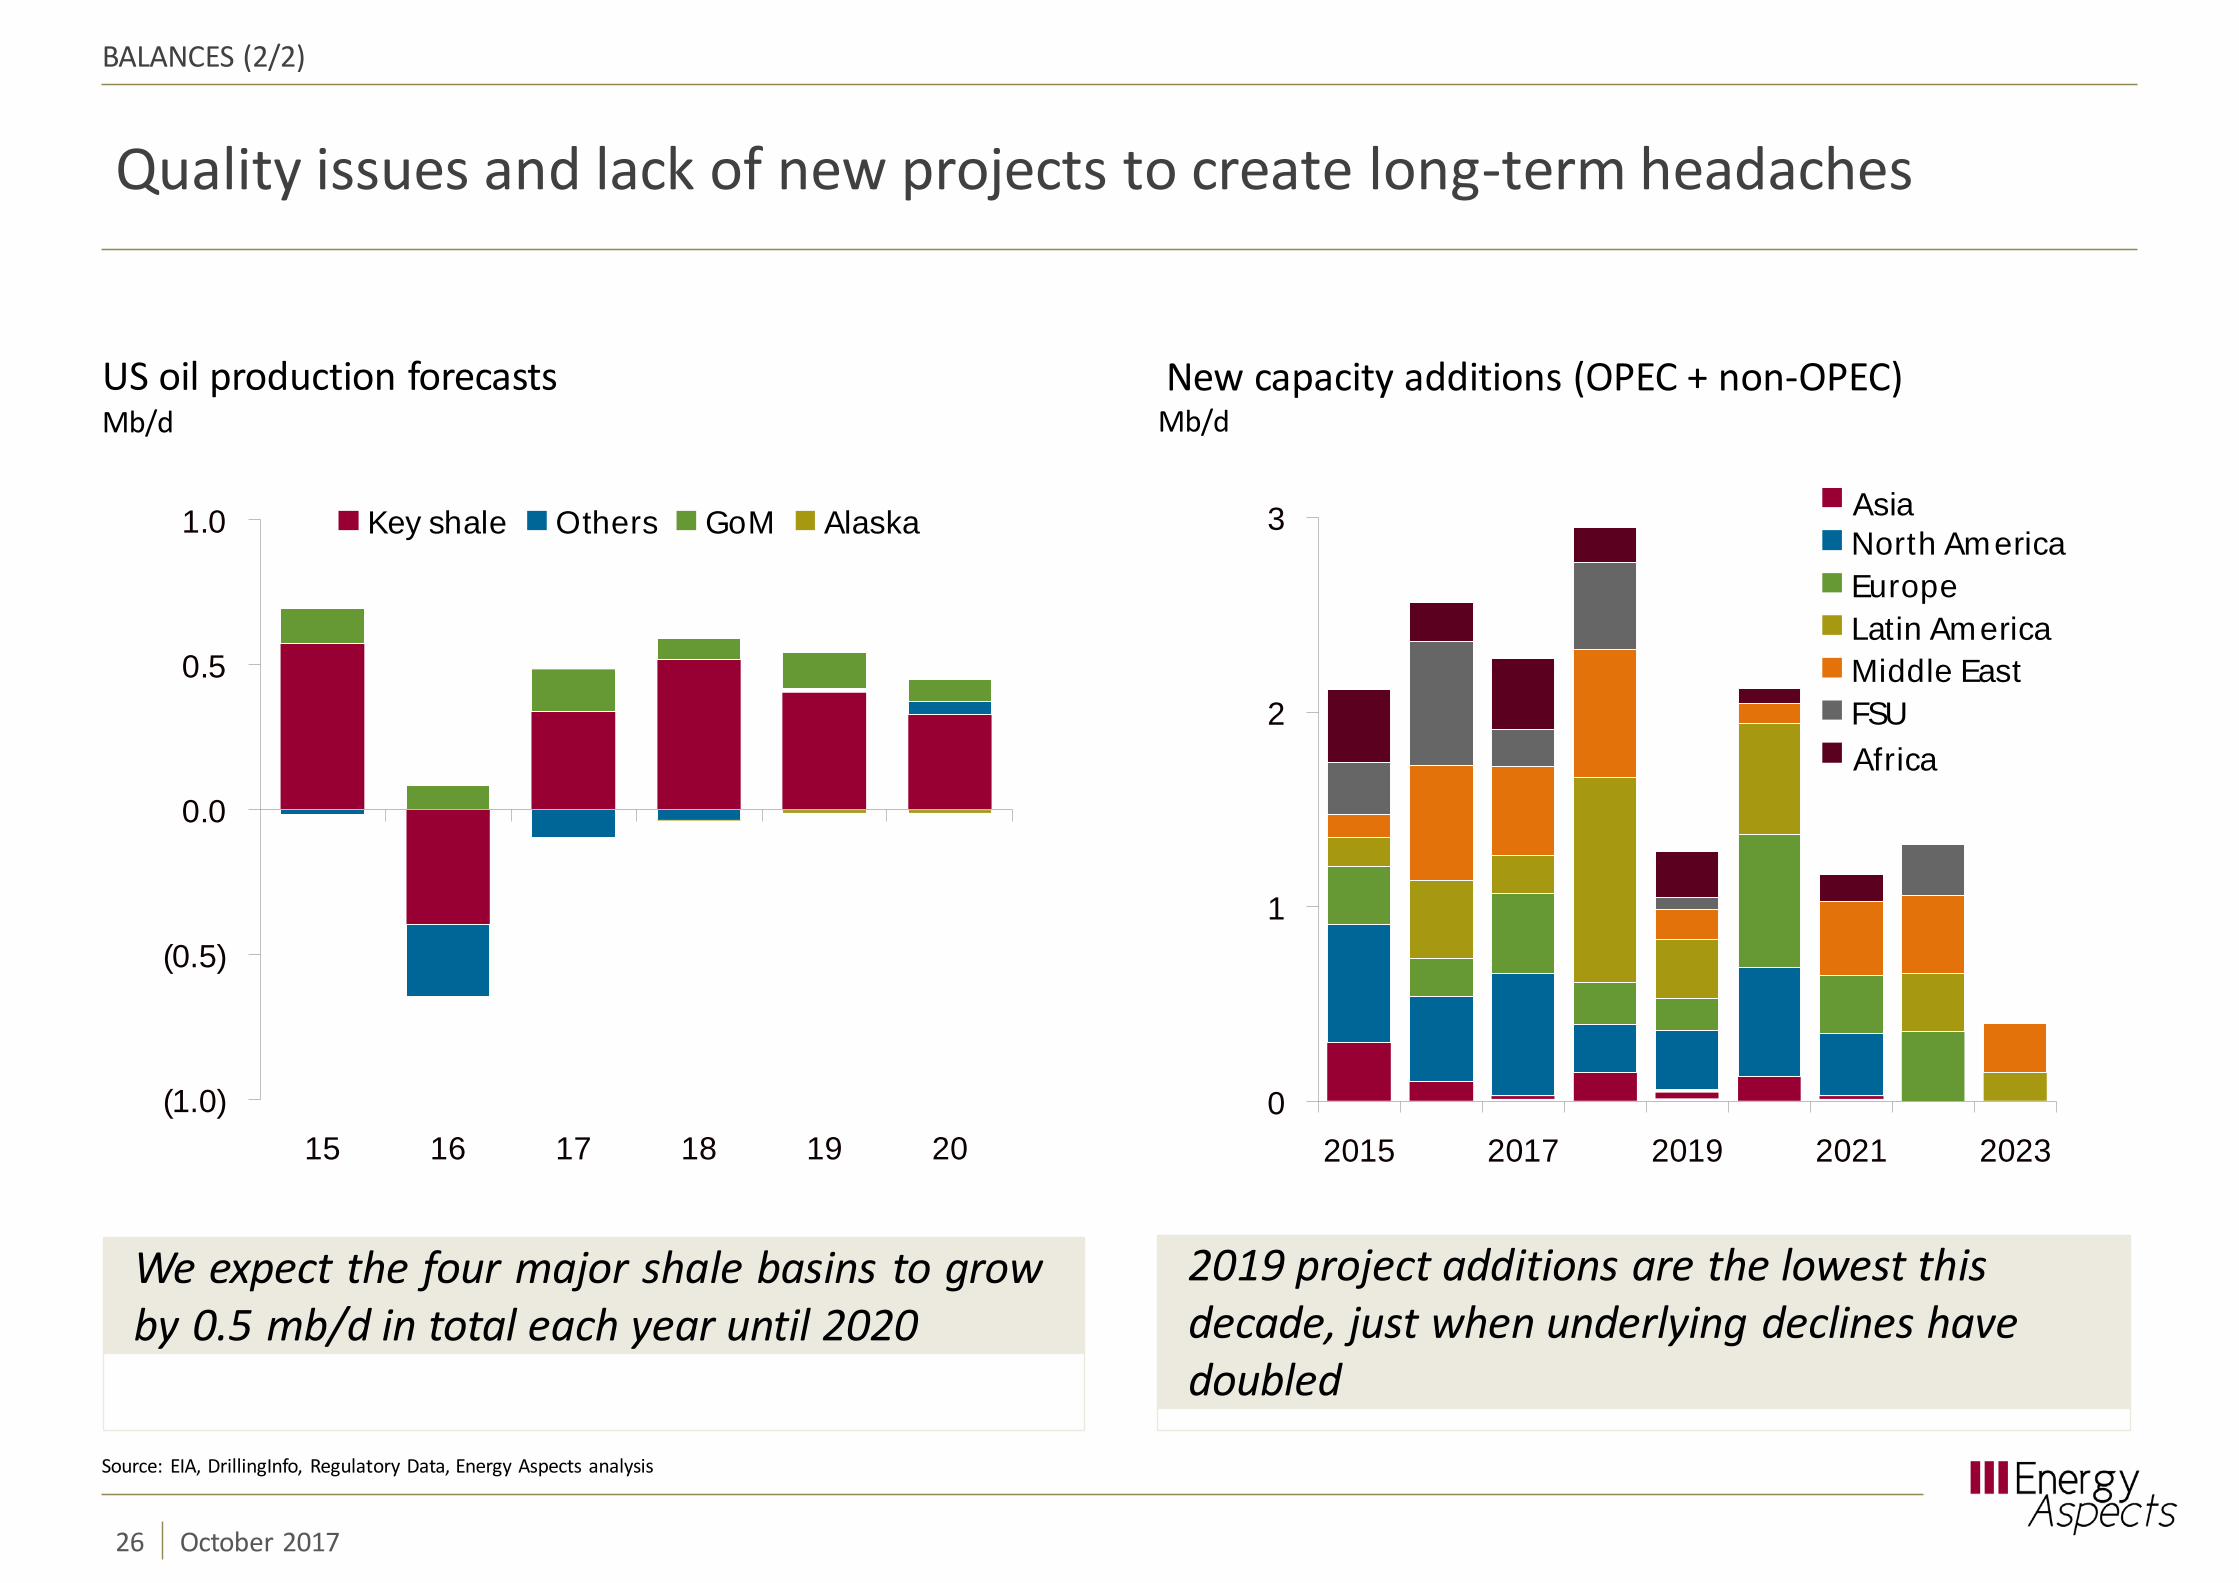
Quality issues and lack of new projects to create long-term headaches
BALANCES (2/2)
US oil production forecastsMb/d
New capacity additions (OPEC + non-OPEC)Mb/d
AsiaNorth America EuropeLatin America Middle EastFSUAfrica
We expect the four major shale basins to growby 0.5 mb/d in total each year until 2020
2019 project additions are the lowest thisdecade, just when underlying declines havedoubled
0
1
2
3
2015 2017 2019 2021 2023(1.0)
(0.5)
0.0
0.5
1.0
15 16 17 18 19 20
Key shale Others GoM Alaska
Source: EIA, DrillingInfo, Regulatory Data, Energy Aspects analysis
26 October 2017

North American crude outlook
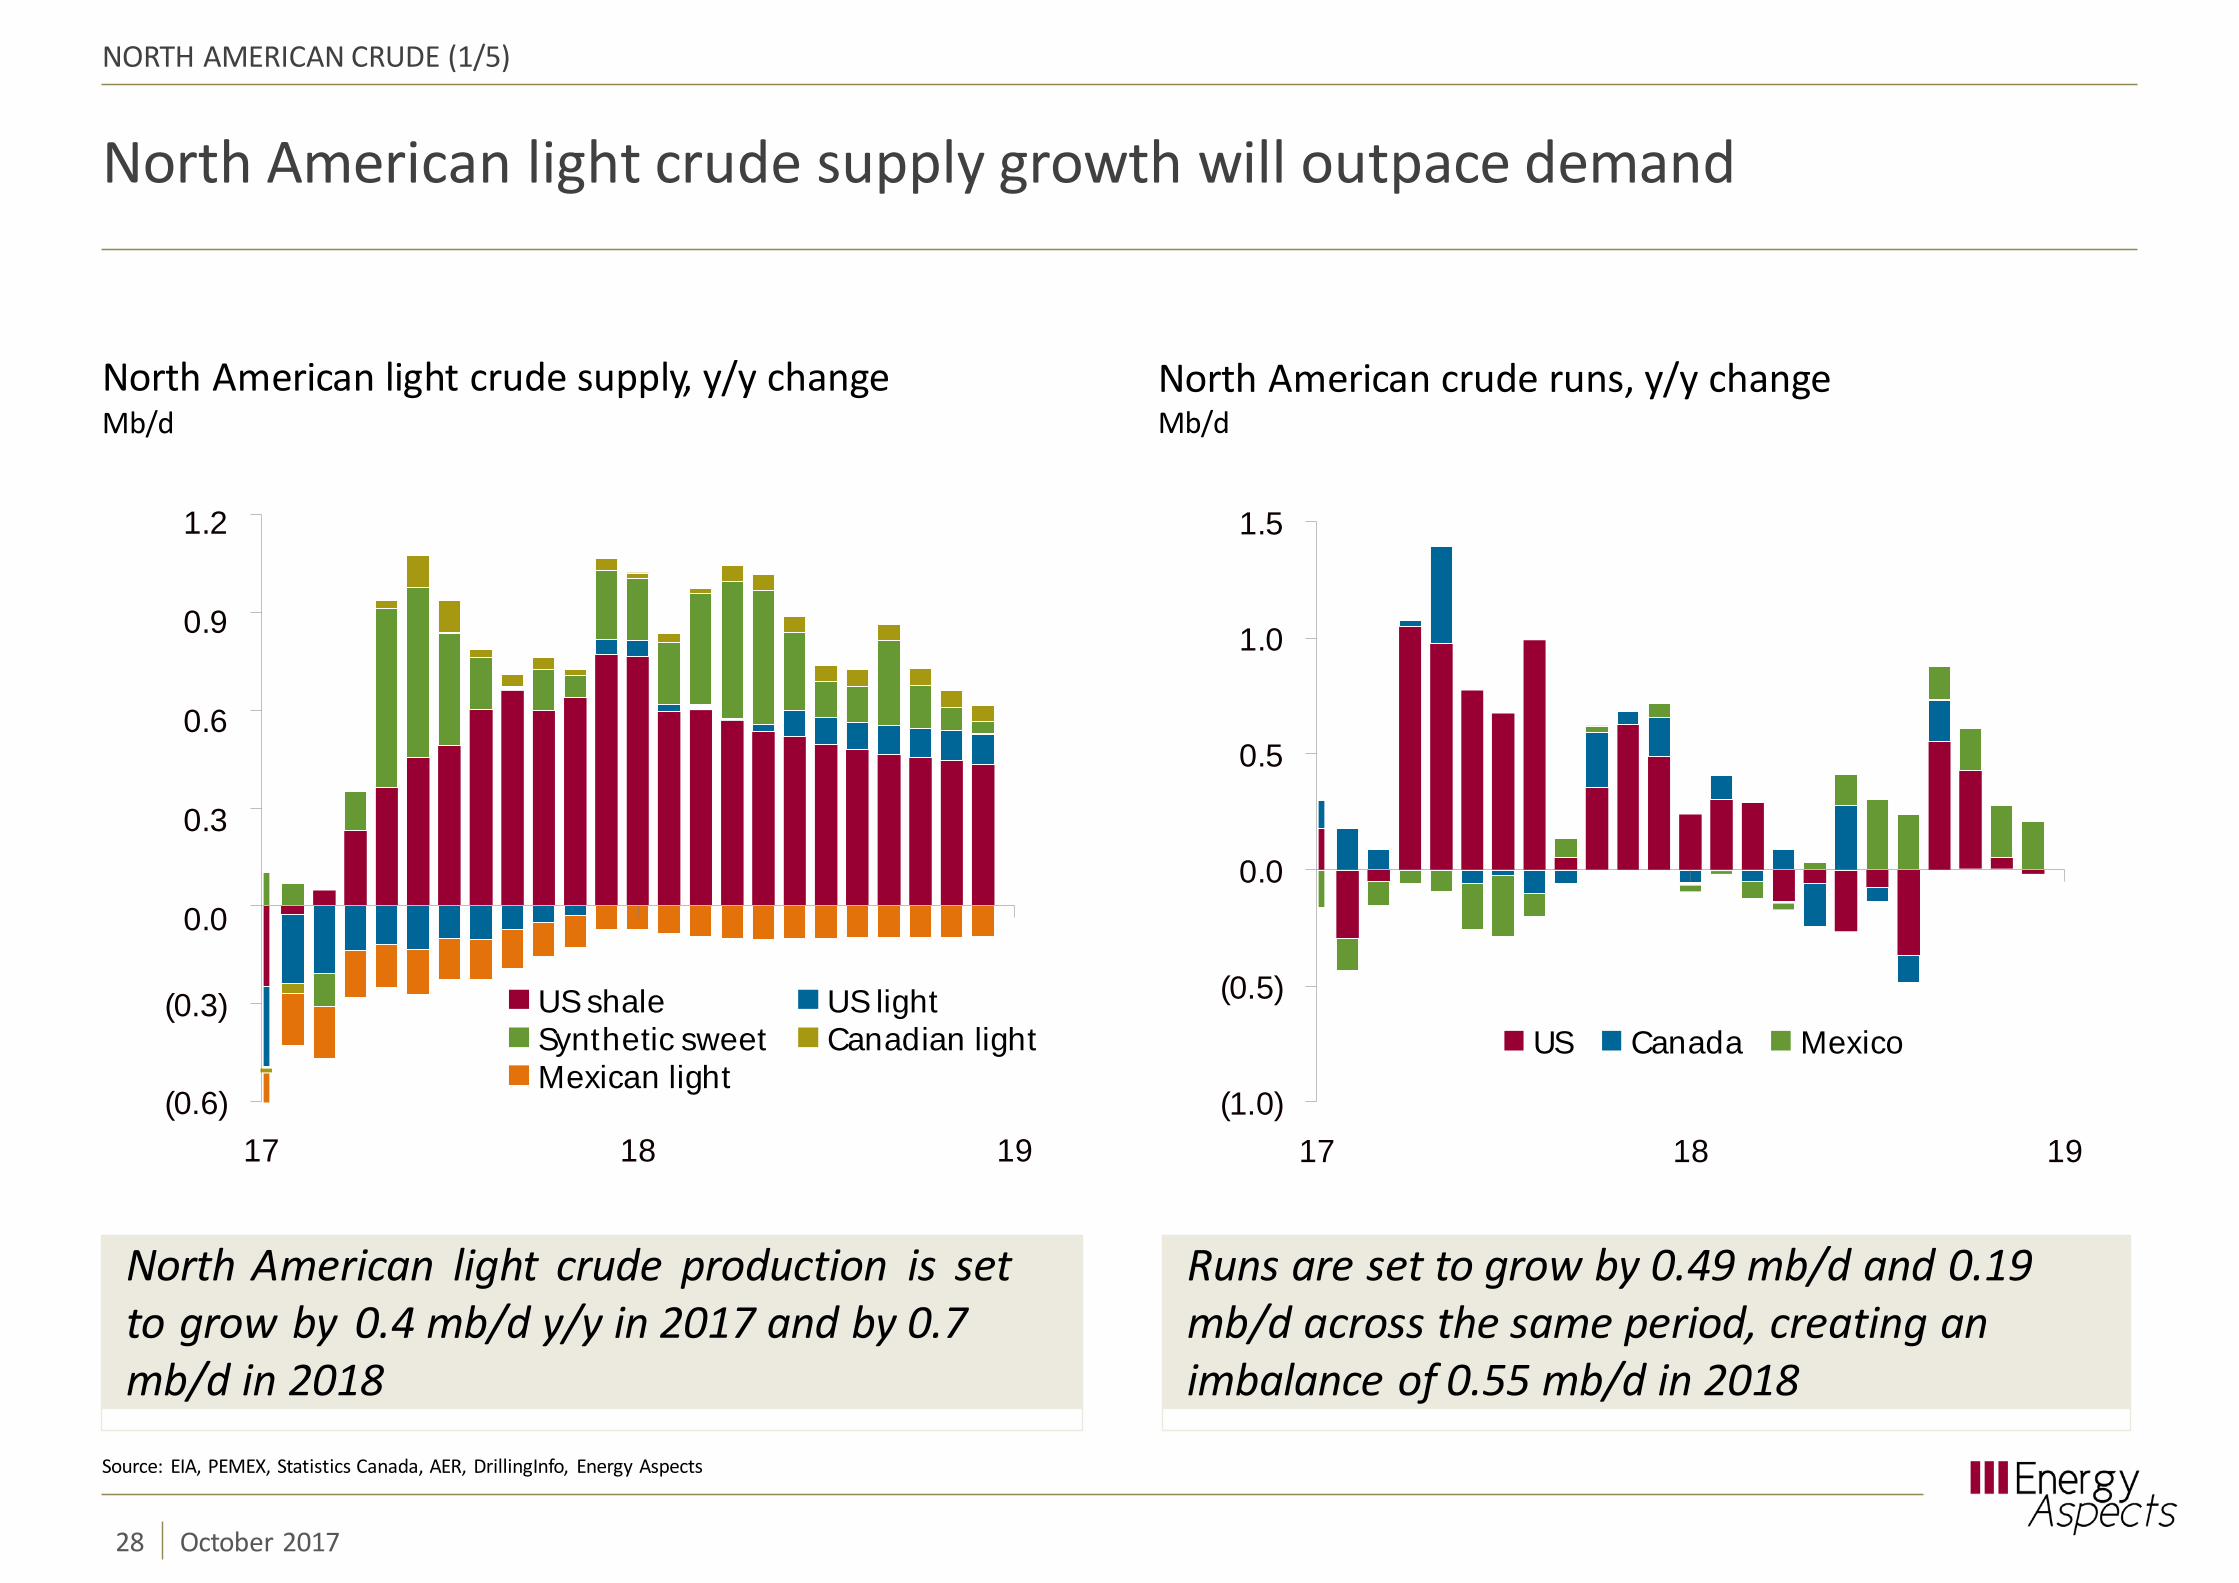
North American light crude supply growth will outpace demand
North American crude runs, y/y changeMb/d
North American light crude supply, y/y changeMb/d
1.2
0.9
0.6
0.3
0.0
NORTH AMERICAN CRUDE (1/5)
North American light crude production is setto grow by 0.4 mb/d y/y in 2017 and by 0.7mb/d in 2018
Runs are set to grow by 0.49 mb/d and 0.19mb/d across the same period, creating animbalance of 0.55 mb/d in 2018
(0.6)
(0.3)
17 18 19
US shale US lightSynthetic sweet Canadian lightMexican light
(1.0)
(0.5)
0.0
0.5
1.0
1.5
17 18 19
US Canada Mexico
Source: EIA, PEMEX, Statistics Canada, AER, DrillingInfo, Energy Aspects
28 October 2017
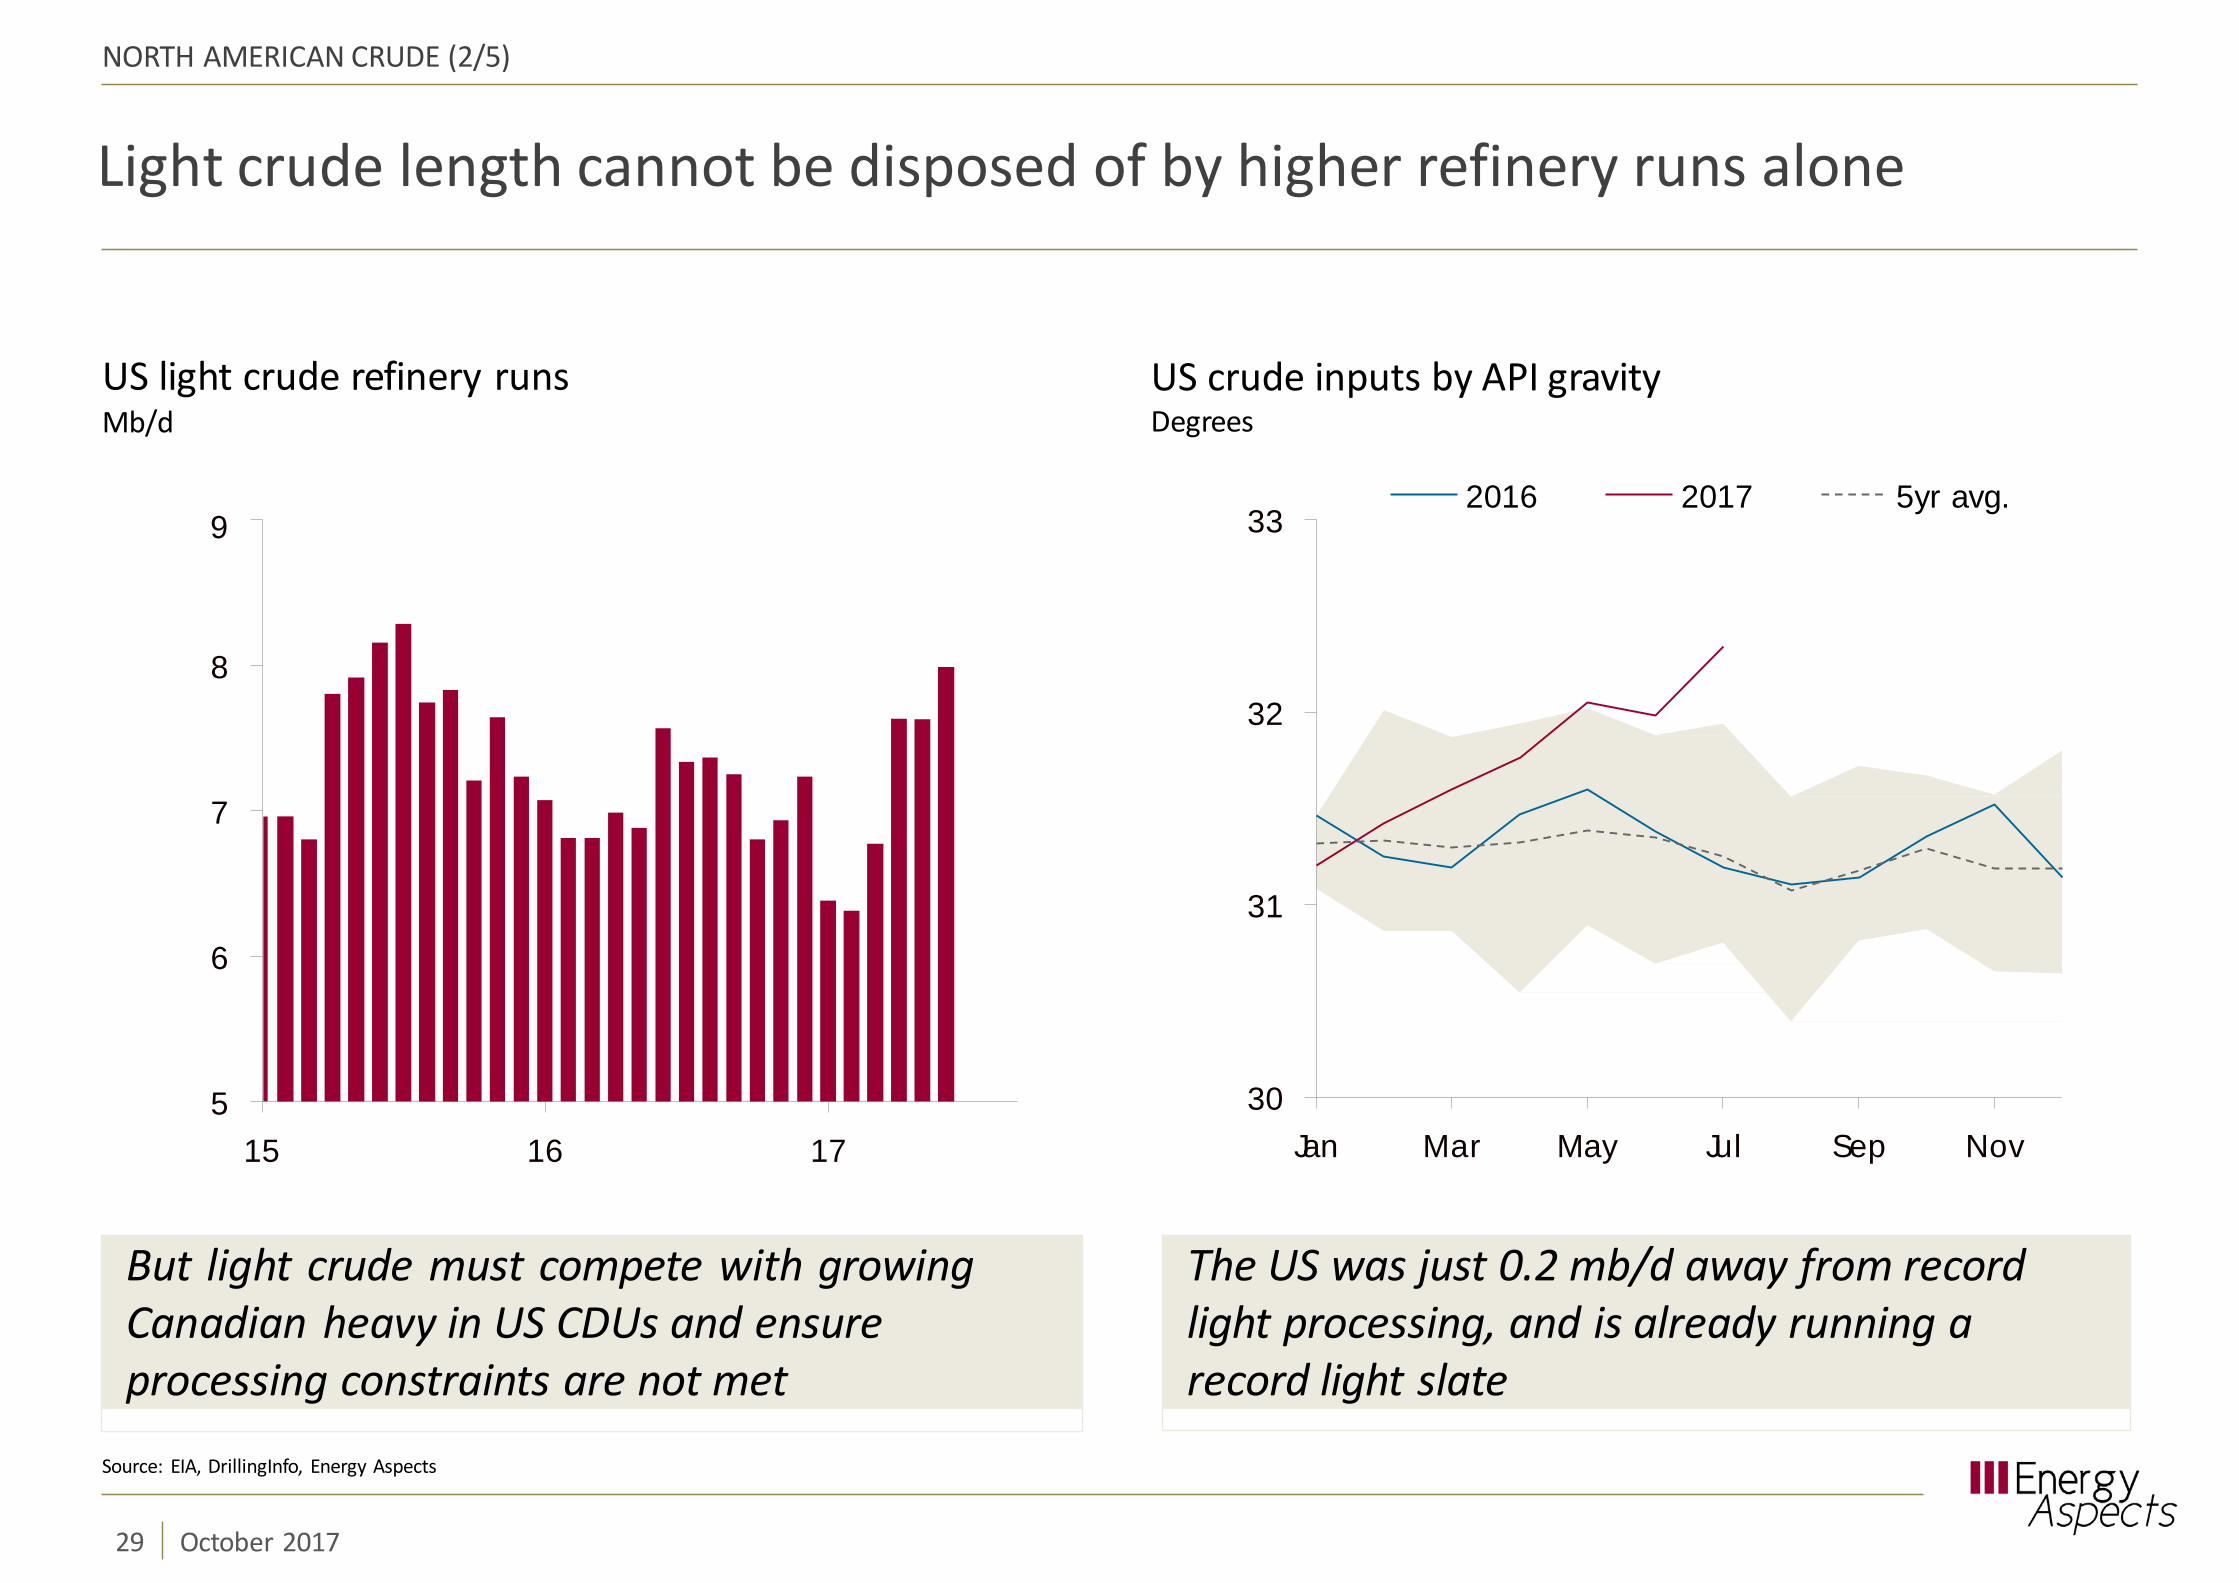
Light crude length cannot be disposed of by higher refinery runs alone
US crude inputs by API gravityDegrees
US light crude refinery runsMb/d
9
NORTH AMERICAN CRUDE (2/5)
But light crude must compete with growingCanadian heavy in US CDUs and ensureprocessing constraints are not met
The US was just 0.2 mb/d away from recordlight processing, and is already running arecord light slate
5
6
7
8
15 16 1730
31
32
33
Jan Mar May Jul Sep Nov
2016 2017 5yr avg.
Source: EIA, DrillingInfo, Energy Aspects
29 October 2017

So excess oil will be exported or stored, with different price implications
US crude oil storage capacity utilisation, %Mb
50%
60%
70%
80%
11 12 13 14 15 16 17
US crude oil export forecastMb/d
1.4
1.2
1.0
0.8
0.6
0.4
0.2
0.0
NORTH AMERICAN CRUDE (3/5)
Bullish: oil is pulled out of the US byinternational demand for crude. Dependent onexport capacity & arbitrage economics
Bearish: closed export arbs force surplus oilinto storage, building inventories. But 250 mbof ullage is large buffer
Jan 17
Source: EIA, Census Bureau, Kpler, Energy Aspects
30 October 2017
Apr 17 Jul 17 Oct 17
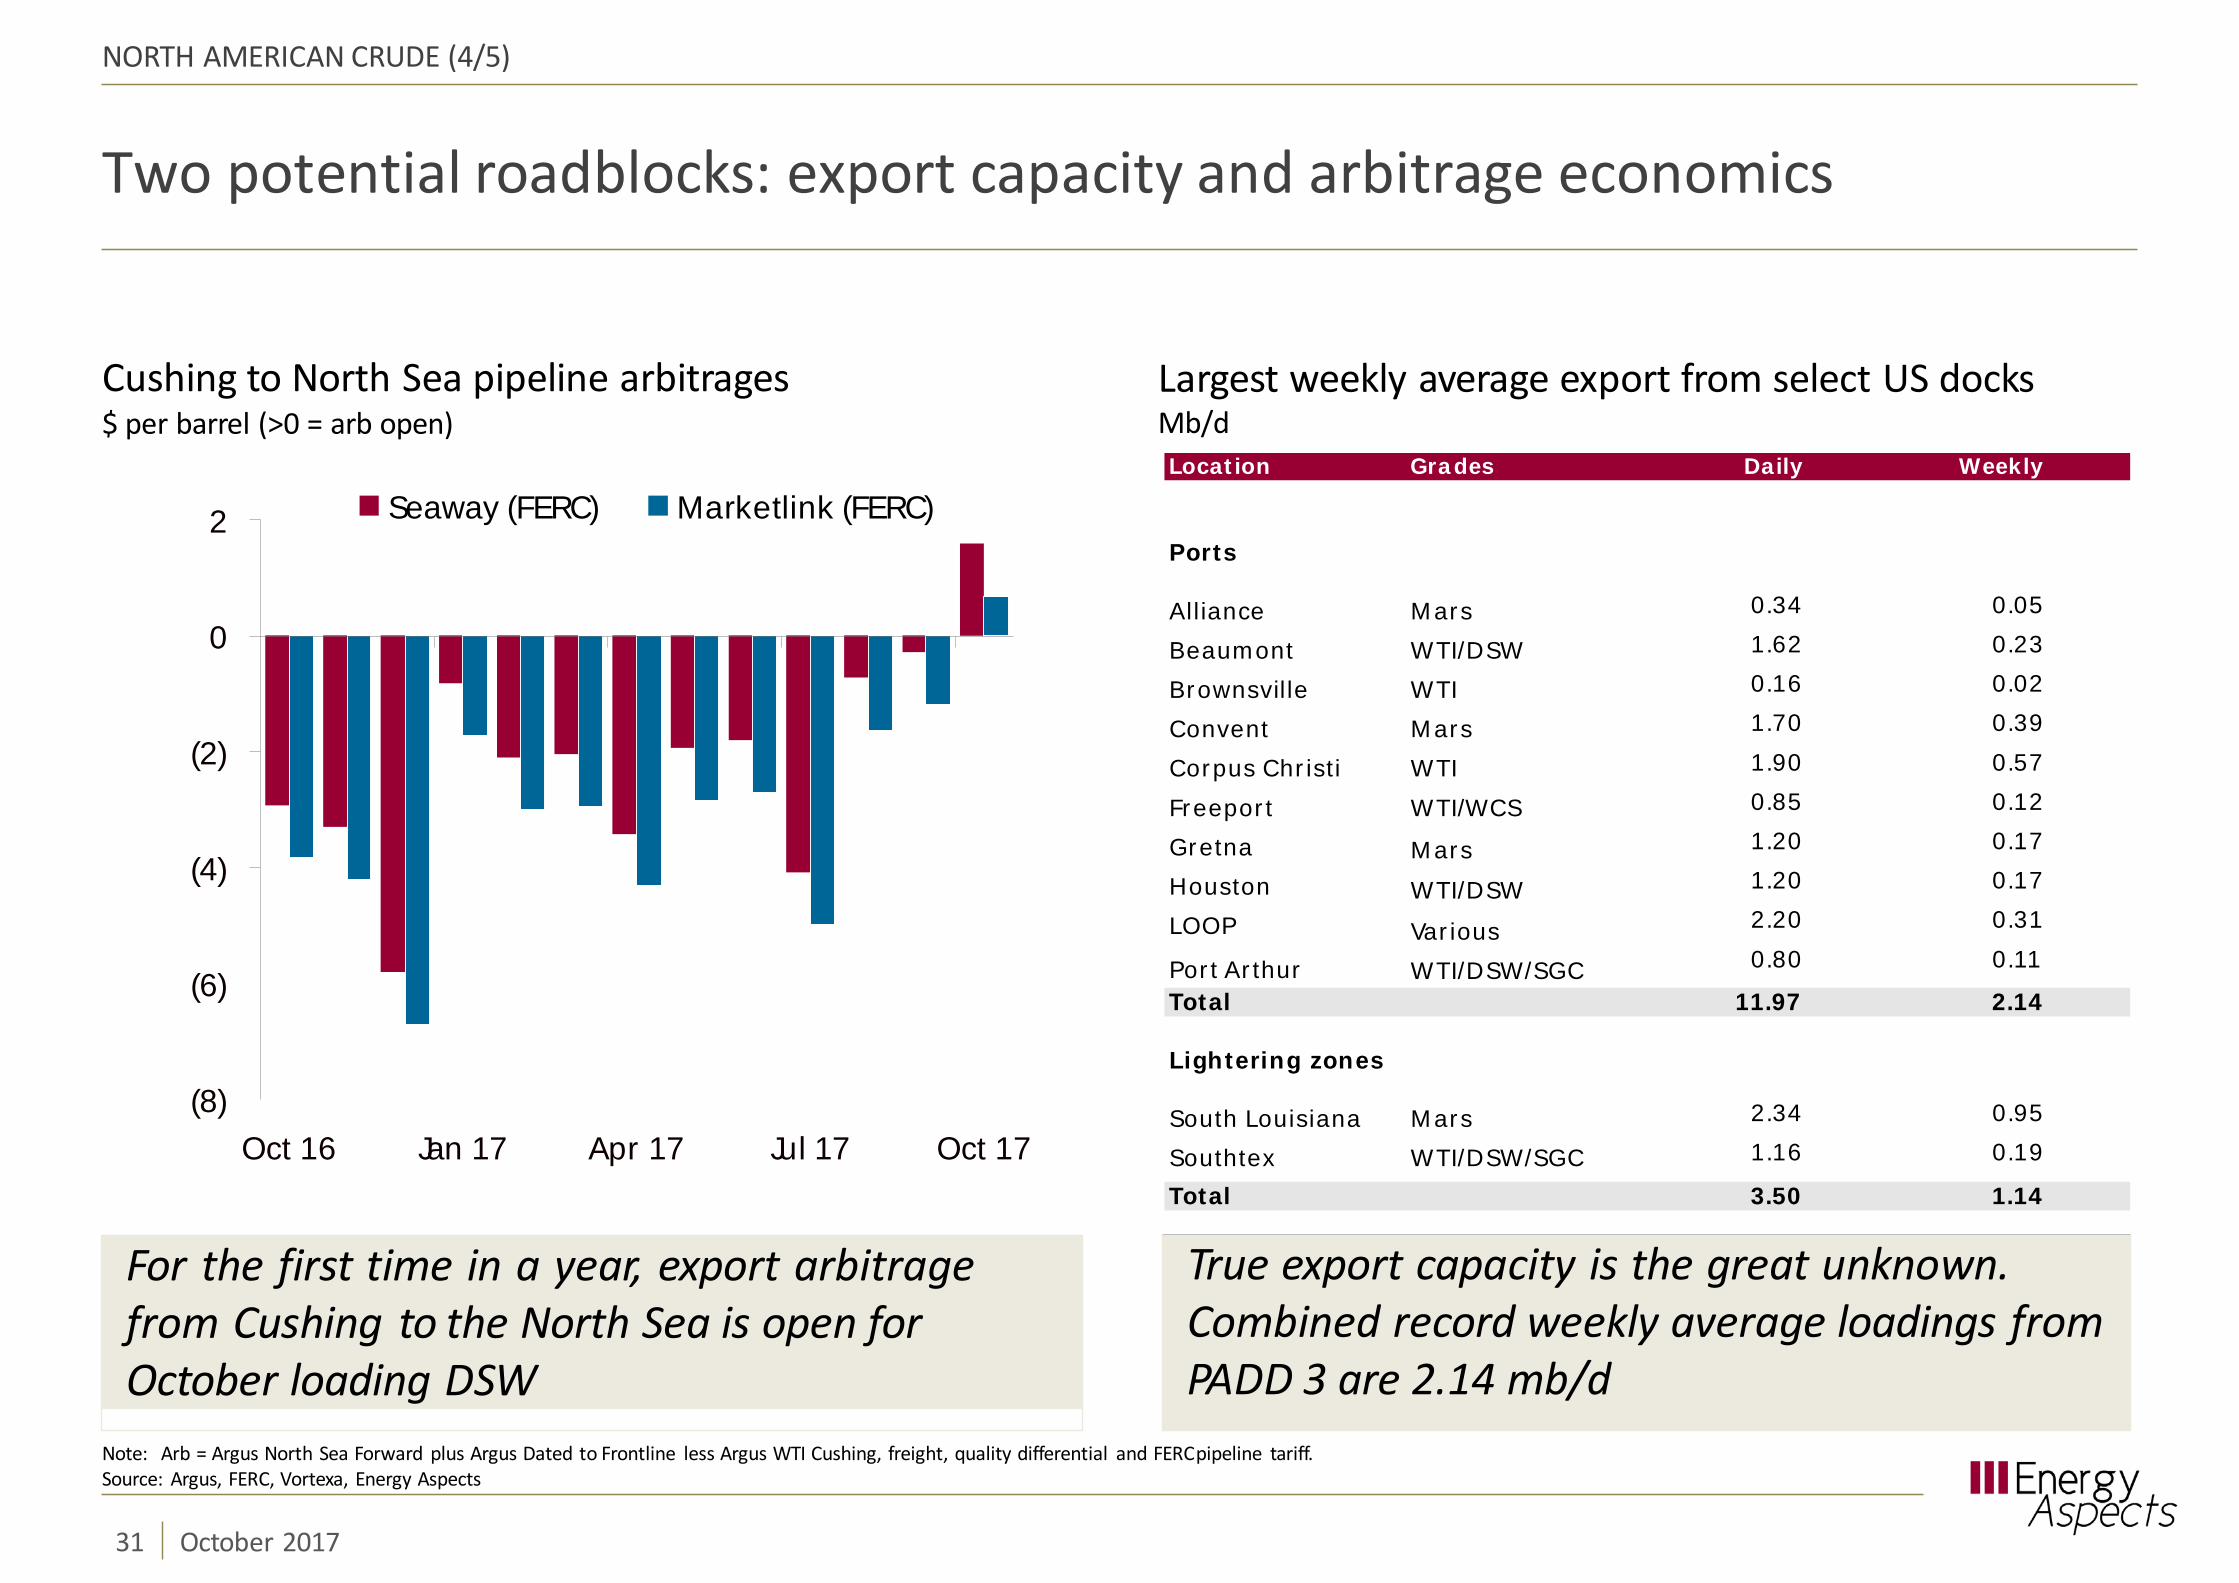
Two potential roadblocks: export capacity and arbitrage economics
Largest weekly average export from select US docksMb/d
Cushing to North Sea pipeline arbitrages$ per barrel (>0 = arb open)
Note: Arb = Argus North Sea Forward plus Argus Dated to Frontline less Argus WTI Cushing, freight, quality differential and FERCpipeline tariff.
NORTH AMERICAN CRUDE (4/5)
For the first time in a year, export arbitragefrom Cushing to the North Sea is open forOctober loading DSW
True export capacity is the great unknown.Combined record weekly average loadings fromPADD 3 are 2.14 mb/d
Location Grades Daily Weekly
Ports
AllianceBeaumont Brownsvil leConvent Corpus Chr istiFreepor t GretnaHoustonLOOP
Por t Ar thur
M arsWTI/DSWWTIM arsWTI WTI/WCS
M arsWTI/DSW
Var iousWTI/DSW/SGC
0.341.620.161.701.900.851.201.202.200.80
0.050.230.020.390.570.120.170.170.310.11
Total 11.97 2.14
Lightering zones
South LouisianaSouthtex
M arsWTI/DSW/SGC
2.341.16
0.950.19
Total 3.50 1.14
(8)
(6)
(4)
(2)
0
2
Oct 16 Jan 17 Apr 17 Jul 17 Oct 17
Seaway (FERC) Marketlink (FERC)
Source: Argus, FERC, Vortexa, Energy Aspects
31 October 2017

A baseload of US exports will head to Asia regardless
NORTH AMERICAN CRUDE (5/5)
0.0
0.2
0.4
0.6
0.8
1.0
Jul 16 Oct 16 Jan 17 Apr 17 Jul 17
US crude export arbs to Asia$ per barrel
2
1
0
(1)
(2)
(3)
US crude exports by destination, y/y changeMb/d
Asia is now a regular taker of US crude, andthis has far- reaching consequences for MiddleEastern producers
Based on arbitrage economics, but alsosome political factors, US now often exports inexcess of 1 mb/d
1.2Asia PacificEurope
CanadaCaribbs
Med LatAm
(6)
(5)
(4)
Jan 17 Apr 17
WTI/MurbanMEH/MurbanMID/MurbanMRS/Dubai
Jul 17
Source: Argus, US Census Bureau, Energy Aspects
32 October 2017
Oct 17
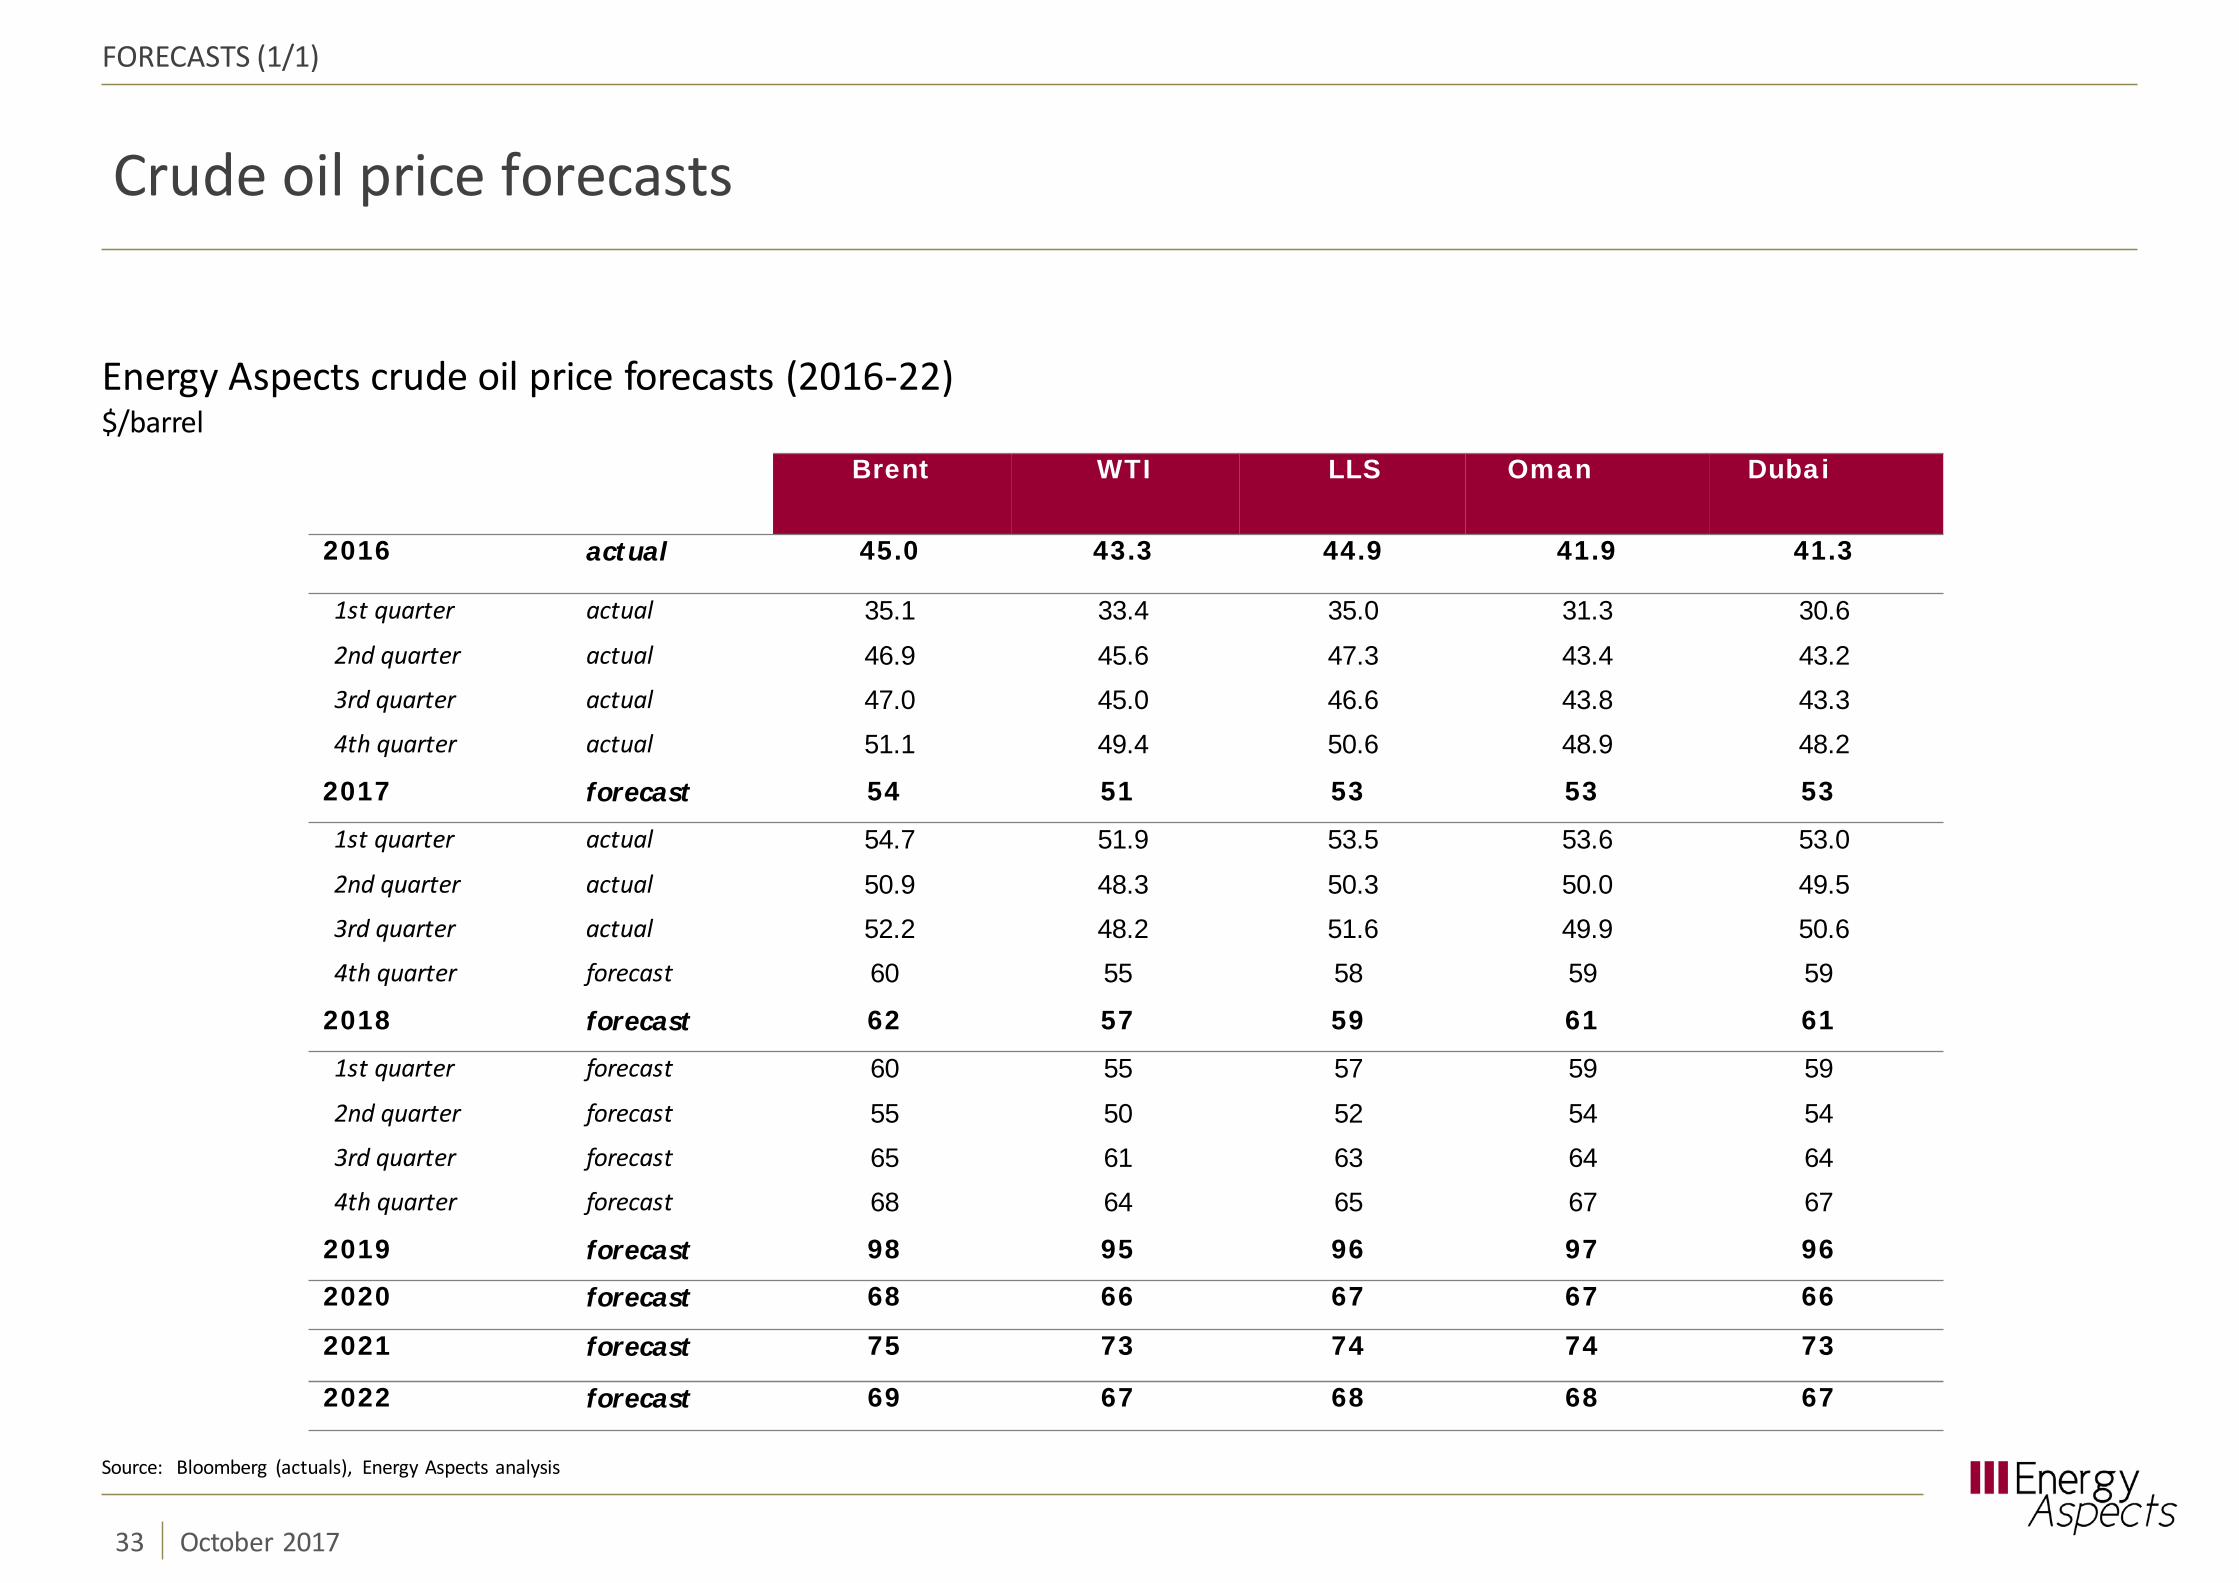
Crude oil price forecasts
33 October 2017
FORECASTS (1/1)
Energy Aspects crude oil price forecasts (2016-22)$/barrel
Source: Bloomberg (actuals), Energy Aspects analysis
Brent WTI LLS Oman Dubai
2016 actual 45.0 43.3 44.9 41.9 41.3
1st quarter actual 35.1 33.4 35.0 31.3 30.62nd quarter actual 46.9 45.6 47.3 43.4 43.23rd quarter actual 47.0 45.0 46.6 43.8 43.34th quarter actual 51.1 49.4 50.6 48.9 48.2
2017 forecast 54 51 53 53 53
1st quarter actual 54.7 51.9 53.5 53.6 53.02nd quarter actual 50.9 48.3 50.3 50.0 49.53rd quarter actual 52.2 48.2 51.6 49.9 50.64th quarter forecast 60 55 58 59 59
2018 forecast 62 57 59 61 61
1st quarter forecast 60 55 57 59 592nd quarter forecast 55 50 52 54 543rd quarter forecast 65 61 63 64 644th quarter forecast 68 64 65 67 67
2019 forecast 98 95 96 97 96
2020 forecast 68 66 67 67 66
2021 forecast 75 73 74 74 73
2022 forecast 69 67 68 68 67
DISCLAIMER
This publication has been prepared by Energy Aspects Ltd (‘Energy Aspects’). It is provided to our clients for information purposes only, andEnergy Aspects makes no express or implied warranties as to the merchantability or fitness for a particular purpose or use with respect to anydata included in this publication
Prices shown are indicative and Energy Aspects is not offering to buy or sell or soliciting offers to buy or sell any financial instrument
Without limiting any of the foregoing and to the extent permitted by law, in no event shall Energy Aspects, nor any of their respective officers,directors, or employees have any liability for (a) any special, punitive, indirect, or consequential damages; or (b) any lost profits, lost revenue,loss of anticipated savings or loss of opportunity or other financial loss, even if notified of the possibility of such damages, arising from any useof this publication or its contents
Other than disclosures relating to Energy Aspects, the information contained in this publication has been obtained from sources that EnergyAspects believes to be reliable, but Energy Aspects does not represent or warrant that it is accurate or complete. Energy Aspects is notresponsible for, and makes no warranties whatsoever as to, the content of any third-party web site accessed via a hyperlink in this publicationand such information is not incorporated by reference
The views in this publication are those of the author(s) and are subject to change, and Energy Aspects has no obligation to update its opinionsor the information in this publication. The analyst recommendations in this publication reflect solely and exclusively those of the author(s), andsuch opinions were prepared independently of any other interests, including those of Energy Aspects and/or its affiliates. This publication doesnot constitute personal investment advice or take into account the individual financial circumstances or objectives of the clients who receive it.The securities discussed herein may not be suitable for all investors. Energy Aspects recommends that investors independently evaluate eachissuer, security or instrument discussed herein and consult any independent advisors they believe necessary. The value of and income from anyinvestment may fluctuate from day to day as a result of changes in relevant economic markets (including changes in market liquidity). Theinformation herein is not intended to predict actual results, which may differ substantially from those reflected. Past performance is notnecessarily indicative of future results
This communication is directed at, and therefore should only be relied upon by, persons who have professional experience in matters relatingto investments
34 October 2017
© Copyright Energy Aspects Ltd (2017). All rights reserved.No part of this publication may be reproduced in any manner without the prior written permission of Energy Aspects


