
Biogas Technology
Presented by: Boualy VONGVISITH
Ministry of Science and Technology,
Renewable Energy and New Material Institute
ODA – UNESCO Project
Promotion of Energy Science Education for Sustainable Development in Laos

Introduction of Biogas Technology
• What is Biogas ?

Composition of Biogas
Gas Percentage (%) Methane (CH4) 55 – 70
Carbon dioxide (CO2) 30 – 45
Hydrogen sulphide (H2S) Hydrogen (H2) Ammonia (NH3)
1 – 2
Carbon monoxide (CO) Trace
Nitrogen (N2) Trace
Oxygen (O2) Trace

How is biogas generated
• In nature the anaerobic digestion process usually takes place at the bottom of stagnated
• Natural gas is also biogas.
• its methane content is very high (over 90%).
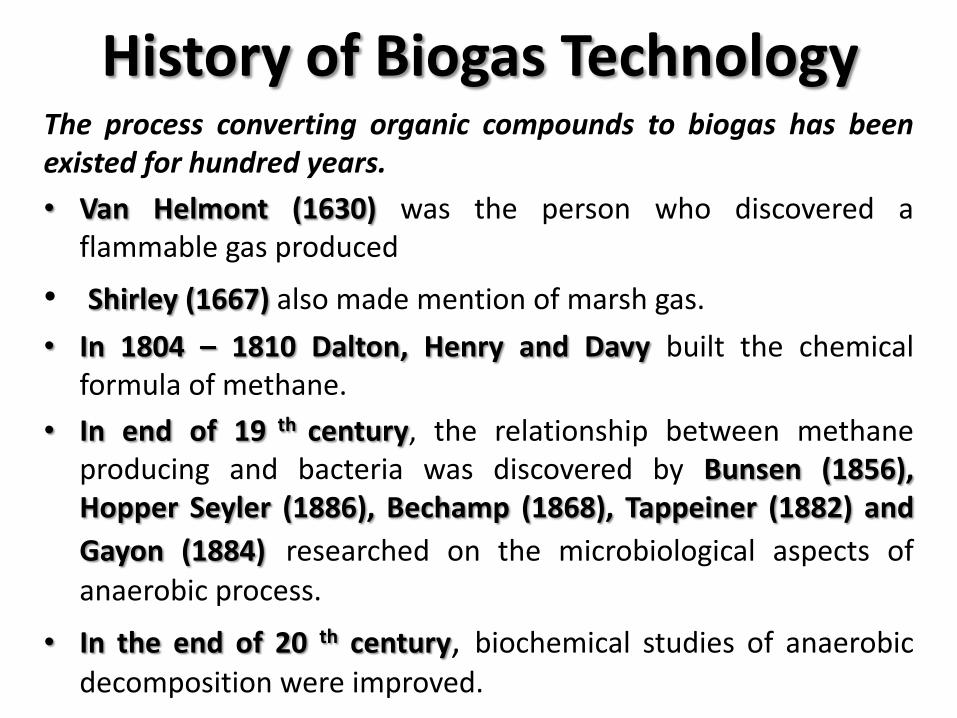
The process converting organic compounds to biogas has been existed for hundred years.
• Van Helmont (1630) was the person who discovered a flammable gas produced
• Shirley (1667) also made mention of marsh gas.
• In 1804 – 1810 Dalton, Henry and Davy built the chemical formula of methane.
• In end of 19 th century, the relationship between methane producing and bacteria was discovered by Bunsen (1856), Hopper Seyler (1886), Bechamp (1868), Tappeiner (1882) and
Gayon (1884) researched on the microbiological aspects of anaerobic process.
• In the end of 20 th century, biochemical studies of anaerobic decomposition were improved.
History of Biogas Technology

Statute of Biogas Technology
• Biogas technology is a proven and established technology in many parts of the world,
•In Asia, Netherlands Development organization (SNV) is working

Biogas Digester types • Different types of Biogas Digester

How is biogas produced • Microbiology : The three steps of Biogas production Biogas microbes consist of a large group of complex and differently acting microbe species, notable the methane-producing bacteria. The whole biogas-process can be divided into three steps: hydrolysis, acidification, and methane formation
Figure 1: The three-stage anaerobic fermentation of biomass: Production and Utilization of Biogas in Rural Areas of Industrialized and
Developing Countries, Schriftenreihe der gtz, No. 97, p. 54; after: Märkl, H.: Mikrobielle Methangewinnung; in: Fortschritte der
Verfahrenstechnik, Vol. 18, p. 509, Düsseldorf, FRG

• Hydrolysis – In the first step (hydrolisis), the organic matter is enzymolyzed externally
– Bacteria decompose the long chains of the complex carbohydrates, proteins and lipids into shorter parts.
• Acidification – Acid-producing bacteria, involved in the second step,
convert the intermediates of fermenting bacteria into acetic acid (CH3COOH), hydrogen (H2) and carbon dioxide (CO2).
– To produce acetic acid, they need oxygen and carbon
– Hereby, the acid-producing bacteria create an anaerobic condition which is essential for the methane producing microorganisms.

Methane Formation:
Methane-producing bacteria, involved in the third step, decompose compounds with a low molecular weight.
Figure 3: Various types of methanogenic
bacteria. Production and Utilization of Biogas
in Rural Areas of Industrialized and Developing
Countries, Schriftenreihe der gtz, No. 97, p. 55
Symbiosis of bacteria: Methane and acid-producing bacteria act in a symbiotical way. On the one hand, acid producing bacteria create an atmosphere with ideal parameters for methane-producing bacteria
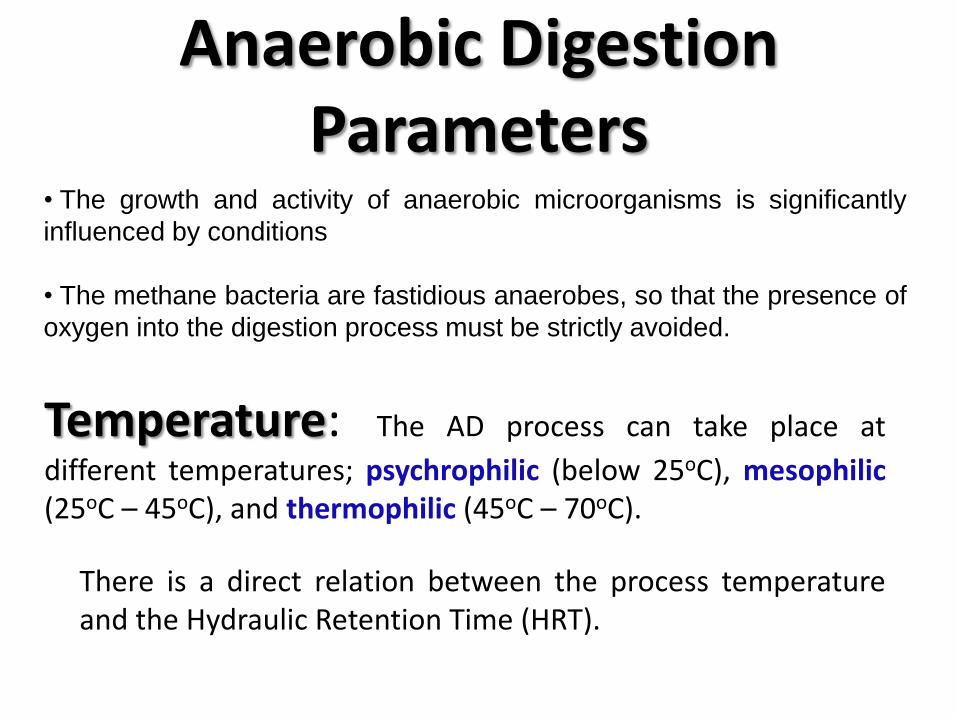
Anaerobic Digestion Parameters
Temperature: The AD process can take place at
different temperatures; psychrophilic (below 25oC), mesophilic (25oC – 45oC), and thermophilic (45oC – 70oC).
There is a direct relation between the process temperature and the Hydraulic Retention Time (HRT).
• The growth and activity of anaerobic microorganisms is significantly
influenced by conditions
• The methane bacteria are fastidious anaerobes, so that the presence of
oxygen into the digestion process must be strictly avoided.

Thermal stage and typical retention times Thermal stage Process temperatures Minimum retention time
psychrophilic < 20 °C 70 to 80 days
mesophilic 30 to 42 °C 30 to 40 days
thermophilic 43 to 55 °C 15 to 20 days
Relative biogas yields, depending on
temperature and retention time (LfU
2007)
Relative growth rates of methanogens
(ANGELIDAKI 2004)

The relation between temperature and the solubility in water of some gases (ANGELIDAKI 2004)
Gas Temperature (°C) Solubility mmol/l water
Changed solubility 50°C-35°C
H2
35 50
0,749 0,725
3,3%
CO2
35 50
26,6 19,6
36%
H2S 35 50
82,2 62,8
31%
CH4
35 50
1,14 0,962
19%
The solubility of various compounds (NH3, H2, CH4 and H2S) also depends on the
temperature . This can be of great significance for materials which have an
inhibiting effect on the process. The viscosity of the AD substrate is inversely
proportional to temperature.

pH value:
• The pH-value is the measure of acidity/alkalinity of a solution.
• Most bacteria live on light alkali and pH value in the range of 6.8 – 7.5.
• However, methane producing bacteria is still grown in pH value in the range of 6.5 – 8.5

Flexibility to use different feedstock
The sustainability cycle of biogas from AD (AL SEADI 2001)

Anaerobic Digestion (AD)
• AD is a biochemical process during which complex organic matter
• stomach of ruminants or the peat bogs.
• the substrate for AD is a homogenous mixture of two or more feedstock types

Substrates for AD
• A wide range of biomass
• The substrates for Anaerobic Digestion (AD)can be classified
• The choice of types and amounts of feedstock for the AD substrate mixture

The characteristics of some digestible feedstock types (AL SEADI 2001)
Type of feedstock Organic content C:N ratio Dry Matter
(DM) %
Volatile Solid
(VS) % of DM
Biogas yield m3 *
Kg-1 VS
Unwanted physical
impurities Other unwanted matters
Pig slurry Carbohydrates,
proteins, lipids 3-10 3-8 70-80 0,25-0,50
Wood shavings, bristles,
water, sand, cords, straw Antibiotics, disinfectants
Cattle Slurry Carbohydrates,
proteins, lipids 6-20 5-12 80 0,20-0,30
Bristles, soil, water,
straw, wood Antibiotics, disinfectants, NH4
+
Poultry slurry Carbohydrates,
proteins, lipids 3-10 10-30 80 0,35-0,60 grit, sand, feathers Antibiotics, disinfectants, NH4
+
Stomach/intestine
content
Carbohydrates,
proteins, lipids 3-5 15 80 0,40-0,68 Animal tissues Antibiotics, disinfectants
Whey 75-80%lactose
20-25%protein - 8-12 90 0,35-0,80 Transportation impurities
Concentrated Whey 75-80%lactose
20-25%protein - 20-25 90 0,80-0,95 Transportation impurities
Flotation sludge 65-70%protein
30-35%lipids - Animal tissues
Heavy metals, disinfectants,
organic pollutants
Ferment. slops Carbohydrates 4-10 1-5 80-95 0,35-0,78 Non-degradable fruit
remains
Straw Carbohydrates,
Lipids 80-100 70-90 80-90 0,15-0,35 Sand, grit
Garden wastes 100-150 60-70 90 0,20-0,50 Soil, cellulosic
components Pesticides
Grass 12-25 20-25 90 0,55 Grit Pesticides
Grass silage 10-25 15-25 90 0,56 Grit
Fruit wastes 35 15-20 75 0,25-0,50
Fish oil 30-35%lipids -
Soya oil/margarine 90% vegetable oil -
Alcohol 40% alcohol -
Food remains 10 80 0,50-0,60 Bones, plastic Disinfectants
Organic household waste Plastic, metal, stones.
Wood, glass
Heavy metals, organic
pollutants
Sewage sludge Heavy metals, organic
pollutants

The metabolic activity of methanogenic bacteria can be optimized at a C/N ratio of approximately 8-20
Substrate C/N
Urine 0.8
Cattle dung 10 – 20
Pig dung 9 – 13
Chicken manure 5 – 8
Sheep/goat dung 30
Human excrement 8
Grain straw 80 – 140
Corn straw 30 – 65
Fresh grass 12
Water hyacinth 20 – 30
Vegetable residue 35
• Carbon/nitrogen (C/N) ratio
C/N ratio of various substrates (Source: Barnett. 1978)
C/N ratio = Carbon (%dry wt) / Nitrogen (%dry wt)
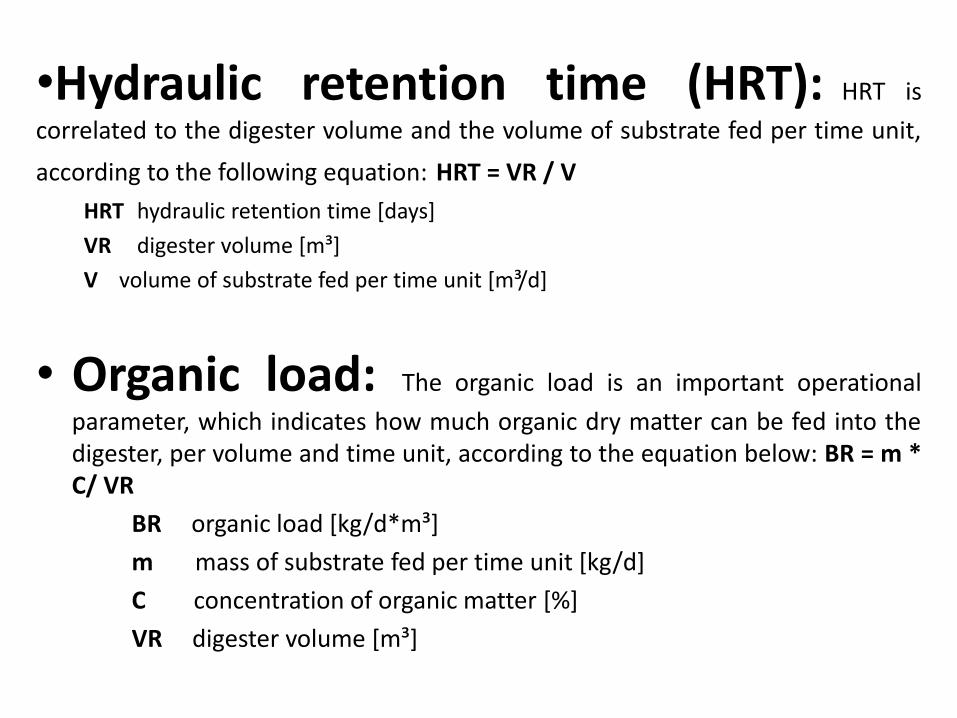
•Hydraulic retention time (HRT): HRT is
correlated to the digester volume and the volume of substrate fed per time unit,
according to the following equation: HRT = VR / V
HRT hydraulic retention time [days]
VR digester volume [m³]
V volume of substrate fed per time unit [m³/d]
• Organic load: The organic load is an important operational
parameter, which indicates how much organic dry matter can be fed into the digester, per volume and time unit, according to the equation below: BR = m * C/ VR
BR organic load [kg/d*m³]
m mass of substrate fed per time unit [kg/d]
C concentration of organic matter [%]
VR digester volume [m³]

Biogas production after addition of substrate – batch test
(LFU 2007)

• Inhibition of the biogas process:
Limiting concentrations for various inhibitors of bio-
methanation.
Substance mg/l
Copper 10 – 250
Calcium 8,000
Sodium 8,000
Magnesium 3,000
Nickel 100 – 1,000
Zinc 350 – 1,000
Chromium 200 – 2,000
Sulfide (as sulfur) 200
Cyanide 2
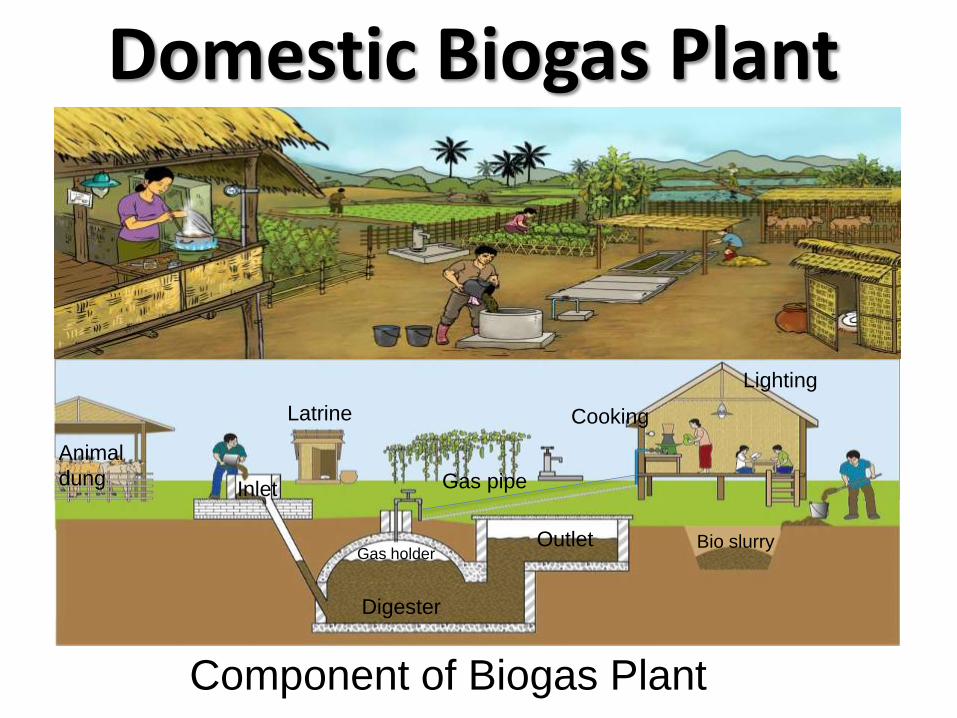
Domestic Biogas Plant
Gas holder
Digester
Outlet
Inlet
Latrine
Bio slurry
Animal
dung
Lighting
Cooking
Gas pipe
Component of Biogas Plant


Biogas Digester Construction Steps
• Surveying the general information on livestock, Initially Environment Assessment and selection of Biodigester construction site
• Selection of appropriate Biodigester size based upon dung availability

• Biogas Plant Drawing
ºÈ¾¤-ª̂ມ
ບ ໍ່ ºÈ¾¤-ìí
ຂມຸເກບັກາກມນູສດັ
ຂມຸເກບັກາກມນູສດັ
• The Selection of the quality standards construction materials

• The Digging Pit of Biodigester
• Firming-up of foundation base and Construction of around wall
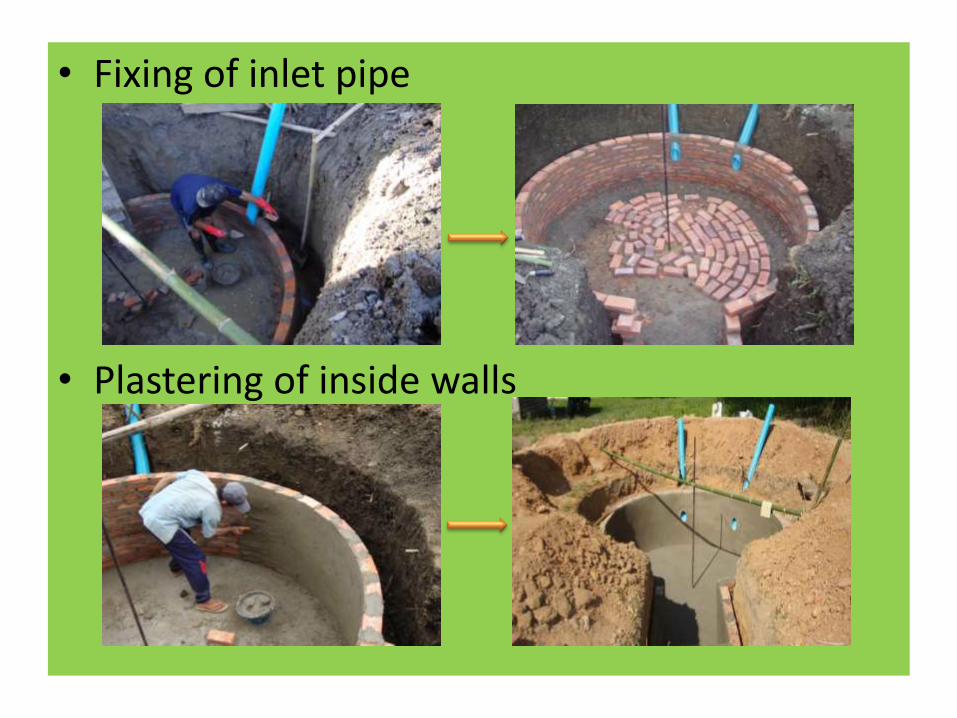
• Fixing of inlet pipe
• Plastering of inside walls
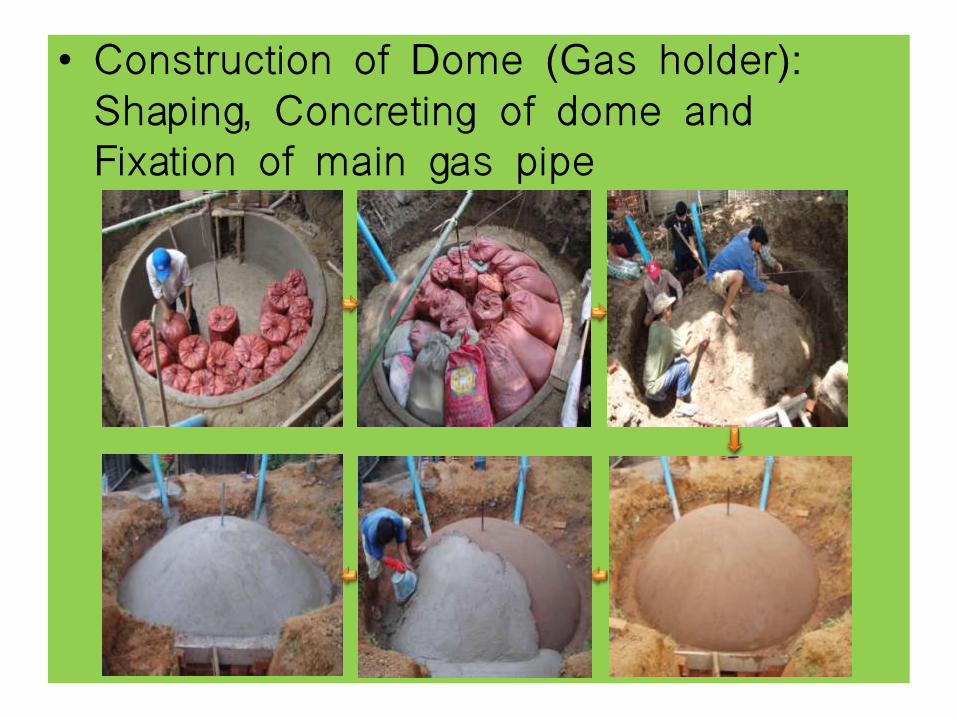
• Construction of Dome (Gas holder): Shaping, Concreting of dome and Fixation of main gas pipe
ກ ານດົທ ໍ່ ສ ົໍ່ງແກສ ໌

• Taking out of soil-mould
• Plastering of Dome

• Construction of Outlet
• Construction of Inlet

Casting of outlet cover (slab)
No Symbol Outlet cover sizes
4 m3 6 m3 8 m3 10 m3
1 a 165 184 196 216
2 b 145 155 165 185
3 c 55 46 49 54
Number of outlet
cover
3 4 4 4

• Construction of Dome gas pipe
• Pipe laying and installation of Appliances
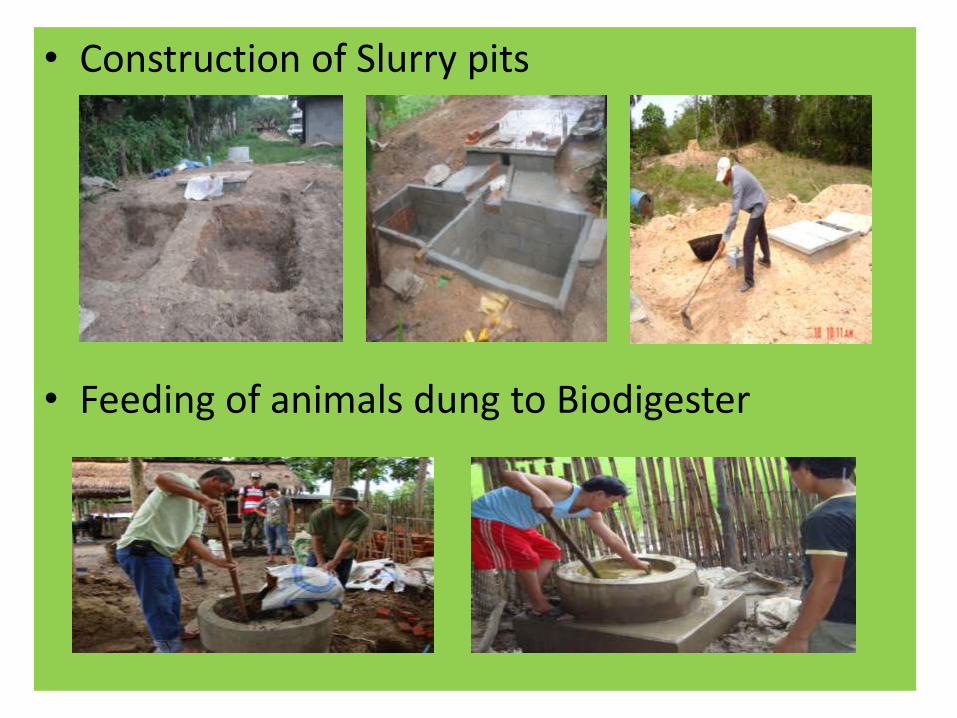
• Construction of Slurry pits
• Feeding of animals dung to Biodigester

Daily Dung Feeding
Bio-
digester
size
Initial Dung
Feeding
(Cattle
dung, Pig
manure )
(kg)
Daily dung
feeding
(kg)
Water to
mix with
dung (litre)
Use of
Biogas
Stove
(hour)
Use of
Biogas
Lamp
(hour)
4 1800 20-40 20-40 3.5 to 4 8-10
6 2600 40-60 40-60 5.5 to 6 12-15
8 3300 60-80 60-80 7.5 to 8 16-20
10 4100 80-100 80-100 9.5 to 10 21-25

Rate of Gas Production of animal dung
in litre
• 1 kg of Cow dung produces of gas 40 litres
• 1 kg Buffalo dung produces of gas 40 litres
• 1 kg Pig dung produces of gas 50 litres
• 1 kg Chicken dung produces of gas 60 litres
• 1kg Human excrement produces of gas 50 litres
Dung Production per number of animal and
human per day in Kg
• 1 cow produces 10-14 kg of fresh excrement per day
• 1 buffalo produces 15-20 kg of fresh excrement per day
• 1 pig produces 2 - 4 kg of fresh excrement per day
• 1 chicken produces 0.05 to 0.07 kg of fresh excrement per day
• 1 human produces 0.18-0.34 kg of fresh excrement per day

Biogas Applications
Cooking:
Single burner stove consumes of biogas from
350 to 400 litres per hour
10 kg of cow produces of gas for cooking in
1 hour
Lighting:
Lamp consumes of biogas from 150 to 175 litres
per hour
1 litre (cum) of biogas capable use for 5.7 hours

One cubic biogas will be equivalent to :
• 4-5 kg of firewood
• 0.6 to 0.7 litres of kerosene
• 1.6 kg of charcoal
• 0.45 kg of LPG
• Single burner stove for 2.5 hours
• Lamp for lighting for 5-6 hours
• 1.6 to 1.7 kWh of electricity
• 1 hp of running engine for 2 hours
Running engine is not preferred in household biodigester.
Biogas Applications
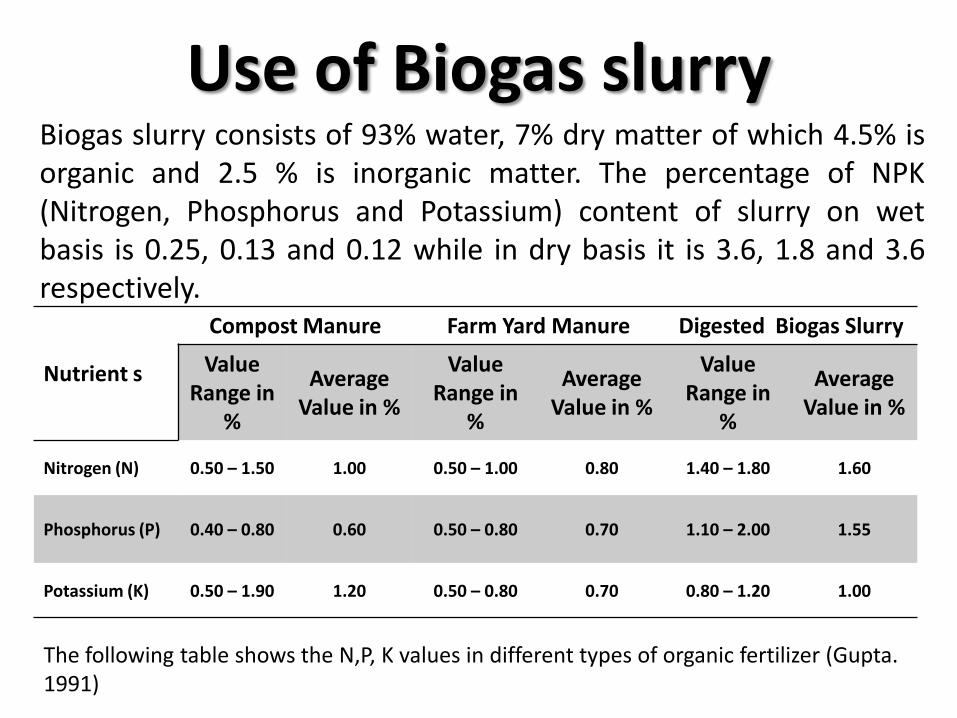
Use of Biogas slurry Biogas slurry consists of 93% water, 7% dry matter of which 4.5% is organic and 2.5 % is inorganic matter. The percentage of NPK (Nitrogen, Phosphorus and Potassium) content of slurry on wet basis is 0.25, 0.13 and 0.12 while in dry basis it is 3.6, 1.8 and 3.6 respectively.
Nutrient s
Compost Manure Farm Yard Manure Digested Biogas Slurry
Value Range in
%
Average Value in %
Value Range in
%
Average Value in %
Value Range in
%
Average Value in %
Nitrogen (N) 0.50 – 1.50 1.00 0.50 – 1.00 0.80 1.40 – 1.80 1.60
Phosphorus (P) 0.40 – 0.80 0.60 0.50 – 0.80 0.70 1.10 – 2.00 1.55
Potassium (K) 0.50 – 1.90 1.20 0.50 – 0.80 0.70 0.80 – 1.20 1.00
The following table shows the N,P, K values in different types of organic fertilizer (Gupta. 1991)

Benefits of Bio-digester Technology
• Economic Benefits: Saving expenditures on fuel, saved time to
utilize in other income generation activities.....etc
• Health Benefits: Reduction in smoke born disease (dizziness,
headache, eye-burning respiratory tract infection, nausea, etc). Improved household sanitation....etc
• Environmental Benefits: Preservation of forest, reduction of
green house gas emission especially the methane, reduced pollution from pig dung being dumped in surface water.....etc
• Social Benefits: Extra time for social activities, Enhanced
prestige in the community, workload reduction especially for women and children...etc

Annex1: Design Biogas Plant and Simple Calculating

References 1. Anna Busch Nielsen. 2009. Biogas Green Energy. Retrieved
from: http://lemvigbiogas.com/ on August 9, 2012.
2. Biogas Pilot Program. SNV Lao PDR. 2006. Trainee’s Manual for Training of Trainers for Construction and Supervision of Biogas Plant.
3. Ludwig Sasse. 1988. Biogas Plant. A Publication of the Deutsches Zentrum für Entwicklungstechnologien - GATE in: Deutsche Gesellschaft für Technische Zusammenarbeit (GTZ). pp. 17
4. Nguyen Luang Khai, et al. 2003. Biogas Technology (Training manual for technician)
5. Teodorita Al Seadi et al.2008. Biogas Handbook . Published by University of Southern Denmark Esbjerg, Niels Bohrs Vej 9-10, K-6700 Esbjerg, Denmark http://www.sdu.dk


