Download - New Hampshire HVAC Load and Savings Research

Final Draft
New Hampshire HVAC Load
and Savings Research March 29, 2013
Prepared for:
New Hampshire Public Utilities Commission and the
New Hampshire Monitoring and Evaluation Team
NHPUC

This page left blank.
Prepared by:
David Korn
Arlis Reynolds
John Walczyk
David Korn
Vice President, Engineering, Energy Services Division
Cadmus

This page left blank.
NH Monitoring and Evaluation Team, NH HVAC Research i
Table of Contents Executive Summary ...................................................................................................................................... iv
Introduction and Background ....................................................................................................................... 1
Task 1. Characterize Electric Load ................................................................................................................. 3
Objective................................................................................................................................................. 3
Method ................................................................................................................................................... 3
System Load ..................................................................................................................................... 3
Sector Load .................................................................................................................................... 10
Residential Cooling Equipment ...................................................................................................... 12
Commercial and Industrial Cooling Equipment ............................................................................. 20
Results .................................................................................................................................................. 22
Residential...................................................................................................................................... 22
Commercial and Industrial ............................................................................................................. 24
Task 2. RecommendED Program Enhancements ........................................................................................ 25
Objective............................................................................................................................................... 25
Method ................................................................................................................................................. 25
Efficiency Potential in New Hampshire .......................................................................................... 25
Results .................................................................................................................................................. 26
Residential...................................................................................................................................... 26
Commercial and Industrial ............................................................................................................. 38
Task 3. Ancillary Electric Savings ................................................................................................................. 48
Objective............................................................................................................................................... 48
Method ................................................................................................................................................. 48
Identify Electric Impacts................................................................................................................. 48
Quantify Ancillary Electric Impacts ................................................................................................ 52
Results .................................................................................................................................................. 58
Appendix A – Savings Inputs and Assumptions .......................................................................................... 60
Appendix B – Hourly Model Estimation ...................................................................................................... 62

NH Monitoring and Evaluation Team, NH HVAC Research ii
List of Tables Table 1. Historical Peak Hours for ISO New England and New Hampshire Load Zone ................................. 5
Table 2. Air Conditioning Equipment for Small Commercial ...................................................................... 21
Table 3. Saturation of Programmable Thermostats for Small Commercial Buildings ................................ 22
Table 4. Saturation of HVAC Controls for Large Commercial Buildings ...................................................... 22
Table 5. Energy Savings Potential by Sector ............................................................................................... 26
Table 6. New Hampshire Residential Efficiency Programs, Electric ............................................................ 28
Table 8. Efficiency Standards for Dehumidifiers, Energy Factor (liters/kWh) ............................................ 36
Table 9. New Hampshire C&I Energy Efficiency Programs ......................................................................... 41
Table 10. Example Cost‐Effectiveness of Computer Room Air Conditioner Variable Speed Drives ........... 43
Table 11. Saturation and Remaining Opportunity for C&I Refrigeration Efficiency ................................... 44
Table 12. Program Offerings for Computer Power Management .............................................................. 46
Table 13. Direct and Ancillary Energy Impacts for Home Heating, Cooling, and DHW Load Reduction .... 49
Table 14. Summary of Potential Summer and Winter Electric Impact by Measure Type .......................... 50
Table 15. Parameters for Furnace Fan Savings due to Weatherization ...................................................... 53
Table 16. Parameters for Boiler Pump Savings due to Weatherization ..................................................... 54
Table 17. Parameters for CAC Savings due to Weatherization ................................................................... 55
Table 18. Parameters for RAC Savings due to Weatherization ................................................................... 56
Table 7. Calculated Savings for Early Replacement of Residential Central Air Conditioners ..................... 58
Table 19. Electric Impacts from Weatherization ........................................................................................ 59
Table 20. Electric Impacts from HVAC and DHW Equipment ..................................................................... 59
NH Monitoring and Evaluation Team, NH HVAC Research iii
List of Figures Figure 1. Historical Seasonal Peaks for ISO New England and New Hampshire Load Zone ......................... 4
Figure 2. Historical Consumption and Peak Loads for New Hampshire Load Zone ...................................... 6
Figure 3. Summer Load Profile for New Hampshire Load Zone, 2012 .......................................................... 7
Figure 4. Winter Load Profile for New Hampshire Load Zone, 2012 ............................................................ 7
Figure 5. Load Weather Response for New Hampshire Load Zone, 2012 .................................................... 8
Figure 6. Weather‐Normalized Cooling Consumption for New Hampshire Load Zone ................................ 9
Figure 7. Cooling Consumption by Utility for Summer Periods, 2012 ........................................................ 10
Figure 8. Estimated NH Total and Cooling Load Profiles for Average Summer Weekday by Sector .......... 11
Figure 9. Estimated NH Total and Cooling Load Profile for Peak Day by Sector ......................................... 12
Figure 10. Cooling Equipment in Residential Sector (PSNH and NHEC) ...................................................... 14
Figure 11. Percentage of Homes with No Cooling Equipment ................................................................... 15
Figure 12. Cooling Equipment Distribution in Residential Sector, 2010 ..................................................... 16
Figure 13. Residential Cooling Equipment by Type of Home, 2010 ............................................................ 16
Figure 14. Residential Cooling Equipment by Age of Home, 2010 ............................................................. 17
Figure 15. Residential Cooling Equipment by Size of Home, 2010 ............................................................. 17
Figure 16. Residential Cooling Equipment by Income, 2010 ...................................................................... 18
Figure 17. Number of Room Air Conditioning Units by Homes Size, 2010 ................................................. 19
Figure 18. Number of RAC Units by Year, NHEC ......................................................................................... 19
Figure 19. Space Cooling for Small C&I Buildings (based on 200 phone surveys) ...................................... 20
Figure 20. Cooling Equipment in Commercial and Industrial Sector, PSNH ............................................... 21
Figure 21. Residential Cooling Consumption by Utility for Summer Periods, 2012 ................................... 23
Figure 22. C&I Cooling Consumption by Utility for Summer Periods, 2012 ............................................... 24
Figure 23. Residential Maximum Achievable Residential Electric Savings Potential by End Use ............... 27
Figure 24. Residential Sector Plans to Add or Change Air Conditioning Equipment .................................. 29
Figure 25. Plan to Add or Change Air Conditioning Equipment by Time in Residence ............................... 30
Figure 26. Plan to Add or Change Air Conditioning Equipment by Year Home was Built ........................... 31
Figure 28. Daily Electricity Use of a Dehumidifier....................................................................................... 35
Figure 29. Energy Consumption by a Laundry System ................................................................................ 37
Figure 30. Maximum Achievable Commercial and Industrial Electric Savings Potential by End Use ........ 40
Figure 31. Commercial Building Temperature Response Curve from Remote Billing Analysis Software ... 43
Figure 27. Peak Savings for a Heat Pump Water Heater ............................................................................ 57
NH Monitoring and Evaluation Team, NH HVAC Research iv
EXECUTIVE SUMMARY
In its Order on Home Performance with ENERGY STAR® Program (Order No. 25,402) issued on August 23,
2012, the New Hampshire Public Utilities Commission (NHPUC) approved the implementation of Home
Performance with ENERGY STAR® (HPwES) as a fuel‐neutral program in the New Hampshire utilities’
2013‐2014 CORE program offerings, conditional on the execution and findings of additional program
research. The order contained directives to the New Hampshire utilities—Public Service New Hampshire,
the New Hampshire Electric Cooperative, Liberty Utilities, and Unitil Energy Systems—to conduct
research related to electric cooling loads and cooling equipment, additional opportunities for energy‐
efficiency, and the comprehensive electric impacts of the HPwES program.
The New Hampshire monitoring and evaluation (M&E) team commissioned Cadmus to review available
secondary data to respond to these three directives:
1. Study the drivers of the increasing air conditioning load in both the residential and commercial
and industrial (C&I) customer sectors and to begin to develop cost‐effective energy‐efficiency
programs to reduce this load;
2. Develop additional measures and programs to reduce air conditioning electric loads; and
3. Develop estimates of the ancillary electricity savings associated with various non‐electric
measures used in the HPwES Program.
Over a six‐week period in February and March 2013, Cadmus collected and reviewed the New
Hampshire energy‐efficiency programs, historical electric load data, data from previous New Hampshire
research studies and evaluations, data from surveys conducted for utility customers and New Hampshire
residents, and additional data from Cadmus’ work in other regions to respond to each of these three
directives. We conducted the research in three tasks, each corresponding to one of the study directives.
This report describes the objective, research methods and data employed, and key results for each task.
Task 1. Air Conditioning Load and Market
The first task involved analyzing the air conditioning load and market to identify the principle factors
that account for the current market trend of increasing air conditioning load in the residential and C&I
sectors.
Cadmus reviewed historical electric load data for the New Hampshire load zone and each utility
customer class, customer survey data collected by the utilities and for a 2009 New Hampshire energy‐
efficiency potential study, and other secondary data to estimate typical cooling load profiles by sectors
and assess the market saturation in each sector of cooling equipment.
Residential Sector
Figure E‐1 shows the estimated cooling and total electric load profiles for the New Hampshire residential
sector for an average summer weekday. The profile shows that the residential sector peak load occurs

NH Monitoring and Evaluation Team, NH HVAC Research v
after the summer on‐peak period and is driven by non‐cooling loads, which remain relatively constant
between noon and midnight.
Figure E‐1. Estimated Residential Total and Cooling Load Profile for Summer Weekday
Source: Cadmus weather‐based load analysis using hourly model regression and utility load data
Figure E‐2 shows the trends in cooling equipment type for NHEC and PSNH customers based on survey
data and projections from 1986 and through 2020. The data show increasing saturations of room air
conditioner (RAC) and central air conditioner (CAC) systems for both companies and a very modest
projection for heat pump cooling equipment saturation.
NH Monitoring and Evaluation Team, NH HVAC Research vi
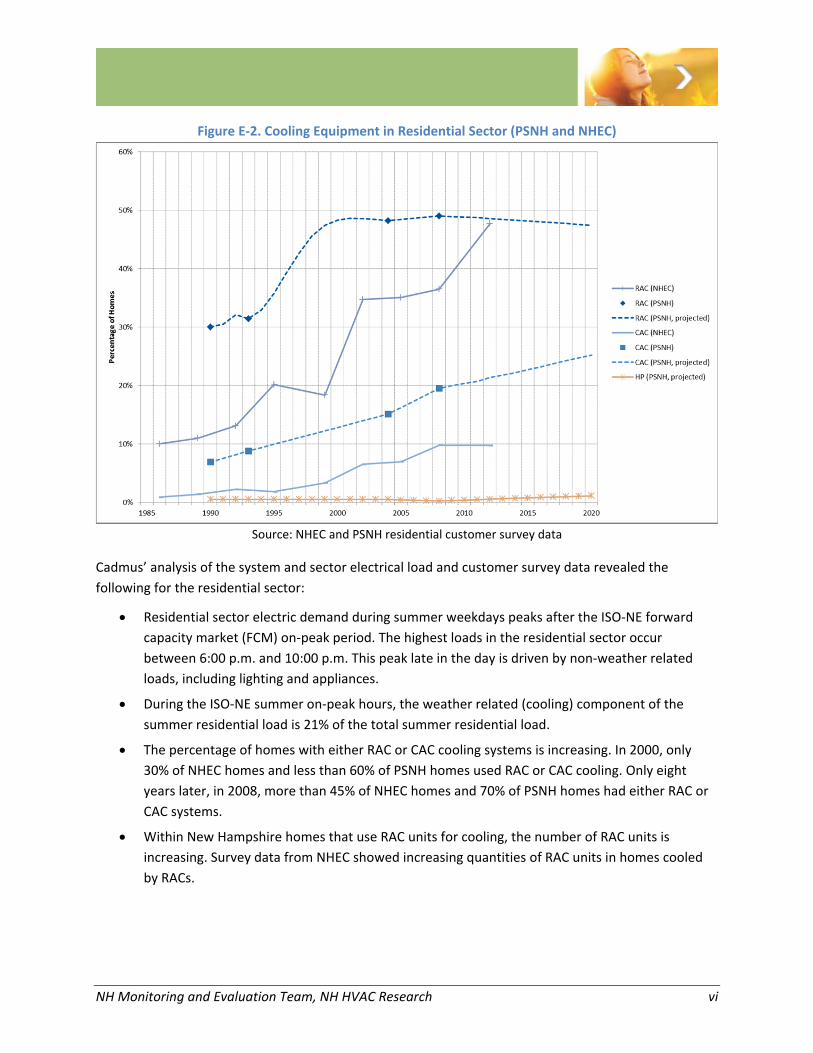
Figure E‐2. Cooling Equipment in Residential Sector (PSNH and NHEC)
Source: NHEC and PSNH residential customer survey data
Cadmus’ analysis of the system and sector electrical load and customer survey data revealed the
following for the residential sector:
Residential sector electric demand during summer weekdays peaks after the ISO‐NE forward
capacity market (FCM) on‐peak period. The highest loads in the residential sector occur
between 6:00 p.m. and 10:00 p.m. This peak late in the day is driven by non‐weather related
loads, including lighting and appliances.
During the ISO‐NE summer on‐peak hours, the weather related (cooling) component of the
summer residential load is 21% of the total summer residential load.
The percentage of homes with either RAC or CAC cooling systems is increasing. In 2000, only
30% of NHEC homes and less than 60% of PSNH homes used RAC or CAC cooling. Only eight
years later, in 2008, more than 45% of NHEC homes and 70% of PSNH homes had either RAC or
CAC systems.
Within New Hampshire homes that use RAC units for cooling, the number of RAC units is
increasing. Survey data from NHEC showed increasing quantities of RAC units in homes cooled
by RACs.

NH Monitoring and Evaluation Team, NH HVAC Research vii
C&I Sector
Figure E‐3 shows the estimated cooling and total electric load profiles for the New Hampshire C&I sector
for an average summer weekday. The profile shows that the C&I sector peak coincides with the summer
on‐peak period and is influenced by cooling loads, which are highest during the summer on‐peak hours.
Figure E‐3. Estimated C&I Total and Cooling Load Profile for Summer Weekday
Source: Cadmus weather‐based load analysis using hourly model regression and utility load data
Figure E‐4 shows unweighted percentages of space cooling for commercial buildings indicated by 196
small commercial customers surveyed in the 2009 New Hampshire energy‐efficiency potential study.
The data show that over 20% of commercial facilities do not use any air‐conditioning equipment and less
than half cool the entire building.
Figure E‐4. Space Cooling for Small C&I Buildings (based on 200 phone surveys)
Source: GDS Associates. “Additional Opportunities for Energy Efficiency in New Hampshire.” 2009.

NH Monitoring and Evaluation Team, NH HVAC Research viii
Cadmus’ analysis of the system and sector electrical load and customer survey data revealed the
following for the C&I sector:
C&I sector electric demand during summer weekdays is coincident with the ISO‐FCM on‐peak
period. The highest loads in the C&I sector occur between 11:00 a.m. and 3:00 p.m. This early
peak in the summer is driven by building cooling loads.
During the ISO‐NE summer on‐peak hours, the weather related (cooling) component of the
summer C&I sector load is 17% of the total summer C&I sector load.
The percentage of facilities with mechanical cooling systems is stable at 75% (based on PSNH
survey data and EIA projections) and not expected to increase in the near future. It is expected
that the C&I cooling market is saturated (i.e., those facilities without cooling equipment do not
require cooling).
A sizeable percentage of both small and large commercial facilities lack programmable controls
system for their HVAC equipment. Based on surveys conducted for the 2009 NH potential study,
less than 11% of small commercial buildings have programmable thermostats and less than 40%
of large commercial buildings use a central HVAC control system.
Task 2. Program Enhancements
The second task involved the development of recommendations to modify or expand the portfolio of
existing core programs for the residential and C&I customer sectors to promote the installation of cost‐
effective measures to reduce air conditioning peak demand and energy consumption.
Cadmus reviewed the current portfolio of core energy‐efficiency programs offered by the New
Hampshire utilities, customer survey data collected by the utilities and for a 2009 New Hampshire
energy‐efficiency potential study, and other secondary data including program offerings in other
regions. Using these secondary sources along with Cadmus’ experience through data collection and
evaluations, we developed recommendations to enhance the New Hampshire programs’ effectiveness in
reducing overall energy consumption and summer peak demand.
Figure 5 shows the summary of annual energy and summer peak demand reduction potential by sector
as determined in the 2009 potential study.
NH Monitoring and Evaluation Team, NH HVAC Research ix
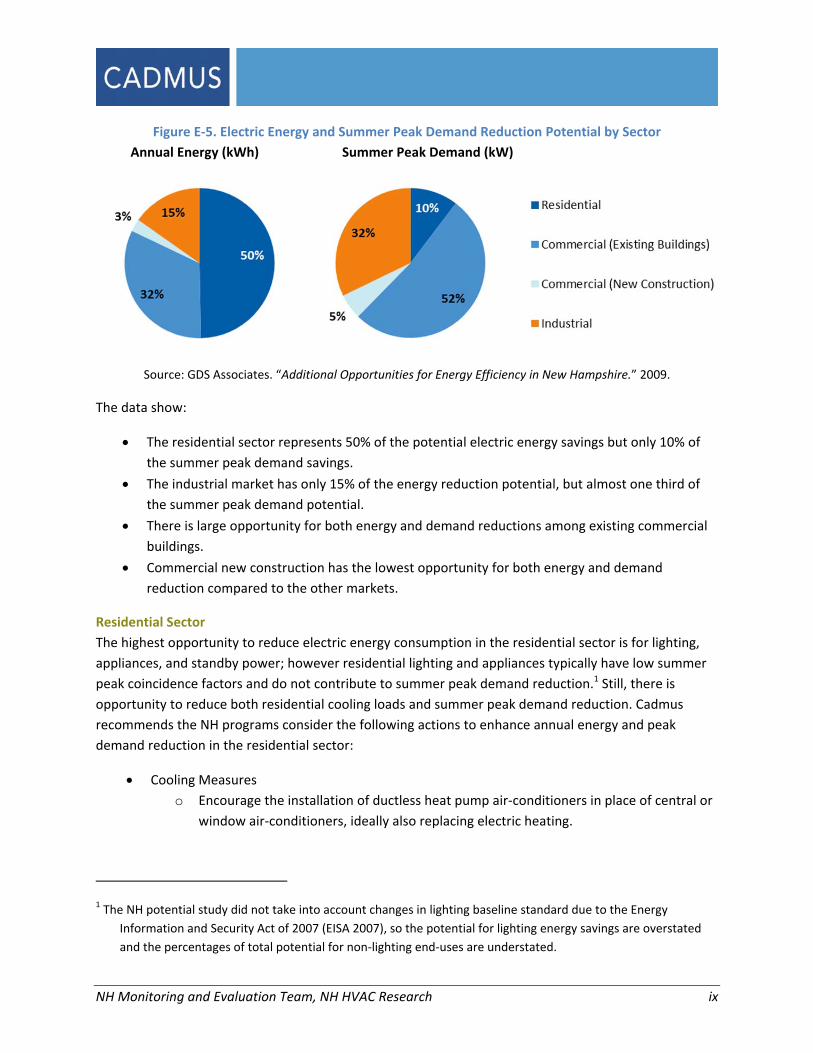
Figure E‐5. Electric Energy and Summer Peak Demand Reduction Potential by Sector
Annual Energy (kWh) Summer Peak Demand (kW)
Source: GDS Associates. “Additional Opportunities for Energy Efficiency in New Hampshire.” 2009.
The data show:
The residential sector represents 50% of the potential electric energy savings but only 10% of
the summer peak demand savings.
The industrial market has only 15% of the energy reduction potential, but almost one third of
the summer peak demand potential.
There is large opportunity for both energy and demand reductions among existing commercial
buildings.
Commercial new construction has the lowest opportunity for both energy and demand
reduction compared to the other markets.
Residential Sector
The highest opportunity to reduce electric energy consumption in the residential sector is for lighting,
appliances, and standby power; however residential lighting and appliances typically have low summer
peak coincidence factors and do not contribute to summer peak demand reduction.1 Still, there is
opportunity to reduce both residential cooling loads and summer peak demand reduction. Cadmus
recommends the NH programs consider the following actions to enhance annual energy and peak
demand reduction in the residential sector:
Cooling Measures
o Encourage the installation of ductless heat pump air‐conditioners in place of central or
window air‐conditioners, ideally also replacing electric heating.
1 The NH potential study did not take into account changes in lighting baseline standard due to the Energy
Information and Security Act of 2007 (EISA 2007), so the potential for lighting energy savings are overstated
and the percentages of total potential for non‐lighting end‐uses are understated.
NH Monitoring and Evaluation Team, NH HVAC Research x
o Ensure the programs capture opportunities to install the highest efficiency equipment
for residential new construction and planned equipment replacement opportunities.
o Encourage the early replacement of existing inefficient air‐conditioners.
o Encourage the installation of web‐enabled programmable thermostat with central
controls for demand response actions during summer peak periods.
Non‐Cooling Measures
o Encourage the implementation of advanced power strips and computer management
measures to reduce standby loads.
o Provide incentives for heat pump water heaters to replace existing or new electric
water heaters.
o Provide additional education on the use of clothes washers to reduce energy costs.
o Encourage the installation of low‐flow showerheads and aerators for homes with
electric hot water heating.
C&I Sector
Within the C&I sector, the highest opportunity to reduce energy consumption is in existing commercial
and industrial facilities. The highest opportunity to reduce electric energy consumption is through
upgrades to the equipment and controls in these end‐uses: lighting, refrigeration, HVAC, and industrial
machine drives. Since equipment in the C&I sector typically operates through the summer peak hours,
the peak demand potential is comparable to the energy reduction potential.
Cadmus recommends the NH programs consider the following actions to enhance annual energy and
peak demand reduction in the C&I sector:
Cooling Measures
o Promote building retro‐commissioning to assess and upgrade HVAC control systems.
o Promote installation of variable speed drives for data center CRAC and air handler fans.
o Consider utilizing a remote interval data analysis tool to identify customers with the
highest cooling loads and assess energy‐efficiency opportunities.
Non‐Cooling Measures
o Develop a targeted prescriptive refrigeration program for small and large C&I facilities.
o Continue to support lighting system and control upgrades.
o Encourage the implementation of advanced power strips and computer management
measures to reduce standby loads.
o Consider a targeted program for emergency generator block heaters.
Task 3. Ancillary Electric Savings
The third task involved the development of quantitative estimates of the electric energy and peak
demand impacts associated with weatherizing homes in the HPwES program and resulting from the
replacement of HVAC and DHW systems promoted by the ENERGY STAR Appliance Program.

NH Monitoring and Evaluation Team, NH HVAC Research xi
Cadmus used secondary data to develop estimates of the electric energy and demand impacts of HPwES
weatherization measures as well as the following residential HVAC measures: high‐efficiency furnace
with ECM, heat pump water heater, and early‐replacement CAC.
Table E‐1 shows the estimated energy and demand impacts of weatherization measures on auxiliary
electric heating system equipment and for typical cooling system equipment.
Table E‐1. Electric Impacts from Weatherization
Equipment Impact Description of Impact Annual kWh Summer
On‐Peak kW Winter
On‐Peak kW
Furnace fan Reduced fan operation based on heating load reduction from weatherization measures 86 0 TBD
HW boiler circulation pump(s)
Reduced boiler pump operation based on heating load reduction from weatherization measures 9 0 TBD
Steam boiler n/a 0 0 0
Average Heating System
Average heating season electric impact of weatherization measures for non‐electric heating system 55 0 TBD
CAC Reduced CAC cooling energy based on cooling load reduction from weatherization measures 77 TBD 0
RAC (per unit) Reduced per unit RAC cooling energy based on cooling load reduction from weatherization measures 23 TBD 0
RAC (per home)
Reduced household RAC cooling energy based on cooling load reduction from weatherization measures and average units per RAC‐cooled home 50 TBD 0
Average Cooling System
Electric impact of weatherization measures for average residential cooling energy 34 TBD 0
Table E‐2 shows the estimated energy and demand impacts of other HVAC and DHW equipment offered
through the NH Appliances program.
Table E‐2. Electric Impacts from HVAC and DHW Equipment
Measure Description of Impact Annual kWh Summer
On‐Peak kW Winter
On‐Peak kW
Furnace with ECM Reduced electricity requirements for fan ECM compared to existing fan motor 733
2 0 TBD
HPWH Reduced electricity requirement for hot water consumption compared to standard electric heater 9613 0.184 0.268
Early Replacement of CAC
Reduced electricity requirement for CAC cooling compared to existing inefficient CAC system 457 TBD 0
2 PA Consulting Group. “ECM Furnace Impact Assessment Report.” January 2009. 3 Cadmus. “United Illuminating Heat Pump Water Heater Pilot: Impact and Customer Acceptance Study.” June
2010.


NH Monitoring and Evaluation Team, NH HVAC Research 1
INTRODUCTION AND BACKGROUND
The New Hampshire Public Utilities Commission (NHPUC) and the New Hampshire utilities—Public
Service New Hampshire, the New Hampshire Electric Cooperative, Liberty Utilities, and Unitil Energy
Systems—offer to their customers a suite of energy‐efficiency programs to encourage energy‐efficiency
best practices in the new construction, major renovation, equipment replacement, and retrofit markets
to reduce overall energy consumption and electric demand during peak periods. Among these programs
is the Home Performance with ENERGY STAR® (HPwES) program, which aims to improve efficiency in the
residential sector through comprehensive home energy audits and implementation of efficiency
measures that include weatherization and upgrades to heating, cooling, and hot water systems.
In its Order on Home Performance with ENERGY STAR® Program (Order No. 25,402) issued on August 23,
2012, the New Hampshire Public Utilities Commission (NHPUC) approved the implementation of HPwES
as a fuel‐neutral program in the New Hampshire utilities’ 2013‐2014 CORE program offerings, while also
seeking additional program research.
In the Order, the NHPUC directed its staff and the utilities to conduct research to identify the drivers of
air conditioning load, identify additional opportunities to enhance the energy‐efficiency programs to
target summer peak demand reductions, and quantify the electric energy and demand impacts of non‐
electric measures implemented through the HPwES Program.
The directives stated in the Order include:
1. Study the drivers of the increasing air conditioning load in both the residential and commercial
and industrial (C&I) customer sectors and to begin to develop cost‐effective energy‐efficiency
programs to reduce this load. Included window unit air conditioners and their installation in this
analysis, as well as central air conditioning systems;
2. Develop additional measures and programs to reduce air conditioning electric loads; and
3. Develop estimates of the ancillary electricity savings associated with various non‐electric
measures used in the HPwES Program.
Cadmus conducted this study via three tasks, each of which corresponds to the NHPUC directives stated
above.
Task 1. Characterize Air Conditioning Load and Market
The first task involved analyzing the air conditioning load and market to identify the principle factors
that account for the current market trend of increasing air conditioning load in the residential and C&I
sectors.
NH Monitoring and Evaluation Team, NH HVAC Research 2
The key results of this task are:
An assessment of the current market saturation and penetration of air conditioning equipment,
disaggregated by equipment type (central air conditioning, room air conditioning, heat pumps),
and
An analysis of the relative contribution of each equipment category to summer peak energy and
demand, as defined by ISO New England (ISO‐NE) for the purpose of qualifying passive demand
resources.4
Task 2. Develop Program Enhancements
The second task involved reviewing the current portfolio of CORE New Hampshire energy‐efficiency
programs for the residential and C&I customer sectors, and developing recommendations to enhance
the programs’ electric energy and peak demand impacts through the inclusion of new measures or new
program elements that will cost‐effectively reduce electric air conditioning load.
The key result of this task is:
Detailed recommendations to modify or expand the portfolio of existing NH CORE programs for
the residential and C&I customer sectors to promote the installation of cost‐effective measures
to reduce air conditioning peak demand and energy consumption.
Task 3. Develop Ancillary Electric Savings
The third task involved developing estimates of electric energy and peak demand savings resulting from
weatherization measures and efficient HVAC and domestic hot water (DHW) system replacements being
implemented in the HPwES Program.
The key results of this task are:
Quantitative estimates of the electric energy and peak demand impacts associated with
weatherizing homes in the HPwES Programs, and
Quantitative estimates of the electric energy and peak demand impacts resulting from the
replacement of HVAC and DHW systems promoted by the ENERGY STAR Appliance Program.
For each task, we analyzed available secondary data—including historical electric load data available
from ISO‐NE, survey data for New Hampshire residents and utility customers, data collected for previous
New Hampshire program evaluations, and data from Cadmus’ studies—and discussed the results
through multiple meetings with the New Hampshire monitoring and evaluation (M&E) team to develop
the key results. This report describes the methods and findings for each task in this research.
4 Passive demand resources are non‐dispatchable energy‐efficiency measures that reduce load during summer
on‐peak or seasonal peak periods, as defined by ISO New England.

NH Monitoring and Evaluation Team, NH HVAC Research 3
TASK 1. CHARACTERIZE ELECTRIC LOAD
This section describes the objective, methods, and key results from Task 1, including analysis of total
electric and cooling load at the system and sector levels and assessment of the air conditioning market
within each sector.
Objective Order 25,402 states that: “New Hampshire now reaches its peak electric usage in the summer; most of
which is due to air conditioning load” (page 24‐25). The supposition is that the increasing electric load
during the summer is driven by increasing air conditioning loads in the residential and C&I sectors.
Under this task, the New Hampshire M&E team seeks to assess the components and key drivers of
cooling load in each sector.
The key results of this task are:
An assessment of the current market saturation and penetration of air conditioning equipment,
disaggregated by equipment type (central air conditioning, room air conditioning, heat pumps),
and
An analysis of the relative contribution of each equipment category to summer peak energy and
demand, as defined by ISO‐NE for the purpose of qualifying passive demand resources.5
Method To understand the components and key drivers of cooling load in each sector, Cadmus examined
historical electric load profiles for the New Hampshire load zone and for each sector within New
Hampshire. We also reviewed previous evaluation studies, market characterization studies, and surveys
of New Hampshire customers to assess the air conditioning market in each sector.
System Load
Cadmus analyzed the electric load for the New Hampshire load zone, including the demand of all electric
utilities, to examine load growth over time, understand the system load profile, and assess the cooling
component of the total system load.
Historical System Peak Load
Figure 1 shows the historical summer and winter peak demand for the total ISO‐NE system from 1980
through 2012, along with the historical summer and winter peak demand from the New Hampshire load
zone from 2003 through 2012.6
5 Passive demand resources are non‐dispatchable energy‐efficiency measures that reduce load during summer
on‐peak or seasonal peak periods, as defined by ISO‐NE. 6 Data prior to 2003 were not available for the New Hampshire load zone.
NH Monitoring and Evaluation Team, NH HVAC Research 4
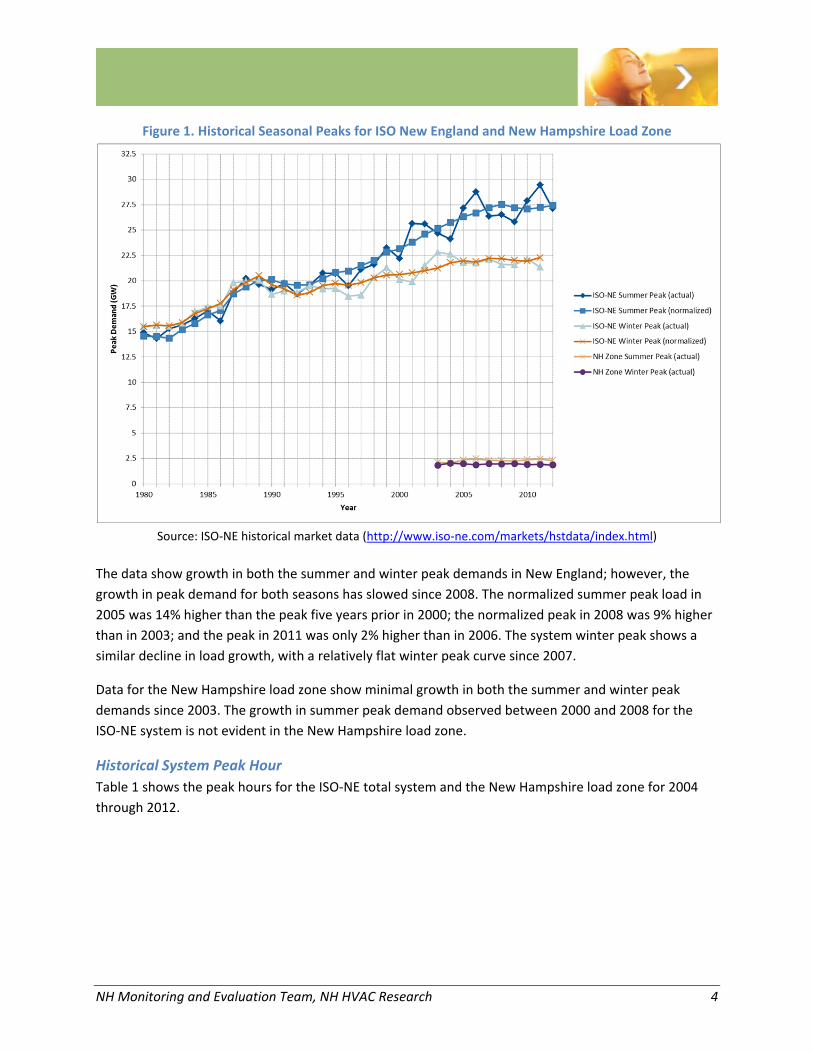
Figure 1. Historical Seasonal Peaks for ISO New England and New Hampshire Load Zone
Source: ISO‐NE historical market data (http://www.iso‐ne.com/markets/hstdata/index.html)
The data show growth in both the summer and winter peak demands in New England; however, the
growth in peak demand for both seasons has slowed since 2008. The normalized summer peak load in
2005 was 14% higher than the peak five years prior in 2000; the normalized peak in 2008 was 9% higher
than in 2003; and the peak in 2011 was only 2% higher than in 2006. The system winter peak shows a
similar decline in load growth, with a relatively flat winter peak curve since 2007.
Data for the New Hampshire load zone show minimal growth in both the summer and winter peak
demands since 2003. The growth in summer peak demand observed between 2000 and 2008 for the
ISO‐NE system is not evident in the New Hampshire load zone.
Historical System Peak Hour
Table 1 shows the peak hours for the ISO‐NE total system and the New Hampshire load zone for 2004
through 2012.

NH Monitoring and Evaluation Team, NH HVAC Research 5
Table 1. Historical Peak Hours for ISO New England and New Hampshire Load Zone
Year ISO New England New Hampshire Load Zone
Peak Date Hour Ending Peak Hour Peak Date Peak Hour Offset from ISO‐NH Peak Hour
2004 August 30 15 2 ‐ 3 p.m. August 30 3 ‐ 4 p.m. + 1 hour
2005 July 27 15 2 ‐ 3 p.m. July 27 2 ‐ 3 p.m. same
2006 August 02 15 2 ‐ 3 p.m. August 02 1 ‐ 2 p.m. ‐ 1 hour
2007 August 03 15 2 ‐ 3 p.m. August 03 2 ‐ 3 p.m. same
2008 June 10 17 4 ‐ 5 p.m. June 10 3 ‐ 4 p.m. ‐ 1 hour
2009 August 18 15 2 ‐ 3 p.m. August 18 1 ‐ 2 p.m. ‐ 1 hour
2010 July 06 15 2 ‐ 3 p.m. July 06 2 ‐ 3 p.m. same
2011 July 22 15 2 ‐ 3 p.m. July 22 1 ‐ 2 p.m. ‐ 1 hour
2012 July 17 17 4 ‐ 5 p.m. July 17 5 ‐ 6 p.m. + 1 hour
Source: ISO‐NE historical market data (http://www.iso‐ne.com/markets/hstdata/index.html)
The ISO‐NE system typically peaks in July or August between 2:00 p.m. and 5:00 p.m. These hours are
within the ISO‐NE summer on‐peak window (1:00 – 5:00 p.m.) as defined for energy‐efficiency resources
in the Forward Capacity Market (FCM). The New Hampshire load zone follows a similar pattern and
peaks on the same day as the total system, although not always during the same hour. Between 2004
and 2012, the New Hampshire load zone peaked during a summer weekday as early as 1:00 p.m. and at
late as 6:00 p.m.
Historical Demand for New Hampshire Load Zone
A closer look at historical energy consumption and peak demand for the New Hampshire load zone
shows relatively stable electric loads in the past decade. Figure 2 shows the historical electric
consumption, peak demand, and the summer and winter on‐peak demand for the New Hampshire load
zone from 2004 through 2012.7
7 The summer on‐peak demand is calculated as the historical average demand during the period 1:00 – 5:00 p.m.
on weekdays in June, July, and August. The winter on‐peak demand is calculated as the historical average
demand during the period 5:00 – 7:00 p.m. on weekdays in December, January, and February.

NH Monitoring and Evaluation Team, NH HVAC Research 6
Figure 2. Historical Consumption and Peak Loads for New Hampshire Load Zone
Source: ISO‐NE historical market data (http://www.iso‐ne.com/markets/hstdata/index.html)
The New Hampshire annual energy consumption has remained under 12,000 GWh over the past decade,
and the total energy consumption in 2012 is within 1% of the total consumption in 2004. Similarly, the
peak demand does not show an increasing trend, and other than in 2004, the peak demand has
remained within ±6% of the average peak demand from 2004 to 2012. The average demand during both
the summer and winter peak hours shows no significant growth.
Summer and Winter Profiles for New Hampshire Load Zone
To investigate the hourly electrical load for the New Hampshire load zone, Cadmus analyzed the system
load profiles for the average weekday, weekend, and peak day in the summer and winter seasons.
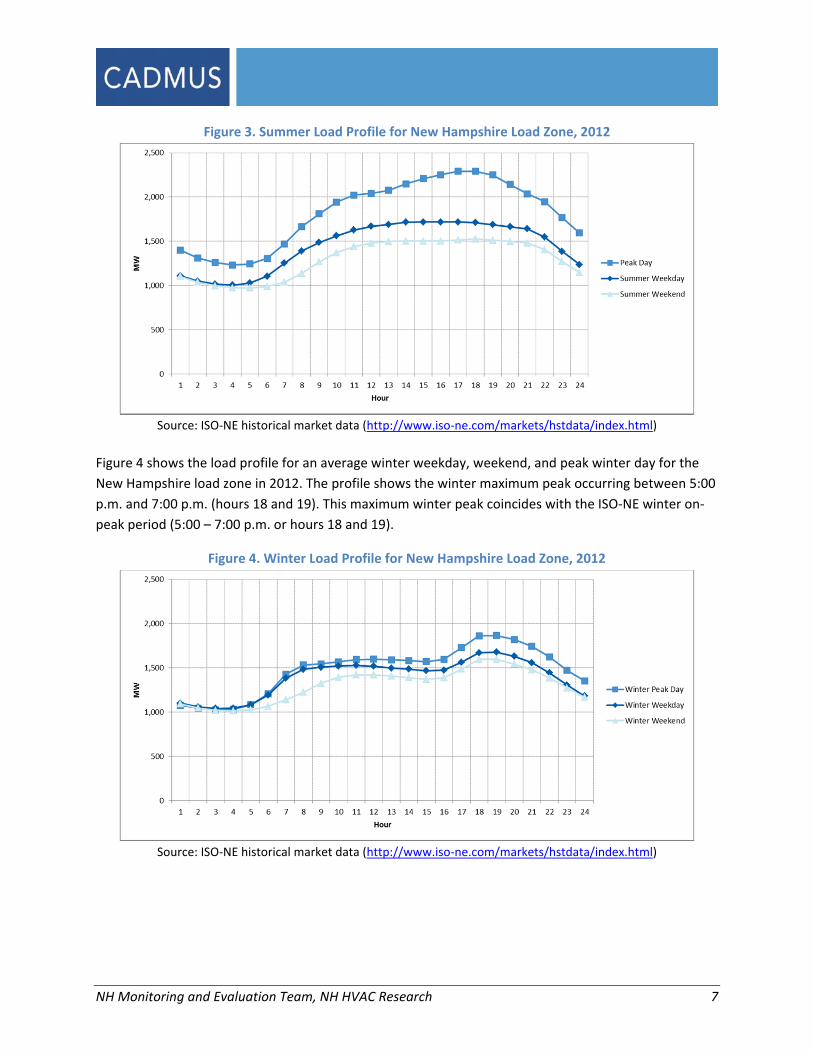
Figure 3 shows the load profile for an average summer weekday, weekend, and peak summer day for
the New Hampshire load zone in 2012. The profile shows the summer peak occurring between 4:00 p.m.
and 6:00 p.m. (hours 17 and 18). This maximum summer peak only partially coincides with the ISO‐NE
summer on‐peak period (1:00 – 5:00 p.m. or hours 14 – 17).
NH Monitoring and Evaluation Team, NH HVAC Research 7
Figure 3. Summer Load Profile for New Hampshire Load Zone, 2012
Source: ISO‐NE historical market data (http://www.iso‐ne.com/markets/hstdata/index.html)
Figure 4 shows the load profile for an average winter weekday, weekend, and peak winter day for the
New Hampshire load zone in 2012. The profile shows the winter maximum peak occurring between 5:00
p.m. and 7:00 p.m. (hours 18 and 19). This maximum winter peak coincides with the ISO‐NE winter on‐
peak period (5:00 – 7:00 p.m. or hours 18 and 19).
Figure 4. Winter Load Profile for New Hampshire Load Zone, 2012
Source: ISO‐NE historical market data (http://www.iso‐ne.com/markets/hstdata/index.html)

NH Monitoring and Evaluation Team, NH HVAC Research 8
Load Versus Weather Analysis
To visualize the weather dependence of the New Hampshire load zone demand, Cadmus compared the
daily peak and average daily temperatures.8 Figure 5 shows the relationship between daily peak demand
and daily average temperature for the New Hampshire load zone in 2004 and 2012. The figure shows
the system load as highly dependent on both hot and cold weather data, indicating that electric energy
consumption correlates with both cooling and heating.
Figure 5. Load Weather Response for New Hampshire Load Zone, 2012
Source: ISO‐NE historical market data (http://www.iso‐ne.com/markets/hstdata/index.html)
To further analyze the weather response of the system load, Cadmus performed a regression analysis of
hourly system demand and hourly temperature to separate the system demand into the following three
components:
1. Base load: The system base load is the electric demand that does not respond to weather
variations. In Figure 5, the base load is represented by the bottom of the curve, or the minimum
observed system demand.
2. Weather‐dependent cooling: The system weather‐dependent cooling load is identified as the
electric demand that responds to increasing warm temperatures. In Figure 5, the cooling load is
represented by the increasing demand as the daily average temperature rises above 60 degrees
Fahrenheit. Cooling energy that is not weather dependent (e.g., data center or other process
cooling) is included in the base load.
8 We used weather data provided by ISO‐NE with the historical hourly electric load data for the NH load zone. For
New Hampshire, ISO‐NE uses the weather station in Concord, NH (CON).

NH Monitoring and Evaluation Team, NH HVAC Research 9
3. Weather‐dependent heating: The system weather‐dependent heating load is identified as the
electric demand that responds to decreasing cold temperatures. In Figure 5, the heating load is
represented by the increasing demand as daily average temperatures drop below 60 degrees
Fahrenheit. Heating energy that is not weather dependent (e.g., process heating) is included in
the base load.
The methods Cadmus used to develop this weather analysis are provided in Appendix B.
Cadmus applied the regression results to historical weather data to determine the contribution of each
load component to system total consumption, average demand, and peak demand. Figure 6 shows the
percentage of energy consumption attributable to normalized weather‐dependent cooling during the
summer months (June through August) and during the summer on‐peak hours (summer weekdays
between 1:00 p.m. and 5:00 p.m.) from 2004 to 2012.
Figure 6. Weather‐Normalized Cooling Consumption for New Hampshire Load Zone
Source: Cadmus weather‐based load analysis using hourly model regression and ISO‐NE historical market data
(http://www.iso‐ne.com/markets/hstdata/index.html)
The data shows that the percentage of total summer energy consumption attributable to weather‐
dependent cooling varied from 9% and 11%, and the percentage of weather‐dependent cooling
consumption during the summer on‐peak hours varied from 11% and 17%.
Figure 7 shows the estimated weather‐dependent cooling energy consumption as a percentage of total
energy consumption for each utility and for all utilities combined, for each of the following periods:
Annual: The fraction of total annual energy consumption attributed to cooling loads.
Summer WD: The fraction of energy consumed during summer weekdays attributed to cooling
(all hours).
Summer WD (1:00 – 5:00 p.m.): The fraction of energy consumed during the summer on‐peak
hours attributed to cooling.
NH Monitoring and Evaluation Team, NH HVAC Research 10
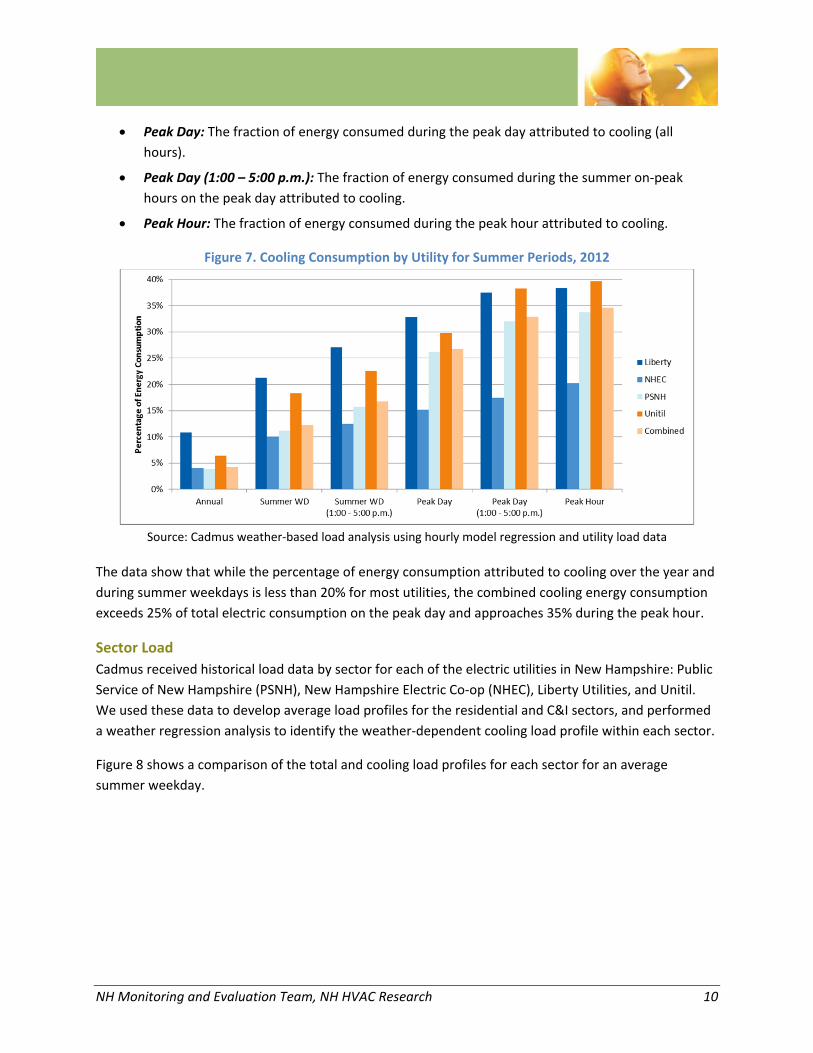
Peak Day: The fraction of energy consumed during the peak day attributed to cooling (all
hours).
Peak Day (1:00 – 5:00 p.m.): The fraction of energy consumed during the summer on‐peak
hours on the peak day attributed to cooling.
Peak Hour: The fraction of energy consumed during the peak hour attributed to cooling.
Figure 7. Cooling Consumption by Utility for Summer Periods, 2012
Source: Cadmus weather‐based load analysis using hourly model regression and utility load data
The data show that while the percentage of energy consumption attributed to cooling over the year and
during summer weekdays is less than 20% for most utilities, the combined cooling energy consumption
exceeds 25% of total electric consumption on the peak day and approaches 35% during the peak hour.
Sector Load
Cadmus received historical load data by sector for each of the electric utilities in New Hampshire: Public
Service of New Hampshire (PSNH), New Hampshire Electric Co‐op (NHEC), Liberty Utilities, and Unitil.
We used these data to develop average load profiles for the residential and C&I sectors, and performed
a weather regression analysis to identify the weather‐dependent cooling load profile within each sector.
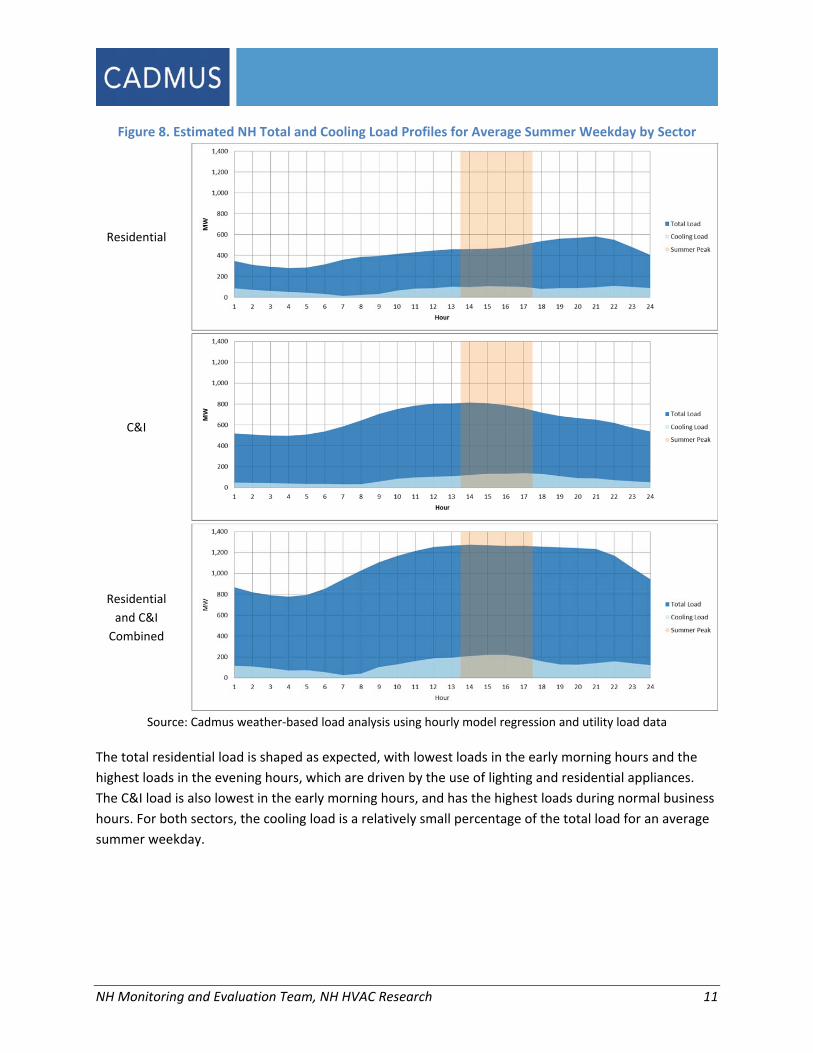
Figure 8 shows a comparison of the total and cooling load profiles for each sector for an average
summer weekday.
NH Monitoring and Evaluation Team, NH HVAC Research 11
Figure 8. Estimated NH Total and Cooling Load Profiles for Average Summer Weekday by Sector
Residential
C&I
Residential
and C&I
Combined
Source: Cadmus weather‐based load analysis using hourly model regression and utility load data
The total residential load is shaped as expected, with lowest loads in the early morning hours and the
highest loads in the evening hours, which are driven by the use of lighting and residential appliances.
The C&I load is also lowest in the early morning hours, and has the highest loads during normal business
hours. For both sectors, the cooling load is a relatively small percentage of the total load for an average
summer weekday.

NH Monitoring and Evaluation Team, NH HVAC Research 12
Figure 9 compares the total and cooling load profiles for each sector for the system peak day in 2012.
Figure 9. Estimated NH Total and Cooling Load Profile for Peak Day by Sector
Residential
C&I
Residential
and C&I
Combined
Source: Cadmus weather‐based load analysis using hourly model regression and utility load data
The peak day loads for both sectors are shaped similarly to the average summer weekday profiles, with
higher total loads throughout the day due to increased cooling loads. The peak demand in the
residential sector still occurs in the evening, and the peak demand for the C&I sector is just after noon.
Residential Cooling Equipment
The typical mechanical cooling equipment in the residential sector includes central air conditioning
(CAC) systems, window or room air conditioning (RAC) units, and heat pump equipment. Since New
Hampshire has a relatively cool climate compared to other regions in the US, as well as a population of

NH Monitoring and Evaluation Team, NH HVAC Research 13
vacation or second homes, there is also a sizable percentage of homes with no mechanical cooling
equipment.
Cadmus reviewed customer survey data to assess the current and historical saturation of each cooling
equipment type among residential homes in New Hampshire. Data sources included:
E SOURCE Residential Energy End‐Use Study: Appliance and Equipment Saturation – Cooling
Equipment (July 2011): This study conducted by E SOURCE included a 2010 survey of 32,471
residential US customers on a variety of energy‐related topics. The survey included 189 New
Hampshire residents.
PSNH Customer Survey Data: PSNH provided data from its periodic residential customer surveys
for years 1990, 1993, 2004, and 2008. The 2008 survey included 1,885 PSNH customers.
NHEC Customer Survey Data: NHEC provided data from its triennial residential customer
surveys for years 1989, 1992, 1995, 1999, 2002, 2005, 2008, and 2012. The 2012 survey included
1,098 NHEC customers.
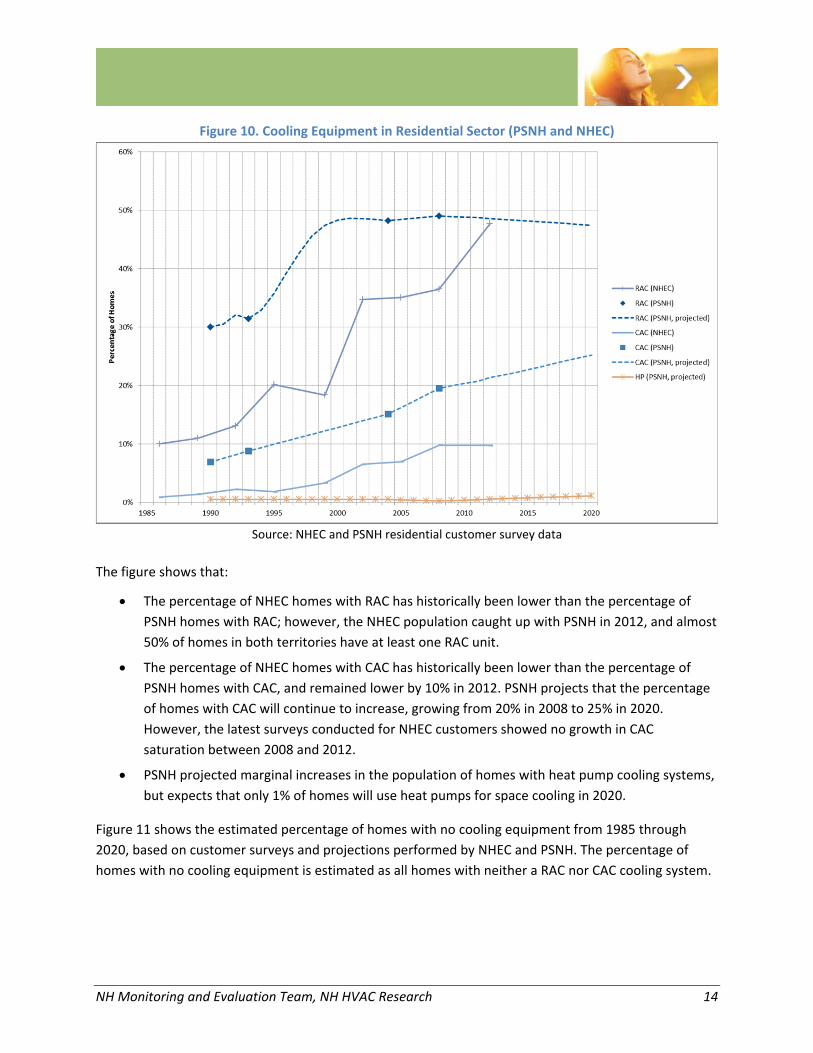
Figure 10 shows the trends in cooling equipment type for NHEC and PSNH customers based on survey
data and projections from 1986 and through 2020. The survey data show increasing saturations of RAC
and CAC systems for both companies, though PNSH projects decreasing percentage of homes with RAC
equipment after 2008.9
9 The saturation values are percentage of households with each equipment type. A decreasing percentage of
homes with RAC does not necessarily mean a decreasing number of homes with RAC. The PSNH projections
show continued increase in the percentage of homes with CAC, leaving a smaller share of the market for RAC.
NH Monitoring and Evaluation Team, NH HVAC Research 14
Figure 10. Cooling Equipment in Residential Sector (PSNH and NHEC)
Source: NHEC and PSNH residential customer survey data
The figure shows that:
The percentage of NHEC homes with RAC has historically been lower than the percentage of
PSNH homes with RAC; however, the NHEC population caught up with PSNH in 2012, and almost
50% of homes in both territories have at least one RAC unit.
The percentage of NHEC homes with CAC has historically been lower than the percentage of
PSNH homes with CAC, and remained lower by 10% in 2012. PSNH projects that the percentage
of homes with CAC will continue to increase, growing from 20% in 2008 to 25% in 2020.
However, the latest surveys conducted for NHEC customers showed no growth in CAC
saturation between 2008 and 2012.
PSNH projected marginal increases in the population of homes with heat pump cooling systems,
but expects that only 1% of homes will use heat pumps for space cooling in 2020.
Figure 11 shows the estimated percentage of homes with no cooling equipment from 1985 through
2020, based on customer surveys and projections performed by NHEC and PSNH. The percentage of
homes with no cooling equipment is estimated as all homes with neither a RAC nor CAC cooling system.

NH Monitoring and Evaluation Team, NH HVAC Research 15
Figure 11. Percentage of Homes with No Cooling Equipment
Source: NHEC and PSNH residential customer survey data
The data indicate that the percentage of homes with no mechanical cooling is rapidly shrinking. In 2000,
70% of NHEC homes and almost 40% of PSNH homes did not use mechanical cooling. Only eight years
later, in 2008, less than 55% of NHEC homes and 30% of PSNH homes did not use mechanical cooling.
Details of Residential Equipment Saturations
Figure 12 shows the distribution of cooling system types in New Hampshire based on results of the E
SOURCE Residential Energy End‐Use Study (July 2011). The data show that in 2010, 66% of New
Hampshire homes used mechanical cooling equipment, 17% used ceiling or room fans, and 16% had no
cooling system.

NH Monitoring and Evaluation Team, NH HVAC Research 16
Figure 12. Cooling Equipment Distribution in Residential Sector, 2010
Source: E SOURCE. “Residential Energy End‐Use Study.” July 2011.
These cooling equipment distributions are comparable to the distributions shown in NHEC and PSNH
customer survey data, and are slightly more similar to the PSNH customer base.
The following figures show the distribution of cooling equipment by the type, age, size, and income of
each home (based on New Hampshire residents’ responses to the E SOURCE study).
Figure 13 shows the distribution of cooling equipment by home type. Single‐family homes have a
mixture of equipment types, but window or wall‐mounted air conditioning units are increasingly
dominant in multifamily buildings, mobile homes, and trailers. The percentage of homes with no cooling
systems is balanced across single and multifamily residences.
Figure 13. Residential Cooling Equipment by Type of Home, 2010
Source: E SOURCE. “Residential Energy End‐Use Study.” July 2011.

NH Monitoring and Evaluation Team, NH HVAC Research 17
Figure 14 shows the distribution of cooling system type by home age. The data show increasing
saturation of CAC systems in newer homes and decreasing saturations of window/wall units and ceiling
fans. For the 23 surveyed homes built after 2000, 61% had a CAC system, 24% used window/wall units,
and only 5% reported having no cooling system.
Figure 14. Residential Cooling Equipment by Age of Home, 2010
Source: E SOURCE. “Residential Energy End‐Use Study.” July 2011.
Figure 15 shows the distribution of cooling system type by home size. The data suggest that smaller
homes are more likely to use a RAC unit, but the distribution of cooling system types varies among large
homes.
Figure 15. Residential Cooling Equipment by Size of Home, 2010
Source: E SOURCE. “Residential Energy End‐Use Study.” July 2011.

NH Monitoring and Evaluation Team, NH HVAC Research 18
Figure 16 shows the distribution of cooling system type by the household income. The data show that
the percentage of homes with a RAC unit is highest among all income levels, but that higher income
households are more likely to have a CAC system. Although the percentage of homes with RAC
equipment in the lowest income level is comparable to other income levels, the lowest income
households are also more likely to not use a cooling system compared to the other income levels.
Figure 16. Residential Cooling Equipment by Income, 2010
Source: E SOURCE. “Residential Energy End‐Use Study.” July 2011.
Figure 17 shows the percentage of RAC‐cooled homes within each home size category, broken out by
the total number of RACs. As expected, the data show that the smaller homes are more likely to have
only one RAC unit, and the largest households typically have multiple units.

NH Monitoring and Evaluation Team, NH HVAC Research 19
Figure 17. Number of Room Air Conditioning Units by Homes Size, 2010
Source: E SOURCE. “Residential Energy End‐Use Study.” July 2011.
Across all home size categories, the E SOURCE survey data show that 36% of RAC‐cooled homes have
only one unit, 28% have two units, 22% of homes have three units, 12% have four units, and only 2% of
homes have five or more RAC units. Based on these data, Cadmus calculated that the average RAC‐
cooled home in New Hampshire in 2010 has 2.2 RAC units.
Figure 18 shows the historical number of RAC units in NHEC homes that use RAC, based on NHEC
customer surveys. The data show that the percentage of RAC‐cooled homes with only one RAC unit is
shrinking, and the percentage of homes with multiple units is increasing. Based on the NHEC survey
data, Cadmus calculated that the average RAC‐cooled home in the NHEC territory had 1.9 RAC units in
2008 and 2.9 RAC units in 2012.
Figure 18. Number of RAC Units by Year, NHEC
Source: NHEC Customer Survey Data

NH Monitoring and Evaluation Team, NH HVAC Research 20
Commercial and Industrial Cooling Equipment
Typical mechanical cooling equipment in the C&I sector includes window air conditioners and packaged
rooftop unit (RTUs) for small commercial buildings and central chiller plants, which distribute chilled
water to air handlers for cooling in large commercial buildings. Industrial facilities typically use chillers
for process cooling applications and smaller equipment— including window air conditioners, RTUs, and
heat pumps for space conditioning.
Survey data collected by GDS Associates in 2008 show that almost one quarter of small commercial
facilities do not use any air‐conditioning equipment and less than half cool the entire building. Figure 19
shows unweighted percentages of space cooling for small commercial buildings indicated by 196 survey
respondents.
Figure 19. Space Cooling for Small C&I Buildings (based on 200 phone surveys)
Source: GDS Associates. “Additional Opportunities for Energy Efficiency in New Hampshire.” 2009.
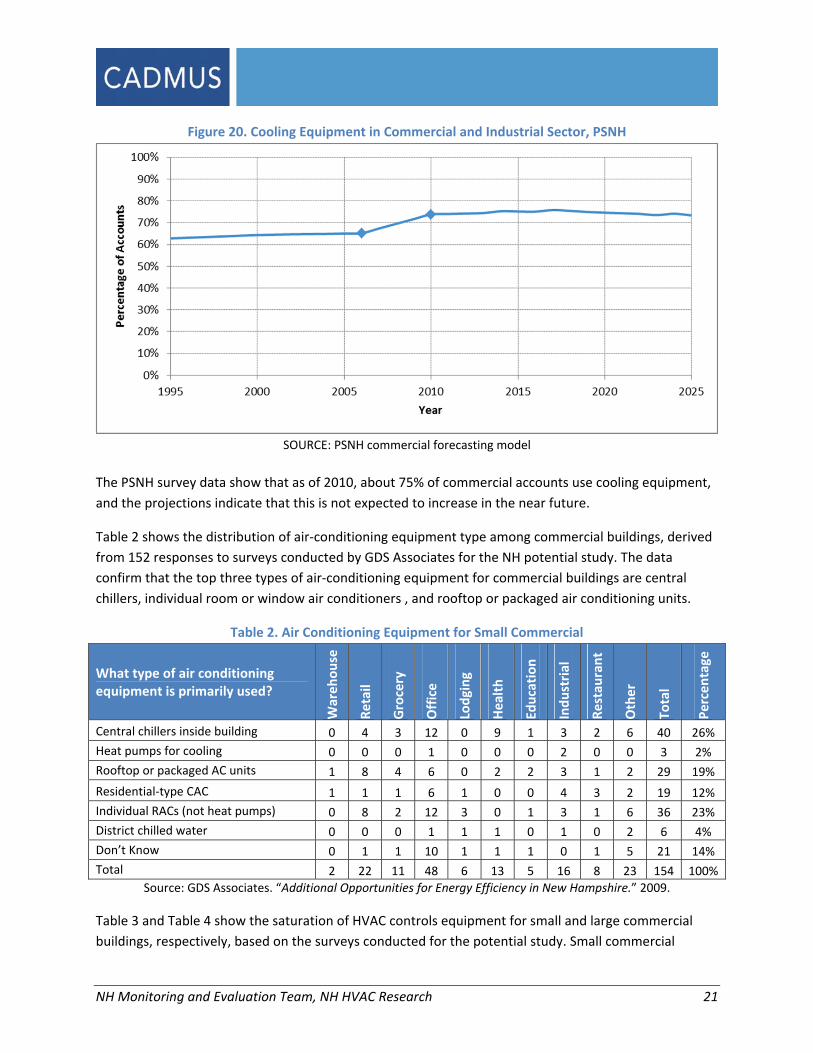
The survey data in Figure 19 is consistent with customer surveys collected by PSNH. Figure 20 shows the
projected percentage of PSNH commercial accounts with cooling equipment, based on PSNH
commercial load forecasting model which uses customer surveys conducted in 2006 and 2010 and
projections for New England developed by the Energy Information Administration (EIA).
NH Monitoring and Evaluation Team, NH HVAC Research 21
Figure 20. Cooling Equipment in Commercial and Industrial Sector, PSNH
SOURCE: PSNH commercial forecasting model
The PSNH survey data show that as of 2010, about 75% of commercial accounts use cooling equipment,
and the projections indicate that this is not expected to increase in the near future.
Table 2 shows the distribution of air‐conditioning equipment type among commercial buildings, derived
from 152 responses to surveys conducted by GDS Associates for the NH potential study. The data
confirm that the top three types of air‐conditioning equipment for commercial buildings are central
chillers, individual room or window air conditioners , and rooftop or packaged air conditioning units.
Table 2. Air Conditioning Equipment for Small Commercial
What type of air conditioning equipment is primarily used?
Warehouse
Retail
Grocery
Office
Lodging
Health
Education
Industrial
Restau
rant
Other
Total
Percentage
Central chillers inside building 0 4 3 12 0 9 1 3 2 6 40 26%
Heat pumps for cooling 0 0 0 1 0 0 0 2 0 0 3 2%
Rooftop or packaged AC units 1 8 4 6 0 2 2 3 1 2 29 19%
Residential‐type CAC 1 1 1 6 1 0 0 4 3 2 19 12%
Individual RACs (not heat pumps) 0 8 2 12 3 0 1 3 1 6 36 23%
District chilled water 0 0 0 1 1 1 0 1 0 2 6 4%
Don’t Know 0 1 1 10 1 1 1 0 1 5 21 14%
Total 2 22 11 48 6 13 5 16 8 23 154 100%
Source: GDS Associates. “Additional Opportunities for Energy Efficiency in New Hampshire.” 2009.
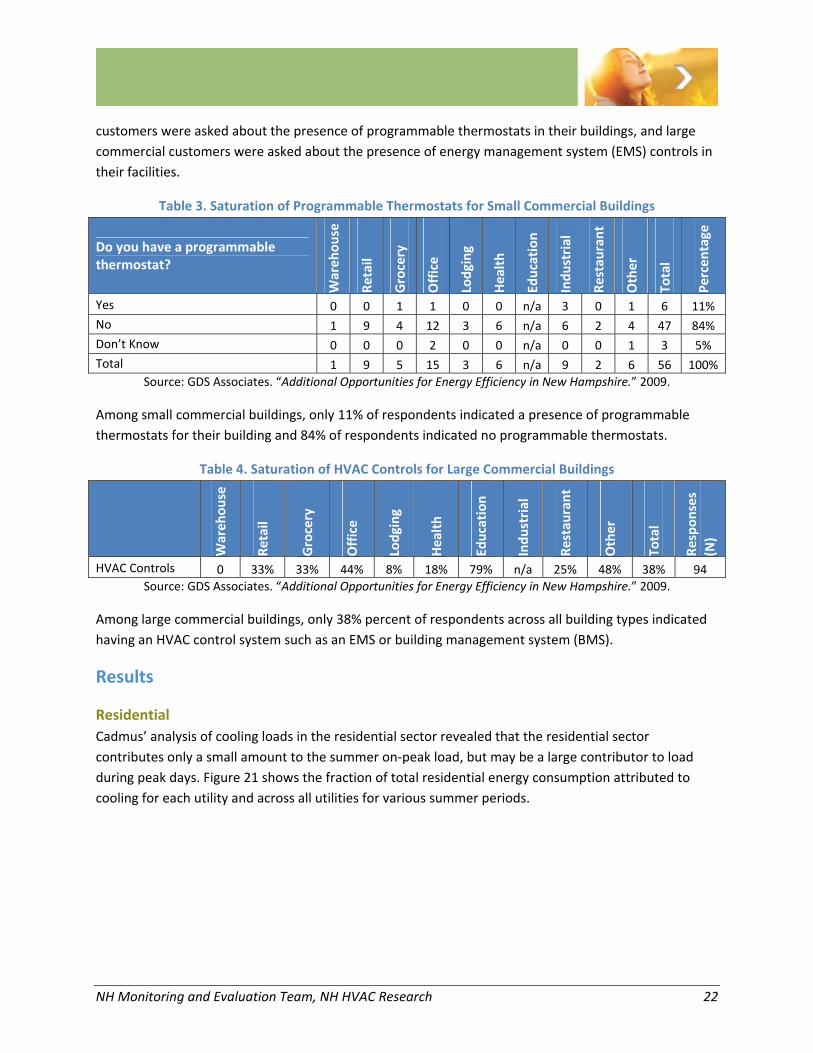
Table 3 and Table 4 show the saturation of HVAC controls equipment for small and large commercial
buildings, respectively, based on the surveys conducted for the potential study. Small commercial
NH Monitoring and Evaluation Team, NH HVAC Research 22
customers were asked about the presence of programmable thermostats in their buildings, and large
commercial customers were asked about the presence of energy management system (EMS) controls in
their facilities.
Table 3. Saturation of Programmable Thermostats for Small Commercial Buildings
Do you have a programmable thermostat?
Warehouse
Retail
Grocery
Office
Lodging
Health
Education
Industrial
Restau
rant
Other
Total
Percentage
Yes 0 0 1 1 0 0 n/a 3 0 1 6 11%
No 1 9 4 12 3 6 n/a 6 2 4 47 84%
Don’t Know 0 0 0 2 0 0 n/a 0 0 1 3 5%
Total 1 9 5 15 3 6 n/a 9 2 6 56 100%
Source: GDS Associates. “Additional Opportunities for Energy Efficiency in New Hampshire.” 2009.
Among small commercial buildings, only 11% of respondents indicated a presence of programmable
thermostats for their building and 84% of respondents indicated no programmable thermostats.
Table 4. Saturation of HVAC Controls for Large Commercial Buildings
Warehouse
Retail
Grocery
Office
Lodging
Health
Education
Industrial
Restau
rant
Other
Total
Responses
(N)
HVAC Controls 0 33% 33% 44% 8% 18% 79% n/a 25% 48% 38% 94
Source: GDS Associates. “Additional Opportunities for Energy Efficiency in New Hampshire.” 2009.
Among large commercial buildings, only 38% percent of respondents across all building types indicated
having an HVAC control system such as an EMS or building management system (BMS).
Results
Residential
Cadmus’ analysis of cooling loads in the residential sector revealed that the residential sector
contributes only a small amount to the summer on‐peak load, but may be a large contributor to load
during peak days. Figure 21 shows the fraction of total residential energy consumption attributed to
cooling for each utility and across all utilities for various summer periods.

NH Monitoring and Evaluation Team, NH HVAC Research 23
Figure 21. Residential Cooling Consumption by Utility for Summer Periods, 2012
Source: Cadmus weather‐based load analysis using hourly model regression and utility load data
Cadmus’ analysis of the system and sector electrical load and customer survey data revealed the
following for the residential sector:
Residential sector electric demand during summer weekdays peaks after the ISO forward
capacity market (FCM) summer on‐peak period. The highest loads in the residential sector occur
between 6:00 p.m. and 10:00 p.m. (hours 19‐22). This peak late in the day is driven by non‐
weather related loads, including lighting and appliances.10
During the ISO‐NE summer on‐peak hours, the weather related (cooling) component of the
summer residential load is 21% of the total summer residential load.
The percentage of homes with mechanical cooling is increasing.11 In 2000, only 30% of NHEC
homes and less than 60% of PSNH homes used RAC or CAC cooling. Only eight years later, in
2008, more than 45% of NHEC homes and 70% of PSNH homes had either RAC or CAC systems.
Within New Hampshire homes that use RAC units for cooling, the number of RAC units per
home is increasing. Survey data from NHEC showed increasing quantities of RAC units in homes
cooled by RACs.
10 Figure 8 shows an increase in the residential sector total load during the evening hours causing the residential
sector peak during hours 19‐21. Since the cooling load is shown to remain constant through this time, this
evening spike in electric demand is driven by non‐cooling loads. 11 Although the statewide trends have shown growth in the saturation of RAC equipment through 2008, PSNH saw
very little growth between 2004 and 2008 and projects an overall decrease in the percentage of homes in the
future.
NH Monitoring and Evaluation Team, NH HVAC Research 24
Commercial and Industrial
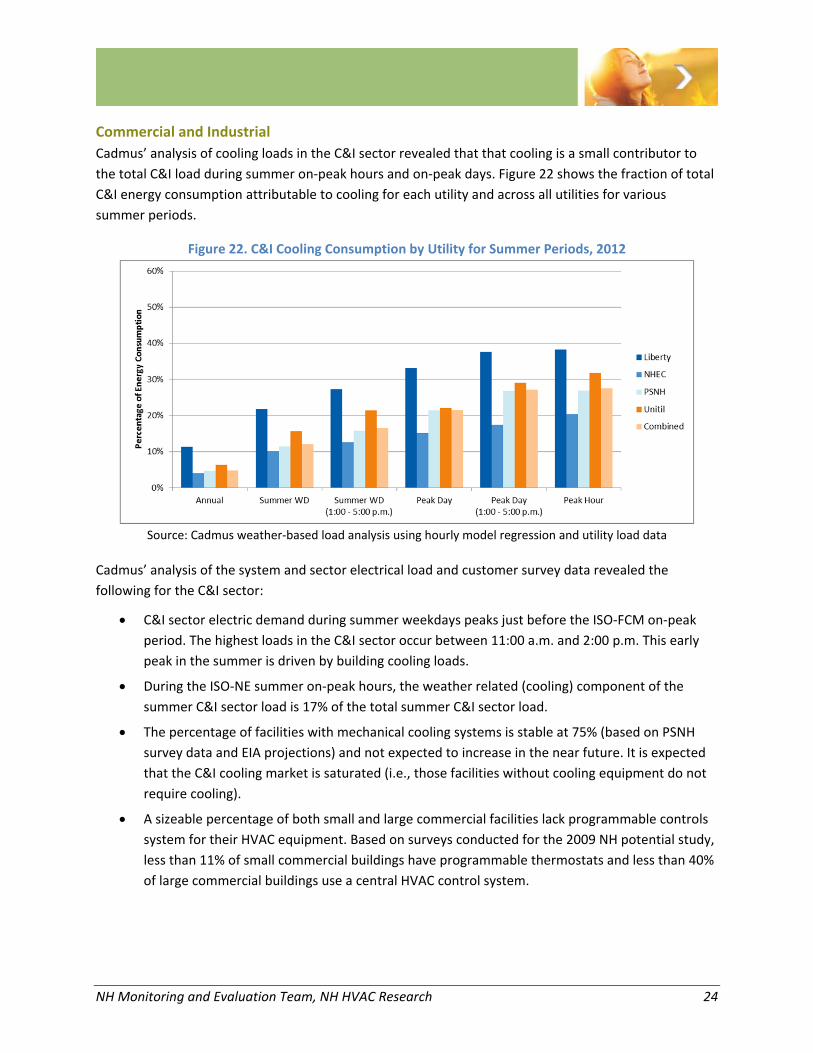
Cadmus’ analysis of cooling loads in the C&I sector revealed that that cooling is a small contributor to
the total C&I load during summer on‐peak hours and on‐peak days. Figure 22 shows the fraction of total
C&I energy consumption attributable to cooling for each utility and across all utilities for various
summer periods.
Figure 22. C&I Cooling Consumption by Utility for Summer Periods, 2012
Source: Cadmus weather‐based load analysis using hourly model regression and utility load data
Cadmus’ analysis of the system and sector electrical load and customer survey data revealed the
following for the C&I sector:
C&I sector electric demand during summer weekdays peaks just before the ISO‐FCM on‐peak
period. The highest loads in the C&I sector occur between 11:00 a.m. and 2:00 p.m. This early
peak in the summer is driven by building cooling loads.
During the ISO‐NE summer on‐peak hours, the weather related (cooling) component of the
summer C&I sector load is 17% of the total summer C&I sector load.
The percentage of facilities with mechanical cooling systems is stable at 75% (based on PSNH
survey data and EIA projections) and not expected to increase in the near future. It is expected
that the C&I cooling market is saturated (i.e., those facilities without cooling equipment do not
require cooling).
A sizeable percentage of both small and large commercial facilities lack programmable controls
system for their HVAC equipment. Based on surveys conducted for the 2009 NH potential study,
less than 11% of small commercial buildings have programmable thermostats and less than 40%
of large commercial buildings use a central HVAC control system.
NH Monitoring and Evaluation Team, NH HVAC Research 25
TASK 2. RECOMMENDED PROGRAM ENHANCEMENTS
This section describes the objective, methods, and key results developed under Task 2. This included
reviewing the results from Task 1, identifying opportunities to reduce energy consumption cooling load
during peak periods, and recommendations for the New Hampshire programs to reduce cooling energy
and demand.
Objective This second task involved reviewing the current portfolio of New Hampshire core energy‐efficiency
programs for residential and C&I customer sectors, as well as developing recommendations to enhance
the programs’ electric energy and peak demand impacts through the inclusion of new measures or new
program elements that will cost‐effectively reduce electric air conditioning load.
The key result of this task is:
Detailed recommendations to modify or expand the portfolio of existing core programs for
residential and C&I customer sectors to promote the installation of cost‐effective measures to
reduce air conditioning peak demand and energy consumption.
Method Cadmus used the findings from Task 1 and conducted a detailed review of the findings from the 2009
potential study to assess the opportunity to reduce both cooling load and overall energy and peak
demand consumption for both the residential and C&I sectors. Using these findings along with our own
experience with energy‐efficiency technologies, we developed a set of recommendations for the New
Hampshire programs to improve the reduction of electric energy consumption and summer peak load.
Efficiency Potential in New Hampshire
In 2008, the New Hampshire Public Utilities Commission commissioned an energy efficiency potential
study to assess the additional opportunities for energy efficiency in New Hampshire. The study,
completed in 2009, found that there is significant savings potential in New Hampshire through cost‐
effective electric, natural gas, and fuel‐neutral efficiency measures and estimated that energy‐efficiency
measures could cost‐effectively reduce the projected 2018 total electric energy consumption by more
than 20% and reduce the projected 2018 electric peak demand by over 15%. The study estimated
potentially obtainable total electric energy and demand reductions of 10.8% and 8.5%, respectively, of
projected 2018 total electric sales.
The study estimated the potential energy and summer peak demand savings by sector. Table 5 shows
the estimates of potentially obtainable electric energy and demand savings for each sector and the
percentage of total savings attributed to each sector.

NH Monitoring and Evaluation Team, NH HVAC Research 26
Table 5. Energy Savings Potential by Sector
Sector Potential Electric Energy Savings
(GWh)
% of Total Potential Energy
Savings
Potential Summer Peak Demand Savings (MW)
% of Total Potential Summer Demand Savings
Residential 698 50% 26.3 10%
Commercial (Existing Buildings) 454 32% 132.3 52%
Commercial (New Construction) 38 3% 13.9 5%
Industrial 214 15% 81.9 32%
All Sectors 1,404 100% 254 100%
Source: GDS Associates. “Additional Opportunities for Energy Efficiency in New Hampshire.” 2009.
The data show that the majority of electric energy savings are in the residential sector (50%) and within
the commercial existing buildings market (32%). The majority of summer peak demand savings are in
commercial existing buildings and industrial facilities. The data suggest that, to reduce total energy
consumption, the energy‐efficiency program should focus on opportunities in the residential and
existing commercial buildings. However, to reduce peak load during the summer on‐peak period, energy
efficiency programs should focus on opportunities in the existing commercial and industrial facilities.
Results
Residential
Cadmus’ research under Task 1 revealed the following for the residential sector:
Residential sector electric demand during summer weekdays peaks after the ISO‐FCM on‐peak
period. The highest loads in the residential sector occur between 6:00 p.m. and 10:00 p.m. This
late‐in‐the‐day peak is driven by non‐weather‐related loads, including lighting and appliances.
During the ISO‐NE summer on‐peak hours, the weather‐related (cooling) component of the
summer residential load is 21% of the total residential load.
The percentage of homes in New Hampshire with mechanical cooling unit is increasing.12 In
2000, only 30% of NHEC homes and less than 60% of PSNH homes used RAC or CAC cooling.
Only eight years later, in 2008, more than 45% of NHEC homes and 70% of PSNH homes had
either a RAC or CAC system.
Within New Hampshire homes that use a RAC unit for cooling, the number of RAC units per
home is increasing. Survey data from NHEC shows increasing quantities of RAC units in homes
cooled by RACs.
12 Although the statewide trends have shown growth in the saturation of RAC equipment through 2008, PSNH saw
very little growth between 2004 and 2008 and projects an overall decrease in the percentage of homes in the
future.
NH Monitoring and Evaluation Team, NH HVAC Research 27
The New Hampshire Public Utilities Commission initiated an energy‐efficiency potential study in 2008
(completed in 2009). The study found that there is significant savings potential in New Hampshire
through cost‐effective electric and natural gas efficiency measures. For the residential sector, the study
showed a potential cost‐effective reduction in electric consumption of more than 20% of projected 2018
total residential electric consumption. The study estimated that energy efficiency could cost‐effectively
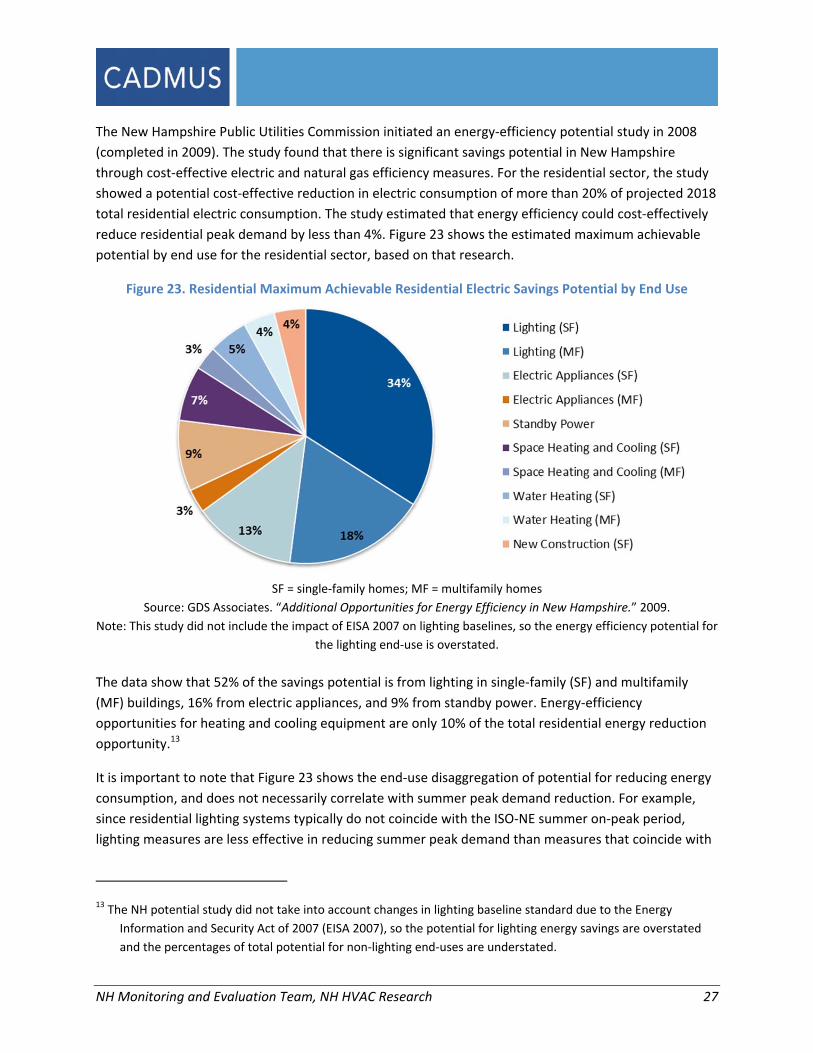
reduce residential peak demand by less than 4%. Figure 23 shows the estimated maximum achievable
potential by end use for the residential sector, based on that research.
Figure 23. Residential Maximum Achievable Residential Electric Savings Potential by End Use
SF = single‐family homes; MF = multifamily homes
Source: GDS Associates. “Additional Opportunities for Energy Efficiency in New Hampshire.” 2009.
Note: This study did not include the impact of EISA 2007 on lighting baselines, so the energy efficiency potential for
the lighting end‐use is overstated.
The data show that 52% of the savings potential is from lighting in single‐family (SF) and multifamily
(MF) buildings, 16% from electric appliances, and 9% from standby power. Energy‐efficiency
opportunities for heating and cooling equipment are only 10% of the total residential energy reduction
opportunity.13
It is important to note that Figure 23 shows the end‐use disaggregation of potential for reducing energy
consumption, and does not necessarily correlate with summer peak demand reduction. For example,
since residential lighting systems typically do not coincide with the ISO‐NE summer on‐peak period,
lighting measures are less effective in reducing summer peak demand than measures that coincide with
13 The NH potential study did not take into account changes in lighting baseline standard due to the Energy
Information and Security Act of 2007 (EISA 2007), so the potential for lighting energy savings are overstated
and the percentages of total potential for non‐lighting end‐uses are understated.

NH Monitoring and Evaluation Team, NH HVAC Research 28
the summer on‐peak period.14 Thus, although space cooling measures are only 10% of the energy‐
efficiency potential, they are likely a higher percentage of the demand reduction potential.
New Hampshire Residential Energy Efficiency Programs
Cadmus reviewed the companies’ 2013‐2014 CORE New Hampshire Energy Efficiency Programs and the
NHSaves.com Website to understand the existing program offerings for residential customers. Table 6
describes the energy‐efficiency programs offered to New Hampshire residential customers in 2013‐
2014.
Table 6. New Hampshire Residential Efficiency Programs, Electric
Program Utilities End‐Use Description
ENERGY STAR® Homes Program CORE Multiple Promotes energy efficient design and construction in residential new construction market.
Home Performance with ENERGY STAR® Program (HPwES)
CORE Multiple Improves efficiency within existing single‐family and multifamily homes through weatherization, appliance, and lighting upgrades.
ENERGY STAR® Lighting Program CORE Lighting Promotes saturation of energy efficient lighting through upstream and downstream actions.
ENERGY STAR® Appliance Program CORE Appliances Promotes saturation of energy efficient appliances through marketing and mail‐in rebates.
High Efficiency Heat Pump Program
NHEC HVAC Promotes the installation of high‐efficiency air source and geothermal heat pump equipment for residential new construction
ENERGY STAR® Homes Program Enhancement: Geothermal and ASHP Option
PSNH HVAC Promotes the installation of high‐efficiency air source and geothermal heat pump equipment for residential new construction
Residential Customer Engagement Pilot Program
PSNH Multiple Promotes energy efficiency behavior changes through energy savings reports and interactive website with energy savings tips.
Source: 2013‐2014 CORE New Hampshire Energy Efficiency Programs, 2012.
The existing programs include incentives to address most areas of top electric energy‐efficiency
potential in the residential sector (lighting, electric appliances, and space heating and cooling), but may
benefit from targeted strategies to reduce energy consumption for other key segments (multifamily
lighting and standby power).
Although the energy‐efficiency potential study showed lower opportunity for summer peak demand
compared to the C&I sector, the programs may reduce summer peak demand in the residential sector
through continued efforts to reduce cooling energy through home envelope improvements and cooling
14 The New Hampshire CORE Residential ENERGY STAR® Lighting Program evaluation found a summer on‐peak
coincidence factor of 7.2% for residential for CFLs and 8.1% for residential interior fixtures.

NH Monitoring and Evaluation Team, NH HVAC Research 29
equipment upgrades and expanded efforts to address residential loads that are coincident with the
summer on‐peak period.
The following sections provide recommendations to reduce electric energy and peak demand
consumption in the residential sector through both cooling and non‐cooling measures.
Recommended Residential Cooling Measures
Cadmus recommends the following actions to reduce energy consumption and peak demand from
residential cooling equipment:
Encourage the installation of ductless heat pump air‐conditioners in place of central or window
air‐conditioners.
Ensure the programs capture opportunities to install the highest efficiency equipment for
residential new construction and planned equipment replacement opportunities.
Encourage the early replacement of existing inefficient air‐conditioners.
Encourage the installation of web‐enabled programmable thermostats with central controls for
demand response actions during summer peak periods.
Planned Actions for Residential Cooling Systems
The E SOURCE survey asked New Hampshire homeowners whether they planned to add or replace
cooling equipment within the next 12 months. Figure 24 shows that only 8% of the homeowners
responded affirmatively. While this may seem low, this is consistent with a typical 15‐year equipment
replacement cycle.
Figure 24. Residential Sector Plans to Add or Change Air Conditioning Equipment
Source: E SOURCE. “Residential Energy End‐Use Study.” July 2011.
Early Replacement of Air Conditioners
Since only a small fraction of NH residential households plan to replace their air‐conditioning
equipment, we recommend implementing an early replacement program to influence the remaining

NH Monitoring and Evaluation Team, NH HVAC Research 30
customers to replace their inefficient equipment sooner than they would have in absence of the
program.
The baseline for replacing an air conditioner when it fails is the federal minimum of SEER 13. Installing a
new SEER 14 unit, for example, saves approximately 7% over this baseline. The savings are small
because the federal minimum increased from SEER 10 to SEER 13 in January 2006. However, the base of
installed air conditioners is much less efficient for three reasons:
1) The weighted average of air conditions sold before January 2006 is SEER 10 or less (some units
have lower than the federal standard SEER for the next two reasons);
2) Problems with initial installation, such as improper refrigerant charge and airflow, frequently
cause units to operate less efficiently than their rated values, and
3) Equipment degradation over time can further reduce efficiency, including fouling of evaporator
and condensing coils and refrigeration leaks.
Figure 25 and Figure 26 show the responses indicating whether residents’ planned to add or replace
cooling equipment, by the amount of time they have lived in their residence and by the year the home
was built, respectively. The figures show low percentages for all amounts of time and build dates. The
findings were similar when compared for the home’s air conditioning equipment type, age of home, and
household income. The data show that for the utilities to increase the efficiency of the stock of air
conditioners, they need to reach the 8% of households in the market for new air‐conditioning
equipment, annually.
Figure 25. Plan to Add or Change Air Conditioning Equipment by Time in Residence
Source: E SOURCE. “Residential Energy End‐Use Study.” July 2011.

NH Monitoring and Evaluation Team, NH HVAC Research 31
Figure 26. Plan to Add or Change Air Conditioning Equipment by Year Home was Built
Source: E SOURCE. “Residential Energy End‐Use Study.” July 2011.
Cadmus studied a tune‐up program in Missouri and found that field efficiencies of poor but still
operating units was in the range of SEER 8. Numerous programs across the country were designed to
incentivize owners of older units to retire them prior to failure, which saves 30% or more of the unit
energy use. Some programs recognize that owners will repair older, inefficient units to avoid the
expense of a new unit; these programs offer higher incentives to encourage homeowners to replace
rather than repair older units.
Ductless Mini‐Splits
Ductless mini‐spits are heat pumps and air conditioners that operate similarly to conventional split air
conditioners and heat pumps, except that the evaporator coil is housed in a wall‐mounted blower and
there is no duct work. Where more cooling is needed, the mini‐split only uses refrigerant lines to
transport cooling, not ducts. Mini‐splits work well as retrofit units and in hard‐to‐reach areas and they
offer several advantages over conventional systems: (1) efficiency ratings exceed SEER 20, (2) they
eliminate ducts and therefore duct losses, and (3) some models also provide heating and have the
added benefit of offsetting electric or fossil fuel heating energy consumption.
The NH CORE Energy Efficiency Programs ENEGRY STAR® Appliance Program incents customers who are
installing Room ACs, Central ACs or Air Source Heat Pumps and Mini Split systems to purchase and install
the most efficient ENERGY STAR models.
Cadmus recommends that New Hampshire continue its air conditioner and heat pump programs;
however, the programs should remain vigilant to avoid adding cooling load for spaces that wouldn’t
otherwise be cooled. This typically requires verification that in the absence of the programs, the same
space would have been cooled with less efficient equipment. To maximize savings from ductless mini‐

NH Monitoring and Evaluation Team, NH HVAC Research 32
split installations, we recommend that the target homes with existing electric resistance (ER) heating
systems or installed where electric baseboard is present.
Web‐Enabled Learning Thermostats, Centrally Controlled at Peak
Programmable thermostats are designed to reduce energy consumption by raising cooling set points
and decreasing heating set points during user‐chosen periods, typically when occupants are away from
the building or sleeping, or when the thermostat detects no home occupancy. Energy savings accrue
when the building temperature is allowed to float upwards in summer and downwards in winter, which
reduces the cooling or heating energy consumption.
Cooling savings occur when: (1) the building thermostat setting is higher than normal, and (2) the
cooling system stays off for a relatively long period of time. No savings occur during mild temperatures
or when the HVAC system is off for only short periods. For example, during mild temperatures, the air
conditioner might only operate for 10 minutes per hour. An increase in the set point by a few degrees
for two hours would deliver very little savings. When the occupant re‐sets the temperature to the
comfort zone, the HVAC system operates longer to bring the home back down to the desired
temperature.
Cadmus has conducted numerous thermostat studies in states including Illinois, Maryland, Missouri, and
is currently conducting a pilot study for Liberty Utilities’ natural gas customers in New Hampshire. In a
recent analysis of metering data, Cadmus determined three main types of thermostat operation:
1. Regular set points: Residents set their thermostat to change temperature on a regularly
scheduled basis. This group consisted of 43% of the 91 metering participants.
2. Manual but changing set points: Residents set their thermostat inconsistently by manually
controlling the system either on their manual thermostat or directly by disconnecting their air
conditioning from the thermostat, throughout the summer. This group consisted of 22% of the
91 metering participants.
3. Constant set point: Residents used thermostat settings nearly constant throughout the cooling
season. This group consists of 35% of the 91 metering participants.
The energy used for these three types of thermostat operation varied, but was more a function of the
occupied cooling set point than their set back behavior. While there were limitations to cooling savings
from programmable thermostats, there are possible additional gains from learning thermostats. Also,
web‐enable thermostats offer the ability to control demand manually via phone applications and
without the need for complex load switches or radio signal strategies.
The PSNH Website currently advertises the Heat Smart Load Control Program for heat pumps and
electric hot water heaters. Cadmus recommends initiating a pilot program for the cooling season that
combines the benefits of learning thermostats with the ability to control them centrally to reduce peak
load. With user permission, the units can easily be controlled using Web protocols. PSNH can employ
various strategies, from changing set points for short intervals to raising set points: this will depend on

NH Monitoring and Evaluation Team, NH HVAC Research 33
program design, outdoor temperatures, and the temperature of the house when each peak event
occurs.
Recommended Residential Non‐Cooling Measures
Cadmus’ load research and the NHPUC’s potential study show that cooling consumption and potential
savings are a small component of overall use. Therefore, we broadened our view of potential savings
measures to include both cooling and non‐cooling measures.
Cadmus also identified a number of energy‐efficiency measures that are not cooling related but will
serve to reduce electric energy consumption and peak load. These include:
Heat pump water heaters
Showerheads and aerators
ENERGY STAR® Dehumidifiers
Clothes washers (education)
Advanced power strips
Computer power management (as a pilot)
Heat Pump Water Heaters
A HPWH reduces the electric water heating consumption (when replacing a standard electric water
heater) through improved water heating efficiency, but does not impact the home’s consumption of hot
water. Since the consumption of hot water is unchanged, the runtime of any hot water circulating
pumps is also unchanged.
HPWHs installed in a conditioned space may impact the heating and cooling loads in that space,
impacting the home’s heating and/or cooling systems. HPWHs reduce space cooling load, resulting in
saving for electric cooling equipment. HPWHs increase heating load, resulting in increased heating fuel
consumption and heating equipment runtime.
A Cadmus study of HPWH installations found that the average savings from noon to 8:00 p.m. (hours 13‐
20) was just over 200 watts per unit. 15 With a differential cost (at failure) of $500, the payback for these
units is relatively short, and an incentive may increase the number of installations. Because most water
heaters are replaced on failure under short notice, we recommend working through trade allies and
distributors to have plumbers, plumbing supply houses, and other contractors stock these units.
LED/ CFL Lighting
We understand that the utilities currently already offer rebates for efficient bulbs, including a coupon to
obtain an LED bulb for $10. Newer technology lighting products, like LEDs, are also offered via the online
15 Cadmus. “United Illuminating Heat Pump Water Heater Pilot: Impact and Customer Acceptance Study.” June
2010.

NH Monitoring and Evaluation Team, NH HVAC Research 34
and hard copy lighting catalogs. Recognizing that the EISA law reduces the wattage of existing
incandescent lights, upgrading from the new incandescent or halogen bulbs to ENEGRY STAR CFLs or LED
will still encourage customer to purchase these more efficient bulbs.
Showerheads and Aerators
Efficient showerhead and aerators can reduce hot water use and associated electricity consumption for
homes with electric hot water heaters. Since a typical hot water heater can consume 4.5 kW during
recovery, water savings measures can deliver large peak savings even with a low coincidence factor.
Based on a direct metering study of end‐uses in 150 homes, Cadmus found that the average household
HW consumption was lower than assumed in most technical reference manuals (TRMs) causing TRM
savings to be over‐stated. However, potential savings are still high enough to warrant consideration to
promote this measure. Cadmus found annual energy savings of roughly savings 337 kWh per
showerhead. 16
We recommend marketing low‐flow showerheads and aerators to homes with electric water heating
systems to reduce annual energy consumption and demand during both summer and winter on‐peak
periods.
Dehumidifiers
An estimated 19% of US homes have a dehumidifier, equipment that can account for a substantial
portion of residential energy use. The annual electricity consumption of a dehumidifier can be 1,000
kWh or more, which is twice the consumption of an ENERGY STAR refrigerator.
Figure 27 shows the daily electricity use versus water removal from a 2012 Cadmus study.17 Average use
was between 3 and 6 kWh per day, and one malfunctioning unit used 14 kWh per day without the
owner noticing.
16 Cadmus metering study of hot water uses, Detriot Edison and Consumers Energy, 2013. 17 Korn, David and L. Mattison (The Cadmus Group, Inc.). “Dehumidifiers: A Major Consumer of Electricity.”
Paper presented at the American Council for an Energy Efficient Economy Summer Study on Energy Efficiency
in Buildings, Pacific Grove, California, August 12 – 17, 2012.
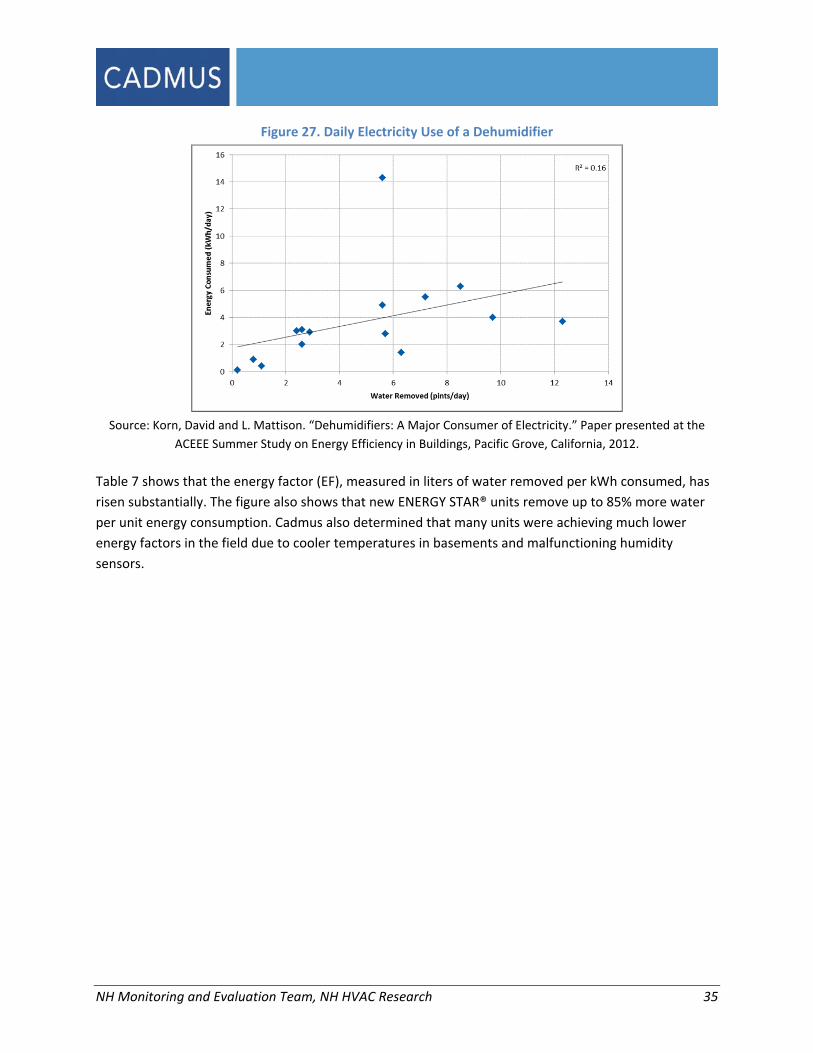
NH Monitoring and Evaluation Team, NH HVAC Research 35
Figure 27. Daily Electricity Use of a Dehumidifier
Source: Korn, David and L. Mattison. “Dehumidifiers: A Major Consumer of Electricity.” Paper presented at the
ACEEE Summer Study on Energy Efficiency in Buildings, Pacific Grove, California, 2012.
Table 7 shows that the energy factor (EF), measured in liters of water removed per kWh consumed, has
risen substantially. The figure also shows that new ENERGY STAR® units remove up to 85% more water
per unit energy consumption. Cadmus also determined that many units were achieving much lower
energy factors in the field due to cooler temperatures in basements and malfunctioning humidity
sensors.

NH Monitoring and Evaluation Team, NH HVAC Research 36
Table 7. Efficiency Standards for Dehumidifiers, Energy Factor (liters/kWh)
Current Effective October 2012
Federal Standard ENERGY STAR V 2.1 Federal Standard ENERGY STAR V 3.0
≤ 25 pints/day 1.0 ≤ 25 pints/day 1.2≤ 35 pints/day 1.35
< 75 pints/day 1.85
> 25 to ≤ 35 1.2 > 25 to ≤ 35 1.4
> 35 to ≤ 54 1.3 > 35 to ≤ 45 1.5 > 35 to ≤ 45 1.5
> 45 to ≤ 54 1.6 > 45 to ≤ 54 1.6
> 54 to < 75 1.5 > 54 to < 75 1.8 > 54 to < 75 1.7
≥ 75 2.25 ≥ 75 2.5 ≥ 75 2.5 ≥ 75 to ≤ 185 2.8
Source: NARA 201018 and EPA 2011b19
Cadmus recommends that dehumidifiers be included in all energy audits, and that the unit power is spot
measured as is done with some refrigerator programs. Inefficient or malfunctioning units could be
covered by a relatively large rebate that would incent the homeowner to purchase of a new ENERGY
STAR dehumidifier. This rebate should include a brochure that educates the homeowner on
dehumidifier set points.
Clothes Washers
Clothes washers are rated according to their modified energy factor (MEF). MEF is the quotient of the
capacity of the washer divided by the total amount of energy it consumes per cycle. MEF is expressed in
cubic feet per kilowatt hour per cycle (ft3/kWh/cycle). The higher the MEF value, the more efficient the
clothes washer is. The water factor (WF), expressed in gallons per cubic foot per cycle (gallons/ft3/cycle),
is the quotient of total weighted per‐cycle water consumption divided by the capacity of the clothes
washer. A lower WF means less water, and therefore less water heating energy, is consumed per cycle.
MEF and WF are used to determine the federal standard for minimum allowable clothes washer
efficiency, as well as being used by ENERGY STAR and by the Consortium for Energy Efficiency (a
membership group of utilities) to set the voluntary energy‐efficiency standards. In recent years, the
efficiency ratings of available washers have increased substantially. The minimum MEF for ENERGY STAR
qualification was raised three times between 2006 and 2011, going from 1.42 ft3/kWh/cycle to 2
ft3/kWh/cycle.20
18 [NARA] National Archives and Records Administration. 2010. Department of Energy, 10 CFR 430, Energy
Conservation Program for Consumer Products: Test Procedures for Residential Dishwashers, Dehumidifiers, and Conventional Cooking Products (Standby Mode and Off Mode); Proposed Rule. http://www1.eere.energy.gov/buildings/appliance_standards/residential/pdfs/dw_dehum_ccp_tp_nopr.pdf
19 [EPA] U.S. Environmental Protection Agency. 2011. ENERGY STAR Dehumidifier specification V3.0.
http://www.energystar.gov/ia/partners/prod_development/revisions/downloads/dehumid/ES_Dehumidifiers
_Final_V3.0_Eligibility_Criteria.pdf 20 Korn, David and L. Mattison. “Do Savings Come Out In The Wash? A Large‐Scale Study of Residential Laundry
Systems.” Home Energy (January/February 2012).
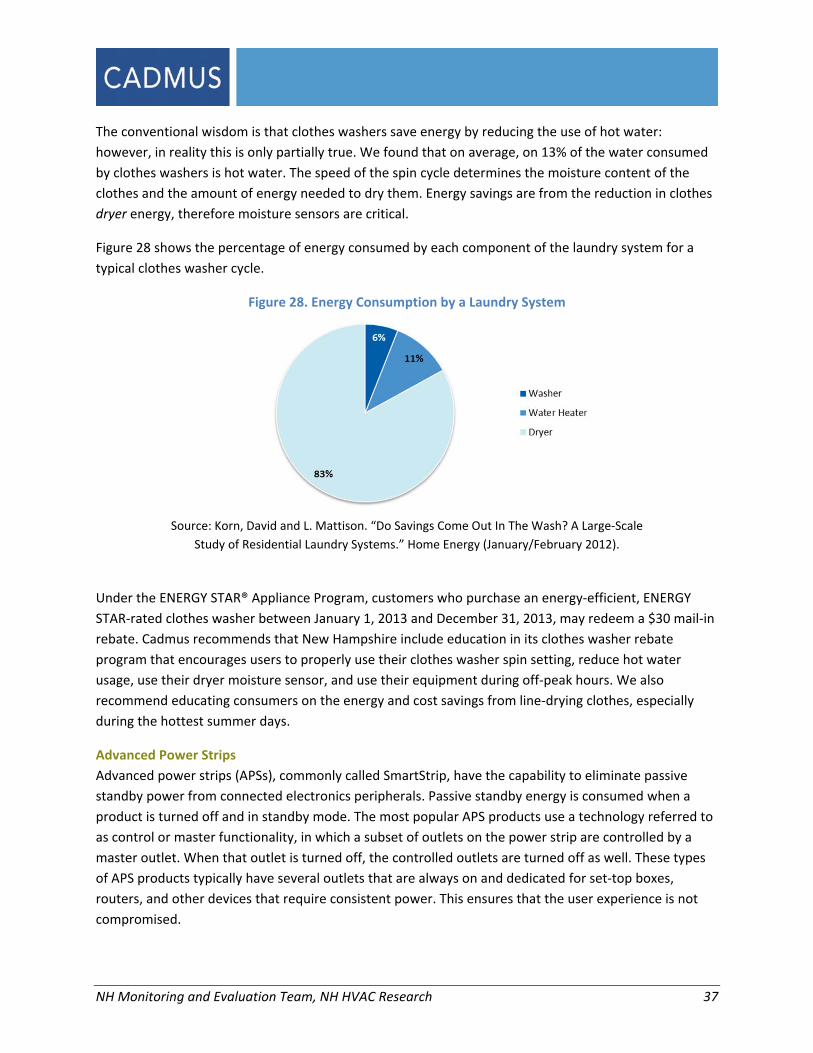
NH Monitoring and Evaluation Team, NH HVAC Research 37
The conventional wisdom is that clothes washers save energy by reducing the use of hot water:
however, in reality this is only partially true. We found that on average, on 13% of the water consumed
by clothes washers is hot water. The speed of the spin cycle determines the moisture content of the
clothes and the amount of energy needed to dry them. Energy savings are from the reduction in clothes
dryer energy, therefore moisture sensors are critical.
Figure 28 shows the percentage of energy consumed by each component of the laundry system for a
typical clothes washer cycle.
Figure 28. Energy Consumption by a Laundry System
Source: Korn, David and L. Mattison. “Do Savings Come Out In The Wash? A Large‐Scale
Study of Residential Laundry Systems.” Home Energy (January/February 2012).
Under the ENERGY STAR® Appliance Program, customers who purchase an energy‐efficient, ENERGY
STAR‐rated clothes washer between January 1, 2013 and December 31, 2013, may redeem a $30 mail‐in
rebate. Cadmus recommends that New Hampshire include education in its clothes washer rebate
program that encourages users to properly use their clothes washer spin setting, reduce hot water
usage, use their dryer moisture sensor, and use their equipment during off‐peak hours. We also
recommend educating consumers on the energy and cost savings from line‐drying clothes, especially
during the hottest summer days.
Advanced Power Strips
Advanced power strips (APSs), commonly called SmartStrip, have the capability to eliminate passive
standby power from connected electronics peripherals. Passive standby energy is consumed when a
product is turned off and in standby mode. The most popular APS products use a technology referred to
as control or master functionality, in which a subset of outlets on the power strip are controlled by a
master outlet. When that outlet is turned off, the controlled outlets are turned off as well. These types
of APS products typically have several outlets that are always on and dedicated for set‐top boxes,
routers, and other devices that require consistent power. This ensures that the user experience is not
compromised.

NH Monitoring and Evaluation Team, NH HVAC Research 38
In addition to control type APS products, a new technology with occupancy sensing capability is
beginning to enter the market. This technology differs from control products because it eliminates both
passive and active standby power. Active standby power occurs when a product is still on, but is not in
use. An example is a person leaving a TV on while they sleep at night. Occupancy sensing APSs have an
infrared sensor that is connected to the APS and monitors motion in the room. When there is no motion
for a specific amount of time, the APS turns off. There are controls on occupancy sensing APSs that allow
products to be left on for extending periods of time, such as set‐top boxes and routers.
APS technology is not for everyone. In order to get the full benefit of having an APS installed,
homeowners need to have several electronic peripherals. If a homeowner has only a TV, they would
only get minimal to no energy savings from an APS. If a homeowner has a gaming console, DVD player,
home theater system, and other devices, they would be able to get high potential energy savings from
their connected equipment. APS technology works best for those that have gaming consoles, audio
visual equipment, and who still use older electronic technology with higher standby consumption.
Energy savings from APS technology varies based on the amount of connected devices and their
efficiency. Reports completed by the New York State Energy Research and Development Authority,
along with the Northeast Energy Efficiency Partnerships’ APS Data Working, claim that an APS can save
75 kWh annually and have a measure life of 10 years. These savings are derived from master/slave
configurations that do not eliminate active standby power. A new generation of APS devices that
eliminate passive and active standby power have been reported to save between 200 kWh and 700 kWh
through field testing.
The New Hampshire CORE programs offer incentives for SmartStrip through the ENERGY STAR®
Appliances program. We recommend that the utilities develop a pilot for this technology to conduct
field‐tests of the reduction and explore methods improving the uptake and usage of SmartStrips to
reduce residential plug load.
Computer Power Management
Computer power management, which automatically places inactive computers in a low‐power sleep
mode, can save up to $50 per desktop in energy costs, annually. Unlike for commercial computers in a
server/client environment, residential computers are put to sleep by the operating system features in
both PC and Mac systems. We recommend that the utilities address this measure through education in
connection with other plug load efforts.
Commercial and Industrial
Energy Use and Potential Savings
Cadmus’ research under Task 1 revealed the following for the C&I sector:
C&I sector electric demand during summer weekdays peaks just before the ISO‐FCM on‐peak
period. The highest loads in the C&I sector occur in the hours between 11:00 a.m. and 2:00 p.m.
This early peak in the summer is driven by building cooling loads.

NH Monitoring and Evaluation Team, NH HVAC Research 39
During the ISO‐NE summer on‐peak hours, the weather‐related (cooling) component of the
summer C&I sector load is 17% of the total C&I sector load.
The percentage of facilities with mechanical cooling systems is stable at 75% (based on PSNH
survey data and EIA projections) and not expected to increase in the near future. It is expected
that the C&I cooling market is saturated (i.e., those facilities without cooling equipment do not
require cooling).
A sizeable percentage of both small and large commercial facilities lack programmable controls
system for their HVAC equipment. Based on surveys conducted for the 2009 NH potential study,
less than 11% of small commercial buildings have programmable thermostats and less than 40%
of large commercial buildings use a central HVAC control system.
The NH energy‐efficiency potential study found that there is significant savings potential in New
Hampshire through cost‐effective electric and natural gas efficiency measures. For commercial and
industrial buildings, the study showed a potential cost‐effective reduction in electric consumption of
more than 10% of projected C&I 2018 total electric consumption. The study estimated that energy
efficiency could cost‐effectively reduce commercial and industrial peak demand by up to 11% and 16%,
respectively.
Statewide and across all sectors, the majority of the opportunity to reduce summer peak demand is
within existing commercial and industrial facilities. Fifty‐two percent of the demand reduction
opportunity is in the existing commercial building market and 32% is within industrial facilities.
Figure 29 shows the estimated maximum achievable energy savings potential by end use for the C&I
sector based on that research.

NH Monitoring and Evaluation Team, NH HVAC Research 40
Figure 29. Maximum Achievable Commercial and Industrial Electric Savings Potential by End Use
Commercial (Existing Buildings)
32% of total potential annual
electric energy savings
52% of potential summer on‐peak demand savings
Commercial (New Construction)
3% of total potential annual
electric energy savings
5% of potential summer on‐peak demand savings
Industrial
15% of total potential annual electric energy Savings
32% of total potential summer
on‐peak demand savings
Source: GDS Associates. “Additional Opportunities for Energy Efficiency in New Hampshire.” 2009.
Note: This study did not include the impact of EISA 2007 on lighting baselines, so the energy efficiency potential for
the lighting end‐use is overstated.

NH Monitoring and Evaluation Team, NH HVAC Research 41
The data show that 39% of the energy savings potential is from lighting measures, 29% from cooling and
ventilation measures, and 19% from refrigeration measures. Energy‐efficiency opportunities identified
for cooling include HVAC controls, space cooling equipment, and building envelop measures that reduce
cooling loads. It is important to note that high energy savings potential does not necessarily translate to
high summer peak demand savings potential. Although this chart highlights end‐uses with the highest
energy‐efficiency potential, some end‐uses with low energy‐efficiency potential may make large
contributions to summer peak demand reduction.
New Hampshire Commercial and Industrial Energy Efficiency Programs
Cadmus reviewed the companies’ 2013‐2014 CORE New Hampshire Energy Efficiency Programs and the
NHSaves.com Website to understand the existing program offerings for commercial and industrial
customers. Table 8 describes the energy‐efficiency programs offered to New Hampshire commercial and
industrial customers in 2013‐2014.
Table 8. New Hampshire C&I Energy Efficiency Programs
Program Customer
Requirements Utilities Description
Large Business Energy Solutions Program
Average demand > 200 kW
CORE Promotes energy efficiency installations for new construction, major renovation, failed equipment, and retrofit markets for large customers.
Small Business Energy Solutions Program
Average demand < 200 kW
CORE Promotes energy efficiency installations for new construction, major renovation, failed equipment, and retrofit markets for small‐to‐medium sized customers.
Smart Start Commercial & Municipal
NHEC, PSNH
Promotes implementation of energy efficiency measures for commercial and municipal customers through on‐bill financing. The programs pay up‐front costs (purchase and installation) and recoup payment through monthly charges on the customer’s electric bill.
C&I RFP Program for Competitive and Economic Development
Average annual demand > 350 kW
PSNH
Promotes market development in the EE industry by encouraging third parties to competitively bid on EE programs. The program aims to capture large C&I customers not already participating in the EE programs.
CHP Pilot
Unitil Promotes Combined Heat and Power (CHP) installations to reduce electric energy and demand requirements.
Source: 2013‐2014 CORE New Hampshire Energy Efficiency Programs. 2012.
The existing programs include prescriptive incentives to address the areas of top electric energy
efficiency in commercial buildings (lighting systems and controls), and they offer technical support and
custom incentives for all customers to address any end‐use. However, the programs may benefit from
more prescriptive options for efficiency opportunities in the commercial refrigeration and industrial
markets, two areas of large energy‐efficiency opportunity, as well as targeted strategies to achieve the
efficiency and demand reduction potential highlighted for these key segments: C&I HVAC controls, C&I
refrigeration, and industrial machine drives.
NH Monitoring and Evaluation Team, NH HVAC Research 42
The following sections provide recommendations to reduce electric energy and peak demand
consumption in the residential sector through both cooling and non‐cooling measures.
Recommended Commercial and Industrial Cooling Measures
Cadmus recommends the following cooling‐related measures to reduce summer cooling energy
consumption and peak load:
Building HVAC system retro‐commissioning and controls
Variable speed drives for data center CRACs
Interval data billing analysis
HVAC Retro‐Commissioning and Controls
The retro‐commissioning (RCx) process improves existing building equipment and system operation and
performance. RCx can resolve issues that began during a building’s design and construction, as well as
issues that developed over time during a building’s use. RCx is a systematic process of investigating,
analyzing, and optimizing the performance of building systems through identifying and implementing
low‐ and no‐cost facility improvements to ensure their continued performance. This process can
generate ongoing energy and cost savings and lead to increased building efficiency.
Utility RCx programs typically target small‐ to medium‐sized commercial and institutional facilities,
aiming to achieve cost‐effective energy savings through system optimization.
Cadmus recommends that the utilities offer a RCX pilot, potentially in conjunction with interval billing
analysis (discussed below in the Recommended Commercial and Industrial Non‐Cooling Measures
section).
Variable Speed Drives on Computer Room Air Conditioners
Like virtualization, implementing variable speed drives (VSDs) in large data centers is becoming much
more common. A recent Uptime Institute survey21 indicated that 62% of larger companies had
implemented or planned to install VSDs compared to only 21% of smaller companies.
Table 9 shows Cadmus’ examination the cost‐benefit analysis for a large scale VSD implementation
project hows a Cadmus worked with eBay to examine the benefit/cost of a large scale VSD
implementation.
21 Stansberry, Matt, and Julian Kudritzki. “Uptime Institute 2012 Data Center Industry Survey.” 2012.

NH Monitoring and Evaluation Team, NH HVAC Research 43
Table 9. Example Cost‐Effectiveness of Computer Room Air Conditioner Variable Speed Drives
A simple prescriptive incentive could be developed for CRAC VSDs based on the fan horsepower and an
assumed conservative fan speed reduction.
Interval Data Billing Analysis
There are numerous electricity savings opportunities in most commercial buildings. Several recent
software offerings allow for remote analysis of large commercial buildings at the account level. These
analyses can detect unusual loads and potential problems in buildings that, if corrected, can reduce
consumption and peak load. Figure 30 shows an example of a temperature response curve from one of
these software offerings.
Figure 30. Commercial Building Temperature Response Curve from Remote Billing Analysis Software
Source: Sample building analysis chart from FirstFuel Rapid Building Assessment (RBA) report.
Type of FanPower (HP)
EfficiencyHours of
UseNumber of
UnitsEnergy
Use (kWh)Constant Speed 10 90% 8760 83 6,026,685
Variable Speed 10 95% 8760 83 1,663,675
4,363,010
283,596$
341,960$
338,984$
69,056$
2.64
479,931$
300,000$
1.59
Actual incentive limited to 50% of costs or $300,000
Payback with Incentive
VSD Installation Costs
Energy Savings (kwh)
Energy Savings ($) at 6.5 cents per kWh
VSD Equipment Costs
Payback
Potential incentive at 11 cents per kWh
Harmonic Transformer Costs
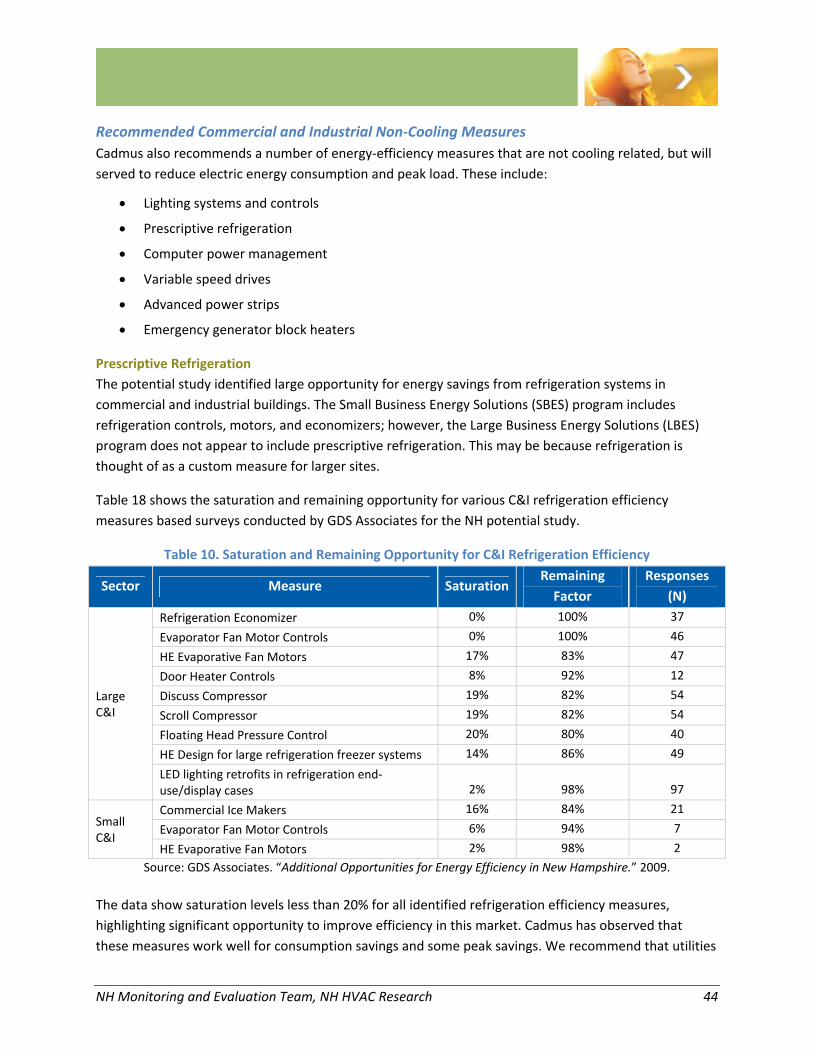
NH Monitoring and Evaluation Team, NH HVAC Research 44
Recommended Commercial and Industrial Non‐Cooling Measures
Cadmus also recommends a number of energy‐efficiency measures that are not cooling related, but will
served to reduce electric energy consumption and peak load. These include:
Lighting systems and controls
Prescriptive refrigeration
Computer power management
Variable speed drives
Advanced power strips
Emergency generator block heaters
Prescriptive Refrigeration
The potential study identified large opportunity for energy savings from refrigeration systems in
commercial and industrial buildings. The Small Business Energy Solutions (SBES) program includes
refrigeration controls, motors, and economizers; however, the Large Business Energy Solutions (LBES)
program does not appear to include prescriptive refrigeration. This may be because refrigeration is
thought of as a custom measure for larger sites.
Table 18 shows the saturation and remaining opportunity for various C&I refrigeration efficiency
measures based surveys conducted by GDS Associates for the NH potential study.
Table 10. Saturation and Remaining Opportunity for C&I Refrigeration Efficiency
Sector Measure SaturationRemaining
Factor
Responses
(N)
Large C&I
Refrigeration Economizer 0% 100% 37
Evaporator Fan Motor Controls 0% 100% 46
HE Evaporative Fan Motors 17% 83% 47
Door Heater Controls 8% 92% 12
Discuss Compressor 19% 82% 54
Scroll Compressor 19% 82% 54
Floating Head Pressure Control 20% 80% 40
HE Design for large refrigeration freezer systems 14% 86% 49
LED lighting retrofits in refrigeration end‐use/display cases 2% 98% 97
Small C&I
Commercial Ice Makers 16% 84% 21
Evaporator Fan Motor Controls 6% 94% 7
HE Evaporative Fan Motors 2% 98% 2
Source: GDS Associates. “Additional Opportunities for Energy Efficiency in New Hampshire.” 2009.
The data show saturation levels less than 20% for all identified refrigeration efficiency measures,
highlighting significant opportunity to improve efficiency in this market. Cadmus has observed that
these measures work well for consumption savings and some peak savings. We recommend that utilities
NH Monitoring and Evaluation Team, NH HVAC Research 45
offer prescriptive measures for a variety of customer sectors and sizes ideally through a targeted
refrigeration efficiency program such as the EnergySmart Grocer program.22
Computer Power Management
Computer power management, which automatically places inactive computers in a low‐power sleep
mode, can save up to $50 per desktop in energy costs, annually. For a number of years, utilities have
offered an incentive between $6 and $15 per computer that is managed. The incentive pays for the
customers’ costs for available network software that quickly and easily activates sleep settings on all the
computers in an organization. Cadmus recommends that New Hampshire adopt some of the following
best practices of these programs:
Require a minimum projected average annual savings per computer. This can be generated
before activating power management by many of the network software solutions. Other utilities
have required 100 to 125 kWh per year per computer in savings before offering the incentive.
Pay only a percentage of the per‐license fee for the software.
Offer the incentive only for desktops (not laptops).
Provide a list of approved vendors.
Table 11 outlines more information on existing computer power management programs.
22 http://www.energysmartgrocer.org/

NH Monitoring and Evaluation Team, NH HVAC Research 46
Table 11. Program Offerings for Computer Power Management
Utility Incentive Amount
Minimum Average
Annual Savings (kWh)
per Computer
Approved List
of Vendors
Austin Energy Up to 50% of installed cost 120 No
Avista $10 per computer 100 No
BC Hydro $6 per computer or 75% of license
cost ‐ whichever is less None No
Idaho Power $10 per computer None No
Manitoba Hydro Up to 100% of installed cost; $15 per
license None Yes
Modesto Irrigation
District ‐ Water and
Power
$10 per computer None No
Pacific Gas and Electric $15 per desktop computer (does not
allow laptop computers) None Yes
Pacific Power $7 per computer, up to 100% of
software cost None No
Riverside Public
Utilities $15 per computer None No
Sacramento Municipal
Utility District $10 per license None No
San Diego Gas and
Electric
$15 per desktop computer (does not
allow laptop computers) None No
Silicon Valley Power
Up to 80% of project cost, $15 per
desktop computer (does not allow
laptop computers)
125 No
Southern California
Edison
$15 per desktop computer (does not
allow laptop computers) None No
Turlock Irrigation
District Water and
Power
$10 per desktop computer (does not
allow laptop computers) None No
Variable Speed Drives
Cadmus reviewed the NH CORE program offerings for VSDs. It is well designed and does an excellent job
of screening out systems that would deliver low savings (e.g., inlet vane dampers with forward curved
fans). It appears that condenser water pumps are not included; however, PSNH may have intended that
are included under the term “chilled water pump.” This should be clarified in future program offerings.
Cadmus recommends that the utilities include this program in outreach to larger sites, in order to take
advantage of savings. It should also be included in any retro‐commissioning efforts.

NH Monitoring and Evaluation Team, NH HVAC Research 47
Advanced Power Strips
See the residential Advanced Power Strips section for a discussion of advanced power strips. Cadmus
recommends that the utilities offer a pilot for this technology that is adapted to the business
environment.
Emergency Generator Block Heaters
During energy audits, Cadmus has frequently noted block heater loads of roughly 10 kW—even for
emergency generators that are located in a conditioned space. We recommend that the utilities offer a
pilot program to incent the addition of thermostats to these heater circuits to eliminate unnecessary
heating, especially during peak summer periods. Implementing thermostats on 100 block generators
could save 1 MW of peak load.

NH Monitoring and Evaluation Team, NH HVAC Research 48
TASK 3. ANCILLARY ELECTRIC SAVINGS
This section outlines the objective, methods, and key results developed under Task 3, including
identifying and quantifying the electric impacts of various non‐electric energy‐efficiency measures
implemented through the New Hampshire programs.
Objective Order 25,402 directs the New England M&E team to: “develop estimates for the ancillary electricity
savings associated with non‐electric savings of various measures used in the HPwES program." The Order
further states that: “ancillary electric savings from non‐electric energy efficiency measures have not been
quantified sufficiently” and notes that existing estimates of such savings vary widely.
Under this task, Cadmus reviewed secondary data to develop quantitative estimates of the ancillary
electric energy savings associated with weatherizing homes and from replacing HVAC and DHW systems
promoted by the ENERGY STAR Appliance Program.
Method Under this task, Cadmus used results from the 2009 HPwES impact evaluation, New Hampshire resident and utility customer survey data, and data collected from other Cadmus evaluations to develop estimates for the electric energy and demand impacts on auxiliary heating and cooling equipment due to the installation of HPwES non‐electric measures.
Identify Electric Impacts
Cadmus first reviewed the potential interactive impacts of various heating, cooling, and domestic hot
water (DHW) energy‐efficiency measures on a household’s electric equipment, and determined that the
energy consumption of ancillary electric equipment is impacted only by measures that affect the home’s
heating, cooling, or DHW loads. Ancillary electric equipment such as furnace or air handling fans and
boiler pumps are not impacted by measures which only address equipment efficiency and do not also
reduce the total load.
Heating, cooling, and DHW loads, or the household’s demand for heating and cooling energy, are driven
by multiple household characteristics, including: envelope properties such as insulation levels, air
leakage rates, and windows; internal loads such as lighting and plug loads; and occupant behavior such
as occupancy rates and thermostat set points. Energy efficiency measures to reduce heating, cooling,
and hot water loads must address one or more of these characteristics to impact the loads, or total
demand for useful heating, cooling, and DHW energy.
Energy‐efficiency measures which impact household heating, cooling, or DHW loads save energy by
reducing requirements for useful energy from the equipment serving that load. In addition, load
reductions may have ancillary electric impacts due to reduced equipment runtime or may impact other
local equipment used to serve those loads or provide additional comfort. Table 12 shows the direct

NH Monitoring and Evaluation Team, NH HVAC Research 49
impacts and potential interactive electric impacts achieved by reductions in heating, cooling, and hot
water loads.
Table 12. Direct and Ancillary Energy Impacts for Home Heating, Cooling, and DHW Load Reduction
Load Direct Impacts Potential Ancillary Impacts, Electric
Heating Heating system fuel consumption
(1) Run time for heating system equipment, including furnace fans (for furnace heating systems), boiler pumps (for hot water boiler systems), or pumps (for ground or water source HP systems)
(2) Use of local electric heating equipment, such as space heaters
Cooling Cooling system fuel consumption
(1) Run time for cooling system equipment, including air handling fans (for CAC systems) or pumps (for ground or water source HP systems)
(2) Run time of local cooling equipment, such as ceiling and floor fans
Domestic hot water
DHW system fuel consumption
None
Energy efficiency measures which improve the efficiency of heating, cooling, and DHW equipment save
energy by using less energy to serve the same home demands for useful heating, cooling, and DHW
energy. These measures – such as a high efficiency furnace, boiler, water heater, or air‐conditioner – do
not impact ancillary equipment because all equipment is still serving the same heating, cooling, and
DHW loads.
Table 13 shows the expected summer and winter electric impacts for various categories of energy‐
efficiency measures implemented through the HPwES and ENERGY STAR® Appliances programs,
followed by a discussion of the potential electric impacts for each measure category.
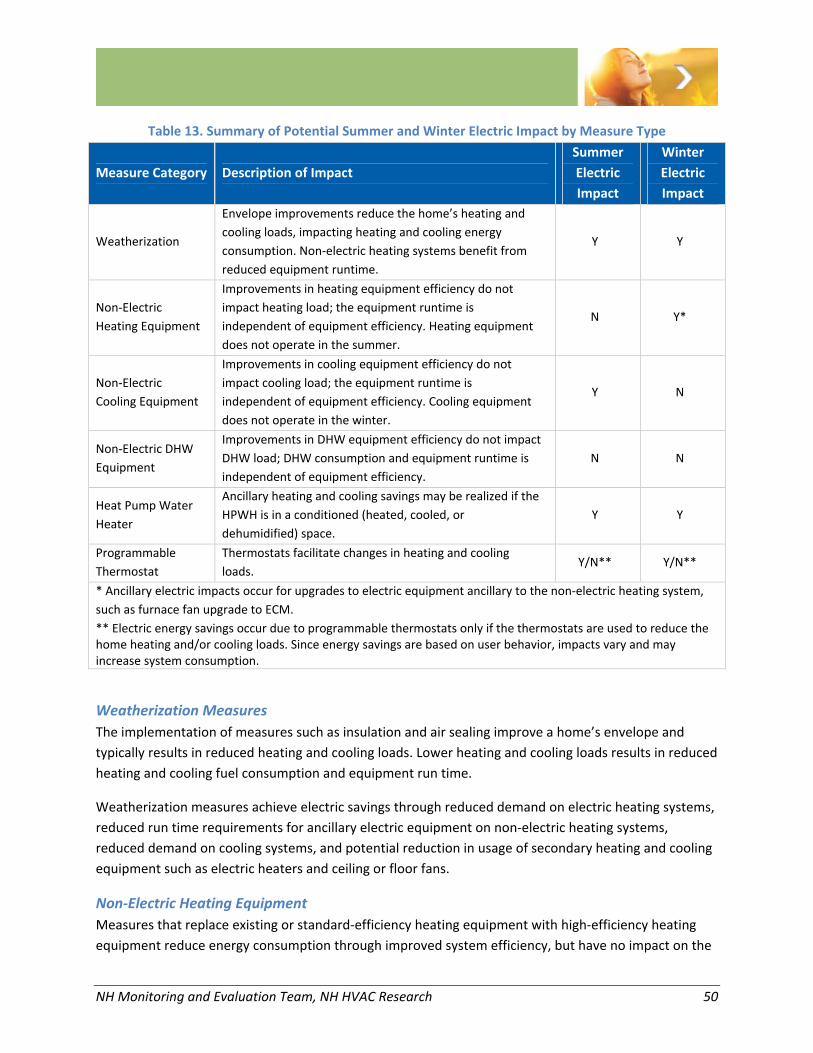
NH Monitoring and Evaluation Team, NH HVAC Research 50
Table 13. Summary of Potential Summer and Winter Electric Impact by Measure Type
Measure Category Description of Impact
Summer
Electric
Impact
Winter
Electric
Impact
Weatherization
Envelope improvements reduce the home’s heating and
cooling loads, impacting heating and cooling energy
consumption. Non‐electric heating systems benefit from
reduced equipment runtime.
Y Y
Non‐Electric
Heating Equipment
Improvements in heating equipment efficiency do not
impact heating load; the equipment runtime is
independent of equipment efficiency. Heating equipment
does not operate in the summer.
N Y*
Non‐Electric
Cooling Equipment
Improvements in cooling equipment efficiency do not
impact cooling load; the equipment runtime is
independent of equipment efficiency. Cooling equipment
does not operate in the winter.
Y N
Non‐Electric DHW
Equipment
Improvements in DHW equipment efficiency do not impact
DHW load; DHW consumption and equipment runtime is
independent of equipment efficiency.
N N
Heat Pump Water
Heater
Ancillary heating and cooling savings may be realized if the
HPWH is in a conditioned (heated, cooled, or
dehumidified) space.
Y Y
Programmable
Thermostat
Thermostats facilitate changes in heating and cooling
loads. Y/N** Y/N**
* Ancillary electric impacts occur for upgrades to electric equipment ancillary to the non‐electric heating system,
such as furnace fan upgrade to ECM.
** Electric energy savings occur due to programmable thermostats only if the thermostats are used to reduce the home heating and/or cooling loads. Since energy savings are based on user behavior, impacts vary and may increase system consumption.
Weatherization Measures
The implementation of measures such as insulation and air sealing improve a home’s envelope and
typically results in reduced heating and cooling loads. Lower heating and cooling loads results in reduced
heating and cooling fuel consumption and equipment run time.
Weatherization measures achieve electric savings through reduced demand on electric heating systems,
reduced run time requirements for ancillary electric equipment on non‐electric heating systems,
reduced demand on cooling systems, and potential reduction in usage of secondary heating and cooling
equipment such as electric heaters and ceiling or floor fans.
Non‐Electric Heating Equipment
Measures that replace existing or standard‐efficiency heating equipment with high‐efficiency heating
equipment reduce energy consumption through improved system efficiency, but have no impact on the

NH Monitoring and Evaluation Team, NH HVAC Research 51
home’s heating load. Since the high‐efficiency equipment is serving the same heating load as the
baseline equipment, the system runtime is unchanged. Since the home heating load is unchanged,
ancillary electric consumption in the home is also unaffected.
Electric savings for non‐electric heating equipment is only achieved through direct efficiency
improvements in the heating system equipment. This includes:
Furnace fans: High‐efficiency furnaces typically have high‐efficiency furnace fans that use less
energy compared to baseline furnace fans.
Since heating equipment does not operate during the summer or impact cooling load, there are no
summer electric impacts for high‐efficiency heating equipment.
Boiler Reset Controls
Boiler reset controls reduce heating fuel consumption by reducing the hot water set point when heating
or hot water demand is low, effectively improving the efficiency of the existing HW boiler system. The
controls do not impact on the home’s heating or hot water load.
The run time for circulator pumps for hot water boiler heating systems is driven by the home or space
heat load, not by the system hot water temperature or heating system efficiency, so there are no
additional electric savings due to the implementation of boiler reset controls.
Cooling Equipment
Measures that replace existing or standard‐efficiency cooling equipment with high‐efficiency cooling
equipment reduce energy consumption through improved system efficiency, but typically have no
impact on the home’s cooling load. Since the high‐efficiency equipment is serving the same cooling load
as the baseline equipment, the system runtime is unchanged. Since the home heating load is
unchanged, ancillary electric consumption in the home is also unaffected.
Since cooling equipment does not operate in the winter or impact heating load, there are no winter
electric impacts for high‐efficiency cooling equipment.
Non‐Electric Water Heating Equipment
Measures that replace existing or standard‐efficiency water heating equipment with high‐efficiency
water heating equipment reduce fuel consumption through improved water heating system efficiency,
but do not impact the home’s consumption of hot water. Since the consumption of hot water is
unchanged, the runtime of any hot water circulating pumps is also unchanged.
Heat Pump Water Heaters
A HPWH reduces the electric water heating consumption (when replacing a standard electric water
heater) through improved water heating efficiency, but does not impact the home’s consumption of hot
water. Since the consumption of hot water is unchanged, the runtime of any hot water circulating
pumps is also unchanged.
NH Monitoring and Evaluation Team, NH HVAC Research 52
HPWHs installed in a conditioned space may impact the heating and cooling loads in that space,
impacting the home’s heating and/or cooling systems. HPWHs reduce space cooling load, resulting in
saving for electric cooling equipment. HPWHs increase heating load, resulting in increased heating fuel
consumption and heating equipment run time. HPWHs installed in an un‐conditioned (not heated or
cooled) space reduce the dehumidification load in that space, and may consequently decrease the
energy consumption of a dehumidifier that is operated in the same space.
Programmable Thermostats
Programmable thermostats facilitate changes in a home’s heating and cooling load through changing
the home’s heating and cooling set points and schedules. Depending on the user behavior, these
changes may reduce a home’s heating and cooling loads, resulting in reduced heating and cooling fuel
consumption and equipment runtime.23
Quantify Ancillary Electric Impacts
Based on our review of the potential electric impact from various heating, cooling, and DHW measures,
Cadmus developed estimates for the following electric energy and demand impacts:
Weatherization impacts on heating equipment:
o Furnace or air handling fans
o Boiler hot water circulation pumps
Weatherization impacts on cooling equipment:
o Central air‐conditioning systems
o RAC systems
High‐efficiency furnaces with ECMs
Heat Pump Water Heaters replacing electric water heaters
Weatherization Measures – Heating Season Impacts
Air Handling Fans
Air handling fans, more typically called furnace fans, drive heated and cooled air over a heat exchanger
or evaporator cooling coil, through a home’s duct systems and into occupied spaces, then draws air
from the space through return ducts and returns the air to the furnace and cooling coil. The fans usually
turn on after the heating and cooling system has operated for seconds or minutes to avoid sending
unconditioned air to living spaces. It usually stay on for seconds or minutes after the furnace or air
conditioner shuts off to avoid wasting heat or cooling capacity.
Homeowners have two options for operating their air handling fans: 1) continuous mode, usually
labeled “On” on their thermostat, or 2) heating mode, usually labeled “auto” on their thermostat.
23 Note that use of programmable thermostats may also increase heating and cooling loads, resulting in
increased system consumption and runtime.

NH Monitoring and Evaluation Team, NH HVAC Research 53
Weatherization measures, such as insulation and air sealing, reduce a home’s heating load by reducing
conductive and infiltration‐driven heat losses. For a non‐modulating burner where the fan is operated in
auto mode, weatherization will cause the fan run time to be reduced, and some electric savings will be
realized. In our previous studies in other northern climates, Cadmus has found that roughly 90% of
homeowners operate their fans in auto mode. A Wisconsin study24 found that four of 31 homeowners
operate their fans continuously, with an additional fan operating all winter. Cadmus used that 90% value
to calculate savings for this report.
Air Handler Fan Savings
Cadmus used the following formulas to determine the electric impacts of weatherization measures on
furnace fans.
Heating Consumption (kWh/year) = Average Watts * Operating Hours / 1,000
Savings (kWh/year) = Heating Consumption (kWh/year) * Savings % * % Fans in Auto Mode
Table 14 outlines the parameters we used to calculate furnace fan savings from weatherization
measures, including the values and sources for each value.
Table 14. Parameters for Furnace Fan Savings due to Weatherization
Parameter Description Value Source
Average
Watts
Average power for a
furnace fan 385 W
In a current study of 40 furnaces in Wisconsin, Cadmus found
an average power draw of 385 watts.
Operating
Hours
Furnace fan operating
hours during heating
season
1,350
hours
Cadmus determined an average seasonal run time of 1,350
hours in heating mode in current study of furnaces in
Wisconsin. We also conducted a 2012 logging study in
Massachusetts, which has a milder climate than New
Hampshire, and found an average heating mode run time of
1,200 hours, which is consistent with the 1,350 hours for New
Hampshire (a less mild climate).
Savings
Percent
Percentage reduction
in heating energy due
to HPwES
weatherization
measures
18%
In our study of New Hampshire HPwES weatherization
savings, Cadmus estimated a savings of roughly 18.3% of
heating energy.
% Fans in
Auto Mode
Percentage of furnace
fans operated in AUTO
mode
90%
In previous studies in other northern climates, Cadmus
determined that roughly 90% of homeowners operate their
fans in auto mode.
24 State of Wisconsin, Department of Administration, Division of Energy, Residential Programs. “Electricity Use by
New Furnaces, A Wisconsin Field Study.” October 2003.
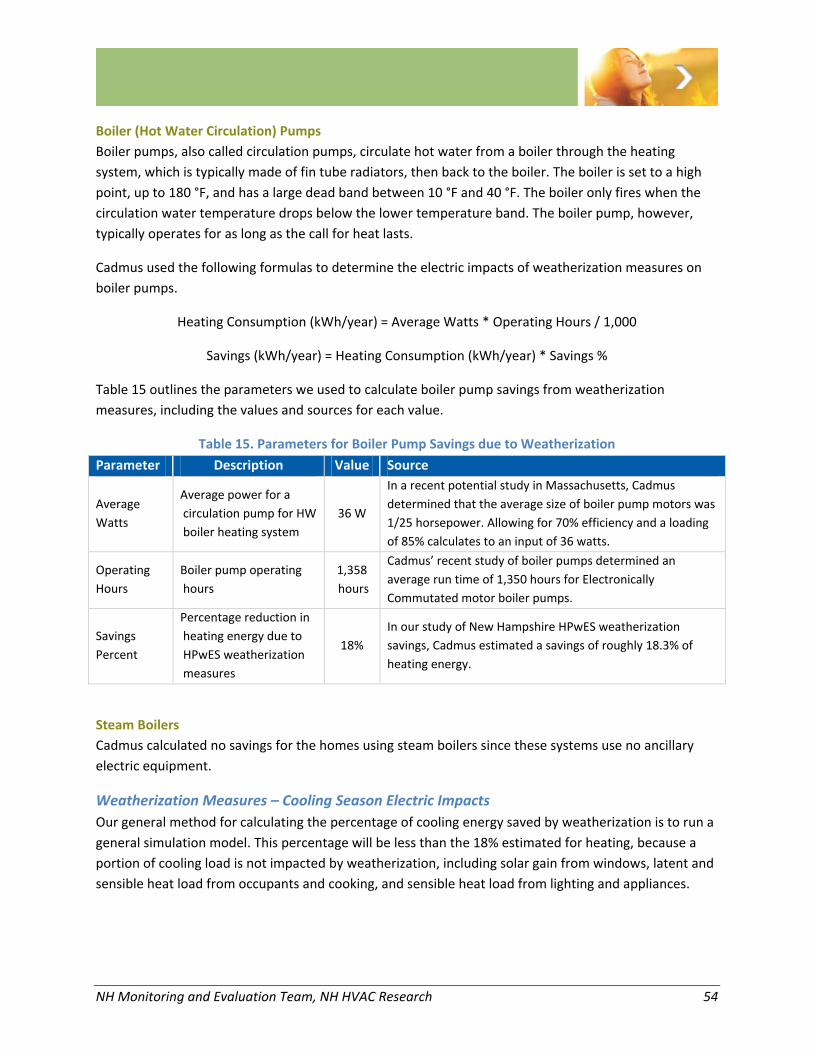
NH Monitoring and Evaluation Team, NH HVAC Research 54
Boiler (Hot Water Circulation) Pumps
Boiler pumps, also called circulation pumps, circulate hot water from a boiler through the heating
system, which is typically made of fin tube radiators, then back to the boiler. The boiler is set to a high
point, up to 180 °F, and has a large dead band between 10 °F and 40 °F. The boiler only fires when the
circulation water temperature drops below the lower temperature band. The boiler pump, however,
typically operates for as long as the call for heat lasts.
Cadmus used the following formulas to determine the electric impacts of weatherization measures on
boiler pumps.
Heating Consumption (kWh/year) = Average Watts * Operating Hours / 1,000
Savings (kWh/year) = Heating Consumption (kWh/year) * Savings %
Table 15 outlines the parameters we used to calculate boiler pump savings from weatherization
measures, including the values and sources for each value.
Table 15. Parameters for Boiler Pump Savings due to Weatherization
Parameter Description Value Source
Average
Watts
Average power for a
circulation pump for HW
boiler heating system
36 W
In a recent potential study in Massachusetts, Cadmus
determined that the average size of boiler pump motors was
1/25 horsepower. Allowing for 70% efficiency and a loading
of 85% calculates to an input of 36 watts.
Operating
Hours
Boiler pump operating
hours
1,358
hours
Cadmus’ recent study of boiler pumps determined an
average run time of 1,350 hours for Electronically
Commutated motor boiler pumps.
Savings
Percent
Percentage reduction in
heating energy due to
HPwES weatherization
measures
18%
In our study of New Hampshire HPwES weatherization
savings, Cadmus estimated a savings of roughly 18.3% of
heating energy.
Steam Boilers
Cadmus calculated no savings for the homes using steam boilers since these systems use no ancillary
electric equipment.
Weatherization Measures – Cooling Season Electric Impacts
Our general method for calculating the percentage of cooling energy saved by weatherization is to run a
general simulation model. This percentage will be less than the 18% estimated for heating, because a
portion of cooling load is not impacted by weatherization, including solar gain from windows, latent and
sensible heat load from occupants and cooking, and sensible heat load from lighting and appliances.
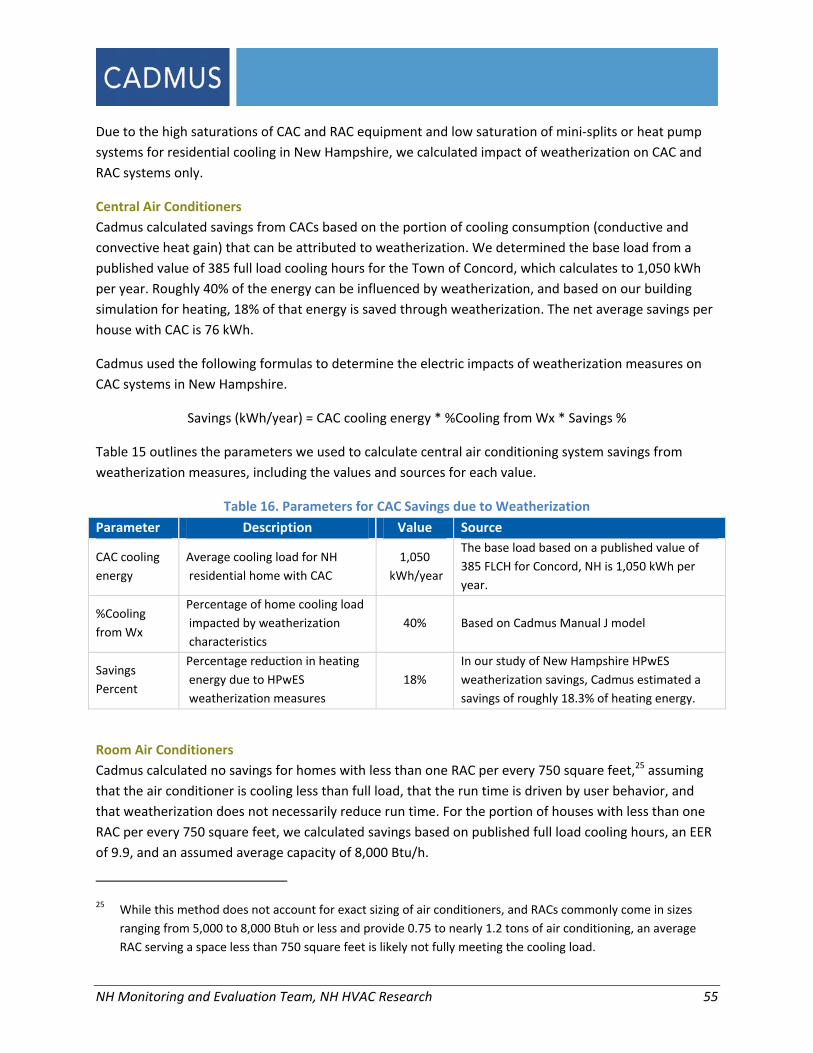
NH Monitoring and Evaluation Team, NH HVAC Research 55
Due to the high saturations of CAC and RAC equipment and low saturation of mini‐splits or heat pump
systems for residential cooling in New Hampshire, we calculated impact of weatherization on CAC and
RAC systems only.
Central Air Conditioners
Cadmus calculated savings from CACs based on the portion of cooling consumption (conductive and
convective heat gain) that can be attributed to weatherization. We determined the base load from a
published value of 385 full load cooling hours for the Town of Concord, which calculates to 1,050 kWh
per year. Roughly 40% of the energy can be influenced by weatherization, and based on our building
simulation for heating, 18% of that energy is saved through weatherization. The net average savings per
house with CAC is 76 kWh.
Cadmus used the following formulas to determine the electric impacts of weatherization measures on
CAC systems in New Hampshire.
Savings (kWh/year) = CAC cooling energy * %Cooling from Wx * Savings %
Table 15 outlines the parameters we used to calculate central air conditioning system savings from
weatherization measures, including the values and sources for each value.
Table 16. Parameters for CAC Savings due to Weatherization
Parameter Description Value Source
CAC cooling
energy
Average cooling load for NH
residential home with CAC
1,050
kWh/year
The base load based on a published value of
385 FLCH for Concord, NH is 1,050 kWh per
year.
%Cooling
from Wx
Percentage of home cooling load
impacted by weatherization
characteristics
40% Based on Cadmus Manual J model
Savings
Percent
Percentage reduction in heating
energy due to HPwES
weatherization measures
18%
In our study of New Hampshire HPwES
weatherization savings, Cadmus estimated a
savings of roughly 18.3% of heating energy.
Room Air Conditioners
Cadmus calculated no savings for homes with less than one RAC per every 750 square feet,25 assuming
that the air conditioner is cooling less than full load, that the run time is driven by user behavior, and
that weatherization does not necessarily reduce run time. For the portion of houses with less than one
RAC per every 750 square feet, we calculated savings based on published full load cooling hours, an EER
of 9.9, and an assumed average capacity of 8,000 Btu/h.
25 While this method does not account for exact sizing of air conditioners, and RACs commonly come in sizes
ranging from 5,000 to 8,000 Btuh or less and provide 0.75 to nearly 1.2 tons of air conditioning, an average
RAC serving a space less than 750 square feet is likely not fully meeting the cooling load.
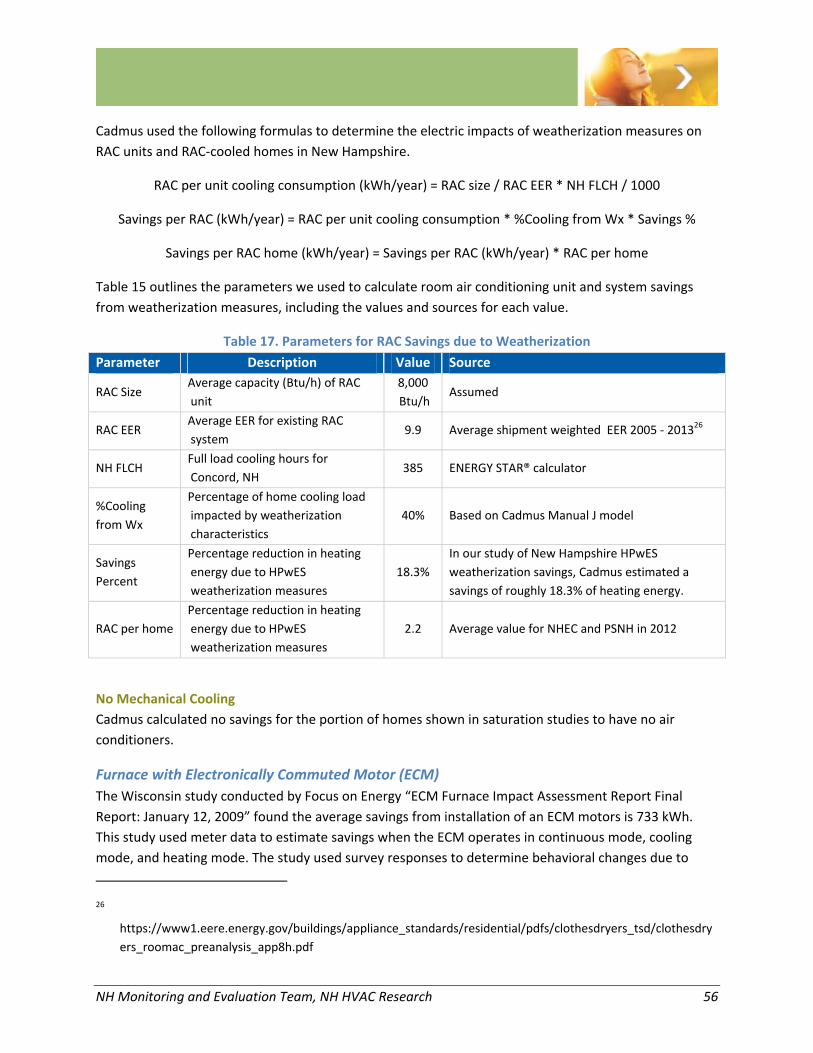
NH Monitoring and Evaluation Team, NH HVAC Research 56
Cadmus used the following formulas to determine the electric impacts of weatherization measures on
RAC units and RAC‐cooled homes in New Hampshire.
RAC per unit cooling consumption (kWh/year) = RAC size / RAC EER * NH FLCH / 1000
Savings per RAC (kWh/year) = RAC per unit cooling consumption * %Cooling from Wx * Savings %
Savings per RAC home (kWh/year) = Savings per RAC (kWh/year) * RAC per home
Table 15 outlines the parameters we used to calculate room air conditioning unit and system savings
from weatherization measures, including the values and sources for each value.
Table 17. Parameters for RAC Savings due to Weatherization
Parameter Description Value Source
RAC Size Average capacity (Btu/h) of RAC
unit
8,000
Btu/h Assumed
RAC EER Average EER for existing RAC
system 9.9 Average shipment weighted EER 2005 ‐ 201326
NH FLCH Full load cooling hours for
Concord, NH 385 ENERGY STAR® calculator
%Cooling
from Wx
Percentage of home cooling load
impacted by weatherization
characteristics
40% Based on Cadmus Manual J model
Savings
Percent
Percentage reduction in heating
energy due to HPwES
weatherization measures
18.3%
In our study of New Hampshire HPwES
weatherization savings, Cadmus estimated a
savings of roughly 18.3% of heating energy.
RAC per home
Percentage reduction in heating
energy due to HPwES
weatherization measures
2.2 Average value for NHEC and PSNH in 2012
No Mechanical Cooling
Cadmus calculated no savings for the portion of homes shown in saturation studies to have no air
conditioners.
Furnace with Electronically Commuted Motor (ECM)
The Wisconsin study conducted by Focus on Energy “ECM Furnace Impact Assessment Report Final
Report: January 12, 2009” found the average savings from installation of an ECM motors is 733 kWh.
This study used meter data to estimate savings when the ECM operates in continuous mode, cooling
mode, and heating mode. The study used survey responses to determine behavioral changes due to
26
https://www1.eere.energy.gov/buildings/appliance_standards/residential/pdfs/clothesdryers_tsd/clothesdry
ers_roomac_preanalysis_app8h.pdf
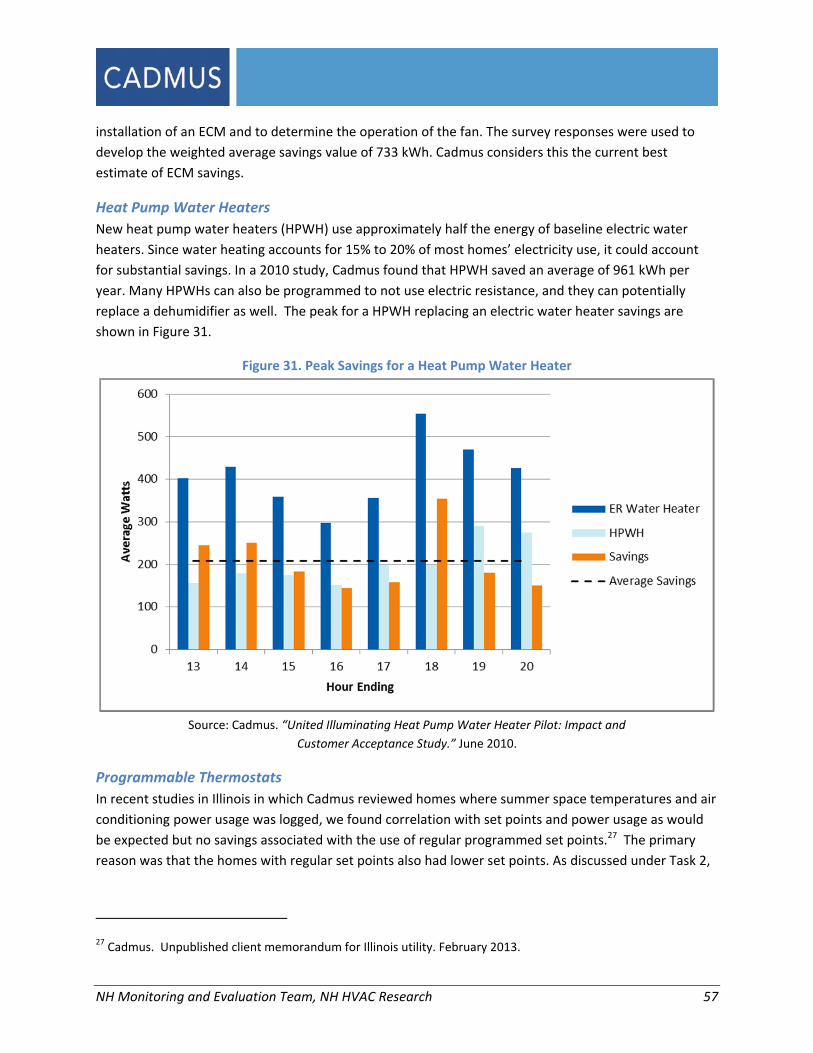
NH Monitoring and Evaluation Team, NH HVAC Research 57
installation of an ECM and to determine the operation of the fan. The survey responses were used to
develop the weighted average savings value of 733 kWh. Cadmus considers this the current best
estimate of ECM savings.
Heat Pump Water Heaters
New heat pump water heaters (HPWH) use approximately half the energy of baseline electric water
heaters. Since water heating accounts for 15% to 20% of most homes’ electricity use, it could account
for substantial savings. In a 2010 study, Cadmus found that HPWH saved an average of 961 kWh per
year. Many HPWHs can also be programmed to not use electric resistance, and they can potentially
replace a dehumidifier as well. The peak for a HPWH replacing an electric water heater savings are
shown in Figure 31.
Figure 31. Peak Savings for a Heat Pump Water Heater
Source: Cadmus. “United Illuminating Heat Pump Water Heater Pilot: Impact and
Customer Acceptance Study.” June 2010.
Programmable Thermostats
In recent studies in Illinois in which Cadmus reviewed homes where summer space temperatures and air
conditioning power usage was logged, we found correlation with set points and power usage as would
be expected but no savings associated with the use of regular programmed set points.27 The primary
reason was that the homes with regular set points also had lower set points. As discussed under Task 2,
27 Cadmus. Unpublished client memorandum for Illinois utility. February 2013.

NH Monitoring and Evaluation Team, NH HVAC Research 58
we believe that web‐enabled thermostats offer demand control advantages, and may offer savings, but
this is best discovered with a pilot program.
Early Replacement Air‐Conditioners
Table 18 shows the potential savings per unit to replace air conditioners prior to failure. The savings
assume an average air conditioned size of 10,000 Btuh and average existing unit efficiency of SEER = 8.
Table 18. Calculated Savings for Early Replacement of Residential Central Air Conditioners
Parameter Value Source
Cooling consumption
for existing AC 1,278 kWh/year
Cadmus used the published base load value of 385 full load cooling
hours for the Concord, NH, and calculated this value based a SEER
under 9 for older units.
SEER for new units 14
This value will depend on final program design and could be the
federal minimum of 13 or higher. This value varies for existing
programs across the U.S.
Cooling consumption
for new AC 821 kWh/year
Cadmus used the published base load value of 385 full load cooling
hours for the Concord, NH, and calculated this value based a SEER of
14 for new units.
Savings 457 kWh/year Difference between energy consumption for existing and new unit
Results Cadmus used secondary data to develop estimates of the electric energy and demand impacts of HPwES
weatherization measures as well as the following residential HVAC measures: high‐efficiency furnace
with ECM, heat pump water heater, and early‐replacement CAC. A summary all inputs and assumptions
used in these calculations is provided in Appendix A.
Table 19 shows the estimated energy and demand impacts of weatherization measures on auxiliary
electric heating system equipment and for typical cooling system equipment.

NH Monitoring and Evaluation Team, NH HVAC Research 59
Table 19. Electric Impacts from Weatherization
Equipment Impact Description of Impact Annual kWh Summer
On‐Peak kW Winter
On‐Peak kW
Furnace fan Reduced fan operation based on heating load reduction from weatherization measures 86 0 TBD
HW boiler circulation pump(s)
Reduced boiler pump operation based on heating load reduction from weatherization measures 9 0 TBD
Steam boiler n/a 0 0 0
Average Heating System
Average heating season electric impact of weatherization measures for non‐electric heating system 55 0 TBD
CAC Reduced CAC cooling energy based on cooling load reduction from weatherization measures 77 TBD 0
RAC (per unit) Reduced per unit RAC cooling energy based on cooling load reduction from weatherization measures 23 TBD 0
RAC (per home)
Reduced household RAC cooling energy based on cooling load reduction from weatherization measures and average units per RAC‐cooled home 50 TBD 0
Average Cooling System
Electric impact of weatherization measures for average residential cooling energy 34 TBD 0
Table 20 shows the estimated energy and demand impacts of several DHW, furnace, and air
conditioning related measures.
Table 20. Electric Impacts from HVAC and DHW Equipment
Measure Description of Impact Annual kWh Summer
On‐Peak kW Winter
On‐Peak kW
Furnace with ECM
Reduced electricity requirements for fan ECM compared to existing fan motor 73328 0 TBD
HPWH Reduced electricity requirement for hot water consumption compared to standard electric heater 961
29 0.184 0.268
Early Replacement CAC
Reduced electricity requirement for CAC cooling compared to existing inefficient CAC system
457 TBD 0
28 PA Consulting Group. “ECM Furnace Impact Assessment Report.” January 2009. 29 Cadmus. “United Illuminating Heat Pump Water Heater Pilot: Impact and Customer Acceptance Study.” June
2010

NH Monitoring and Evaluation Team, NH HVAC Research 60
APPENDIX A – SAVINGS INPUTS AND ASSUMPTIONS
Parameter Description Value Unit Source Notes
PctLoadReduction_Wx
Percentage reduction in
heating energy due to
HPwES weatherization
measures
18% % [1] In the previous study Cadmus estimated a savings of roughly 18 percent of heating energy.
FurnaceFan_AvgPower Average power for a furnace
fan 385 W [unpublished]
Fan size varies with furnace capacity. In a recent study of 40 fans, Cadmus engineers found an average power draw of 385 W.
FurnaceFan_Hours
Annual furnace fan
operating hours
1,350 Hours [unpublished]
Cadmus found an average seasonal runtime of 1,350 hours in heating mode in an ongoing study in a northern climate. A logging study in Massachusetts, a milder climate than New Hampshire, last year, found an average heating mode run time of 1,200 hours, consistent with the 1,350 we are using here for New Hampshire.
FurnaceFan_PctAuto Percentage of furnace fans
operated in AUTO mode 90% % [2]
In previous studies in other northern climates, Cadmus has found that roughly 90% of homeowners operate their fans in “auto” mode.
BoilerPump_AvgPower
Average power for a
circulation pump for HW
boiler heating system
36 W [unpublished] In a recent potential study in MA, Cadmus found that the average size of boiler pump motors was 1/25 HP. Allowing for 70% efficiency and a loading of 85%, this is an input of 36W.
BoilerPump_Hours Annual boiler pump
operating hours 1,358 Hours [3]
During a recent study by Cadmus of boiler pumps we found an average run time of 1,300 to 1,350 hours for ECM boiler pumps.
NH_CoolingkWh Average cooling load for NH
residential home 1,050 kWh n/a
The base load based on a published value of 385 FLCH for Concord, NH is 1,050 kWh per year.
NH_CoolingkWh_old
Average cooling load for NH
residential home with old
(SEER=9) cooling system
1,279 kWh n/a The base load based on a published value of 385 FLCH for Concord, and lower SEER (10) for older units
PctCoolingLoad_Wx
Percentage of home cooling load impacted by weatherization characteristics
40% % [unpublished] Roughly 40% of the energy can be influenced by weatherization. This value was determined using a Cadmus model and Manual J.
NH_FLCH Full load cooling hours for Concord, NH
385 hours n/a The base load based on a published value of 385 FLCH for Concord
CAC_AvgSEERnew Average SEER for new CAC system
14 SEER n/a Higher than federal minimum for a potential AC program

NH Monitoring and Evaluation Team, NH HVAC Research 61
CAC_AvgSEERold Average SEER for existing CAC system
9 SEER n/a Very worst units are SEER 8 but this is for tune up programs.
RAC_AvgEER Average EER for existing RAC system
9.9 EER n/a Average shipment weighted EER 2005 ‐ 2013
RAC_AvgSize Average size (Btu/h) of RAC unit
8,000 Btu/h n/a Assumed
NH_RAC_AvgQty Average number of RAC units per home for RAC‐cooled homes
2.2 n/a NH customer survey data
Average value for NHEC and PSNH in 2012
CoolingEqpt_PctCAC Percentage of NH homes with CAC cooling
23% % NH customer survey data
Average value for NHEC and PSNH in 2012
CoolingEqpt_PctRAC Percentage of NH homes with RAC cooling
43% % NH customer survey data
Average value for NHEC and PSNH in 2012
CoolingEqpt_PctNone Percentage of NH homes with no cooling system
34% % NH customer survey data
Average value for NHEC and PSNH in 2012
HeatingEqpt_PctFurnace Percentage of NH homes with furnace heating system
60% % NH customer survey data
Average value for NHEC and PSNH in 2012
HeatingEqpt_PctBoilerHW Percentage of NH homes with HW boiler heating system
36% % NH customer survey data
Average value for NHEC and PSNH in 2012
HeatingEqpt_PctBoilerSteam Percentage of NH homes with steam boiler heating system
4% % NH customer survey data
Average value for NHEC and PSNH in 2012
RAC_SummerCF Summer on‐peak coincidence factor for residential RAC
0.143 n/a [4] The study determined a residential AC summer on‐peak coincidence factor of 0.143 for Concord, NH.
[1] Cadmus. “Impact Evaluation: New Hampshire Home Performance with ENERGY STAR® Program.” June 2011.
[2] State of Wisconsin, Department of Administration, Division of Energy, Residential Programs. “Electricity Use by New Furnaces, A Wisconsin Field
Study.” October 2003.
[3] Cadmus. “Impact Evaluation of the 2011‐2012 ECM Circulator Pump Pilot Program.” October 2012.
[4] RLW Analytics. “Final Report, Coincidence Factor Study, Residential Room Air Conditioners.” June 2008.

NH Monitoring and Evaluation Team, NH HVAC Research 62
APPENDIX B – HOURLY MODEL ESTIMATION
The New Hampshire electric utilities provided historical hourly electric load data for the residential,
commercial, and industrial customer classes. Cadmus combined these data into residential and
commercial (C&I) sectors and developed hourly weather normalization regression models to determine
the base load, cooling, and heating components of demand for each utility customer class.
We downloaded actual hourly weather data for the Concord, New Hampshire, weather station to obtain
hourly temperatures coincident with the electric load data and developed heating degree hours (HDH)
of bases 0 to 85, and cooling degree hours (CDH) of base h to 85.
We used these electric load and weather data to estimate hourly model specifications for each utility
customer sector (s) and hour (t) and for each heating (h) and cooling (c) reference temperature:
sthcdtcdAVGCDHstcthd
AVGHDHsthsthcstd
kW ** (Eq. 1)
Where:
is the intercept or base load demand for each rate schedule (s), hour (t), each heating
reference temperature(h) and cooling reference temperature (c)
kW is the actual demand
AVGHDH is the daily heating degree hours (base h)
β is the heating demand per heating degree hour of base h
AVGCDH is the cooling degree hours (base c)
δ is the cooling demand per cooling degree hour of base c
ε is the error of the model estimation
We developed models using the formula in equation 1 for each combination of customer sector (s), hour
(t), day (d), heating reference temperature (h) and cooling reference temperature (c), where:
Customer sector s=1, 2, 3, ….., 8
Hour t=1,2,3,….,24
Day d=1,2,3,….,n
Heating reference temperature h=0,1, 2, 3,….,85
Cooling reference temperature c=h, h+1,h+2,…, 85
Once all of the models were estimated for each sector, hour, and heating and cooling reference
temperature ranges, we selected the model with the highest R‐squared value for each hour
representing the best fit to the actual hourly demand. After this step, we have the following information
for the final 24 best hourly models for each sector: best model intercept, heating slope, heating
reference temperature, cooling slope, and cooling reference temperature.

NH Monitoring and Evaluation Team, NH HVAC Research 63
The final best‐fit set of models for each sector predicts the hourly electric load based on weather, using
the formula:
tcAVGCDHstthAVGHDHstststkWpred ** (Eq. 2)
Where:
is the intercept or base load demand for each rate schedule (s), hour (t)
kWpred is the model predicted demand
AVGHDH is the average daily heating degree hours (best base h)
β is the heating demand per heating degree hour of best base h for sector s and hour t
AVGCDH is the average cooling degree hours (best base c)
δ is the cooling demand per cooling degree hour of best base c
To disaggregate the predicted base load, heating, and cooling demand estimates for each sector (s) and
each hour (t), we split the model into three components:
ststkWpredLoadBase _ (Eq. 3)
thAVGHDHststkWpredHeating *_ (Eq. 4)
tcAVGCDHststkWpredCooling *_ (Eq. 5)
To disaggregate the load into each component, we multiply the load by the associated average degree
days for any hour or time period. We combined the components to determine the total predicted hourly
demand for any hour or time period as follows:
kWpredCoolingkWpredHeatingkWpredLoadBasepredkWTotal ____ (Eq. 4)
We used the models to predict hourly total demand and hourly cooling demand and then summed the
total energy and cooling energy for the following periods:
Annual (8,760 hours)
Summer weekdays (Hours 1‐24 on weekdays in June‐August)
Summer on‐peak hours (Hours 14‐17 on weekdays in June‐August)
Peak day (Hours 1‐24 on the peak day)
Peak day on‐peak hours (Hours 14‐17 on the peak day)
Peak hour (Hour 17 on the peak day)


