Nanocomposites Through Copolymerizationof a Polyhedral Oligomeric Silsesquioxane andMethyl Methacrylate
NOA AMIR, ANASTASIA LEVINA, MICHAEL S. SILVERSTEIN
Department of Materials Engineering, Technion – Israel Institute of Technology, Haifa 32000, Israel
Received 13 February 2007; accepted 13 April 2007DOI: 10.1002/pola.22168Published online in Wiley InterScience (www.interscience.wiley.com).
ABSTRACT: The mechanical properties and thermal stability of polymers can beenhanced through the formation of nanocomposites. Nanocomposites consisting ofhybrid copolymers of methacrylcyclohexyl polyhedral oligomeric silsesquioxane(POSS-1) and methyl methacrylate (MMA) with up to 92 wt % (51 mol %) POSS-1and with superior thermal properties were synthesized using solution polymerization.The POSS-1 contents of the copolymers were similar to or slightly higher than thosein the feeds, the polydispersity indices were relatively low, and the degree of polymer-ization decreased with increasing POSS-1 content. POSS-1 enhanced the thermal sta-bility, increasing the degradation temperature, reducing the mass loss, and prevent-ing PMMA-like degradation from propagating along the chain. The mass loss wasreduced in a high POSS-1 content copolymer since the polymerization of POSS-1with itself reduced sublimation. Exposure to 450 8C produced cyclohexyl-POSS-likeremnants in the POSS-1 monomer and in all the copolymers. The degradation ofthese remnants, for the copolymers and for the POSS-1 monomer, yielded 75% SiO2
and an oxidized carbonaceous residue. VVC 2007 Wiley Periodicals, Inc. J Polym Sci Part A:
Polym Chem 45: 4264–4275, 2007
Keywords: copolymerization; hybrid; nanocomposites; POSS; thermal properties
INTRODUCTION
Nanocomposites consisting of hybrid materialsthat combine organic and inorganic groups oftenexhibit synergistic properties (e.g., mechanical,thermal, optical, electrical).1–4 Silsesquioxanes(SSQ) are silicon–oxygen frame-works with theempirical formula (RSiO1.5)n.
5 R can be hydrogenor an organic substituent, the simplest of whichis CH3. Oligomeric SSQ are obtained through thehydrolytic condensation of trifunctional silanessuch as RSiCl3 or RSi(OCH3)3. Polyhedral oligo-meric silsesquioxanes (POSS) are a relatively
new family of organic–inorganic hybrids andhave been described in recent reviews.6,7 Themost common POSS unit is the cubic T8, com-posed of eight silicon atoms at each corner of acube and oxygen bridges between the siliconatoms.
POSS can be incorporated into polymer matri-ces through blending or through chemical reac-tion. POSS can be more easily mixed into a poly-mer matrix if the silicon atoms bear organicgroups that enhance compatibility with the poly-mer.8,9 POSS has been blended with poly(methylmethacrylate) (PMMA) to yield tougher materi-als.10 POSS becomes tethered to the polymerchain as a pendent group if one silicon atombears a group that either reacts with the poly-mer or copolymerizes with the monomer (theremaining seven silicon atoms bear nonreactive
Correspondence to: M. S. Silverstein (E-mail: [email protected])
Journal of Polymer Science: Part A: Polymer Chemistry, Vol. 45, 4264–4275 (2007)VVC 2007 Wiley Periodicals, Inc.
4264
groups).11 POSS can crosslink the polymer ifmore than one silicon atom bears groups that ei-ther react with the polymer or copolymerize withthe monomer. POSS bearing different reactivegroups have been copolymerized with organicmonomers using diverse polymerization proc-esses (radical, condensation, ring opening me-tathesis, and living).6,7,12–16
Nanocomposites of PMMA containing silicananoparticles have exhibited enhanced thermalstability.17,18 Copolymers containing tetheredPOSS often exhibit enhanced thermal proper-ties.19–23 The temperature at which degradationbegins increases on POSS incorporation. A silicalayer, formed on the surface during degradationin the presence of oxygen, serves as a barrier,preventing the degradation of the underlyingpolymer.21,24 The objectives of this research wereto synthesize nanocomposite copolymers of POSSand MMA and to describe the copolymers’ molec-ular structures and their behavior on exposure toelevated temperatures. Such a combination ofmolecular characterization and thermal analysishas proved useful in providing insight into vari-ous organic–inorganic hybrid systems.25–27
EXPERIMENTAL
Materials
POSS bearing seven nonreactive cyclohexylgroups and a reactive propylmethacrylate group((C6H11)7Si8O12C7H11O2, 1125.9 g/mol), hereafterreferred to as POSS-1, was supplied by HybridPlastics. The MMA was supplied by Merck Schu-chardt. The MMA was washed to remove the in-hibitor (once with an aqueous 5 wt % sodium hy-droxide (NaOH) solution and then three timeswith deionized water). Toluene, tetrahydrofuran(THF), benzoyl peroxide (BPO), NaOH, deuter-ated chloroform (CDCl3), polystyrene (PS) cali-bration standards for gel permeation chromatog-raphy (GPC), and potassium bromide (KBr) weresupplied by Aldrich and used as received.
Synthesis of POSS-1/MMA Copolymers
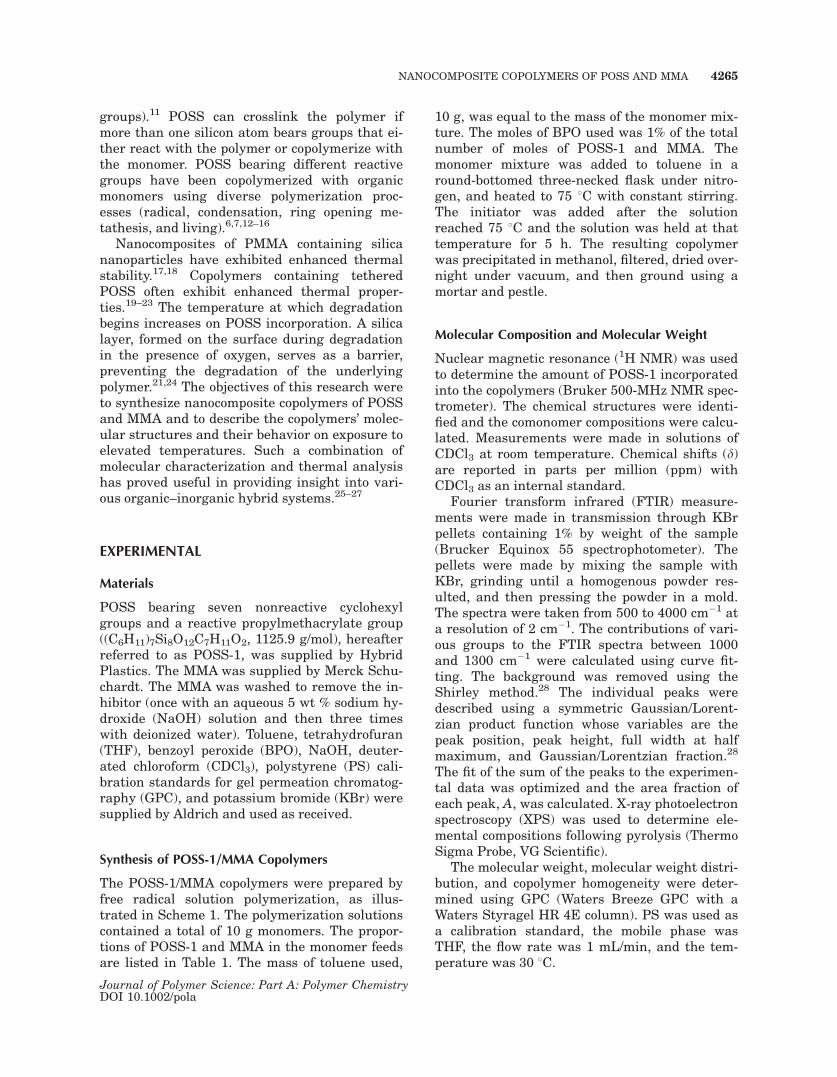
The POSS-1/MMA copolymers were prepared byfree radical solution polymerization, as illus-trated in Scheme 1. The polymerization solutionscontained a total of 10 g monomers. The propor-tions of POSS-1 and MMA in the monomer feedsare listed in Table 1. The mass of toluene used,
10 g, was equal to the mass of the monomer mix-ture. The moles of BPO used was 1% of the totalnumber of moles of POSS-1 and MMA. Themonomer mixture was added to toluene in around-bottomed three-necked flask under nitro-gen, and heated to 75 8C with constant stirring.The initiator was added after the solutionreached 75 8C and the solution was held at thattemperature for 5 h. The resulting copolymerwas precipitated in methanol, filtered, dried over-night under vacuum, and then ground using amortar and pestle.
Molecular Composition and Molecular Weight
Nuclear magnetic resonance (1H NMR) was usedto determine the amount of POSS-1 incorporatedinto the copolymers (Bruker 500-MHz NMR spec-trometer). The chemical structures were identi-fied and the comonomer compositions were calcu-lated. Measurements were made in solutions ofCDCl3 at room temperature. Chemical shifts (d)are reported in parts per million (ppm) withCDCl3 as an internal standard.
Fourier transform infrared (FTIR) measure-ments were made in transmission through KBrpellets containing 1% by weight of the sample(Brucker Equinox 55 spectrophotometer). Thepellets were made by mixing the sample withKBr, grinding until a homogenous powder res-ulted, and then pressing the powder in a mold.The spectra were taken from 500 to 4000 cm�1 ata resolution of 2 cm�1. The contributions of vari-ous groups to the FTIR spectra between 1000and 1300 cm�1 were calculated using curve fit-ting. The background was removed using theShirley method.28 The individual peaks weredescribed using a symmetric Gaussian/Lorent-zian product function whose variables are thepeak position, peak height, full width at halfmaximum, and Gaussian/Lorentzian fraction.28
The fit of the sum of the peaks to the experimen-tal data was optimized and the area fraction ofeach peak, A, was calculated. X-ray photoelectronspectroscopy (XPS) was used to determine ele-mental compositions following pyrolysis (ThermoSigma Probe, VG Scientific).
The molecular weight, molecular weight distri-bution, and copolymer homogeneity were deter-mined using GPC (Waters Breeze GPC with aWaters Styragel HR 4E column). PS was used asa calibration standard, the mobile phase wasTHF, the flow rate was 1 mL/min, and the tem-perature was 30 8C.
NANOCOMPOSITE COPOLYMERS OF POSS AND MMA 4265
Journal of Polymer Science: Part A: Polymer ChemistryDOI 10.1002/pola
Glass-Transition Temperature and Exposure toElevated Temperatures
Differential scanning calorimetry (DSC) wasused to determine the glass-transition tempera-tures (Tg) and to characterize the behavior on ex-posure to elevated temperatures (Mettler DSC-821 calorimeter). The DSC samples were drypowders (8–10 mg) in an open pan, with an
empty aluminum pan as the reference, and meas-urements were made from 25 to 450 8C at 10 8C/min in flowing nitrogen. Thermogravimetricanalysis (TGA) was used to characterize thebehavior on exposure to elevated temperatures(Thermogravimetric Analyzer, TA). The TGAsamples were dry powders (20–25 mg) and meas-urements were made from 25 to 900 8C at 20 8C/min in flowing nitrogen. The differential ther-
Table 1. Compositions, Molecular Weights, and Transition Temperatures
FeedPOSS-1(mol %)
CopolymerPOSS-1(mol %)
FeedPOSS-1(wt %)
CopolymerPOSS-1(wt %)
Mn
(kg/mol) PDI N Tg (8C) Td (8C)
PMMA 0 0 0 0 316 1.21 3160 122 233C-11 8 11 50 58 93 1.87 437 113 280C-21 21 21 75 75 116 1.48 349 – 325C-51 44 51 90 92 189 1.31 310 – 370
Scheme 1. Copolymerization reaction.
4266 AMIR, LEVINA, AND SILVERSTEIN
Journal of Polymer Science: Part A: Polymer ChemistryDOI 10.1002/pola
mogravimetry (DTG) curves are derivatives ofthe TGA thermograms, calculated using the sup-plied software.
RESULTS AND DISCUSSION
Molecular Composition
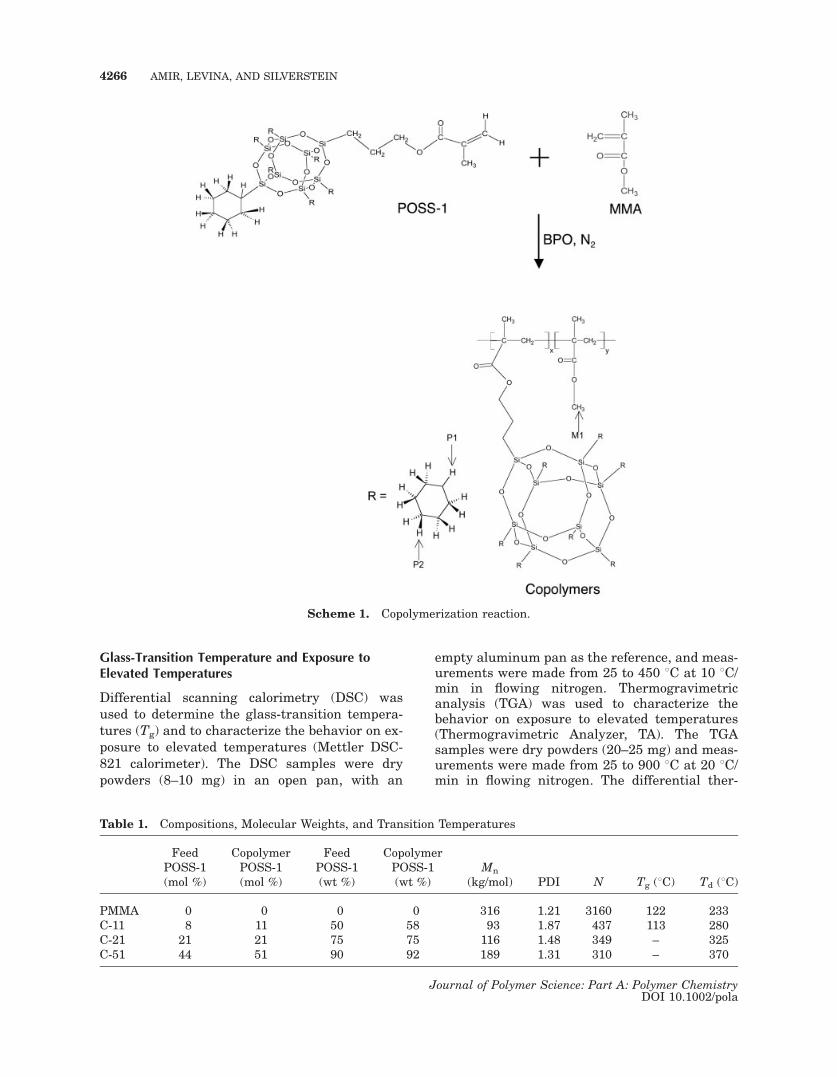
The methoxy group in PMMA resonates at 3.58ppm and is marked M1 in Scheme 1.29,30 Thecyclohexyl hydrogens in POSS-1 resonate atthree different places because of different ringconformations (axial and equatorial) and differ-ent chemical environments. The single hydrogenon the carbon that is attached to silicon resonatesat 0.76 ppm and is marked P1 in Scheme 1.31 Thehydrogen marked P2 in Scheme 1 resonates at1.23 ppm. The 1H NMR spectra of the copolymersin Figure 1 were used to determine their compo-sitions. The relative areas of the P1 and P2 reso-nances (the areas normalized by the area of theM1 resonance, which is only found in the MMAunits) are listed in Table 2. The copolymer com-positions calculated from these results are listedin Table 1. The POSS-1 contents in the copoly-mers are similar to, or slightly higher than, thePOSS-1 contents in the feeds. The copolymerscontaining 11, 21, and 51 mol % POSS-1 will bereferred to as C-11, C-21, and C-51, respectively.
The FTIR spectra of PMMA and the copoly-mers, as-synthesized, and of POSS-1 are pre-sented in Figure 2. Selected bands from thePMMA and from POSS-1 are listed in Table 3.The heights of the bands associated with POSS-1(cyclohexyl CH2 (c-CH2) at 2929 cm�1, Si��O at1110 cm�1, and noncyclic CH2 (nc-CH2) and CH3
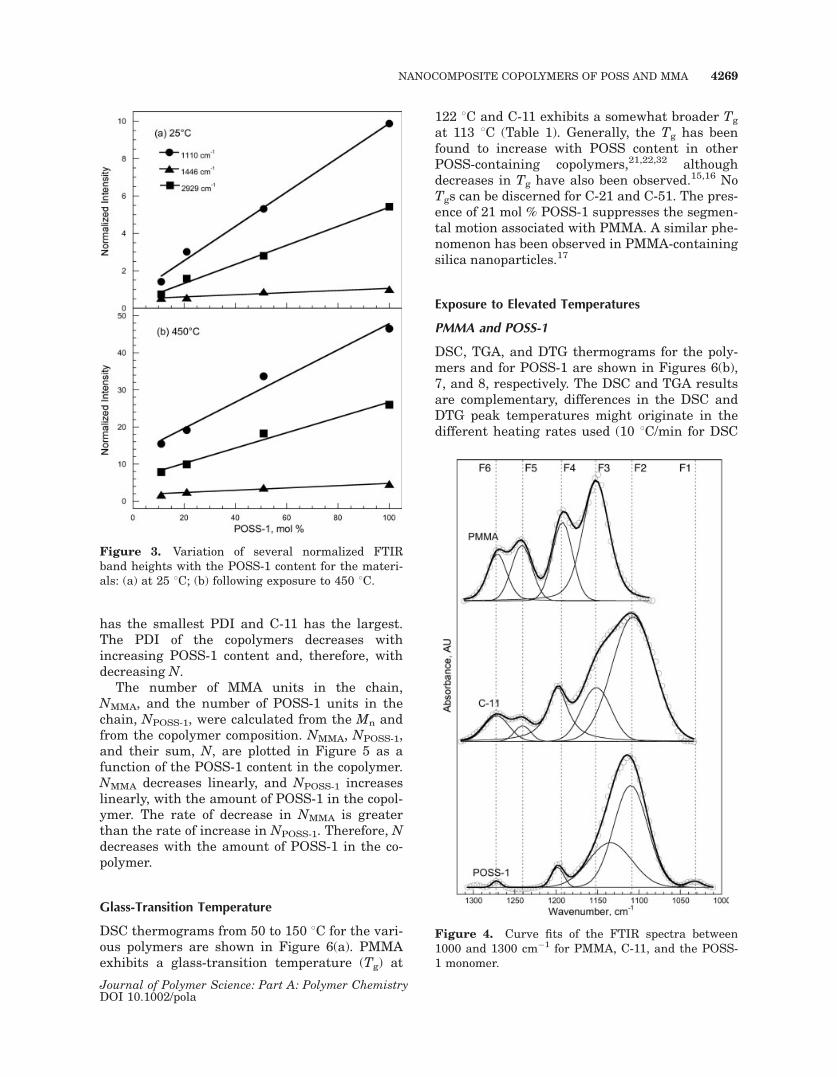
at 1446 cm�1), normalized by the height of theCOO band at around 1731 cm�1, are presented asa function of the POSS-1 content in Figure 3(a).The normalized heights of these bands increaselinearly with increasing POSS-1 content, asexpected.
The overlapping bands between 1030 and1330 cm�1 were described using curve fitting.
Figure 1. 1H NMR spectra of the copolymers.
Table 2. 1H NMR Peak Positions andRelative Areas
1H Position (ppm) Relative Area
C-11 M1 3.56 1.00P1 0.76 0.31P2 1.23 1.43
C-21 M1 3.56 1.00P1 0.76 0.74P2 1.23 3.53
C-51 M1 3.56 1.00P1 0.76 2.35P2 1.23 10.8
NANOCOMPOSITE COPOLYMERS OF POSS AND MMA 4267
Journal of Polymer Science: Part A: Polymer ChemistryDOI 10.1002/pola
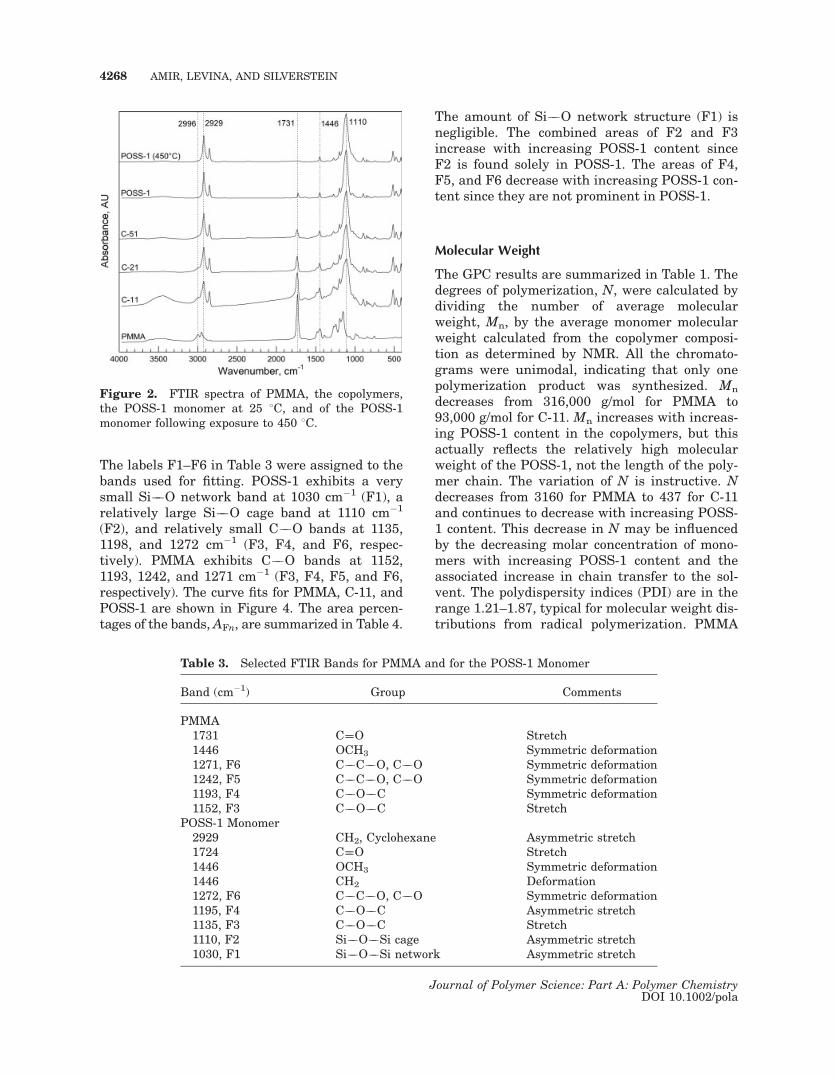
The labels F1–F6 in Table 3 were assigned to thebands used for fitting. POSS-1 exhibits a verysmall Si��O network band at 1030 cm�1 (F1), arelatively large Si��O cage band at 1110 cm�1
(F2), and relatively small C��O bands at 1135,1198, and 1272 cm�1 (F3, F4, and F6, respec-tively). PMMA exhibits C��O bands at 1152,1193, 1242, and 1271 cm�1 (F3, F4, F5, and F6,respectively). The curve fits for PMMA, C-11, andPOSS-1 are shown in Figure 4. The area percen-tages of the bands, AFn, are summarized in Table 4.
The amount of Si��O network structure (F1) isnegligible. The combined areas of F2 and F3increase with increasing POSS-1 content sinceF2 is found solely in POSS-1. The areas of F4,F5, and F6 decrease with increasing POSS-1 con-tent since they are not prominent in POSS-1.
Molecular Weight
The GPC results are summarized in Table 1. Thedegrees of polymerization, N, were calculated bydividing the number of average molecularweight, Mn, by the average monomer molecularweight calculated from the copolymer composi-tion as determined by NMR. All the chromato-grams were unimodal, indicating that only onepolymerization product was synthesized. Mn
decreases from 316,000 g/mol for PMMA to93,000 g/mol for C-11. Mn increases with increas-ing POSS-1 content in the copolymers, but thisactually reflects the relatively high molecularweight of the POSS-1, not the length of the poly-mer chain. The variation of N is instructive. Ndecreases from 3160 for PMMA to 437 for C-11and continues to decrease with increasing POSS-1 content. This decrease in N may be influencedby the decreasing molar concentration of mono-mers with increasing POSS-1 content and theassociated increase in chain transfer to the sol-vent. The polydispersity indices (PDI) are in therange 1.21–1.87, typical for molecular weight dis-tributions from radical polymerization. PMMA
Figure 2. FTIR spectra of PMMA, the copolymers,the POSS-1 monomer at 25 8C, and of the POSS-1monomer following exposure to 450 8C.
Table 3. Selected FTIR Bands for PMMA and for the POSS-1 Monomer
Band (cm�1) Group Comments
PMMA1731 C¼¼O Stretch1446 OCH3 Symmetric deformation1271, F6 C��C��O, C��O Symmetric deformation1242, F5 C��C��O, C��O Symmetric deformation1193, F4 C��O��C Symmetric deformation1152, F3 C��O��C Stretch
POSS-1 Monomer2929 CH2, Cyclohexane Asymmetric stretch1724 C¼¼O Stretch1446 OCH3 Symmetric deformation1446 CH2 Deformation1272, F6 C��C��O, C��O Symmetric deformation1195, F4 C��O��C Asymmetric stretch1135, F3 C��O��C Stretch1110, F2 Si��O��Si cage Asymmetric stretch1030, F1 Si��O��Si network Asymmetric stretch
4268 AMIR, LEVINA, AND SILVERSTEIN
Journal of Polymer Science: Part A: Polymer ChemistryDOI 10.1002/pola
has the smallest PDI and C-11 has the largest.The PDI of the copolymers decreases withincreasing POSS-1 content and, therefore, withdecreasing N.
The number of MMA units in the chain,NMMA, and the number of POSS-1 units in thechain, NPOSS-1, were calculated from the Mn andfrom the copolymer composition. NMMA, NPOSS-1,and their sum, N, are plotted in Figure 5 as afunction of the POSS-1 content in the copolymer.NMMA decreases linearly, and NPOSS-1 increaseslinearly, with the amount of POSS-1 in the copol-ymer. The rate of decrease in NMMA is greaterthan the rate of increase in NPOSS-1. Therefore, Ndecreases with the amount of POSS-1 in the co-polymer.
Glass-Transition Temperature
DSC thermograms from 50 to 150 8C for the vari-ous polymers are shown in Figure 6(a). PMMAexhibits a glass-transition temperature (Tg) at
122 8C and C-11 exhibits a somewhat broader Tg
at 113 8C (Table 1). Generally, the Tg has beenfound to increase with POSS content in otherPOSS-containing copolymers,21,22,32 althoughdecreases in Tg have also been observed.15,16 NoTgs can be discerned for C-21 and C-51. The pres-ence of 21 mol % POSS-1 suppresses the segmen-tal motion associated with PMMA. A similar phe-nomenon has been observed in PMMA-containingsilica nanoparticles.17
Exposure to Elevated Temperatures
PMMA and POSS-1
DSC, TGA, and DTG thermograms for the poly-mers and for POSS-1 are shown in Figures 6(b),7, and 8, respectively. The DSC and TGA resultsare complementary, differences in the DSC andDTG peak temperatures might originate in thedifferent heating rates used (10 8C/min for DSC
Figure 3. Variation of several normalized FTIRband heights with the POSS-1 content for the materi-als: (a) at 25 8C; (b) following exposure to 450 8C.
Figure 4. Curve fits of the FTIR spectra between1000 and 1300 cm�1 for PMMA, C-11, and the POSS-1 monomer.
NANOCOMPOSITE COPOLYMERS OF POSS AND MMA 4269
Journal of Polymer Science: Part A: Polymer ChemistryDOI 10.1002/pola
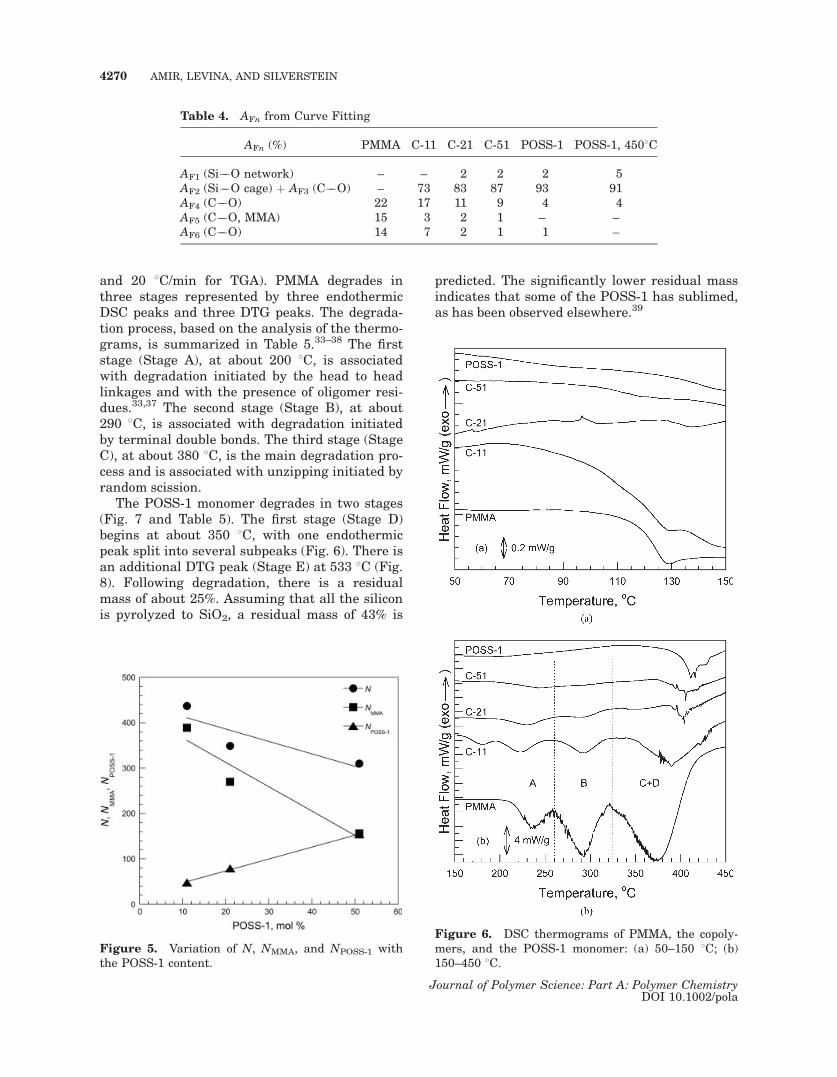
and 20 8C/min for TGA). PMMA degrades inthree stages represented by three endothermicDSC peaks and three DTG peaks. The degrada-tion process, based on the analysis of the thermo-grams, is summarized in Table 5.33–38 The firststage (Stage A), at about 200 8C, is associatedwith degradation initiated by the head to headlinkages and with the presence of oligomer resi-dues.33,37 The second stage (Stage B), at about290 8C, is associated with degradation initiatedby terminal double bonds. The third stage (StageC), at about 380 8C, is the main degradation pro-cess and is associated with unzipping initiated byrandom scission.
The POSS-1 monomer degrades in two stages(Fig. 7 and Table 5). The first stage (Stage D)begins at about 350 8C, with one endothermicpeak split into several subpeaks (Fig. 6). There isan additional DTG peak (Stage E) at 533 8C (Fig.8). Following degradation, there is a residualmass of about 25%. Assuming that all the siliconis pyrolyzed to SiO2, a residual mass of 43% is
predicted. The significantly lower residual massindicates that some of the POSS-1 has sublimed,as has been observed elsewhere.39
Table 4. AFn from Curve Fitting
AFn (%) PMMA C-11 C-21 C-51 POSS-1 POSS-1, 4508C
AF1 (Si��O network) – – 2 2 2 5AF2 (Si��O cage) þ AF3 (C��O) – 73 83 87 93 91AF4 (C��O) 22 17 11 9 4 4AF5 (C��O, MMA) 15 3 2 1 – –AF6 (C��O) 14 7 2 1 1 –
Figure 5. Variation of N, NMMA, and NPOSS-1 withthe POSS-1 content.
Figure 6. DSC thermograms of PMMA, the copoly-mers, and the POSS-1 monomer: (a) 50–150 8C; (b)150–450 8C.
4270 AMIR, LEVINA, AND SILVERSTEIN
Journal of Polymer Science: Part A: Polymer ChemistryDOI 10.1002/pola
Copolymer: Initial Stages
The copolymers differ in the number of DTGpeaks that they exhibit at lower temperatures(Fig. 8). C-11 exhibits three endothermic DSCpeaks below 400 8C. The first two, around 179and 223, are associated with Stage A (A1 and A2,respectively) and the third, around 294 8C, isassociated with Stage B. The sum of the endo-therms from Stages A1, A2, and B, normalizedby the mass of MMA in the copolymer, is117 J/gMMA. This normalized heat is similar tothe sum of the endotherms from Stages A and Bfor PMMA, 136 J/gMMA. Thus, Stages A1, A2, andB in C-11 seem to result largely from the degra-dation of the MMA in the copolymer. MMA deg-radation in C-21 and C-51 also seems to be theorigin of the endotherms in Stages A and B, witha total heat of 105 J/gMMA in C-21.
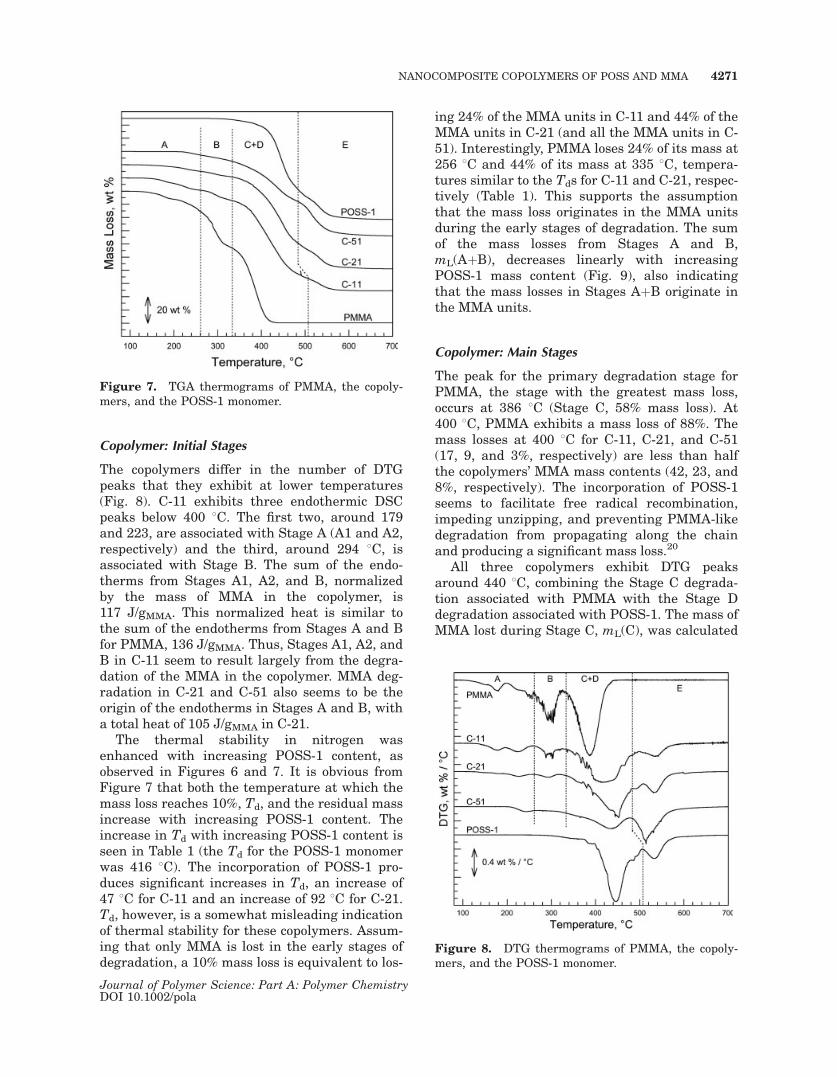
The thermal stability in nitrogen wasenhanced with increasing POSS-1 content, asobserved in Figures 6 and 7. It is obvious fromFigure 7 that both the temperature at which themass loss reaches 10%, Td, and the residual massincrease with increasing POSS-1 content. Theincrease in Td with increasing POSS-1 content isseen in Table 1 (the Td for the POSS-1 monomerwas 416 8C). The incorporation of POSS-1 pro-duces significant increases in Td, an increase of47 8C for C-11 and an increase of 92 8C for C-21.Td, however, is a somewhat misleading indicationof thermal stability for these copolymers. Assum-ing that only MMA is lost in the early stages ofdegradation, a 10% mass loss is equivalent to los-
ing 24% of the MMA units in C-11 and 44% of theMMA units in C-21 (and all the MMA units in C-51). Interestingly, PMMA loses 24% of its mass at256 8C and 44% of its mass at 335 8C, tempera-tures similar to the Tds for C-11 and C-21, respec-tively (Table 1). This supports the assumptionthat the mass loss originates in the MMA unitsduring the early stages of degradation. The sumof the mass losses from Stages A and B,mL(AþB), decreases linearly with increasingPOSS-1 mass content (Fig. 9), also indicatingthat the mass losses in Stages AþB originate inthe MMA units.
Copolymer: Main Stages
The peak for the primary degradation stage forPMMA, the stage with the greatest mass loss,occurs at 386 8C (Stage C, 58% mass loss). At400 8C, PMMA exhibits a mass loss of 88%. Themass losses at 400 8C for C-11, C-21, and C-51(17, 9, and 3%, respectively) are less than halfthe copolymers’ MMA mass contents (42, 23, and8%, respectively). The incorporation of POSS-1seems to facilitate free radical recombination,impeding unzipping, and preventing PMMA-likedegradation from propagating along the chainand producing a significant mass loss.20
All three copolymers exhibit DTG peaksaround 440 8C, combining the Stage C degrada-tion associated with PMMA with the Stage Ddegradation associated with POSS-1. The mass ofMMA lost during Stage C, mL(C), was calculated
Figure 7. TGA thermograms of PMMA, the copoly-mers, and the POSS-1 monomer.
Figure 8. DTG thermograms of PMMA, the copoly-mers, and the POSS-1 monomer.
NANOCOMPOSITE COPOLYMERS OF POSS AND MMA 4271
Journal of Polymer Science: Part A: Polymer ChemistryDOI 10.1002/pola
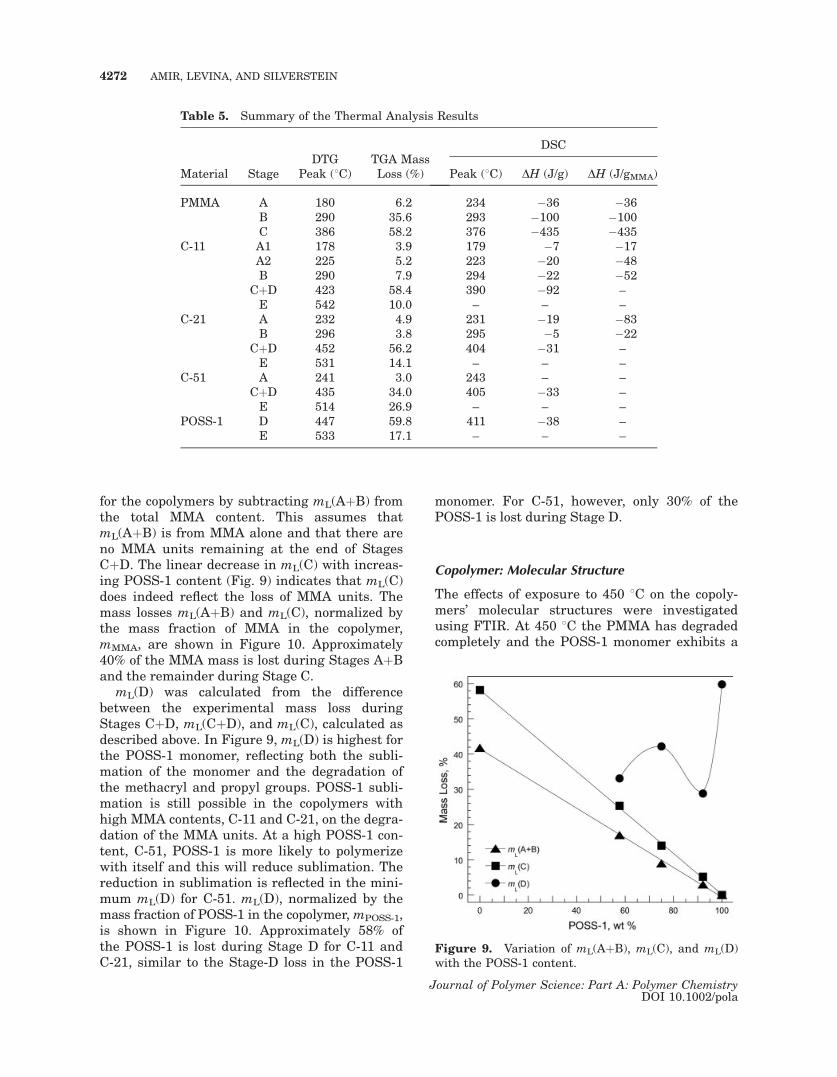
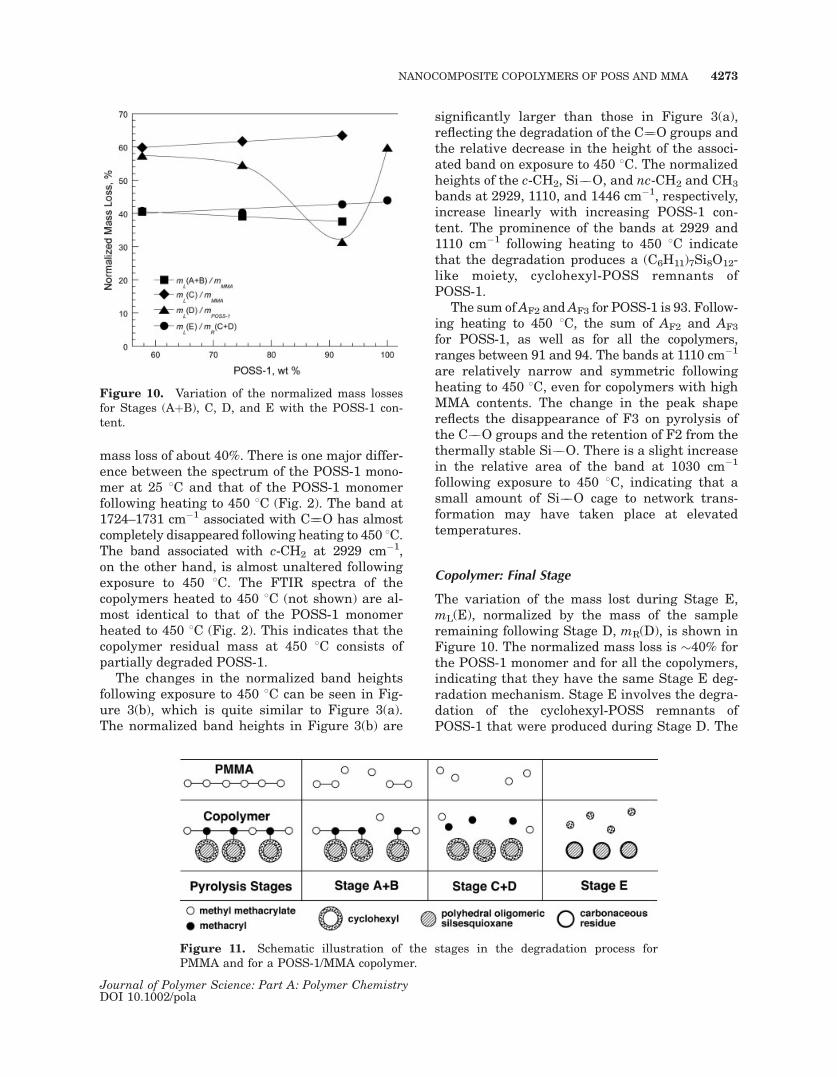
for the copolymers by subtracting mL(AþB) fromthe total MMA content. This assumes thatmL(AþB) is from MMA alone and that there areno MMA units remaining at the end of StagesCþD. The linear decrease in mL(C) with increas-ing POSS-1 content (Fig. 9) indicates that mL(C)does indeed reflect the loss of MMA units. Themass losses mL(AþB) and mL(C), normalized bythe mass fraction of MMA in the copolymer,mMMA, are shown in Figure 10. Approximately40% of the MMA mass is lost during Stages AþBand the remainder during Stage C.
mL(D) was calculated from the differencebetween the experimental mass loss duringStages CþD, mL(CþD), and mL(C), calculated asdescribed above. In Figure 9, mL(D) is highest forthe POSS-1 monomer, reflecting both the subli-mation of the monomer and the degradation ofthe methacryl and propyl groups. POSS-1 subli-mation is still possible in the copolymers withhigh MMA contents, C-11 and C-21, on the degra-dation of the MMA units. At a high POSS-1 con-tent, C-51, POSS-1 is more likely to polymerizewith itself and this will reduce sublimation. Thereduction in sublimation is reflected in the mini-mum mL(D) for C-51. mL(D), normalized by themass fraction of POSS-1 in the copolymer, mPOSS-1,is shown in Figure 10. Approximately 58% ofthe POSS-1 is lost during Stage D for C-11 andC-21, similar to the Stage-D loss in the POSS-1
monomer. For C-51, however, only 30% of thePOSS-1 is lost during Stage D.
Copolymer: Molecular Structure
The effects of exposure to 450 8C on the copoly-mers’ molecular structures were investigatedusing FTIR. At 450 8C the PMMA has degradedcompletely and the POSS-1 monomer exhibits a
Table 5. Summary of the Thermal Analysis Results
Material StageDTG
Peak (8C)TGA MassLoss (%)
DSC
Peak (8C) DH (J/g) DH (J/gMMA)
PMMA A 180 6.2 234 �36 �36B 290 35.6 293 �100 �100C 386 58.2 376 �435 �435
C-11 A1 178 3.9 179 �7 �17A2 225 5.2 223 �20 �48B 290 7.9 294 �22 �52
CþD 423 58.4 390 �92 –E 542 10.0 – – –
C-21 A 232 4.9 231 �19 �83B 296 3.8 295 �5 �22
CþD 452 56.2 404 �31 –E 531 14.1 – – –
C-51 A 241 3.0 243 – –CþD 435 34.0 405 �33 –E 514 26.9 – – –
POSS-1 D 447 59.8 411 �38 –E 533 17.1 – – –
Figure 9. Variation of mL(AþB), mL(C), and mL(D)with the POSS-1 content.
4272 AMIR, LEVINA, AND SILVERSTEIN
Journal of Polymer Science: Part A: Polymer ChemistryDOI 10.1002/pola
mass loss of about 40%. There is one major differ-ence between the spectrum of the POSS-1 mono-mer at 25 8C and that of the POSS-1 monomerfollowing heating to 450 8C (Fig. 2). The band at1724–1731 cm�1 associated with C¼¼O has almostcompletely disappeared following heating to 450 8C.The band associated with c-CH2 at 2929 cm�1,on the other hand, is almost unaltered followingexposure to 450 8C. The FTIR spectra of thecopolymers heated to 450 8C (not shown) are al-most identical to that of the POSS-1 monomerheated to 450 8C (Fig. 2). This indicates that thecopolymer residual mass at 450 8C consists ofpartially degraded POSS-1.
The changes in the normalized band heightsfollowing exposure to 450 8C can be seen in Fig-ure 3(b), which is quite similar to Figure 3(a).The normalized band heights in Figure 3(b) are
significantly larger than those in Figure 3(a),reflecting the degradation of the C¼¼O groups andthe relative decrease in the height of the associ-ated band on exposure to 450 8C. The normalizedheights of the c-CH2, Si��O, and nc-CH2 and CH3
bands at 2929, 1110, and 1446 cm�1, respectively,increase linearly with increasing POSS-1 con-tent. The prominence of the bands at 2929 and1110 cm�1 following heating to 450 8C indicatethat the degradation produces a (C6H11)7Si8O12-like moiety, cyclohexyl-POSS remnants ofPOSS-1.
The sum ofAF2 andAF3 for POSS-1 is 93. Follow-ing heating to 450 8C, the sum of AF2 and AF3
for POSS-1, as well as for all the copolymers,ranges between 91 and 94. The bands at 1110 cm�1
are relatively narrow and symmetric followingheating to 450 8C, even for copolymers with highMMA contents. The change in the peak shapereflects the disappearance of F3 on pyrolysis ofthe C��O groups and the retention of F2 from thethermally stable Si��O. There is a slight increasein the relative area of the band at 1030 cm�1
following exposure to 450 8C, indicating that asmall amount of Si��O cage to network trans-formation may have taken place at elevatedtemperatures.
Copolymer: Final Stage
The variation of the mass lost during Stage E,mL(E), normalized by the mass of the sampleremaining following Stage D, mR(D), is shown inFigure 10. The normalized mass loss is �40% forthe POSS-1 monomer and for all the copolymers,indicating that they have the same Stage E deg-radation mechanism. Stage E involves the degra-dation of the cyclohexyl-POSS remnants ofPOSS-1 that were produced during Stage D. The
Figure 10. Variation of the normalized mass lossesfor Stages (AþB), C, D, and E with the POSS-1 con-tent.
Figure 11. Schematic illustration of the stages in the degradation process forPMMA and for a POSS-1/MMA copolymer.
NANOCOMPOSITE COPOLYMERS OF POSS AND MMA 4273
Journal of Polymer Science: Part A: Polymer ChemistryDOI 10.1002/pola
degradation of such remnants to SiO2 shouldyield a mL(E)/mR(D) of around 52%. However,mL(E)/mR(D), at around 40%, is significantlysmaller. This indicates that around 20% of the re-sidual mass is not SiO2.
The POSS-1 monomer residue from Stage Eyields a C:Si:O mole ratio of 1.67:1.00:2.18 (lowresolution XPS). The presence of carbon indicatesthe formation of a carbonaceous residue from thedegradation of the cyclohexyl groups. The highresolution XPS C1s spectrum (not shown) exhibitsa main C��C peak at 285.0 eV and a distinctpeak at 288.9 eV that is ascribed to carboxylgroups, indicating the formation of an oxidizedcarbonaceous residue. The presence of an oxi-dized carbonaceous residue also accounts for theSi:O ratio larger than the 1:2 expected from theformation of SiO2. Based on the C:Si:O ratio,around 75 wt % of the residual mass is SiO2,while the remainder is an oxidized carbonaceousresidue.
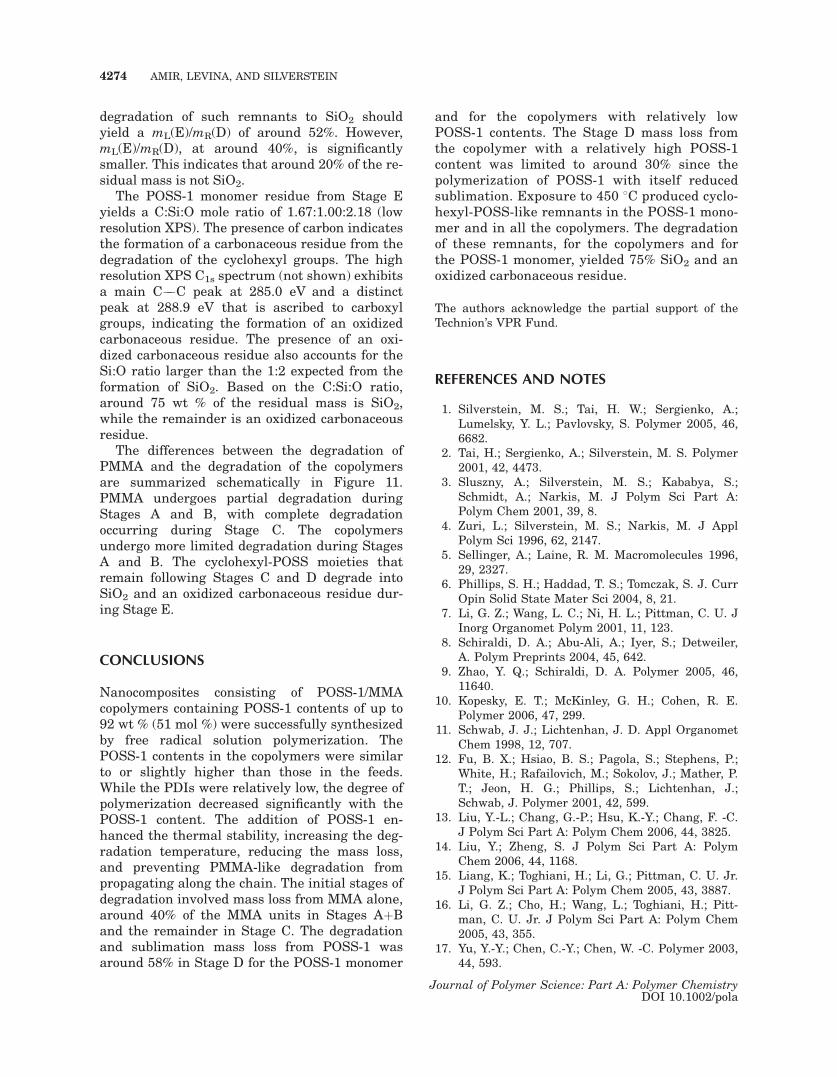
The differences between the degradation ofPMMA and the degradation of the copolymersare summarized schematically in Figure 11.PMMA undergoes partial degradation duringStages A and B, with complete degradationoccurring during Stage C. The copolymersundergo more limited degradation during StagesA and B. The cyclohexyl-POSS moieties thatremain following Stages C and D degrade intoSiO2 and an oxidized carbonaceous residue dur-ing Stage E.
CONCLUSIONS
Nanocomposites consisting of POSS-1/MMAcopolymers containing POSS-1 contents of up to92 wt % (51 mol %) were successfully synthesizedby free radical solution polymerization. ThePOSS-1 contents in the copolymers were similarto or slightly higher than those in the feeds.While the PDIs were relatively low, the degree ofpolymerization decreased significantly with thePOSS-1 content. The addition of POSS-1 en-hanced the thermal stability, increasing the deg-radation temperature, reducing the mass loss,and preventing PMMA-like degradation frompropagating along the chain. The initial stages ofdegradation involved mass loss from MMA alone,around 40% of the MMA units in Stages AþBand the remainder in Stage C. The degradationand sublimation mass loss from POSS-1 wasaround 58% in Stage D for the POSS-1 monomer
and for the copolymers with relatively lowPOSS-1 contents. The Stage D mass loss fromthe copolymer with a relatively high POSS-1content was limited to around 30% since thepolymerization of POSS-1 with itself reducedsublimation. Exposure to 450 8C produced cyclo-hexyl-POSS-like remnants in the POSS-1 mono-mer and in all the copolymers. The degradationof these remnants, for the copolymers and forthe POSS-1 monomer, yielded 75% SiO2 and anoxidized carbonaceous residue.
The authors acknowledge the partial support of theTechnion’s VPR Fund.
REFERENCES AND NOTES
1. Silverstein, M. S.; Tai, H. W.; Sergienko, A.;Lumelsky, Y. L.; Pavlovsky, S. Polymer 2005, 46,6682.
2. Tai, H.; Sergienko, A.; Silverstein, M. S. Polymer2001, 42, 4473.
3. Sluszny, A.; Silverstein, M. S.; Kababya, S.;Schmidt, A.; Narkis, M. J Polym Sci Part A:Polym Chem 2001, 39, 8.
4. Zuri, L.; Silverstein, M. S.; Narkis, M. J ApplPolym Sci 1996, 62, 2147.
5. Sellinger, A.; Laine, R. M. Macromolecules 1996,29, 2327.
6. Phillips, S. H.; Haddad, T. S.; Tomczak, S. J. CurrOpin Solid State Mater Sci 2004, 8, 21.
7. Li, G. Z.; Wang, L. C.; Ni, H. L.; Pittman, C. U. JInorg Organomet Polym 2001, 11, 123.
8. Schiraldi, D. A.; Abu-Ali, A.; Iyer, S.; Detweiler,A. Polym Preprints 2004, 45, 642.
9. Zhao, Y. Q.; Schiraldi, D. A. Polymer 2005, 46,11640.
10. Kopesky, E. T.; McKinley, G. H.; Cohen, R. E.Polymer 2006, 47, 299.
11. Schwab, J. J.; Lichtenhan, J. D. Appl OrganometChem 1998, 12, 707.
12. Fu, B. X.; Hsiao, B. S.; Pagola, S.; Stephens, P.;White, H.; Rafailovich, M.; Sokolov, J.; Mather, P.T.; Jeon, H. G.; Phillips, S.; Lichtenhan, J.;Schwab, J. Polymer 2001, 42, 599.
13. Liu, Y.-L.; Chang, G.-P.; Hsu, K.-Y.; Chang, F. -C.J Polym Sci Part A: Polym Chem 2006, 44, 3825.
14. Liu, Y.; Zheng, S. J Polym Sci Part A: PolymChem 2006, 44, 1168.
15. Liang, K.; Toghiani, H.; Li, G.; Pittman, C. U. Jr.J Polym Sci Part A: Polym Chem 2005, 43, 3887.
16. Li, G. Z.; Cho, H.; Wang, L.; Toghiani, H.; Pitt-man, C. U. Jr. J Polym Sci Part A: Polym Chem2005, 43, 355.
17. Yu, Y.-Y.; Chen, C.-Y.; Chen, W. -C. Polymer 2003,44, 593.
4274 AMIR, LEVINA, AND SILVERSTEIN
Journal of Polymer Science: Part A: Polymer ChemistryDOI 10.1002/pola
18. Liu, Y.-L.; Hsu, C.-Y.; Hsu, K.-Y. Polymer 2005,46, 1851.
19. Zheng, L.; Kasi, R. M.; Farris, R. J.; Coughlin, E. B.J Polym Sci Part A: Polym Chem 2002, 40, 885.
20. Zheng, L.; Farris, R. J.; Coughlin, E. B. Macromo-lecules 2001, 34, 8034.
21. Romo-Uribe, A.; Mather, P. T.; Haddad, T. S.;Lichtenhan, J. D. J Polym Sci Part B: PolymPhys 1998, 36, 1857.
22. Xu, H.; Yang, B.; Wang, J.; Guang, S.; Li, C. Mac-romolecules 2005, 38, 10455.
23. Zheng, L.; Farris, R. J.; Coughlin, E. B. J PolymSci Part A: Polym Chem 2001, 39, 2920.
24. Gonzalez, R. I.; Phillips, S. H.; Hoflund, G. B. JSpacecr Rockets 2000, 37, 463.
25. Lumelsky, Y.; Silverstein, M. S. J Mater Sci 2006,41, 8202.
26. Dubinsky, S.; Lumelsky, Y.; Grader, G. S.; Shter,G. E.; Silverstein, M. S. J Polym Sci Part B:Polym Phys 2005, 43, 1168.
27. Silverstein, M. S.; Najary, Y.; Grader, G. S.; Shter, G.E. J Polym Sci Part B: Polym Phys 2004, 42, 1023.
28. Sherwood, P. M. A. In Practical Surface Analysis,2nd ed.; Briggs, D.; Seah, M. P., Eds.; Wiley: NewYork, 1990; pp 573–574.
29. Tonelli, A. E. NMR Spectroscopy and PolymerMicrostructure; VCH: New York, 1989; pp 26–27.
30. Wang, G.; Zhu, X.; Cheng, Z.; Zhu, J. Eur PolymJ 2003, 39, 2161.
31. Streitwieser, A.; Heathcock, C. H.; Kosower, E. M.Introduction to Organic Chemistry, 4th ed.; Mac-millan: New York, 1992.
32. Haddad, T. S.; Lichtenhan, J. D. Macromolecules1996, 29, 7302.
33. Hirata, T.; Kashiwagi, T.; Brown, J. E. Macromo-lecules 1985, 18, 1410.
34. Kashiwagi, T.; Hirata, T.; Brown, J. E. Macromo-lecules 1985, 18, 131.
35. Manring, L. E. Macromolecules 1991, 24, 3304.36. Jellinek, H. H. G. Degradation of Vinyl Polymers;
Academic Press: New York, 1955.37. Kashiwagi, T.; Inaba, A.; Brown, J. E.; Hatada,
K.; Kitayama, T.; Masuda, E. Macromolecules1986, 19, 2160.
38. Peterson, J. D.; Vyazovkin, S.; Wight, C. A. Mac-romol Rapid Commun 1999, 20, 480.
39. Mantz, R. A.; Jones, P. F.; Chaffee, K. P.; Lichten-han, J. D.; Gilman, J. W.; Ismail, I. M. K.; Bur-meister, M. J. Chem Mater 1996, 8, 1250.
NANOCOMPOSITE COPOLYMERS OF POSS AND MMA 4275
Journal of Polymer Science: Part A: Polymer ChemistryDOI 10.1002/pola


![compound and polyhedral oligomeric silsesquioxane reagents ... · case of the Airbus A350 and Boeing 787 which comprise up to 50 % composite by volume [2,3]. ... using mortar and](https://cdn.vdocuments.mx/doc/165x107/5e80f009fe5c3b23ed1a644d/compound-and-polyhedral-oligomeric-silsesquioxane-reagents-case-of-the-airbus.jpg)

