
Muscle-plotter: an Interactive System based on Electrical
Muscle Stimulation that Produces Spatial OutputPedro Lopes
1, Doğa Yüksel
1, François Guimbretière
1,2, and Patrick Baudisch
1
1 Hasso Plattner Institute Potsdam, Germany
{firstname.lastname}@hpi.de
2 Cornell University, Information Science Ithaca, NY 14850, USA [email protected]
ABSTRACT
We explore how to create interactive systems based on
electrical muscle stimulation that offer expressive output.
We present muscle-plotter, a system that provides users
with input and output access to a computer system while on
the go. Using pen-on-paper interaction, muscle-plotter allows users to engage in cognitively demanding activities,
such as writing math. Users write formulas using a pen and
the system responds by making the users’ hand draw charts
and widgets. While Anoto technology in the pen tracks
users’ input, muscle-plotter uses electrical muscle stimula-
tion (EMS) to steer the user’s wrist so as to plot charts, fit
lines through data points, find data points of interest, or fill
in forms. We demonstrate the system at the example of six
simple applications, including a wind tunnel simulator.
The key idea behind muscle-plotter is to make the user’s
hand sweep an area on which muscle-plotter renders
curves, i.e., series of values, and to persist this EMS output
by means of the pen. This allows the system to build up a
larger whole. Still, the use of EMS allows muscle-plotter to
achieve a compact and mobile form factor. In our user
study, muscle-plotter made participants draw random plots
with an accuracy of ±4.07 mm and preserved the frequency
of functions to be drawn up to 0.3 cycles per cm.
Keywords: electrical muscle stimulation; spatial; haptics;
ACM Classification: H.5.2 [Information interfaces and
presentation]: User Interfaces: Input Devices and Strate-
gies, Interaction Styles.
INTRODUCTION
Interactive systems based on electrical muscle stimulation
(EMS) actuate users by sending an electric signal to muscle
fibers and motor neurons through electrodes attached to the
skin. The possessed hand [29], for example, used this
technique to assist users while learning the finger poses
required to play an instrument.
The main strength of EMS is that the resulting systems miniaturize well, thus lend themselves well to mobile use
(mobile gaming [16]) or wearable use (pedestrian cruise
control [23]). A second key strength is their ability to
implement input/output interactions that use the same
modality (i.e., symmetric interaction [25]) by using the
same gesture language for input and output [17].
Unfortunately, the price for these benefits is that the inter-
active EMS systems presented so far lack expressiveness. Existing interactive EMS systems output a single 1D output
variable, such as screen tilt [16] or wrist tilt [17] or one of
n behaviors [18]. Since subsequent output overwrites earli-
er output, users never see more than a single value.
Figure 1: An interactive wind tunnel simulation with pen
input and output—based on EMS. The user jotted down the
word “wind tunnel”, set down the pen left of the car, and
started to drag it towards the car sketch. In response, muscle-
plotter computed this particular streamline in the context of
the car sketch and is now stimulating the user’s wrist so as to
plot this streamline.
In this paper, we explore how to create more expressive
EMS-based systems. Muscle-plotter achieves this by per-
sisting EMS output, allowing the system to build up a larg-
er whole. More specifically, (1) muscle-plotter spreads out
the 1D signal produced by EMS over a 2D surface by steer-
ing the user's wrist, while the user drags their hand across
the surface. Rather than repeatedly updating a single value,
this renders many values into curves. (2) By adding the pen,
we persist this signal, allowing the system to build up a
larger display, which in turn enables longer and more
meaningful interactions.
MUSCLE-PLOTTER
Muscle-plotter is a closed-loop EMS system. It allows
users to enter information into a computer system by writ-
user requests a wind-tunnel simulation of car sketches
by writing with anoto pen
muscle-plotter draws the wind streamlines by actuating
the user’s wrist with electrical muscle stimulation
Permission to make digital or hard copies of all or part of this work for personal or classroom use is granted without fee provided that copies are not made or distributed for profit or commercial advantage and that copies bear this notice and the full citation on the first page. Copyrights for com-
ponents of this work owned by others than the author(s) must be honored. Abstracting with credit is permitted. To copy otherwise, or republish, to post on servers or to redistribute to lists, requires prior specific permission
and/or a fee. Request permissions from [email protected]. UIST '16, October 16 - 19, 2016, Tokyo, Japan Copyright is held by the owner/author(s). Publication rights licensed to
ACM. ACM 978-1-4503-4189-9/16/10…$15.00 DOI: http://dx.doi.org/10.1145/2984511.2984530
ing using an Anoto pen and it allows the computer system
to respond by making the user plot. Muscle-plotter accom-
plishes this by actuating the user’s hand that is holding the
pen by means of a medical-grade computer-controllable
electrical muscle stimulator.
Walkthrough
We think of muscle-plotter as a tool for mobile sense-
making in that it allows users to interact (input and output) with an intelligent backend.
Figure 1 shows an example of such a use case. Here, a car
designer is iterating on the body of a new car, sketching it
and analyzing implications of its design on the car’s aero-
dynamics. The designer wrote “wind tunnel” onto the paper
and has drawn crop marks around the car. Since the user
does so using a pen that offers built-in tracking (Anoto [1]), muscle-plotter “sees” this input. It recognizes the handwrit-
ing using a handwriting recognizer (Tesseract [30]) and
forwards its output to a wind tunnel simulator running in
our custom backend. The system computes the wind veloci-
ty field and makes it available to the pen frontend.
To plot the streamlines, this designer moves the hand to the
left of the car sketch and sets down the pen. As the pen
enters the wind tunnel simulator’s bounding box, mus-cle-plotter starts sending electrical impulses to the user’s
wrist, which from now on continuously actuate the user’s
wrist. While the user moves the hand horizontally across
the paper, muscle-plotter controls the hand’s vertical posi-
tion using a closed-loop control, resulting in plotted stream-
lines. Repeating this process produces a field of stream-
lines, allowing the user to judge the aerodynamic behavior
of the current car design.
Continuing the example from Figure 1, the designer is now
contemplating whether the car should have a shorter rear
and a rear door, also known as a hatchback. In Figure 2, the
designer sketches one possible hatchback design and by
having muscle-plotter draw streamlines on this new design,
investigates what implications the change in body shape
may have on the car’s on aerodynamics.
Figure 2: (a) Selecting which sketches to simulate in the wind
tunnel by drawing two crop marks. (b) The simulation out-
puts by actuating the user’s muscles as to plot the streamlines.
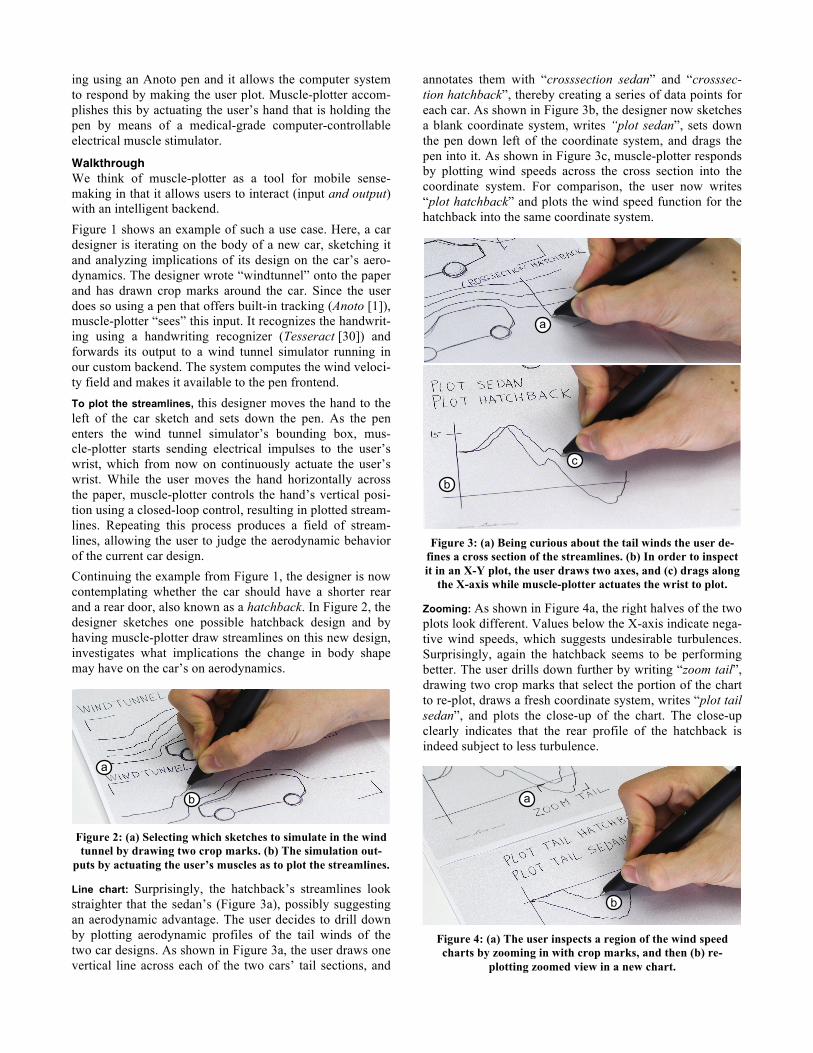
Line chart: Surprisingly, the hatchback’s streamlines look
straighter that the sedan’s (Figure 3a), possibly suggesting
an aerodynamic advantage. The user decides to drill down
by plotting aerodynamic profiles of the tail winds of the
two car designs. As shown in Figure 3a, the user draws one
vertical line across each of the two cars’ tail sections, and
annotates them with “crosssection sedan” and “crosssec-
tion hatchback”, thereby creating a series of data points for
each car. As shown in Figure 3b, the designer now sketches
a blank coordinate system, writes “plot sedan”, sets down
the pen down left of the coordinate system, and drags the
pen into it. As shown in Figure 3c, muscle-plotter responds by plotting wind speeds across the cross section into the
coordinate system. For comparison, the user now writes
“plot hatchback” and plots the wind speed function for the
hatchback into the same coordinate system.
Figure 3: (a) Being curious about the tail winds the user de-
fines a cross section of the streamlines. (b) In order to inspect
it in an X-Y plot, the user draws two axes, and (c) drags along
the X-axis while muscle-plotter actuates the wrist to plot.
Zooming: As shown in Figure 4a, the right halves of the two
plots look different. Values below the X-axis indicate nega-
tive wind speeds, which suggests undesirable turbulences.
Surprisingly, again the hatchback seems to be performing
better. The user drills down further by writing “zoom tail”,
drawing two crop marks that select the portion of the chart
to re-plot, draws a fresh coordinate system, writes “plot tail
sedan”, and plots the close-up of the chart. The close-up
clearly indicates that the rear profile of the hatchback is
indeed subject to less turbulence.
Figure 4: (a) The user inspects a region of the wind speed
charts by zooming in with crop marks, and then (b) re-
plotting zoomed view in a new chart.
a
b
a
b
c
a
b

Scale widget: Finally, the user wonders whether the im-
proved turbulences will really manifest themselves in lower
wind resistance; hence better gas mileage. In Figure 5a, the
user writes “plot drag” and (b) selects the car sketch by
drawing a pigtail on it. Then the user draws a vertical line,
labels the line’s ends “0” and “1”, and traces the line using the pen. (c) Half way in the line, the system whips the us-
er’s hand sideways, creating a tick mark on the line, repre-
senting the drag coefficient of the sedan design. The user
now selects the hatchback design by drawing a pigtail into
it and plots the drag coefficient of the hatchback onto the
line. The hatchback’s drag coefficient is indeed smaller
than the sedan’s, which implies that this particular hatch-
back design can actually be expected to offer more gas
mileage that the sedan.
Figure 5: The user inspects the drag coefficient of the car by
(a) writing the command and sketching a vertical line, and (b)
selecting the desired car with a pigtail. Then, the (c) the sys-
tem outputs the value as a tick-mark to the right as the user
traces the line.
Other Application Scenarios
As discussed earlier, we think of muscle-plotter as a tool
for sensemaking activities. To emphasize this point, here
are 5 other scenarios we have enabled using muscle-plotter:
Application 2: Solving Mathematical Exercises. Figure 6 de-
picts how a user interacts with Octave (software running in
the backend) to solve mathematical problems through pen
and paper.
Figure 6: (a) Plotting a fifth degree polynomial and (b) query-
ing where its integral totals 2 units.
In Figure 6a, the user first plots a fifth degree polynomial.
Using the notation “f(x)=…” the polynomial is saved for
future reuse as f(x). Then (b) the user queries for the point
in which the integral of f(x) totals 2 by writing “integral
f(x)=2” followed by a question mark. The answer is given
as a tick mark while the user traces the X-axis.
Application 3: RC Circuit Simulator. Figure 7 depicts our
simple filter design application built around first-order RC
filters.
Figure 7: Iterating through the design of a high-pass RC filter
(a) by scribbling the old value a user can input a new capaci-
tor value and then (b) re-plot the filter response.
Figure 7 shows a user iteratively exploring different filter designs by observing their frequency response. The user
first defines the R (resistance) and C (capacitance) values
and the filter type and plots the filter’s frequency response
using muscle-plotter’s line chart. (a) Unhappy with the
filter, the user scribbles the capacitor value and writes a
new one. (b) Muscle-plotter re-computes the frequency
response and outputs it to the user in the line chart. The
new filter now high-passes around 50 Hz.
Application 4: Interacting with Forms. Now we demonstrate a
user interacting with a simple form in order to configure
muscle-plotter’s stimulation parameters.
Figure 8: Simple form widgets for quick queries in muscle-
plotter: (a) a multiple checkbox and (b) a radio button.
In Figure 8a, the user queries which channels are active by writing “channel” followed by “?”, then creates a list of
channel names (each in square brackets). While the user
traces the options, muscle-plotter outputs a tick mark on
those that are active. The user decides to activate the brake
channel, by crossing its checkbox. Now, in Figure 8b, the
user repeats the same procedure on a radio button to adjust
the intensity of the “brake” stimulation. Lastly, in Figure
8c, the user adjusts the power of the “brake” to medium.
Application 5: Fitting a Trend Line in Statistics. Figure 9 de-
picts our simple statistics application built around muscle-
plotter.
a
b
c
a
b
b
a
a
b
c

Figure 9: Working on statistics: (a) representing data as bars
and (b) fitting a linear regression.
In Figure 9, a user is exploring a dataset with sales arranged
by months. The user does so by plotting the sales in a bar
chart. This widget behaves similar to the line chart, except
that muscle-plotter outputs the tick-marks for the horizontal
axis as the user scans the axis. In Figure 9a, the user scans
vertically from each tick-mark and muscle-plotter outputs a
dash to the left and a pen up at the end of each bar. Lastly,
in Figure 9b, the user makes a prediction of the next month
sales by fitting a linear regression through the plot, which
muscle-plotter outputs as a line chart.
Application 6: Optical Lenses Simulator. Figure 10 depicts
our simple optics application that allows exploring how
rays of light refract in convex and concave lenses.
Figure 10: Using muscle-plotter to explore how rays of light
refract through convex and concave lenses.
In Figure 10, a user sketches a convex lens and explores
how the light rays refract through it. Muscle-plotter outputs
this by deviating the ray in a slope. Now the user wonders
about how to further defocus the resulting beam and draws
a concave lens to explore its refraction properties.
Summary of Widgets
We just saw six examples of interacting with muscle-plotter, each of which was implemented in the form of a
widget. Our widgets leverage pen-input techniques such as
crossing to select 1D primitives (CrossY [2]), underline and
crop marks (Papiercraft [15]), and a pigtail gesture to se-
lect 2D primitives (Scriboli [7]). All widgets output when
the user crosses into their boundaries. The output ends
when muscle-plotter stimulates the muscles that cause the
user to lift the pen’s tip from the paper. We now summarize
the set of widgets:
Line chart: The walkthrough contained three specialized
instances of the line chart widget, i.e., wind tunnel, the tail
profile plots and the zoomed plots. The line chart widget
supports the following interactions: zoom in/out by relabel-
ing the axes, zoom in by selecting with crop marks, fitting a
line through existing data points, performing operations on
data traces and re-plotting the results as a trace (e.g., deriv-
ative of a function). Also, the chart widget supports charts that do not start at the origin.
Scale Widget: The scale widget outputs a single value per
interaction, which is useful for comparing values. In case of
clustered values in the same scale, muscle-plotter will out-
put them by alternating the tick-marks to the left/right. In
the walkthrough and scenarios, we featured the scale widg-
et in: finding the drag-coefficient, finding an integral of a
function and plotting individual bars in a chart. Just as with the axes of a plot, the scale widget allows to redefine its
axis for zoom in/out. The scale widget is also used to allow
users to find whether a plot starts at the origin or crosses
the Y-axis. For this we insert a scale widget in the line
chart’s Y-axis, which the user scans to find a tick-mark
representing the plot’s starting point (e.g., in Figure 3).
Radio button: The radio button allows selecting one option out of a range or receiving output from the option that is
active. This can also be used for a yes/no dialog, which is
useful when asking simple questions to muscle-plotter
(e.g., to check if a number is prime). In the examples
above, we demonstrated this widget at the example of a
user configuring the intensity of an EMS channel.
Checkbox: The checkbox is an extension of the radio button
that allows for multiple choices to be active. This widget is useful for finding elements in lists such as options in a
combo box. We demonstrated it at the example of a user
querying which EMS channels are currently active.
CONTRIBUTION, BENEFITS, AND LIMITATIONS
Our main contribution with muscle-plotter is that it takes
electrical muscle stimulation interfaces to the next level by
demonstrating interactions that render significantly more
complex data than previous EMS-based systems. The key
idea behind it is to make the user’s hand sweep an area on
which muscle-plotter renders curves, i.e., series of values,
resulting in more information than that conveyed by a
single actuated pose.
By allowing EMS to produce spatial output, muscle-plotter
enables a range of sensemaking activities, as we illustrated
at the example of several scenarios, including the
aerodynamics scenario at the beginning of our paper.
In the process of creating muscle-plotter, we developed a number of EMS-related techniques. (1) To quickly actuate
the user’s wrist (instead of merely informing the user where
and when to turn), we simultaneously actuate pairs of
opposing wrist muscles, resulting in a more controlled
motion. (2) We compensate for latency introduced by the
Anoto tracking system (around 90 ms) by extrapolating pen
positions. (3) In order to turn around sharper angles, we
slow down the user’s wrist. We achieve this by actuating
the flexor carpi ulnaris muscle. This causes this muscle to
push the pen against the paper, increasing friction, and
slowing the hand down. (4) To mark the end of an output
b
a

trace, we actuate the user’s wrist upwards, hence lifting the
pen’s tip away from the paper.
On the flipside, like any solution based on electrical muscle
stimulation, muscle-plotter requires placing electrodes,
calibration and recalibration if the muscles fatigue over
time [10]. Furthermore, since we actuate the user’s wrist
only (rather than wrist and shoulder) our system is limited
in terms of the shapes it can output through the user’s hand.
IMPLEMENTATION
The muscle-plotter system is comprised of a wireless Ano-
to digitizer pen & paper [1] for input, as well as a
HASOMED medically compliant 8-channel portable EMS
stimulator [6] for output. Muscle-plotter utilizes 4 channels
of the EMS stimulator at 200 Hz. This EMS stimulator is
powered using a battery and interfaces with muscle-plotter via USB. This allows our prototype to run based on a lap-
top computer with a USB Bluetooth 4.0 dongle and a USB
connection. While our current version is merely portable, a
wearable signal generator such as the one proposed in Pro-
prioceptive Interaction [17] could make muscle-plotter
mobile.
To help readers replicate our prototype, we now provide a
detailed description of its implementation. Also, we pro-vide muscle-plotter’s source code1 for replicating the ex-
periments under an open-source license.
Electrode Placement
Muscle-plotter controls four muscle groups, each responsi-
ble for a different axis of motion as depicted in Figure 11:
(a) The extensor carpi radialis brevis and partially the
flexor digitorum move the pen to the right (assuming a
right-handed user), while the extensor carpi radialis longus
lifts the pen tip away from the paper. (b) The flexor carpi
radialis moves the pen to the left, while the flexor carpi
ulnaris pushes the pen down into the paper, acting as a
“brake” to prevent oscillations or improve straight lines.
Figure 11: Electrode placement to perform (a) pen right, pen
up, (b) pen left, and pen down (i.e., “brake”) movements.
Calibration Procedure
Muscle-plotter uses a three-step calibration procedure:
1. Comfortable use: By slowly increasing the intensity, we
first determine the minimum value required to actuate the
user’s muscles. Then, we find the maximum intensity (in
mA) and pulse width (in µs) that feel comfortable and pain-
free.
1 http://hpi.de/baudisch/projects/muscleplotter.html
2. Drawing slanted lines: Users start by trying to draw a
straight line onto the paper. At a random position along the
way, muscle-plotter actuates their wrist, turning the re-
mainder of the user’s line into a slanted line. By performing
this step repeatedly with varying pulse widths, the calibra-
tion routine determines the pulse widths that produce 20, 40 and 60-degree slants to the left and to the right.
3. Drawing straight lines: Users draw slanted lines, as in the
previous step. When they reached a second random point
along the way, the system actuates them to draw a straight
line. By performing this step repeatedly with varying pulse
widths, the calibration routine determines two pulse widths
that return the user’s hand to drawing a straight line.
Figure 12 depicts the average pulse widths determined by
means of this calibration routine for all users in our exper-
iment. Similarly, the calibration routine determined that the
extensor muscle should be actuated using an average inten-
sity of 10.3 mA (SD = 1.3 mA) and the flexor muscle using
an average of 8 mA (SD = 0.5 mA).
Figure 12: Average pulse width per slant, for both extensor
and flexor muscles, for all participants of our experiment.
Control Loop & Model of the Wrist
The purpose of muscle-plotter’s control loop is to actuate
the wrist to reach a target as quickly as possible, yet with-
out overshooting. The main algorithm receives the tracking
data asynchronously (i.e., the X/Y location of the Anoto
pen in coordinate system of the paper). It then re-evaluates
the situation and picks one of three possible strategies: aim
for a target, compensate if the user is constantly lagging behind the target trace, or brake. The loop executes this
strategy by sending electrical impulses to the user’s wrist
muscles. In the following, we look into the each of these
steps in detail.
1. Receiving pen location data: The communication between
the Anoto Windows API (from we’inspire2) and muscle-
plotter is done via Open Sound Control (OSC). Each OSC packet is sent to muscle-plotter’s Python server. It encapsu-
lates an X/Y position, an event type (pen up, pen down or
2 http://we-inspire.com
pen down: flexor carpi ulnaris
pen left: flexor carpi radialis
pen up: extensor carpi radialis
pen right: extensor carpi radialis
and flexor digitorum
a b

pen drag), and a timestamp. We found the latency of this
operation to be below 1 ms for both loopback and Ethernet.
2. Evaluating the current strategy: Our system aims for the
most likely target, which may not necessarily be the closest
one. It determines the most likely target by extrapolating
the current location based on the current speed, as depicted
in Figure 13. This approach allows the system to cope with
differences in hand movement velocities and with the Ano-
to tracking latency (around 90 ms, determined using a high-
speed camera).
Figure 13: Key principles in muscle-plotter’s control loop.
Then, for every decision cycle the system evaluates if the
user is: (a) close to a plausible target or (b) consistently
lagging behind the target trace or (c) approaching the target
at a high speed with a chance of overshooting. According-
ly, it performs one of the following three responses.
Strategy (a): aim for a target. In order to reach a target, mus-
cle-plotter computes the slant between the target and the
current estimated location (Figure 13). Then, according to
this slant, muscle-plotter finds a pair of pulse widths that is
the closest to the pre-calibrated slants from the user’s cali-
bration dataset. Muscle-plotter actuates the wrist by apply-
ing a simultaneous signal to both sides of the wrist. We found this to allow for smoother control than when actuat-
ing just one side at a time. This is particularly important if
the user’s dragging speed is fast.
Strategy (b): compensate for wrist lagging behind. If the ac-
cumulated error (i.e., sum of all distances to previous tar-
gets) exceeds 20 mm we consider that the user is lagging
behind. To compensate, we dynamically increase the inten-
sity of the muscle that moves the pen closer to the target in 1 mA steps (up to 2 mA). Finally, we reset the accumulated
error and disable the intensity boost when the user’s trace
crosses again with the target trace.
Strategy (c): brake. If the user approaches a target too fast,
there’s a risk of overshooting. If the system observes the
user’s hand approaching the target at increasing speed and
if is less than 3.3 mm away, the system “brakes” the user’s
wrist. By actuating the muscles that push the wrist into the paper, the system increases the friction between pen and
paper, hence slowing the pen’s tip down. The brake strate-
gy is also particularly useful for improving the performance
of straight lines and to prevent undesired oscillations.
3. Executing the current strategy: Muscle-plotter executes
one of the strategies by sending the electrical impulses to
the user’s wrist. This is done in a separate thread, which allows it to keep a constant stimulation frequency of
200 Hz. To achieve precise control, muscle-plotter controls
the pulse width (from 20 µs to 500 µs) of the waveform
rather than the amplitude. Changing the amplitude is only
used while the user is lagging behind, i.e., strategy (b).
Lastly, to terminate the current output trace, muscle-plotter
moves the tip of the pen away from the paper by actuating
the user’s wrist upwards.
Heuristics used in the Control Loop
To avoid muscle-plotter from overshooting the target we
hand-tuned the main loop’s parameters as follows.
The 20 mm threshold is sufficient to detect when the user is lagging behind without producing oscillation effects. If this
value is heavily decreased (e.g., 2 mm) the automatic com-
pensation in intensity will create unwanted oscillations.
The 3.3 mm braking distance provides sufficient braking
distance to avoid overshooting. We found that the braking
technique is most efficient if initiated at least 2 mm away
from the target, otherwise the system tends to overshoot.
Our brake implementation uses 11 to 44 impulses depend-
ing on the user's speed. We found that when the user ap-
proaches slowly (e.g., around 3.3 mm/s) 11 impulses are
sufficient to halt the trajectory without undershooting.
Intuitively, when the user’s speed increases we increase the
brake impulses; we found that 44 pulses allows us to brake
before the target (no overshoot) at speeds up to 10 cm/s.
Computing Geometry for Widget Interaction
The geometry computed in muscle-plotter uses OpenCV
via Python bindings. For instance, line chart widgets start when the user draws two axes that intersect one another.
This is calculated as the cross product of two fitted lines
between the two drawn axes. Likewise, the two crop marks
that define the wind tunnel widget are detected using the
same method for each; the perpendicular lines determine
the wind tunnel dimensions. Lastly, for the cross-section
and scale widget, the user drawn lines are fitted with a line.
Handwriting Recognition using Tesseract
To recognize hand-written input, we integrated Tesser-
act [30], a trained recognizer with several languages and
one of the most robust open-source optical character recog-
nizers (OCR) [4]. Our system loads only the English lan-
guage and common symbols such as “?”, “(“, etc. Before applying Tesseract to the user’s strokes we: (1) concatenate
all strokes that are less than 3 mm apart from their center
(enables multi-stroke writing). (2) Interpolate the points
from the Anoto tracking to complete a line. (3) Convert to a
black and white image for OCR. (4) If the next stroke is
more than 1 cm apart, the previous strokes are grouped into
a command keyword and evaluated with the OCR. (5) After
a command keyword is detected, we evaluate the incoming
strokes character by character; this allows to directly write
commands such as “PLOT F(X)=SIN(X)”.
Once Tesseract returns the recognized text to muscle-
plotter, our system replaces it with the word from its cus-
tom keyword dictionary that is closest in terms of Le-
venshtein distance (edit distance). This corrects for com-
mon misrecognitions such as “L” for “(“ or “X” for “K”.

Application-specific Implementations
We now detail the implementations that are specific to each
of our applications.
Mathematical formulae manipulation & solvers. To solve mathematical formulas, we invoke Octave by means of its
Python bindings. We use it for mathematics (derivatives,
integrals, and so forth) and for plotting functions from
formulae. We interface muscle-plotter and Octave by:
(1) converting user-notation to Octave notation. When the
user writes “sin(x)”, for example, we convert it to “fe-
val((sin(x), <range-of-plot>)”; then, (2) send the formulae
to Octave, sample it into points and return it to muscle-
plotter; and, lastly, (3) transform these points to the Anoto
paper’s coordinates and into the user-defined axis.
RC-Filter Response. We implemented a simple solver for
high and low pass RC circuit filters. It works by solving the
filter equations directly in the frequency domain. The val-
ues for R and C are read from the users’ input when they
write “cap 10UF” (i.e., 10 µF) and “resistor 330” (in
Ohms).
Statistics Example. To perform statistical operations we use
Python’s Scipy Statistics package. This allows us to com-
pute standard deviations and regressions, which we use in a
simple demo application that draws a linear regression
through bar charts.
Optical lenses ray casting. The optics demonstration is a
simple 2D ray casting based on [31] that deals exclusively with concave and convex lenses. We disambiguate the lens
type by measuring the width of the lens’ middle section
against a fixed threshold (i.e., convex is wider).
Wind tunnel simulation. The wind tunnel simulation is based
on the Lattice-Boltzmann equations and adapted from
Schroeder’s implementation [13]. To run a wind tunnel
simulation (i.e., to compute the wind speed streamlines) we: (1) rotate the model according to the rotation of the
wind tunnel boundaries; (2) extract the shapes drawn in-
side; (3) down-sample these shapes (e.g., the car) into a
binary matrix of 200 px height; this matrix contains the
obstacles to the wind flow; (4) for 30 steps we execute
Lattice Boltzmann by advancing the streamlines one step at
a time and re-evaluating the collisions to compute the ve-
locity flow; (5) once the user draws a line, we use Python’s
Matplotlib streamlines function to obtain the streamline
that starts at the user’s pen-down position.
USER STUDY: VALIDATING OUR IMPLEMENTATION
To validate the mechanism behind muscle-plotter, i.e., the
production of spatial output using EMS, we conducted a user study. Our focus was on which types of signals can
muscle-plotter reproduce as is and which signals require
pre-processing. In the study, muscle-plotter actuated partic-
ipants to repeatedly draw curves and we measured how
closely these curves matched the intended target signal.
Task
For each trial, participants plotted one function onto paper
using muscle-plotter as depicted on Figure 14.
Figure 14: One trial: one plot (image from the study, with
consent of the participant).
In each trial, participants plotted one of eight mathematical
functions. Participants placed their hand on the left side of
the paper so as to point the pen at the marked starting posi-
tion. Participants then moved their hands towards the oppo-
site side of the page, at any speed they chose. During this
period muscle-plotter actuated their wrist, hence plotting
the curve. When participants reached 16 cm from the left to
right margin, the trial ended. The system recorded the in-tended function, the user drawn function, as well as the
time between start and end of plot.
Every participant performed each function twice, resulting
in 128 trials: 8 functions × 2 repetitions × 8 participants.
The Dataset
The eight mathematical functions are shown in Figure 16.
The first six functions were composed by adding off-
phased sine waves of increasing difficulty; hence we denote
them as Sin1-Sin6 (ascending in frequency and amplitude). We added a triangular wave (denoted as Tri) and a sine
wave that ended in a flat section (denoted as Flat) to ex-
plore how the system behaves with regards to abrupt
changes in slope and curvature (as well as to prevent partic-
ipants from getting used to sine wave patterns).
Apparatus
Figure 15 shows our apparatus. Participants wore mus-
cle-plotter’s electrodes on the wrist flexor and extensor
muscles (as described in Implementation). They were seat-
ed with the dominant forearm rested on the table to reduce
fatigue. We used the controller described in Implementa-
tion, which actuated flexors and extensors simultaneously
but without the brake channel, which was introduced as an outcome of this study. The muscle-plotter software admin-
istered the respective functions to the user; all other func-
tionality was disabled. Muscle-plotter was calibrated with
the procedure described in the Implementation section.
Figure 15: Setup for our experiment (image taken from the
study, with consent of the participant).

Participants
We recruited 8 right-handed participants (1 female), be-
tween 22 and 26 years old (M = 23.9 years) from our local
university. With consent of the participants, we videotaped
the study sessions.
Results
Raw data Figure 16 shows the curves drawn by participants.
The average error from target across all 128 trials was
4.07 mm (SD = 3.03 mm).
Figure 16: Raw data from 8 participants and 128 trials. The
white trace represents the desired trajectory and colored
traces depict user drawn plots (scale in mm). Average per
function represents error (distance to target).
Preservation of sine-based functions: Figure 16 also shows
the average error per by function (Sin1: M = 2.45 mm,
SD = 1.42 mm; Sin2: M = 2.65 mm, SD = 1.29 mm; Sin3:
M = 2.66 mm, SD = 0.90 mm; Sin4: M = 3.15 mm,
SD = 1.00 mm; Sin5: M = 4.55 mm, SD = 1.31 mm; Sin6:
M = 10.06, SD = 2.67 mm). As expected, there was an
increase in error with the increase in the function’s highest
partial confirmed by a linear regression with R2 = 0.64
through Sin1 – Sin6. To provide an estimate of how much
each trial differed between each other, the reported stand-
ard deviations (SD) are between the mean errors of each trial.
Preservation of non-sine functions: When plotting the two
functions that contained sharper changes in slope and cur-
vature participants performed similarly to the sine waves
(Tri: M = 4.77 mm, SD = 1.53 mm; Flat: M = 2.29 mm,
SD = 0.82 mm).
Preservation of features: The plots in Figure 17 illustrate in
how far plots made through muscle-plotter preserved the
original function. The plots show frequency histograms
produced by means of Fourier transformation. We see the
original signal in green, as well as user-specific jitter—i.e.,
noise, in red. As the plots illustrate, jitter tends to revolve
around wavelengths smaller than 0.5 cycles/cm.
Figure 17: Exemplary Fourier transforms for Sin2, Sin3, Sin5
and Sin6: original signal (red) and users output (green).
Jitter in Sin2 and Sin3 has very little impact on the signal
(the same as observed in Sin1 and Sin4). This gets more challenging with Sin5, which has its highest partial at a
wavelength of around 0.23 cycles/cm. Still, signal and jitter
are clearly distinct, which means that the original function
still stands out clearly, so that awareness of one’s jitter
allows users to visually filter out the noise. The distance
between signal and jitter gets smaller with increasing signal
frequency until they start to overlap in Sin6, suggesting that
part of this signal has drowned in the noise and thus has
become unrecognizable.
We conclude that muscle-plotter is suitable for reproducing
signals of up to 0.3 cycles/cm wavelengths, but should not
be used for frequencies higher than this.
Speed/Accuracy tradeoff: The fact that participants picked
their own pace resulted in a wide range of speeds. Figure
18 illustrates the resulting speed/accuracy tradeoff. Partici-
pants plotted the 16 cm-wide functions in between 7.98 s and 29.5 s (M=16.17 s, SD=4.90 s).
Figure 18: Average error (in mm) for each trial in relation to
its duration (in seconds). Each color is a different participant.
Discussion
The main finding of the study is that muscle-plotter is able
to reproduce signals up to 0.3 cycles/cm wavelengths (e.g.,
Sin5 signal), while higher frequencies (e.g., Sin6 signal)
cannot be reproduced as is. This insight is useful in that it
allows application designers to decide how to pre-process
their data before outputting it through muscle-plotter, e.g.,
by stretching the signal horizontally before plotting.

Interestingly, two out of the eight participants stated that
they had not looked at the paper while plotting. This hap-
pened naturally, since we had not instructed them either
way.
We opted to study the performance of rhythmic curves (i.e.,
based on the arithmetic combination of multiple sine-
waves) as these allowed us to separate out signal and jitter
using the frequency analysis we presented in Figure 17.
However, in our experiments we found that non-rhythmic
curves behaved similarly. The reason is that muscle-plotter
plots at a slow enough pace that every movement is in-
duced separately. In fact, muscle-plotter moves the wrist
from target to target, rather than in a rhythmic manner.
Hence, the way in which our system plots is different from
the way humans tend to sketch waves quickly by perform-
ing a single oscillating movement.
Based on these results we improved the system by adding the aforementioned brake functionality, i.e., muscle-plotter
slows down the user by actuating the wrist muscles down-
wards as to push into the paper; this increases the friction
between pen and paper. Also, this helps returning the wrist
to a neutral position, improving the quality of straight lines.
RELATED WORK
Our work relates directly to research conducted in interac-
tive systems based on exoskeletons, pen-based interfaces,
and interactive electrical muscle stimulation systems.
Pen-based Devices and Sensemaking Systems
For many spatial activities such as sketching, researchers
argue that pen and paper (or digital paper and its emula-
tions) are the most adequate tools [3, 33]. This is due to
their superior ergonomics and support for bimanual use [5, 8], but also because they leverage existing know-how (e.g.,
signing your name using a pen is easier than with a track-
pad) [3]. Also, sketching itself is an important and enjoya-
ble cognitive tool [33]. In fact, Ullman et al. identified that
sketching using pen and paper is a crucial tool for (mechan-
ical) designers that allows “communicating ideas between
designers and between the designer”, “as an analysis tool”,
“to simulate the design” and “as an extension of the design-
er's short term memory” [33].
For these and other reasons, since the 60’s researchers have
utilized pen-input for their interfaces, canonically
SketchPad [28]. Notable examples include Teddy, a system
for 3D modeling based on 2D sketching [9]. CrossY is a
fluid language of pen strokes that allows controlling GUI
elements based on crossing elements with a pen stroke [2].
PapierCraft is an annotation system for paper in which
users directly interact with their printouts, using pen ges-
tures such as pigtails, crop marks or underlines to execute
commands such as copy & paste, linking, and so forth [15].
Several researchers have created pen-based systems intend-
ed to help users with sensemaking tasks, in particular with
mathematical problems. Flatland [20], for example, is a
pen-based interface for whiteboards that supports basic
math and map drawing. Also, both MathPad [14] and
Hands-on Math [37] are systems that provide deeper sup-
port for sensemaking in mathematics.
Other researchers explored projection in order to augment
physical paper. For instance, PenLight [26] pairs up an
Anoto pen with an overhead projector and an external 3D
tracking system, allowing to visually overlay information
and menus on top of the physical paper.
Closing the Loop in Haptic and Tangible Systems
Some researchers have taken tangible input further by using
it not only for input but also for output. Notably the Actuat-
ed Workbench closed the loop for a tangible tabletop sys-
tem by actuating the pucks using magnetic forces [22]. Our
inspiration for closing the loop comes from Gesture Out-
put [25] in which the loop of touch gestures on a mobile
phone is closed by actuating the user’s finger.
Haptics Systems: Actuated Pens
Most haptic systems with sufficient force to actuate users
transmit forces from a motor to the user’s body via pul-
leys [19] or exoskeletons [32]. An exemplary device is the
Phantom, a desktop sized robotic arm featuring a pen as its
ending. Phantom or comparable systems have been used
for pen-based menu interaction [21], for rendering bar
charts for visually impaired users [34], and so forth.
Other systems, such as Digital Rubbing, allow users to transfer digital graphics onto paper [11]. Users accomplish
this by rubbing a pen featuring an actuated tip onto a paper
on a digitizer tablet. The tip writes only when the user
passes at the target location. The system is targeted at
drawing textured images, rather than plots/lines, and re-
quires the user to always scan the complete surface.
Also using Actuated Workbench’s principle of magnetic
forces as guides, dePENd is a sketching system that uses a custom ferromagnetic surface to actuate a ballpoint
pen [36]. The system is unfortunately stationary but in turn
provides 2D actuation across the surface. A re-iteration of
this interface, Depend 2.0 [35], mitigates the mobility issue
by using asymmetric vibration patterns to generate a virtual
traction force which the user must respond to and turn in
that direction voluntarily; this is based on the same under-
lying principle as Traxion [24].
Interactive Systems based on EMS
EMS is a technique originated in the field of medical reha-
bilitation that applies electrical impulses to involuntarily
contract muscle fibers; these impulses are delivered to the user’s muscles via electrodes that are attached to the
skin [12, 27].
Recently, researchers in HCI started to build interactive
systems based on EMS. Possessed Hand [29], for example,
is a guidance device that helps users learn, for example,
how to play a new instrument. Pedestrian Cruise Control
informs the user’s leg muscles when to turn [23]. In con-
trast, muscle-plotter actuates muscles directly, thereby eliminates the cognitive load involved by systems that
merely inform users when to turn.
One motivation for the use of EMS in interactive systems is
that it allows replacing motors, thereby resulting in much

smaller, even mobile form factors. Muscle-propelled force
feedback, for example, uses EMS to provide directional
force feedback (left & right) in mobile gaming [16]. Pose-
IO is an interactive wearable system that allows for eyes-
free input output with a computer system [17]. Af-
fordance++ extends on this concept by allowing objects to actuate the user’s hand in order to make it manipulate the
object properly [18].
CONCLUSIONS AND FUTURE WORK
We presented muscle-plotter, an interactive system based
on electrical muscle stimulation that provides pen-on-paper
interactions for both input and output. In our system, users
input by writing, e.g., writing mathematical formulae or
drawing shapes. The system outputs by actuating the users’
wrist so as to draw graphs, strokes, etc.
We designed muscle-plotter to render significantly more
complex data than previous EMS-based systems. The key
idea behind muscle-plotter is to make the user’s hand
sweep an area on which muscle-plotter renders curves, i.e.,
series of values, and to persist this EMS output by means
of a pen. This allows the system to build up a larger whole,
enabling it to assist users in cognitively demanding
activities, such as designing an aerodynamically sound
vehicle, by providing users with access to a computer
system while they are sketching on pen and paper. Still, the
use of EMS allows muscle-plotter to achieve a compact and
mobile form factor.
We have demonstrated six simple applications, including a wind tunnel simulator, an RC circuit simulator, function
plotting, as well as a set of generic widgets. As future
work, we plan to use muscle-plotter to make textbooks
interactive.
ACKNOLEDGEMENTS
We thank our colleagues at the HPI, in particular Ludwig
Wall and Alexandra Ion, for their assistance in piloting our
prototypes.
REFERENCES
1. Anoto Technology. http://www.anoto.com.
2. Apitz, G., and Guimbretière, F. CrossY: a crossing-
based drawing application. In Proc. UIST '04, 3-12.
3. Buxton, B., Sketching User Experiences: Getting the
Design Right and the Right Design. 2007.
4. Comparison of Open Source OCR packages.
http://www.mathstat.dal.ca/~selinger/ocr-test.
5. Guiard, Y. Asymmetric Division of Labor in Human
Skilled Bimanual Action: The Kinematic Chain as a
Model. In J. of Motor Behavior, 1987. 19(4): 486-517.
6. HASOMED FES/EMS, http://www.hasomed.de.
7. Hinckley, K., Baudisch, P., Ramos, G., and Guimbre-
tiere, F. Design and Analysis of Delimiters for Selec-
tion-Action Pen Input Phrases in Scriboli. In Proc.
CHI’05, 451-460.
8. Hinckley, K., Pausch, R., Proffitt, D., Patten, J., and
Kassell, N. Cooperative bimanual action. In Proc.
CHI '97, 27-34.
9. Igarashi, T., Matsuoka, S., and Tanaka, H. Teddy: a
sketching interface for 3D freeform design. In Proc.
SIGGRAPH' 09, 409-416.
10. Ito, K., Takahiro S., and Toshiyuki K. Lower-limb
Joint Torque and Position Controls by Functional Elec-
trical Stimulation (FES). In Complex Medical Engi-
neering’07. 239-249.
11. Kim, H., Kim, S., Lee, B., Pak, J., Sohn, M., Lee, G.,
and Lee, A. Digital rubbing: playful and intuitive in-
teraction technique for transferring a graphic image on-
to paper with pen-based computing. In Proc. CHI
EA'08, 2337-2342.
12. Kruijff, E., Schmalstieg, D., and Beckhaus, D. Using
neuromuscular electrical stimulation for pseudo-haptic
feedback. In Proc. VRST '06, 316-319.
13. Lattice-Boltzmann Simulation of a 2D Fluid.
http://physics.weber.edu/schroeder/fluids.
14. LaViola, J., and Zeleznik, R. MathPad2: a system for
the creation and exploration of mathematical sketches.
In ACM Trans. Graph. 23, 3 (August 2004), 432-440.
15. Liao, C., Guimbretière, F., and Hinckley, K. Pa-
pierCraft: a command system for interactive paper. In Proc. UIST '05, 241-244.
16. Lopes, P. and Baudisch, P. Muscle-propelled force
feedback: bringing force feedback to mobile devices.
In Proc. CHI' 13, 2577–2580.
17. Lopes, P., Ion, A., Mueller, W., Hoffmann, D., Jonell,
P., and Baudisch, P. Proprioceptive Interaction. In
Proc. CHI '15, 939–948.
18. Lopes, P., Jonell, P., and Baudisch, P. Affordance++:
allowing objects to communicate dynamic use. In
Proc. CHI '15, 2515-2524.
19. Murayama, J., Bougrila, L., Luo, Y., Akahane, K.,
Hasegawa, S., Hirsbrunner, B., Sato, M. SPIDAR
G&G: a two-handed haptic interface for bimanual VR
interaction. In Proc. EuroHaptics '04, 138-146.
20. Mynatt, E.D., T. Igarashi, W.K. Edwards, and A. La-
Marca. Flatland: new dimensions in office white-boards. In Proc. CHI '99, 346-353.
21. Oakley, I., Brewster, S., and Gray, P. Solving multi-
target haptic problems in menu interaction. In Proc.
CHI EA '01, 357-358.
22. Pangaro, G., Maynes-Aminzade D., and Ishii, H. The
actuated workbench: computer-controlled actuation in
tabletop tangible interfaces. In Proc UIST '02, 181-
190.
23. Pfeiffer, M., Dünte, T., Schneegass, S., Alt, F., and
Rohs, M. Cruise Control for Pedestrians. In Proc.
CHI '15, 2505–2514.
24. Rekimoto, J. Traxion: a tactile interaction device with
virtual force sensation. In Proc. UIST '13, 427-432.
25. Roudaut, A., Rau, A., Sterz, C., Plauth, M., Lopes, P.,
and Baudisch, P. Gesture output: eyes-free output us-
ing a force feedback touch surface. In Proc. CHI '13,
2547-2556.
26. Song, H., Grossman, T., Fitzmaurice, G., Guimbre-
tiere, F., Khan, A., Attar, R., and Kurtenbach. G., Pen-
Light: combining a mobile projector and a digital pen
for dynamic visual overlay. In Proc. CHI '09, 143-152.
27. Strojnik, P., Kralj, A., and Ursic, I. Programmed six-
channel electrical stimulator for complex stimulation
of leg muscles during walking. IEEE Trans. Biomed.
Eng. 26, 112.
28. Sutherland, I. Sketchpad a man-machine graphical
communication system. In Papers on Twenty-five
years of electronic design automation, 1988, 507-524.
29. Tamaki, E., Miyaki, T., and Rekimoto, J. Pos-
sessedHand: Techniques for controlling human hands
using electrical muscles stimuli. In Proc. of CHI '11,
543-552.
30. Tesseract OCR. http://github.com/tesseract-ocr.
31. Thin lens simulation with Python.
http://www.frantzmartinache.com/blog/?p=84.
32. Tsetserukou, D., Sato, K., and Tachi, S. ExoInterfaces:
novel exosceleton haptic interfaces for virtual reality,
augmented sport and rehabilitation. In Proc. AH '10,
Article 1.
33. Ullman, D. G., Wood, S., and Craig, D. The im-
portance of drawing in the mechanical design process.
In Computers and Graphics, 1990, 14(2): 263–274.
34. Wall, S. and Brewster, S. Assessing haptic properties
for data representation. In Proc. CHI EA '03, 858-859.
35. Yamaoka, J. and Kakehi, Y. A pen-based device for
sketching with multi-directional traction forces. In
Proc. UIST '14 Adjunct, 43-44.
36. Yamaoka, J. and Kakehi, Y. dePENd: augmented
handwriting system using ferromagnetism of a ball-
point pen. In Proc. UIST '13, 203-210.
37. Zeleznik, R., Bragdon, A., Adeputra, F., and Ko, H. Hands-on math: a page-based multi-touch and pen
desktop for technical work and problem solving.
In Proc. UIST '10, 17-26.


