Download - Multiple linear regression MLR

Multiple linear regressionMLR

0 1 1 2 2
0 1 1 2 2
True model
sampling error
Estimated model
ˆ ˆ ˆˆ
residual (error term)
t t t t
t
t t t t
t
y x x
y x x e
e
Assumptions
1. The model is linear in the parameters
2. The error terms are statistically independent
3. The independent variables are linearly independent.
4. All populations have equal variances
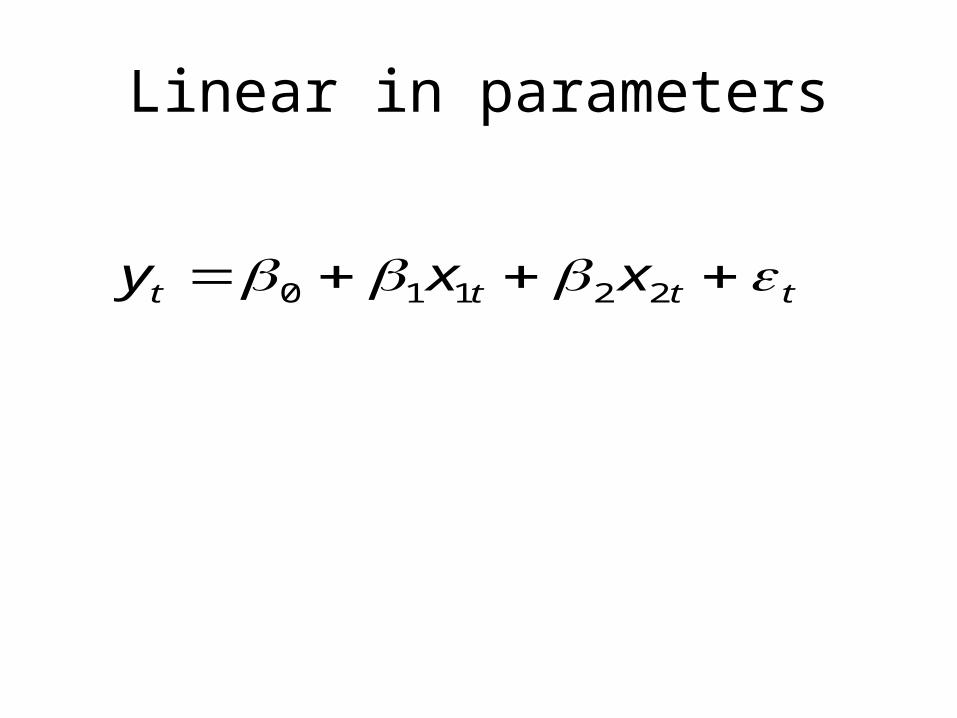
Linear in parameters
0 1 1 2 2t t t ty x x

Not linear in parameters
• Violation of assumptions
0 1 1expt t ty x

Linear in parameter but nonlinear in variables
• Not a violation of assumptions
21 1 2 2exp( )t t ty x x
Violation of the assumption that the model is linear in parameters
• This is called a mis—specification error.
• This means the model has been written improperly.
• There is such a thing as non—linear regression

The error terms are statistically independent
• If the errors terms are statistically independent, then the value of the error term at time t will not be correlated with the values of the error terms at any other time period.
• The ACF of statistically independent error terms will be the ACF of noise.
The error terms are statistically independent
• The violation of this assumption is called serial correlation.
• Serial correlation can be detected using the Durbin—Watson test or the ACF of the residuals.
• Look at plot of residuals

Causes of serial correlation
• Omitting a relevant variable from a regression equation.
• A mis—specification error.

Consequences of serial correlation
• The estimates of the standard deviation of the regressions coefficients ( ) will be wrong
• So the T-test and p—values will be wrong as well
ˆS
1
1
ˆ
ˆtS

Consequences for forecasting
• Can be very severe

Fixes for serial correlation
• Find the missing relevant variable.
• Write the regression equation correctly to avoid mis—specification.
• Lagged dependent variable
0 1 1 2 1t t ty x y

The independent variables are linearly independent
• The independent variables are not linearly independent if you can write one of them as some linear combination of the others.

Perfect multicolinearity
0 1 1 2 2 3 3t t t ty x x x
2 1 3t t tx ax bx

Near multicolinearity
0 1 1 2 2 3 3t t t ty x x x
2 1 3 small random errort t tx ax bx

Detection of multicolinearity
• Plot the independent variables.
• Compute the correlations between the independent variables.
• Look for logical inconsistencies in the regression statistics.
Fix for multicolinearity
• Find this and you will become very famous amongst econometricians.
• Can’t really omit one of the offending variables.
• At times it doesn’t really matter for forecasting. (St. Louis Model)
Heteroscedasticity
• Violation of the assumption that the populations that the samples come from all have the same variance.

Consequences of heteroscedasticiy
• Same as with serial correlation as far as the estimates of is concerned
• Makes the forecasts increasingly uncertain
ˆS

Fix for heteroscedasticity
• In this course we will take logs of the dependent variables and perhaps the logs of all variables
• More sophisticated methods exist but are difficult to use and also require a good deal of work


