Download - Multicolony tracking reveals the winter distribution of a pelagic seabird on an ocean basin scale
BIODIVERSITYRESEARCH
Multicolony tracking reveals the winterdistribution of a pelagic seabird on anocean basin scale
Morten Frederiksen1*, Børge Moe2, Francis Daunt3, Richard A. Phillips4,
Robert T. Barrett5, Maria I. Bogdanova3, Thierry Boulinier6,
John W. Chardine7, Olivier Chastel8, Lorraine S. Chivers9,
Signe Christensen-Dalsgaard10, Celine Clement-Chastel8, Kendrew
Colhoun11, Robin Freeman12, Anthony J. Gaston13, Jacob Gonzalez-Solıs14,
Aurelie Goutte8, David Gremillet6, Tim Guilford12, Gitte H. Jensen1, Yuri
Krasnov15, Svein-Hakon Lorentsen10, Mark L. Mallory16, Mark Newell3,
Bergur Olsen17, Deryk Shaw18, Harald Steen19, Hallvard Strøm19, Geir H.
Systad2, Thorkell L. Thorarinsson20 and Tycho Anker-Nilssen10
1Department of Arctic Environment, NERI, Aarhus
University, Frederiksborgvej 399, 4000 Roskilde,
Denmark, 2Norwegian Institute for Nature Research,
Fram Centre, 9296 Tromsø, Norway, 3Centre for
Ecology & Hydrology, Bush Estate, Penicuik,
Midlothian EH26 0QB, UK, 4British Antarctic
Survey, Natural Environment Research Council,
High Cross, Madingley Road, Cambridge CB3 0ET,
UK, 5Department of Natural Sciences, Tromsø
University Museum, 9037 Tromsø, Norway, 6Centre
d’Ecologie Fonctionnelle et Evolutive, CNRS, 1919
Route de Mende, 34293 Montpellier, France,7Environment Canada, PO Box 6227, Sackville, NB
E4L 1G6, Canada, 8Centre d’Etudes Biologiques de
Chize, CNRS, 79360 Villiers en Bois, France,9Quercus, School of Biological Sciences, Queen’s
University Belfast, MBC, 97 Lisburn Road, Belfast
BT9 7BL, UK, 10Norwegian Institute for Nature
Research, PO Box 5685 Sluppen, 7485 Trondheim,
Norway, 11RSPB Northern Ireland, Belvoir Park
Forest, Belfast BT8 7QT, UK, 12Animal Behaviour
Research Group, Department of Zoology, University
of Oxford, South Parks Road, Oxford OX1 3PS, UK,13Environment Canada, National Wildlife Research
Centre, Raven Road, Carleton University, Ottawa,
ON K1A 0H, Canada, 14Institut de Recerca de la
Biodiversitat i Departament de Biologia Animal,
Universitat de Barcelona, 08028 Barcelona, Spain,15Murmansk Marine Biological Institute KSC RAS,
Murmansk, Russia, 16Canadian Wildlife Service,
Box 1714, Iqaluit, NU X0A 0H0, Canada, 17Faroe
Marine Research Institute, Noatun 1, 100 Torshavn,
Faroe Islands, 18Fair Isle Bird Observatory, Fair Isle,
Shetland ZE2 9JU, UK, 19Norwegian Polar Institute,
Fram Centre, 9296 Tromsø, Norway, 20Northeast
Iceland Nature Center, Hafnarstett 3, 640 Husavik,
Iceland
*Correspondence: Morten Frederiksen,
Department of Bioscience, Aarhus University,
Frederiksborgvej 399, 4000 Roskilde, Denmark.
E-mail: [email protected]
ABSTRACT
Aim An understanding of the non-breeding distribution and ecology of migratory
species is necessary for successful conservation. Many seabirds spend the non-
breeding season far from land, and information on their distribution during this
time is very limited. The black-legged kittiwake, Rissa tridactyla, is a widespread
and numerous seabird in the North Atlantic and Pacific, but breeding populations
throughout the Atlantic range have declined recently. To help understand the
reasons for the declines, we tracked adults from colonies throughout the Atlantic
range over the non-breeding season using light-based geolocation.
Location North Atlantic.
Methods Geolocation data loggers were deployed on breeding kittiwakes from 19
colonies in 2008 and 2009 and retrieved in 2009 and 2010. Data from 236 loggers
were processed and plotted using GIS. Size and composition of wintering
populations were estimated using information on breeding population size.
Results Most tracked birds spent the winter in the West Atlantic, between
Newfoundland and the Mid-Atlantic Ridge, including in offshore, deep-water
areas. Some birds (mainly local breeders) wintered in the North Sea and west of
the British Isles. There was a large overlap in winter distributions of birds from
different colonies, and colonies closer to each other showed larger overlap. We
estimated that 80% of the 4.5 million adult kittiwakes in the Atlantic wintered
west of the Mid-Atlantic Ridge, with only birds from Ireland and western Britain
staying mainly on the European side.
Main conclusions The high degree of mixing in winter of kittiwakes breeding in
various parts of the Atlantic range implies that the overall population could be
sensitive to potentially deteriorating environmental conditions in the West
Atlantic, e.g. owing to lack of food or pollution. Our approach to estimating the
size and composition of wintering populations should contribute to improved
management of birds faced with such challenges.
Keywords
Black-legged kittiwake, geolocation, migration, non-breeding ecology, North
Atlantic, Rissa tridactyla.
Diversity and Distributions, (Diversity Distrib.) (2012) 18, 530–542
DOI:10.1111/j.1472-4642.2011.00864.x530 http://wileyonlinelibrary.com/journal/ddi ª 2011 Blackwell Publishing Ltd
A J
ourn
al o
f Co
nser
vati
on B
ioge
ogra
phy
Div
ersi
ty a
nd D
istr
ibut
ions
INTRODUCTION
Understanding the non-breeding ecology of migratory species
is important since individuals often move long distances to
avoid seasonal deterioration in weather and food availability
around breeding sites and may face energetically challenging
conditions during the non-breeding period (Newton, 2008). As
a consequence, peak mortality often occurs in winter
(e.g. Harris & Wanless, 1996), with important implications
for population dynamics (Sillett et al., 2000). There have been
few coordinated studies of the non-breeding distribution of
different populations across a species’ breeding range despite
the important role that variability among populations might
play in determining local demographic processes (Reynolds
et al., 2011). Conditions experienced during the non-breeding
period may have long-term (carry-over) effects on breeding
performance (Harrison et al., 2011), and this may affect
population growth rate. Consequently, there are important
management implications: where individuals from different
breeding areas share wintering grounds, vulnerability to local
anthropogenic impacts may increase (Esler, 2000). In response,
conservation efforts can be targeted at areas where the majority
of the population, or particularly vulnerable segments, con-
gregate. It is thus important to know whether populations
share non-breeding areas and to what extent population
dynamics are linked to conditions in these areas.
Many species of seabirds spend most of the year away from
their breeding sites, often far from land. Distances moved
vary widely, with some species performing some of the
longest known annual migrations of any animal (Shaffer
et al., 2006; Egevang et al., 2010). Consequently, the distri-
bution and ecology of non-breeding seabirds are poorly
known, creating important gaps in our understanding of their
biology. For example, most mortality of adult seabirds
probably occurs outside the breeding season and away from
the colonies (e.g. Harris et al., 2007), making environmental
conditions during the non-breeding season important drivers
of demographic variation and population dynamics (e.g.
Barbraud & Weimerskirch, 2003; Bertram & Harfenist, 2005;
Grosbois & Thompson, 2005). However, to identify specific
environmental drivers, more information on non-breeding
ecology is needed, particularly for threatened or declining
species.
In the past, information about non-breeding distributions of
seabirds has come from two sources: recoveries of ringed birds
and at-sea surveys. While recoveries have provided much
useful information, they suffer from pronounced biases owing
to spatial variation in how likely birds are to die and be
recovered (Wernham & Siriwardena, 2002). At-sea surveys are
useful for mapping non-breeding distributions on the conti-
nental shelf (Certain et al., 2007; Zipkin et al., 2010), but
generally do not provide information on the breeding origin
and demographic status of the birds observed. For more
oceanic areas with low bird densities, it is logistically difficult
and expensive to collect sufficient survey data for robust
mapping of distributions.
Recent technological advances have allowed researchers to
follow individuals throughout the year. Satellite [platform
terminal transmitter (PTT)] tags have provided much informa-
tion on offshore distribution of seabirds, but size and cost have
limited their application to relatively large species (e.g. alba-
trosses, BirdLife International, 2004), and deployment periods
have been relatively short. Light-based geolocation provides a
lighter, cheaper, but lower-precision alternative and has recently
become a widely used technology for mapping large-scale
distributions and migration patterns of marine vertebrates,
including seabirds (Wilson et al., 1992; Weimerskirch & Wilson,
2000; Saunders et al., 2011). Many studies have used geolocation
to follow individuals from one or a few study sites (e.g. Daunt
et al., 2006), but the wide geographical distribution of some
species calls for large-scale, spatially integrated surveys to better
assess the variability and extent of the non-breeding distribution
of whole (meta)populations. The geolocation method is now
sufficiently low cost to allow the deployment of a large number of
devices at a range-wide scale.
Here, we use geolocator data from 18 colonies of the black-
legged kittiwake (hereafter kittiwake), Rissa tridactyla,
throughout the species’ North Atlantic range to map the
distribution during the non-breeding season and investigate
the extent to which individuals from multiple breeding
populations share wintering areas. The kittiwake is a relatively
small (350–400 g) colonial gull, which outside the breeding
season occurs primarily offshore (Hatch et al., 2009). The
Atlantic breeding population is large (estimated 2.5–3 million
pairs, Heubeck, 2004), but in many areas the species has
experienced food shortages, poor breeding seasons and
widespread population declines in recent decades, and it is
red-listed in several countries including Norway, the Faroes
and Greenland (Frederiksen, 2010). The underlying reasons
for these declines are only partially understood, but at least in
some areas, there appears to be a link to increasing sea
temperatures (Frederiksen et al., 2004). The widespread
nature of the declines may indicate common causation linked
to shared wintering areas, or alternatively widespread low
food availability linked to large-scale climate patterns in
summer or winter. Ringing recoveries suggest some sharing
of wintering areas, as the majority of kittiwakes ringed at
colonies in the UK, Denmark and Norway have been
recovered during winter in essentially the same two regions:
around the British Isles (including the North Sea and Bay of
Biscay) and around the Labrador Sea, particularly in SW
Greenland and Newfoundland (Coulson, 2002; Bakken et al.,
2003; Bønløkke et al., 2006). Recent information from
regional studies using geolocation supports this picture
(Bogdanova et al., 2011; Gonzalez-Solıs et al., 2011). Birds
ringed in the Faroes, Iceland, Greenland and Canada have
also been recovered in the Labrador Sea area in winter, but
only rarely in Europe (Petersen, 1998; Lyngs, 2003; Gaston
et al., 2008; S. Hammer, pers. comm.). However, the at-sea
distribution of birds from these areas and the overlap
between populations are essentially unknown. The North
Atlantic is affected by many, regionally variable threats to
Winter distribution of Atlantic kittiwakes
Diversity and Distributions, 18, 530–542, ª 2011 Blackwell Publishing Ltd 531
seabirds (e.g. longline, trawl and gillnet fisheries, shipping,
hydrocarbon extraction). To improve conservation efforts for
kittiwakes, we need to understand better where they spend
the non-breeding season and hence their vulnerability to
regional anthropogenic impacts. Our main aims are as
follows: (1) to document the non-breeding distribution of
adult kittiwakes breeding in the Atlantic, (2) to quantify the
overlap in wintering areas between birds of different breeding
origin and (3) to estimate the composition (in terms of
breeding origin) of wintering populations in various parts of
their range.
METHODS
Study species and field methods
In the North Atlantic, kittiwakes breed from the high Arctic
(c. 80� N) to mid-temperate latitudes (c. 40–45� N) on both
sides of the ocean, often in large colonies. Outside the breeding
season, they occur throughout the Atlantic south to Morocco,
the Azores and Florida (Coulson, 2002 and references therein;
Hatch et al., 2009).
Since the kittiwake is studied at many sites in the Atlantic
(Frederiksen et al., 2005), it was possible to design a large-scale
study involving colonies well dispersed throughout the breed-
ing range (Figs 1a & 2a, Table 1). The main study involved
geolocators deployed in 2009 and retrieved in 2010, but at
some colonies, loggers were also deployed in 2008 and
retrieved in 2009 and 2010 (Table 1). At all sites, breeding
adult kittiwakes were captured on the nest using noose poles
and equipped with British Antarctic Survey (BAS) Mk14
(2008) and Mk13 (2009) geolocators (20 · 9 · 6.5 mm, 1.8 g;
British Antarctic Survey, Cambridge, UK) mounted on a
plastic leg ring. At one study colony (Prince Leopold Island),
Lotek LAT2500 loggers (35 · 8 · 8 mm, 3.6 g; Lotek Wireless,
Newmarket, ON, Canada) were deployed in 2008 and retrieved
in 2009. Numbers of loggers deployed and retrieved at each
colony are listed in Table 1. A previous study found no
negative effect of geolocators on kittiwake breeding success or
the probability of returning to the colony in the following year
(Bogdanova et al., 2011).
Analytical methods
All data from BAS loggers were processed by one person
(B.M.). Data processing involved evaluating the reliability of
each recorded transition (sunset or sunrise) and converting
these to noon and midnight geographical positions using the
BASTrak software package (Fox, 2010). Logger sensitivity was
calibrated by examining positions of a subset of 15 individuals
from five colonies south of the Arctic Circle for the post-
breeding period (see Appendix S1 in Supporting Informa-
tion). The smallest bias in latitude was obtained with a
threshold light intensity of 10 and sun angle of )3�, and these
settings were used for all loggers. Subsequently, data were
filtered, removing unreliable positions from the breeding
season (with many shading events) and equinox periods, when
the weak latitudinal trend in day length precludes reliable
determination of latitude. Because the logger detects the sun
below the horizon, the time of apparent equinox (as
experienced by the logger) is shifted towards the winter
solstice (Hill & Braun, 2001); for an angle of )3�, this shift is
c. 8 days. Latitudes were unreliable for c. 3 weeks each side of
apparent equinox, and we thus removed data for 8 Septem-
ber–20 October and 20 February–3 April. Positions were also
unobtainable for periods when birds (mainly high-Arctic
breeders) were in regions of constant daylight or occasionally
constant darkness. Data from Lotek loggers were processed in
LAT Viewer Studio (Lotek Wireless) using the template fit
option (Ekstrom, 2004) and a filtering process as above, with
equinox data removed for 18 September–4 October and 1
March–24 March. Lotek loggers only provide one (noon)
geographical position per day.
Positions derived from geolocation have an average error of
c. 185 km (Phillips et al., 2004), and to reduce the influence
of outliers when calculating distances and allocating positions
to areas of interest, we smoothed positions using a three-
position moving average based on spherical trigonometry.
Distances between successive smoothed positions, and dis-
tances from each position to the home colony, were
calculated as great circle distances assuming a spherical Earth.
Mapping was performed in ArcMap 10 (ESRI, Redlands, CA,
USA). We mainly concentrated on identifying important
areas in December, when birds were less mobile (mean
distance between successive smoothed positions = 81 km vs.
99–125 km for other non-breeding months). Kernel densities
and 50% kernel contours (representing core areas used) were
estimated for each colony using raw noon positions and the
Animal Movement extension (Hooge & Eichenlaub, 1997) to
ArcView 3.1 (ESRI), with the appropriate degree of
smoothing determined by least-squares cross validation. Areas
of pairwise overlap zones between 50% colony kernel
contours were calculated in ArcMap using an equal-area
projection and scaled to proportions as ð2aoverlapÞ=a1 þ a2;
where a1 and a2 are the areas of the two respective kernel
contours and aoverlap is the area of overlap. Pairwise great
circle intercolony at-sea distances were estimated in Encarta
Interactive World Atlas 2000 (Microsoft Corporation,
Redmond, WA, USA). The significance of the correlation
between intercolony distances and pairwise kernel overlaps
was tested using a Mantel test with 100,000 permutations
(Legendre & Legendre, 1998).
To estimate the size and composition of the wintering
populations of adult kittiwakes in various parts of the range
in the 2009/10 winter, we first allocated all smoothed
positions from December 2009 (December 2008 for Prince
Leopold Island) to ‘areas of interest’ defined as follows. For
coastal and shelf regions, we used large marine ecosystems
(LMEs) (Sherman, 2006). Positions on land (< 5%) were
considered erroneous and allocated to the nearest LME. For
offshore regions of the North Atlantic with substantial
numbers of positions, we defined latitude–longitude blocks
M. Frederiksen et al.
532 Diversity and Distributions, 18, 530–542, ª 2011 Blackwell Publishing Ltd
of approximately equal area (Fig. 2b). We then averaged the
proportions of positions occurring in each area of interest
across colonies within each LME, assuming that our study
birds and sites were representative of larger regions. Estimates
of breeding population size in each LME were taken from the
most up-to-date published information, supplemented by
more recent unpublished data (Table 2). Winter populations
of adults were assumed to comprise two individuals for each
breeding pair. Winter populations from each LME were then
distributed among areas of interest proportional to the
average proportion of positions in that area. Finally, total
populations of adults wintering in each area were summed
across LMEs of origin:
Pwj ¼Xi
2Pbi �posj
Pj
posj
0BBB@
1CCCA;
where Pwj is the wintering population in area of interest j, Pbi
is the breeding population in LME i and the average
proportion of positions in each area of interest is taken across
colonies within each LME.
(a) (b)
(f)
0 1000 2000 km
(c) (d)
(e)
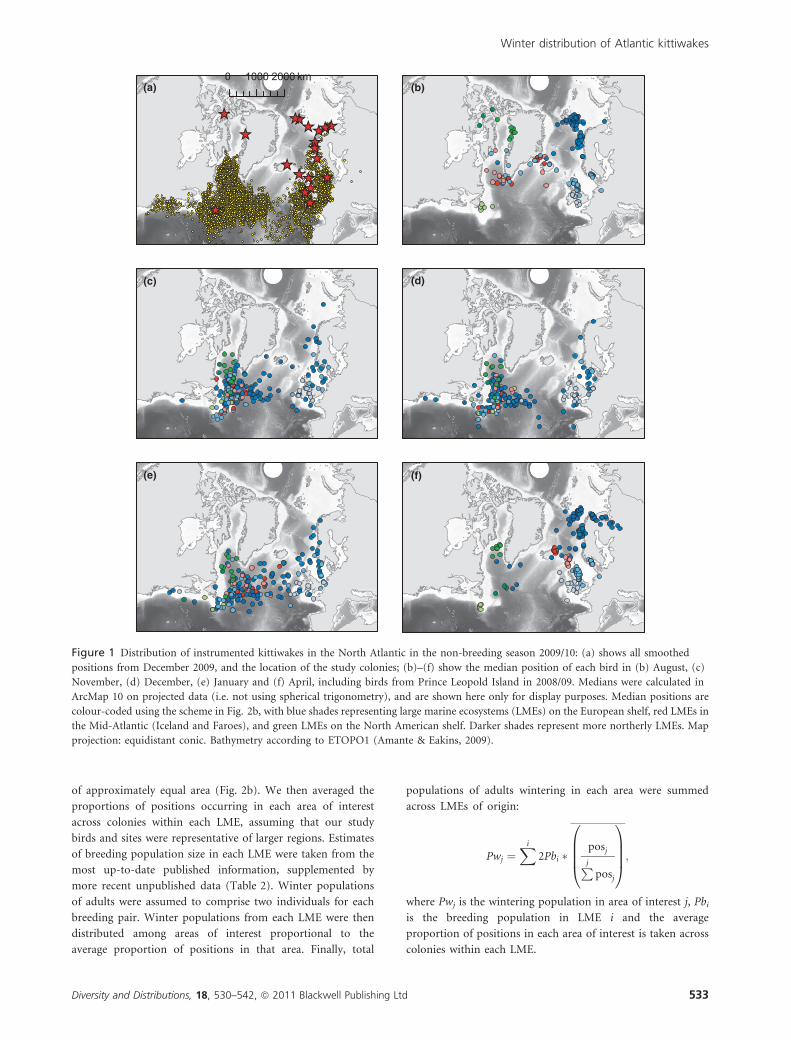
Figure 1 Distribution of instrumented kittiwakes in the North Atlantic in the non-breeding season 2009/10: (a) shows all smoothed
positions from December 2009, and the location of the study colonies; (b)–(f) show the median position of each bird in (b) August, (c)
November, (d) December, (e) January and (f) April, including birds from Prince Leopold Island in 2008/09. Medians were calculated in
ArcMap 10 on projected data (i.e. not using spherical trigonometry), and are shown here only for display purposes. Median positions are
colour-coded using the scheme in Fig. 2b, with blue shades representing large marine ecosystems (LMEs) on the European shelf, red LMEs in
the Mid-Atlantic (Iceland and Faroes), and green LMEs on the North American shelf. Darker shades represent more northerly LMEs. Map
projection: equidistant conic. Bathymetry according to ETOPO1 (Amante & Eakins, 2009).
Winter distribution of Atlantic kittiwakes
Diversity and Distributions, 18, 530–542, ª 2011 Blackwell Publishing Ltd 533

RESULTS
Usable data were extracted from 41 loggers for the 2008/09
season and 195 loggers for the 2009/10 season, although a
minority of loggers did not contain data for the full year.
Following filtering and smoothing, 12,738 and 71,668 positions
were available for 2008/09 and 2009/10, respectively. We
present mainly data for the 2009/10 season, except for Prince
Leopold Island where only 2008/09 data were available. Where
data exist for both 2008/09 and 2009/10, distribution patterns
were generally similar (see Appendices S2–S4).
Birds were distributed throughout the North Atlantic
outside the breeding season, with a major concentration in
central and western parts (Fig. 1a, see Appendix S2). Shelf
areas (< 200 m depth) and shelf edges on both sides of the
Atlantic were extensively used, as well as much deeper (up to
> 4000 m) offshore areas in the Labrador Sea and east of the
Newfoundland shelf, extending to the Mid-Atlantic Ridge. The
southernmost areas used were off north Portugal in the East
Atlantic (c. 40� N) and off Cape Hatteras in the West Atlantic
(c. 35� N). The offshore East-Central Atlantic, from the
Porcupine Bank west of Ireland to the Mid-Atlantic Ridge,
was used almost exclusively by birds in transit. While many
birds remained near the colonies throughout August (Fig. 1b),
others moved to specific post-breeding areas in the Barents Sea
southeast of Spitsbergen, the Denmark Strait between Iceland
and Greenland, and the Labrador Sea. In November (Fig. 1c),
most birds had reached wintering areas generally south of
62� N, but some birds remained in the Norwegian Sea. In
December, the majority of birds were concentrated in the
western Atlantic, with substantial numbers also in the North
Sea and west of the British Isles (Fig. 1d). By January, some
Table 1. Overview of study colonies (listed by LME), including numbers of data loggers deployed, retrieved and included in the study. All
loggers were deployed on breeding adults. A few loggers malfunctioned, and one was excluded owing to consistently biased data. At Prince
Leopold Island, 10 of 13 loggers deployed and two of the three retrieved were Lotek LAT2500 rather than BAS Mk13/14. The high-Arctic
colonies were not included in LMEs as defined by UNEP (see Fig. 2b), so we defined two additional LMEs in west Spitsbergen and Arctic
Canada and extended the West Greenland Shelf LME to include the entire west Greenland coast
LME/Colony Latitude Longitude
2008/09 2009/10
Deployed Retrieved Included Deployed Retrieved Included
West Spitsbergen
Kongsfjorden 78� 54¢ N 12� 13¢ E 10 8 7 13 12 11
Grumant 78� 10¢ N 15� 09¢ E 0 0 0 20 16 15
Barents Sea
Bear Island 74� 23¢ N 19� 08¢ E 0 0 0 20 15 15
Cape Krutik 69� 09¢ N 35� 57¢ E 0 0 0 20 12 12
Hornøya 70� 23¢ N 31� 09¢ E 10 9 6 20 15 14
Hjelmsøya 71� 09¢ N 24� 44¢ E 0 0 0 19 0 0
Norwegian Sea
Anda 69� 04¢ N 15� 10¢ E 0 0 0 20 12 12
Røst 67� 30¢ N 12� 05¢ E 19 15 14 35 22 19
Halten 64� 11¢ N 09� 25¢ E 0 0 0 20 3 3
North Sea
Fair Isle 59� 32¢ N 01� 38¢ W 0 0 0 18 15 15
Bulbjerg 57� 09¢ N 09� 01¢ E 0 0 0 20 13 13
Isle of May 56� 11¢ N 02� 33¢ W 0 0 0 25 16 16
Celtic-Biscay Shelf
Skomer 51� 44¢ N 05� 18¢ W 0 0 0 14 8 7
Rathlin 55� 29¢ N 06� 19¢ W 0 0 0 18 5 5
Faroe Plateau
Stora Dımun 61� 41¢ N 06� 45¢ W 0 0 0 20 10 10
Iceland Shelf
Hafnarholmi 65� 32¢ N 13� 45¢ W 0 0 0 20 12 12
West Greenland Shelf
Kippaku 73� 42¢ N 56� 40¢ W 20 11 11 26 10 9
Arctic Canada
Prince Leopold Island 74� 02¢ N 90� 00¢ W 13 3 3 0 0 0
Newfoundland–Labrador Shelf
Gull Island 47� 14¢ N 52� 46¢ W 0 0 0 19 7 7
Total 72 46 41 367 203 195
LME, large marine ecosystem.
M. Frederiksen et al.
534 Diversity and Distributions, 18, 530–542, ª 2011 Blackwell Publishing Ltd
birds were moving back towards the colonies, particularly in
Norway (where breeding started very early in 2010; T. Anker-
Nilssen and T. Boulinier, unpublished data), while others had
shifted more towards the Central Atlantic (Fig. 1e). After the
equinox period in April, most birds were back in the vicinity of
their colonies, but high-Arctic breeders remained in offshore
parts of the Barents Sea and Davis Strait, with a few birds still
off Newfoundland (Fig. 1f).
The timing of the migration cycle varied greatly among
colonies (Fig. 3, see Appendix S3). At some colonies such as
Stora Dımun in the Faroes, birds started migration very early,
and median distance from the colony was relatively constant at
> 2000 km from August to February. In most colonies, the
start of migration was much more gradual, with median
distance from the colony increasing from August to Novem-
ber–December. The timing of return migration also differed
among colonies; although most birds remained far from the
colonies throughout February, others started moving much
earlier, e.g. Røst in the Norwegian Sea where median distance
from the colony declined from > 3000 km to < 1500 km in
(a)
(b)
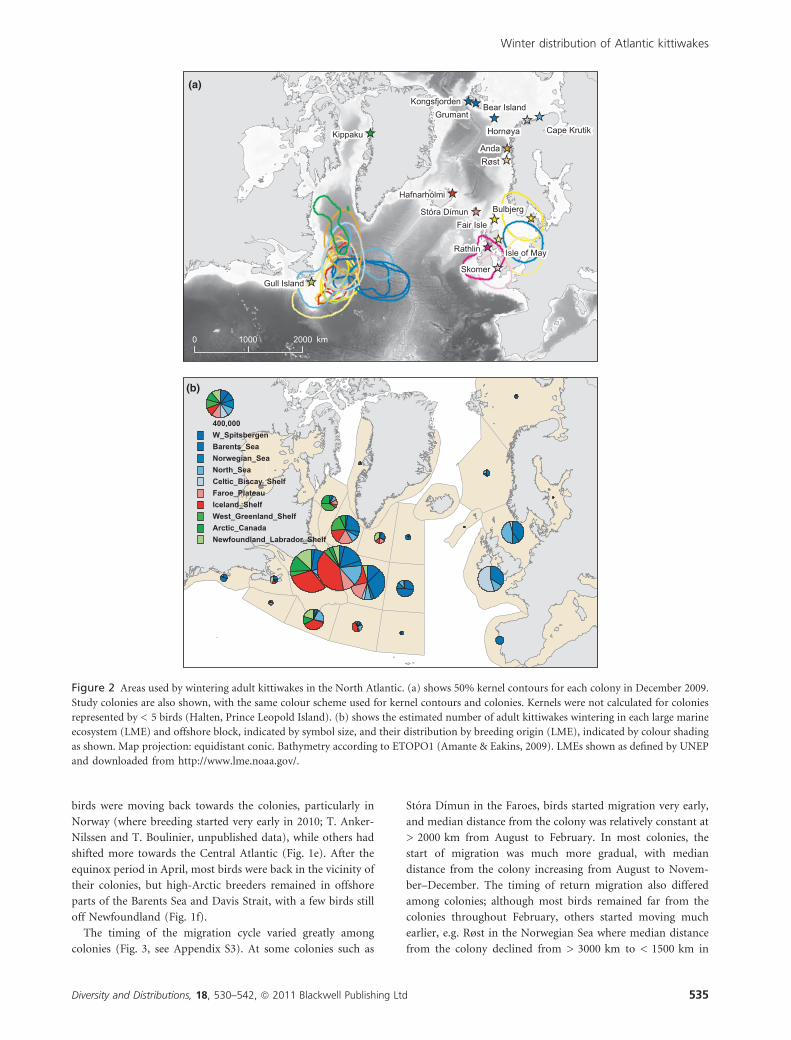
Figure 2 Areas used by wintering adult kittiwakes in the North Atlantic. (a) shows 50% kernel contours for each colony in December 2009.
Study colonies are also shown, with the same colour scheme used for kernel contours and colonies. Kernels were not calculated for colonies
represented by < 5 birds (Halten, Prince Leopold Island). (b) shows the estimated number of adult kittiwakes wintering in each large marine
ecosystem (LME) and offshore block, indicated by symbol size, and their distribution by breeding origin (LME), indicated by colour shading
as shown. Map projection: equidistant conic. Bathymetry according to ETOPO1 (Amante & Eakins, 2009). LMEs shown as defined by UNEP
and downloaded from http://www.lme.noaa.gov/.
Winter distribution of Atlantic kittiwakes
Diversity and Distributions, 18, 530–542, ª 2011 Blackwell Publishing Ltd 535
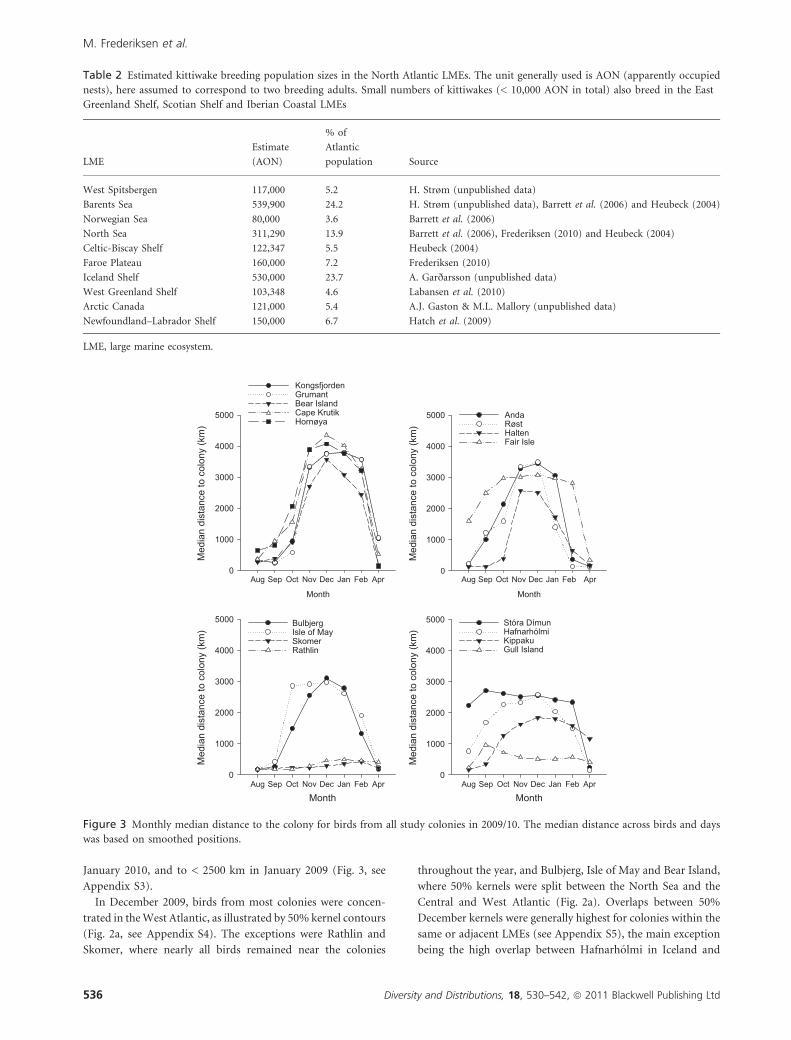
January 2010, and to < 2500 km in January 2009 (Fig. 3, see
Appendix S3).
In December 2009, birds from most colonies were concen-
trated in the West Atlantic, as illustrated by 50% kernel contours
(Fig. 2a, see Appendix S4). The exceptions were Rathlin and
Skomer, where nearly all birds remained near the colonies
throughout the year, and Bulbjerg, Isle of May and Bear Island,
where 50% kernels were split between the North Sea and the
Central and West Atlantic (Fig. 2a). Overlaps between 50%
December kernels were generally highest for colonies within the
same or adjacent LMEs (see Appendix S5), the main exception
being the high overlap between Hafnarholmi in Iceland and
Table 2 Estimated kittiwake breeding population sizes in the North Atlantic LMEs. The unit generally used is AON (apparently occupied
nests), here assumed to correspond to two breeding adults. Small numbers of kittiwakes (< 10,000 AON in total) also breed in the East
Greenland Shelf, Scotian Shelf and Iberian Coastal LMEs
LME
Estimate
(AON)
% of
Atlantic
population Source
West Spitsbergen 117,000 5.2 H. Strøm (unpublished data)
Barents Sea 539,900 24.2 H. Strøm (unpublished data), Barrett et al. (2006) and Heubeck (2004)
Norwegian Sea 80,000 3.6 Barrett et al. (2006)
North Sea 311,290 13.9 Barrett et al. (2006), Frederiksen (2010) and Heubeck (2004)
Celtic-Biscay Shelf 122,347 5.5 Heubeck (2004)
Faroe Plateau 160,000 7.2 Frederiksen (2010)
Iceland Shelf 530,000 23.7 A. Garðarsson (unpublished data)
West Greenland Shelf 103,348 4.6 Labansen et al. (2010)
Arctic Canada 121,000 5.4 A.J. Gaston & M.L. Mallory (unpublished data)
Newfoundland–Labrador Shelf 150,000 6.7 Hatch et al. (2009)
LME, large marine ecosystem.
Month
Med
ian
dist
ance
to c
olon
y (k
m)
0
1000
2000
3000
4000
5000 Stóra DímunHafnarhólmiKippakuGull Island
MonthAug Sep Oct Nov Dec Jan Feb Apr Aug Sep Oct Nov Dec Jan Feb Apr
Aug Sep Oct Nov Dec Jan Feb Apr Aug Sep Oct Nov Dec Jan Feb Apr
Med
ian
dist
ance
to c
olon
y (k
m)
0
1000
2000
3000
4000
5000 BulbjergIsle of MaySkomerRathlin
Month
Med
ian
dist
ance
to c
olon
y (k
m)
0
1000
2000
3000
4000
5000 AndaRøstHaltenFair Isle
Month
Med
ian
dist
ance
to c
olon
y (k
m)
0
1000
2000
3000
4000
5000
KongsfjordenGrumantBear IslandCape KrutikHornøya
Figure 3 Monthly median distance to the colony for birds from all study colonies in 2009/10. The median distance across birds and days
was based on smoothed positions.
M. Frederiksen et al.
536 Diversity and Distributions, 18, 530–542, ª 2011 Blackwell Publishing Ltd
several of the Norwegian colonies. In particular, the Svalbard
colonies (Grumant, Kongsfjorden and Bear Island) showed very
similar winter distributions, with a concentration of birds in the
West-Central Atlantic (Fig. 2a, cf. Fig. 3). Similarly, birds from
the colonies along the coast of northern Norway and Russia
(Røst, Anda, Hornøya and Cape Krutik) were concentrated east
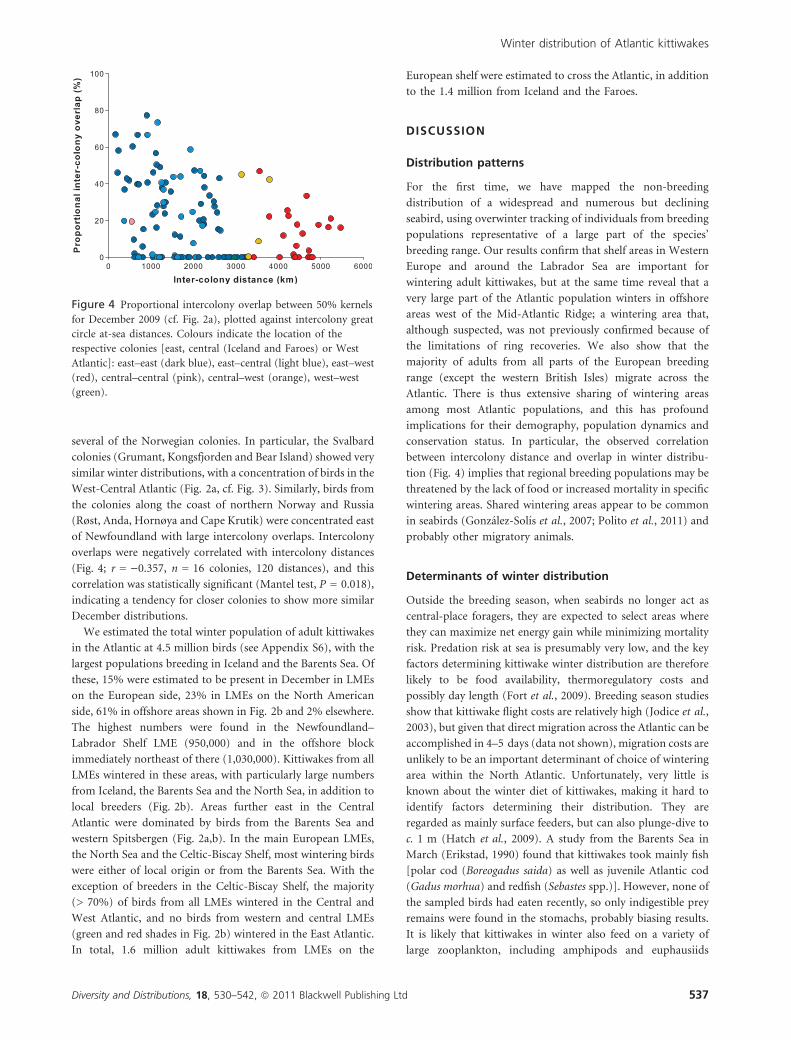
of Newfoundland with large intercolony overlaps. Intercolony
overlaps were negatively correlated with intercolony distances
(Fig. 4; r = )0.357, n = 16 colonies, 120 distances), and this
correlation was statistically significant (Mantel test, P = 0.018),
indicating a tendency for closer colonies to show more similar
December distributions.
We estimated the total winter population of adult kittiwakes
in the Atlantic at 4.5 million birds (see Appendix S6), with the
largest populations breeding in Iceland and the Barents Sea. Of
these, 15% were estimated to be present in December in LMEs
on the European side, 23% in LMEs on the North American
side, 61% in offshore areas shown in Fig. 2b and 2% elsewhere.
The highest numbers were found in the Newfoundland–
Labrador Shelf LME (950,000) and in the offshore block
immediately northeast of there (1,030,000). Kittiwakes from all
LMEs wintered in these areas, with particularly large numbers
from Iceland, the Barents Sea and the North Sea, in addition to
local breeders (Fig. 2b). Areas further east in the Central
Atlantic were dominated by birds from the Barents Sea and
western Spitsbergen (Fig. 2a,b). In the main European LMEs,
the North Sea and the Celtic-Biscay Shelf, most wintering birds
were either of local origin or from the Barents Sea. With the
exception of breeders in the Celtic-Biscay Shelf, the majority
(> 70%) of birds from all LMEs wintered in the Central and
West Atlantic, and no birds from western and central LMEs
(green and red shades in Fig. 2b) wintered in the East Atlantic.
In total, 1.6 million adult kittiwakes from LMEs on the
European shelf were estimated to cross the Atlantic, in addition
to the 1.4 million from Iceland and the Faroes.
DISCUSSION
Distribution patterns
For the first time, we have mapped the non-breeding
distribution of a widespread and numerous but declining
seabird, using overwinter tracking of individuals from breeding
populations representative of a large part of the species’
breeding range. Our results confirm that shelf areas in Western
Europe and around the Labrador Sea are important for
wintering adult kittiwakes, but at the same time reveal that a
very large part of the Atlantic population winters in offshore
areas west of the Mid-Atlantic Ridge; a wintering area that,
although suspected, was not previously confirmed because of
the limitations of ring recoveries. We also show that the
majority of adults from all parts of the European breeding
range (except the western British Isles) migrate across the
Atlantic. There is thus extensive sharing of wintering areas
among most Atlantic populations, and this has profound
implications for their demography, population dynamics and
conservation status. In particular, the observed correlation
between intercolony distance and overlap in winter distribu-
tion (Fig. 4) implies that regional breeding populations may be
threatened by the lack of food or increased mortality in specific
wintering areas. Shared wintering areas appear to be common
in seabirds (Gonzalez-Solıs et al., 2007; Polito et al., 2011) and
probably other migratory animals.
Determinants of winter distribution
Outside the breeding season, when seabirds no longer act as
central-place foragers, they are expected to select areas where
they can maximize net energy gain while minimizing mortality
risk. Predation risk at sea is presumably very low, and the key
factors determining kittiwake winter distribution are therefore
likely to be food availability, thermoregulatory costs and
possibly day length (Fort et al., 2009). Breeding season studies
show that kittiwake flight costs are relatively high (Jodice et al.,
2003), but given that direct migration across the Atlantic can be
accomplished in 4–5 days (data not shown), migration costs are
unlikely to be an important determinant of choice of wintering
area within the North Atlantic. Unfortunately, very little is
known about the winter diet of kittiwakes, making it hard to
identify factors determining their distribution. They are
regarded as mainly surface feeders, but can also plunge-dive to
c. 1 m (Hatch et al., 2009). A study from the Barents Sea in
March (Erikstad, 1990) found that kittiwakes took mainly fish
[polar cod (Boreogadus saida) as well as juvenile Atlantic cod
(Gadus morhua) and redfish (Sebastes spp.)]. However, none of
the sampled birds had eaten recently, so only indigestible prey
remains were found in the stomachs, probably biasing results.
It is likely that kittiwakes in winter also feed on a variety of
large zooplankton, including amphipods and euphausiids
Figure 4 Proportional intercolony overlap between 50% kernels
for December 2009 (cf. Fig. 2a), plotted against intercolony great
circle at-sea distances. Colours indicate the location of the
respective colonies [east, central (Iceland and Faroes) or West
Atlantic]: east–east (dark blue), east–central (light blue), east–west
(red), central–central (pink), central–west (orange), west–west
(green).
Winter distribution of Atlantic kittiwakes
Diversity and Distributions, 18, 530–542, ª 2011 Blackwell Publishing Ltd 537
(Mehlum & Gabrielsen, 1993; Lewis et al., 2001). In any case,
kittiwake prey is likely to be largely dependent on the dominant
mesozooplankton in the North Atlantic: calanoid copepods.
Most copepods with life cycles > 1 year overwinter at depth and
are thus unavailable to near-surface predators, but in the West
Atlantic (including the Labrador Sea), the most important
species Calanus finmarchicus is relatively abundant in near-
surface waters even in winter (Planque et al., 1997). This
concentration of an important secondary producer might
explain the importance of this area to many wintering seabirds,
including kittiwakes (Brown, 1986). Recent simultaneous
tracking of various top predators in the North Pacific has
demonstrated important multispecies hot spots and pointed to
environmental drivers of these patterns (Block et al., 2011).
Reliability and generality of results
We found that an estimated 80% of Atlantic kittiwakes
wintered in the Central and West Atlantic, including the
Labrador Sea, the shelf edges off Newfoundland and offshore
areas extending to the Mid-Atlantic Ridge. Most of the
remaining birds (15%) spent the winter in the North Sea
and west and south of the British Isles. However, this pattern
represents one non-breeding season only (2009/10), and
although the sample size was relatively large, some breeding
areas were less well represented than others. For example, the
large Icelandic population was only represented by 12 birds
from one colony, in contrast to 41 birds from three colonies in
the equally large Barents Sea population, and no colonies in the
Gulf of St. Lawrence were included. We have attempted to
compensate for this imbalance in our calculations, but a
possibility remains that birds from large, unrepresented
colonies behave differently from those included in the study.
Distribution patterns may also vary between years to an
unknown extent, perhaps linked to interannual variation in
prevailing weather patterns or distribution of important prey.
A comparison with patterns from the 2008/09 season for the
four colonies where data were available showed that the overall
patterns were similar (see Appendices S2–S4), but that a few
birds spent time in late winter around the Azores and in the
Canary Current off north-western Africa – an area where no
instrumented birds were found in 2009/10, despite much larger
sample size. Ringing studies have previously shown that
kittiwakes occasionally use this area in winter (Coulson,
2002; Bakken et al., 2003). A previous study in 2007/08 of Isle
of May kittiwakes also showed a very similar pattern to that
observed in 2009/10 (Bogdanova et al., 2011).
In addition to environmental conditions, the movements of
wide-ranging, opportunistic feeders such as kittiwakes are
influenced by their own state or condition. For example,
Bogdanova et al. (2011) found that unsuccessful breeders from
the Isle of May were more likely to migrate across the Atlantic
than successful breeders. This could perhaps explain the
pronounced differences in departure time and migration
distance observed among colonies in this data set (Figs 2a
and 3). For example, all study birds from Fair Isle and Stora
Dımun, where breeding success had been close to zero for
several years including 2009 (D. Shaw & B. Olsen, unpublished
data), left the colony early and crossed the Atlantic. Males and
females may also differ in migratory behaviour (Bogdanova
et al., 2011).
Our approach underestimates the number of birds wintering
north of about 69� N, primarily in the Barents Sea. In this area,
polar night precludes geolocation even though the logger
detects the sun 3� below the horizon, and many positions are
lost. One bird from Hornøya spent the entire winter in the
Barents Sea (Fig. 1c–e), but in December, only 15 smoothed
positions were obtained of a possible 62 (two per day). The
estimated number of birds wintering in the Barents Sea could
thus be four times as high as shown in Appendix S6, although
even if this were the case, only a small minority of birds would
winter in this area. Collectively, we believe that our results give
a robust indication of where Atlantic kittiwakes spend the
winter, although absolute numbers given in Appendix S6 and
Fig. 2b should only be taken as indicative.
Importantly, we have only mapped the distribution of adults.
While ring recoveries indicate that pre-breeders show a broadly
similar winter distribution (e.g. Coulson, 2002; Bakken et al.,
2003), the specific areas used and timing of movements may
well differ considerably among age groups (Barrett & Bakken,
1997; Reynolds et al., 2011). Future studies should address this
issue, although technical challenges are considerable.
Conservation implications
Our results show that kittiwakes from different parts of the
breeding range mix extensively in winter and that a large
proportion of the total wintering population is concentrated in
a particular sector of the West Atlantic. This has important
implications for the conservation and management of Atlantic
kittiwake breeding populations, many of which are declining
and have recently been regionally red-listed. The importance of
the Newfoundland–Labrador Sea area for wintering kittiwakes
is confirmed by at-sea surveys that regularly encounter high
densities both on the shelf and particularly along the shelf edge
northeast of Newfoundland (Fifield et al., 2009), although
these surveys do not cover offshore areas during winter.
Chronic oil pollution has been identified as a serious threat to
wintering auks in the same area (Wiese et al., 2004), but no
assessment has been made of the potential impact on
kittiwakes. Any major changes in food availability in this part
of the West Atlantic (e.g. projected changes in distribution of
C. finmarchicus; Reygondeau & Beaugrand, 2011) would be
likely to affect the entire Atlantic population, and future
demographic studies should investigate the relationship
between adult survival and environmental conditions in this
area, preferably linked with better information on winter diet.
Impacts of deterioration in environmental conditions in the
non-breeding range are particularly strong and widespread
when widely separated breeding populations share wintering
areas. Examples include migrant songbirds affected by drought
and habitat degradation in their tropical wintering areas
M. Frederiksen et al.
538 Diversity and Distributions, 18, 530–542, ª 2011 Blackwell Publishing Ltd
(Winstanley et al., 1974; Szep, 1995), as well as albatross
populations severely affected by bycatch mortality in longline
fisheries far from their breeding colonies (Small & Taylor,
2006; Rolland et al., 2008). In general, synchronization of
mortality among population subsets (e.g. age classes or local
populations) decreases population growth rate and increases
the likelihood of extinction (Fieberg & Ellner, 2001).
The strong spatial mixing in winter is consistent with the
relatively weak population genetic structure observed for
kittiwakes in the Atlantic (McCoy et al., 2005) and for other
pelagic seabirds (e.g. Riffaut et al., 2005), implying that gene
flow exists among the various populations. The occurrence of
large concentrations of birds of widely mixed geographical
origin could also be important in the context of directly
transmitted infectious agents such as Avian Influenza viruses
(Toennessen et al., 2011), although little is known about the
potential transmission risk of such agents among pelagic birds
while at sea.
Overall, there is a clear tendency for kittiwakes to overwinter
in the regions of the North Atlantic that are most influenced by
human activities (cf. Halpern et al., 2008). Combined with a
high degree of interpopulation mixing in winter, this implies
that successful conservation of this declining species is likely to
require coordinated action from management agencies respon-
sible for regulating these activities on national and trans-
national scales. Future initiatives towards ecosystem-based
resource management should take account of the habitat and
food requirements of overwintering seabirds, including kit-
tiwakes. More generally, conservation of migratory species in a
rapidly changing world is dependent on understanding the
degree of population mixing in non-breeding areas. Without
this knowledge, well-intended initiatives targeting regional
breeding populations may have little effect and lead to waste of
limited financial resources. Our approach to estimating the size
and composition of regional wintering populations could be
extended to other taxa and ecosystems if and when data
become available and thus contribute to successful manage-
ment of migratory species. Further miniaturization of data
loggers will allow this approach to be applied with smaller
species, e.g. songbirds (Tøttrup et al., 2011).
ACKNOWLEDGEMENTS
We thank all the people involved in deploying and retrieving
loggers, too many to mention here. Special thanks to Sarah
Wanless, Martin Heubeck, Chris Perrins, Dave Boyle, Dave
Fifield and Karen McCoy. Thomas Bauditz Hansen assisted with
data handling. James Fox answered technical queries about
geolocation and geolocators. Fieldwork was supported by many
organizations, including: the Norwegian SEAPOP programme
(eight sites in Norway and one in Russia), the French Polar
Institute [IPEV programmes 330 (O.C., Kongsfjorden) and 333
(T.B., Hornøya)], the Northern Ireland Environment Agency via
the Natural Heritage Research Partnership (L.S.C., Rathlin), the
Greenland Bureau of Minerals and Petroleum (M.F., Kippaku),
Environment Canada, Natural Resources Canada (PCSP),
Microsoft Research, Cambridge (T.G., Skomer) and Shetland
Oil Terminal Environmental Advisory Group (D.S., Fair Isle).
The joint analysis was supported by grants from SEAPOP to
T.A.-N. and from the Danish Ministry of the Environment to
M.F. Procedures followed relevant ethical guidelines and
legislation in all countries involved.
REFERENCES
Amante, C. & Eakins, B.W. (2009) ETOPO1 1 arc-minute
global relief model: procedures, data sources and analysis,
NOAA Technical Memorandum NESDIS NGDC-24.
Bakken, V., Runde, O. & Tjørve, E. (2003) Norsk ringmer-
kingsatlas (Norwegian Bird Ringing Atlas), Vol. 1. Stavanger
Museum, Stavanger, Norway.
Barbraud, C. & Weimerskirch, H. (2003) Climate and density
shape population dynamics of a marine top predator.
Proceedings of the Royal Society of London Series B, 270, 2111–
2116.
Barrett, R.T. & Bakken, V. (1997) Movements of Kittiwakes Rissa
tridactyla ringed in Norway. Ringing & Migration, 18, 25–32.
Barrett, R.T., Lorentsen, S.-H. & Anker-Nilssen, T. (2006) The
status of breeding seabirds in mainland Norway. Atlantic
Seabirds, 8, 97–126.
Bertram, D.F. & Harfenist, A. (2005) Ocean climate and El
Nino impacts on survival of Cassin’s Auklets from
upwelling and downwelling domains of British Columbia.
Canadian Journal of Fisheries and Aquatic Sciences, 62,
2841–2853.
BirdLife International (2004) Tracking ocean wanderers: the
global distribution of albatrosses and petrels. Results from the
Global Procellariiform Tracking Workshop, 1–5 September,
2003, Gordon’s Bay, South Africa, BirdLife International,
Cambridge, UK.
Block, B.A., Jonsen, I.D., Jorgensen, S.J. et al. (2011) Tracking
apex marine predator movements in a dynamic ocean.
Nature, 475, 86–90.
Bogdanova, M.I., Daunt, F., Newell, M., Phillips, R.A., Harris,
M.P. & Wanless, S. (2011) Seasonal interactions in the black-
legged kittiwake, Rissa tridactyla: links between breeding
performance and winter distribution. Proceedings of the
Royal Society B: Biological Sciences, 278, 2412–2418.
Bønløkke, J., Madsen, J.J., Thorup, K., Pedersen, K.T.,
Bjerrum, M. & Rahbek, C. (2006) Dansk trækfugleatlas (The
Danish Bird Migration Atlas), Rhodos, Humlebæk, Denmark.
Brown, R.G.B. (1986) Revised Atlas of Eastern Canadian Sea-
birds, Canadian Wildlife Service, Ottawa, ON.
Certain, G., Bellier, E., Planque, B. & Bretagnolle, V. (2007)
Characterising the temporal variability of the spatial distri-
bution of animals: an application to seabirds at sea.
Ecography, 30, 695–708.
Coulson, J.C. (2002) Black-legged Kittiwake (Kittiwake) Rissa
tridactyla. The Migration Atlas: Movements of the Birds of
Britain and Ireland (ed. by C.V. Wernham, M.P. Toms, J.H.
Marchant, J.A. Clark, G.M. Siriwardena and S.R. Baillie),
pp. 377–380. T. & A.D. Poyser, London.
Winter distribution of Atlantic kittiwakes
Diversity and Distributions, 18, 530–542, ª 2011 Blackwell Publishing Ltd 539
Daunt, F., Afanasyev, V., Silk, J.R.D. & Wanless, S. (2006)
Extrinsic and intrinsic determinants of winter foraging and
breeding phenology in a temperate seabird. Behavioral
Ecology and Sociobiology, 59, 381–388.
Egevang, C., Stenhouse, I.J., Phillips, R.A., Petersen, A.,
Fox, J.W. & Silk, J.R.D. (2010) Tracking of Arctic terns
Sterna paradisaea reveals longest animal migration. Pro-
ceedings of the National Academy of Sciences of the United
States of America, 107, 2078–2081.
Ekstrom, P.A. (2004) An advance in geolocation by light.
Memoirs of National Institute of Polar Research Special Issue,
58, 210–226.
Erikstad, K.E. (1990) Winter diets of four seabird species in the
Barents Sea after a crash in the capelin stock. Polar Biology,
10, 619–627.
Esler, D. (2000) Applying metapopulation theory to conser-
vation of migratory birds. Conservation Biology, 14, 366–372.
Fieberg, J. & Ellner, S.P. (2001) Stochastic matrix models for
conservation and management: a comparative review of
methods. Ecology Letters, 4, 244–266.
Fifield, D.A., Lewis, K.P., Gjerdrum, C., Robertson, G.J. &
Wells, R. (2009) Offshore Seabird Monitoring Program.
Environmental Studies Research Funds Report no. 183 St
John’s, Canada.
Fort, J., Porter, W.P. & Gremillet, D. (2009) Thermodynamic
modelling predicts energetic bottleneck for seabirds winter-
ing in the northwest Atlantic. Journal of Experimental
Biology, 212, 2483–2490.
Fox, J.W. (2010) Geolocator Manual v8 (March 2010), British
Antarctic Survey, Cambridge.
Frederiksen, M. (2010) Appendix 1: Seabirds in the North East
Atlantic. A review of status, trends and anthropogenic
impact. TemaNord, 587, 47–122.
Frederiksen, M., Wanless, S., Harris, M.P., Rothery, P. &
Wilson, L.J. (2004) The role of industrial fisheries and
oceanographic change in the decline of North Sea black-
legged kittiwakes. Journal of Applied Ecology, 41, 1129–
1139.
Frederiksen, M., Harris, M.P. & Wanless, S. (2005) Inter-
population variation in demographic parameters: a neglected
subject? Oikos, 111, 209–214.
Gaston, A.J., Brewer, D., Diamond, A.W., Woodsworth, E.J. &
Collins, B.T. (2008) Canadian Atlas of Bird Banding, Volume
2: Seabirds, 1921–1995, Special Publication, Canadian
Wildlife Service, Ottawa, ON.
Gonzalez-Solıs, J., Croxall, J.P., Oro, D. & Ruiz, X. (2007)
Trans-equatorial migration and mixing in the wintering
areas of a pelagic seabird. Frontiers in Ecology and the
Environment, 5, 297–301.
Gonzalez-Solıs, J., Smyrli, M., Militao, T., Gremillet, D., Tve-
raa, T., Phillips, R.A. & Boulinier, T. (2011) Combining
stable isotope analyses and geolocation to reveal kittiwake
migration. Marine Ecology Progress Series, 435, 251–261.
Grosbois, V. & Thompson, P.M. (2005) North Atlantic climate
variation influences survival in adult fulmars. Oikos, 109,
273–290.
Halpern, B.S., Walbridge, S., Selkoe, K.A., Kappel, C.V.,
Micheli, F., D’Agrosa, C., Bruno, J.F., Casey, K.S., Ebert, C.,
Fox, H.E., Fujita, R., Heinemann, D., Lenihan, H.S., Madin,
E.M.P., Perry, M.T., Selig, E.R., Spalding, M., Steneck, R. &
Watson, R. (2008) A global map of human impact on marine
ecosystems. Science, 319, 948–952.
Harris, M.P. & Wanless, S. (1996) Differential responses of
Guillemot Uria aalge and Shag Phalacrocorax aristotelis to a
late winter wreck. Bird Study, 43, 220–230.
Harris, M.P., Frederiksen, M. & Wanless, S. (2007) Within-
and between-year variation in the juvenile survival of
Common Guillemots Uria aalge. Ibis, 149, 472–481.
Harrison, X.A., Blount, J.D., Inger, R., Norris, D.R. & Bearhop,
S. (2011) Carry-over effects as drivers of fitness differences in
animals. Journal of Animal Ecology, 80, 4–18.
Hatch, S.A., Robertson, G.J. & Baird, P.H. (2009) Black-legged
Kittiwake (Rissa tridactyla). The Birds of North America Online
(ed. by A. Poole) Cornell Lab of Ornithology, Ithaca, NY.
Retrieved from the Birds of North America Online: http://
bna.birds.cornell.edu/bna/species/092doi:10.2173/bna.92.
Heubeck, M. (2004) Black-legged Kittiwake Rissa tridactyla.
Seabird Populations of Britain and Ireland (ed. by P.I.
Mitchell, S.F. Newton, N. Ratcliffe and T.E. Dunn), pp. 277–
290. T. & A.D. Poyser, London.
Hill, R.D. & Braun, M.J. (2001) Geolocation by light level – the
next step: latitude. Electronic Tagging and Tracking in Marine
Fisheries (ed. by J.R. Sibert and J. Nielsen), pp. 315–330.
Kluwer Academic Publishers, Dordrecht, The Netherlands.
Hooge, P.N. & Eichenlaub, B. (1997) Animal Movement
Extension to ArcView. Version 1.1, U.S. Geological Survey
Alaska, Biological Science Center, Anchorage, AK.
Jodice, P.G.R., Roby, D.D., Suryan, R.M., Irons, D.B.,
Kaufman, A.M., Turco, K.R. & Visser, G.H. (2003) Variation
in energy expenditure among black-legged kittiwakes: effects
of activity-specific metabolic rates and activity budgets.
Physiological and Biochemical Zoology, 76, 375–388.
Labansen, A.L., Merkel, F., Boertmann, D. & Nyeland, J. (2010)
Status of the black-legged kittiwake (Rissa tridactyla)
breeding population in Greenland, 2008. Polar Research, 29,
391–403.
Legendre, P. & Legendre, L. (1998) Numerical Ecology, 2nd
edn, Elsevier, Amsterdam.
Lewis, S., Wanless, S., Wright, P.J., Harris, M.P., Bull, J. &
Elston, D.A. (2001) Diet and breeding performance of black-
legged kittiwakes Rissa tridactyla at a North Sea colony.
Marine Ecology Progress Series, 221, 277–284.
Lyngs, P. (2003) Migration and winter ranges of birds in
Greenland. An analysis of ringing recoveries. Dansk Ornito-
logisk Forenings Tidsskrift, 97, 1–167.
McCoy, K.D., Boulinier, T. & Tirard, C. (2005) Comparative
host-parasite population structures: disentangling prospect-
ing and dispersal in the black-legged kittiwake Rissa tridactyla.
Molecular Ecology, 14, 2825–2838.
Mehlum, F. & Gabrielsen, G.W. (1993) The diet of high-arctic
seabirds in coastal and ice-covered, pelagic areas near the
Svalbard archipelago. Polar Research, 12, 1–20.
M. Frederiksen et al.
540 Diversity and Distributions, 18, 530–542, ª 2011 Blackwell Publishing Ltd
Newton, I. (2008) The Migration Ecology of Birds, Academic
Press, London.
Petersen, Æ. (1998) Islenskir fuglar, Vaka-Helgafell, Reykjavık.
Phillips, R.A., Silk, J.R.D., Croxall, J.P., Afanasyev, V. &
Briggs, D.R. (2004) Accuracy of geolocation estimates for
flying seabirds. Marine Ecology Progress Series, 266, 265–
272.
Planque, B., Hays, G.C., Ibanez, F. & Gamble, J.C. (1997) Large
scale spatial variations in the seasonal abundance of Calanus
finmarchicus. Deep-Sea Research I, 44, 315–326.
Polito, M.J., Lynch, H.J., Naveen, R. & Emslie, S.D. (2011)
Stable isotopes reveal regional heterogeneity in the pre-
breeding distribution and diets of sympatrically breeding
Pygoscelis spp. penguins. Marine Ecology Progress Series, 421,
265–277.
Reygondeau, G. & Beaugrand, G. (2011) Future climate-driven
shifts in the distribution of Calanus finmarchicus. Global
Change Biology, 17, 756–766.
Reynolds, T.J., Harris, M.P., King, R., Swann, R.L.,
Jardine, D.C., Frederiksen, M. & Wanless, S. (2011) Among-
colony synchrony in seabird survival reflects shared winter-
ing areas. Ibis, 153, 818–831.
Riffaut, L., McCoy, K.D., Tirard, C., Friesen, V.L. & Boulinier,
T. (2005) Population genetics of the common guillemot Uria
aalge in the North Atlantic: geographic impact of oil spills.
Marine Ecology Progress Series, 291, 263–273.
Rolland, V., Barbraud, C. & Weimerskirch, H. (2008) Com-
bined effects of fisheries and climate on a migratory long-
lived marine predator. Journal of Applied Ecology, 45, 4–13.
Saunders, R.A., Royer, F. & Clarke, M.W. (2011) Winter
migration and diving behaviour of porbeagle shark, Lamna
nasus, in the Northeast Atlantic. ICES Journal of Marine
Science, 68, 166–174.
Shaffer, S.A., Tremblay, Y., Weimerskirch, H., Scott, D.,
Thompson, D.R., Sagar, P.M., Moller, H., Taylor, G.A., Fo-
ley, D.G., Block, B.A. & Costa, D.P. (2006) Migratory
shearwaters integrate oceanic resources across the Pacific
Ocean in an endless summer. Proceedings of the National
Academy of Sciences of the United States of America, 103,
12799–12802.
Sherman, K. (2006) The Large Marine Ecosystem network
approach to WSSD targets. Ocean & Coastal Management,
49, 640–648.
Sillett, T.S., Holmes, R.T. & Sherry, T.W. (2000) Impacts of a
global climate cycle on population dynamics of a migratory
songbird. Science, 288, 2040–2042.
Small, C. & Taylor, F. (2006) Analysis of albatross and petrel
distribution within the CCAMLR convention area: results
from the global Procellariiform tracking database. CCAMLR
Science, 13, 143–174.
Szep, T. (1995) Relationship between west African rainfall and
the survival of central European Sand Martins Riparia
riparia. Ibis, 137, 162–168.
Toennessen, R., Germundsson, A., Jonassen, C.M., Haugen, I.,
Berg, K., Barrett, R.T. & Rimstad, E. (2011) Virological and
serological surveillance for type A influenza in the black-
legged kittiwake (Rissa tridactyla). Virology Journal, 8, 21.
Tøttrup, A.P., Klaassen, R.H.G., Strandberg, R., Thorup, K.,
Kristensen, M.W., Jørgensen, P.S., Fox, J., Afanasyev, V.,
Rahbek, C. & Alerstam, T. (2011) The annual cycle of a
trans-equatorial Eurasian–African passerine migrant: differ-
ent spatio-temporal strategies for autumn and spring
migration. Proceedings of the Royal Society B: Biological
Sciences, Online before print, doi:10.1098/rspb.2011.1323.
Weimerskirch, H. & Wilson, R.P. (2000) Oceanic respite for
wandering albatrosses. Nature, 406, 955–956.
Wernham, C.V. & Siriwardena, G.M. (2002) Analysis and
interpretation of the ring-recovery data. The Migration Atlas:
Movements of the Birds of Britain and Ireland (ed. by C.V.
Wernham, M.P. Toms, J.H. Marchant, J.A. Clark,
G.M. Siriwardena and S.R. Baillie), pp. 44–69. T. & A.D. Poyser,
London.
Wiese, F.K., Robertson, G.J. & Gaston, A.J. (2004) Impacts of
chronic marine oil pollution and the murre hunt in New-
foundland on thick-billed murre Uria lomvia populations in
the eastern Canadian Arctic. Biological Conservation, 116,
205–216.
Wilson, R.P., Duchamp, J.J., Rees, W.G., Culik, B.M. &
Niekamp, K. (1992) Estimation of location: global coverage
using light intensity. Wildlife Telemetry: Remote Monitoring
and Tracking of Animals (ed. by I.M. Priede and S.M. Swift),
pp. 131–134, Ellis Howard, Chichester, UK.
Winstanley, D., Spencer, R. & Williamson, K. (1974) Where
have all the whitethroats gone? Bird Study, 21, 1–14.
Zipkin, E.F., Gardner, B., Gilbert, A.T., O’Connell, A.F., Royle,
J.A. & Silverman, E.D. (2010) Distribution patterns of winter-
ing sea ducks in relation to the North Atlantic Oscillation and
local environmental characteristics. Oecologia, 163, 893–902.
SUPPORTING INFORMATION
Additional Supporting Information may be found in the online
version of this article:
Appendix S1 Estimation of the optimal sun angle.
Appendix S2 Locations of instrumented kittiwakes 2008/09.
Appendix S3 Monthly mean distance to colonies 2008/09.
Appendix S4 Areas used by kittiwakes December 2008.
Appendix S5 Overlap matrix of 50% kernels December 2009.
Appendix S6 Estimated numbers of kittiwakes in areas of
interest December 2009.
As a service to our authors and readers, this journal provides
supporting information supplied by the authors. Such mate-
rials are peer-reviewed and may be re-organized for online
delivery, but are not copy-edited or typeset. Technical support
issues arising from supporting information (other than missing
files) should be addressed to the authors.
Winter distribution of Atlantic kittiwakes
Diversity and Distributions, 18, 530–542, ª 2011 Blackwell Publishing Ltd 541

BIOSKETCHES
Morten Frederiksen is a senior researcher at Aarhus University. His main research interest is in documenting how
environmental change affects the population size and distribution of vertebrates, with seabirds as the favourite study
organisms. Increasingly, he works on large spatial scales, mainly in the Arctic and North Atlantic.
Author contributions: The concept behind this collaborative study was originally developed by T.A.-N., M.F., R.T.B., J.W.C. and B.O.
under the auspices of the International Council for the Exploration of the Seas’ Working Group on Seabird Ecology (ICES WGSE).
Further development, coordination and fundraising were led by M.F. and T.A.-N. All authors contributed to the collection and/or
management and analysis of logger data. B.M. processed all raw data from BAS loggers. M.F. carried out the GIS work and associated
analyses, with G.H.J. and T.A.-N. M.F., T.A.-N., F.D., B.M. and R.A.P. wrote the paper, with input from all other authors.
Editor: Robert Cowie
M. Frederiksen et al.
542 Diversity and Distributions, 18, 530–542, ª 2011 Blackwell Publishing Ltd


