Download - Monitoring Poverty More Regularly: Can labor force surveys and market research data help?

1
Monitoring Poverty More Regularly: Can labor force surveys and market research
data help?
Joao Pedro AzevedoLCSPP
More Frequent, More Timely & More Comparable Data for Better Results20 April 2011

More Frequent, More Timely & More Comparable Data for Better Results
2
The need
• Food crisis• Environmental shocks• Financial crisis
• Policy makers need to understand the consequences of such crisis to design responses
20 April 2011
More Frequent, More Timely & More Comparable Data for Better Results
3
How can we handle this?
• Econometrics + Assumptions• inFamous Poverty-Growth Elasticity• Imputation methods
• Collect new data and/or collect old data in different ways• Continuous household surveys• Listening 2 LAC
• Use existing information• Labor force surveys• Market research data• Administrative records (i.e. vital statistics)
20 April 2011

More Frequent, More Timely & More Comparable Data for Better Results
4
Two examples of using existing data in a different way
• Labor Income Poverty Index (LIPI)– Poverty and Labor Brief
http://lacpoverty/
• Prices and Quantities information from Nielsen on food and beverages
20 April 2011
More Frequent, More Timely & More Comparable Data for Better Results
5
LABOR INCOME POVERTY INDEX
20 April 2011

More Frequent, More Timely & More Comparable Data for Better Results
6
Labor Income Poverty Index (LIPI)
• How we do it:– Labor Income (70% of total income) – 12 months
moving average or 3 months moving average– Poverty line (national + usd/ppp)– Price data (monthly or quarterly)– Index Q1 2007 (base=1)
• Mexico March,2010 (CONEVAL)
20 April 2011

More Frequent, More Timely & More Comparable Data for Better Results
7
Labor Income Poverty Index (LIPI)(U$ 2.5 a day)
Jan 2007 - Jul 2010
20 April 2011
Q1 Q2 Q3 Q4 Q1 Q2 Q3 Q4 Q1 Q2 Q3 Q4 Q1 Q2 Q3 Q42007 2008 2009 2010
0.60
0.70
0.80
0.90
1.00
1.10
1.20
Mexico Peru Brazil
LIPI
(Q1
2007
= 1
)

More Frequent, More Timely & More Comparable Data for Better Results
8
MEXICO - Labor Income Poverty Index (LIPI)(U$ 2.5 a day)
Q1 2005 – Q4 2010
20 April 2011
Q1
Q2
Q3
Q4
Q1
Q2
Q3
Q4
Q1
Q2
Q3
Q4
Q1
Q2
Q3
Q4
Q1
Q2
Q3
Q4
Q1
Q2
Q3
Q4
2005 2006 2007 2008 2009 2010
0.60
0.70
0.80
0.90
1.00
1.10
1.20
1.30
Rural Urban Total
LIPI
(Q1
2007
= 1
)

More Frequent, More Timely & More Comparable Data for Better Results
9
Testing the validityColombia and Peru
• Continuous household survey
• Design– 2 random samples• Sample 1 : Poverty incidence (full income)• Sample 2 : LIPI (labor income)
20 April 2011
More Frequent, More Timely & More Comparable Data for Better Results
10
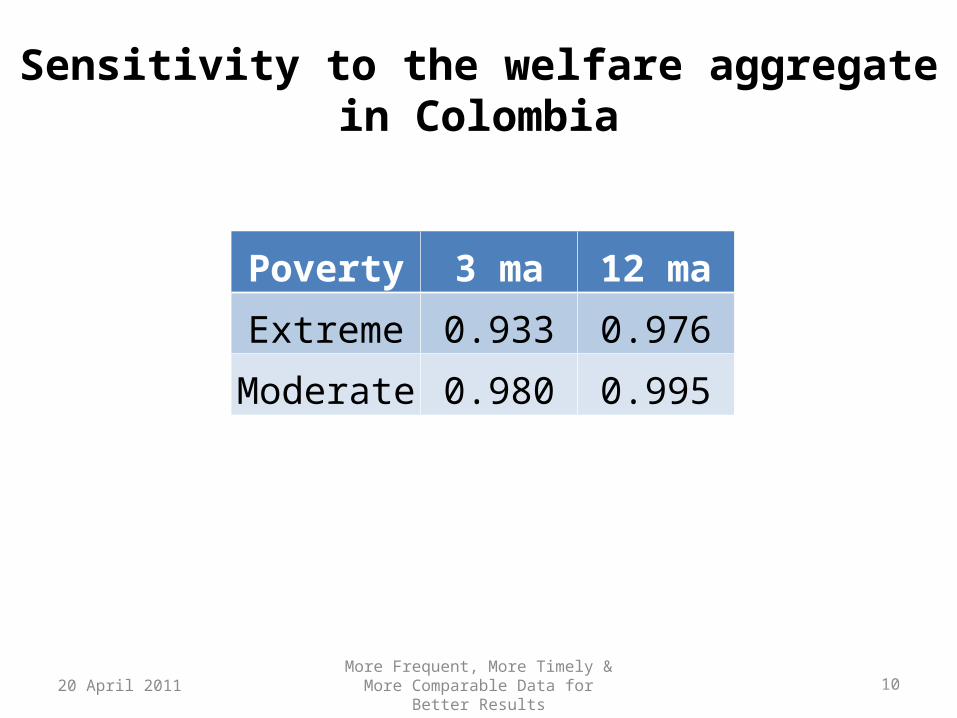
Sensitivity to the welfare aggregate in Colombia
20 April 2011
Poverty 3 ma 12 ma
Extreme 0.933 0.976
Moderate 0.980 0.995
More Frequent, More Timely & More Comparable Data for Better Results
11
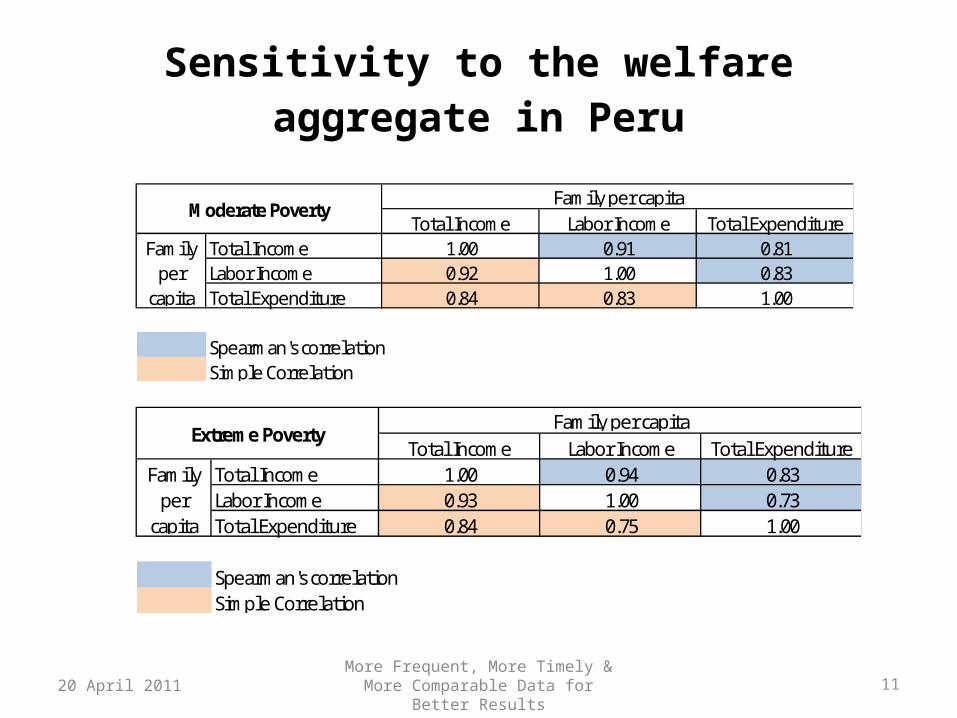
Sensitivity to the welfare aggregate in Peru
20 April 2011
Total Income Labor Income Total ExpenditureTotal Income 1.00 0.91 0.81Labor Income 0.92 1.00 0.83Total Expenditure 0.84 0.83 1.00
Spearman's correlationSimple Correlation
Family per capita
Family per
capita
Moderate Poverty
Total Income Labor Income Total ExpenditureTotal Income 1.00 0.94 0.83Labor Income 0.93 1.00 0.73Total Expenditure 0.84 0.75 1.00
Spearman's correlationSimple Correlation
Family per capita
Family per
capita
Extreme Poverty
More Frequent, More Timely & More Comparable Data for Better Results
12
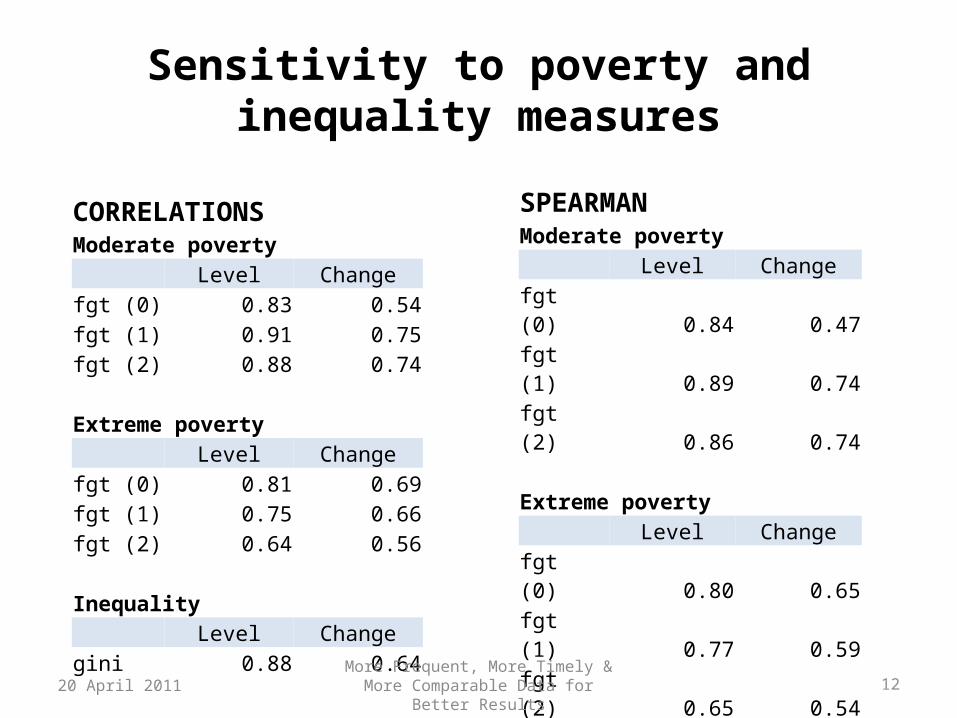
Sensitivity to poverty and inequality measures
CORRELATIONS Moderate poverty
Level Changefgt (0) 0.83 0.54fgt (1) 0.91 0.75fgt (2) 0.88 0.74 Extreme poverty
Level Changefgt (0) 0.81 0.69fgt (1) 0.75 0.66fgt (2) 0.64 0.56 Inequality
Level Changegini 0.88 0.64
SPEARMAN Moderate poverty
Level Changefgt (0) 0.84 0.47fgt (1) 0.89 0.74fgt (2) 0.86 0.74 Extreme poverty
Level Changefgt (0) 0.80 0.65fgt (1) 0.77 0.59fgt (2) 0.65 0.54 Inequality
Level Changegini 0.85 0.62
20 April 2011

More Frequent, More Timely & More Comparable Data for Better Results
13
MARKET RESEARCH DATA
20 April 2011

More Frequent, More Timely & More Comparable Data for Better Results
14
RMS – Nielsen Areas95% Population coverage
Zona no cubierta 5% población
Atlántico: Atlántico, Bolívar, Cesar, Córdoba, Guajira,Magdalena, SucreAtlántico: Atlántico, Bolívar, Cesar, Córdoba, Guajira,Magdalena, Sucre
Antioquia: AntioquiaAntioquia: Antioquia
Oriente: Boyacá, Meta, N. Santander, SantanderOriente: Boyacá, Meta, N. Santander, Santander
Cundinamarca: CundinamarcaCundinamarca: Cundinamarca
Centro: Caldas, Huila, Quindío, Risaralda, TolimaCentro: Caldas, Huila, Quindío, Risaralda, Tolima
Pacífico: Cauca, Nariño, VallePacífico: Cauca, Nariño, Valle
20 April 2011
15More Frequent, More Timely & More Comparable Data for Better Results
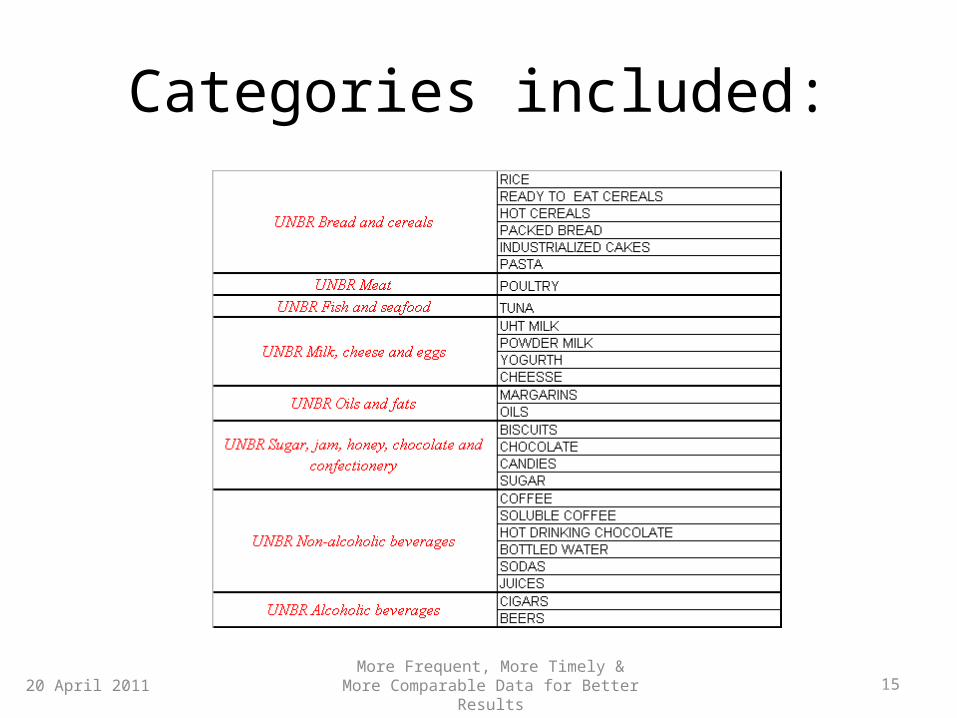
Categories included:
20 April 2011
16More Frequent, More Timely & More Comparable Data for Better Results
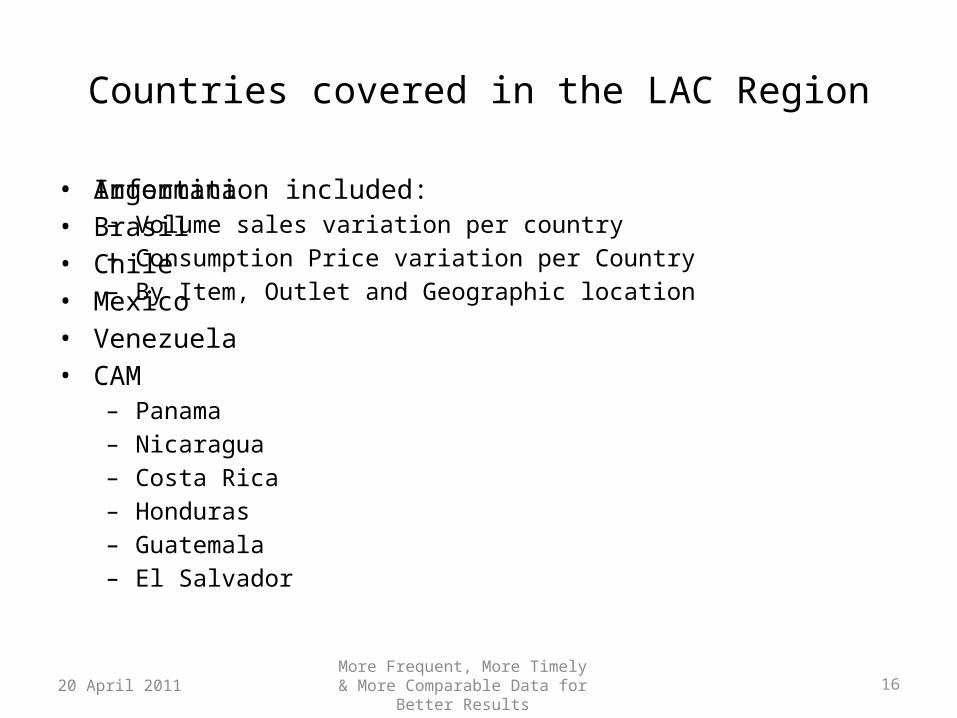
Countries covered in the LAC Region
• Argentina• Brasil• Chile• Mexico• Venezuela• CAM
– Panama– Nicaragua– Costa Rica– Honduras– Guatemala– El Salvador
• Information included:– Volume sales variation per country– Consumption Price variation per Country– By Item, Outlet and Geographic location
20 April 2011
17More Frequent, More Timely & More Comparable Data for Better Results
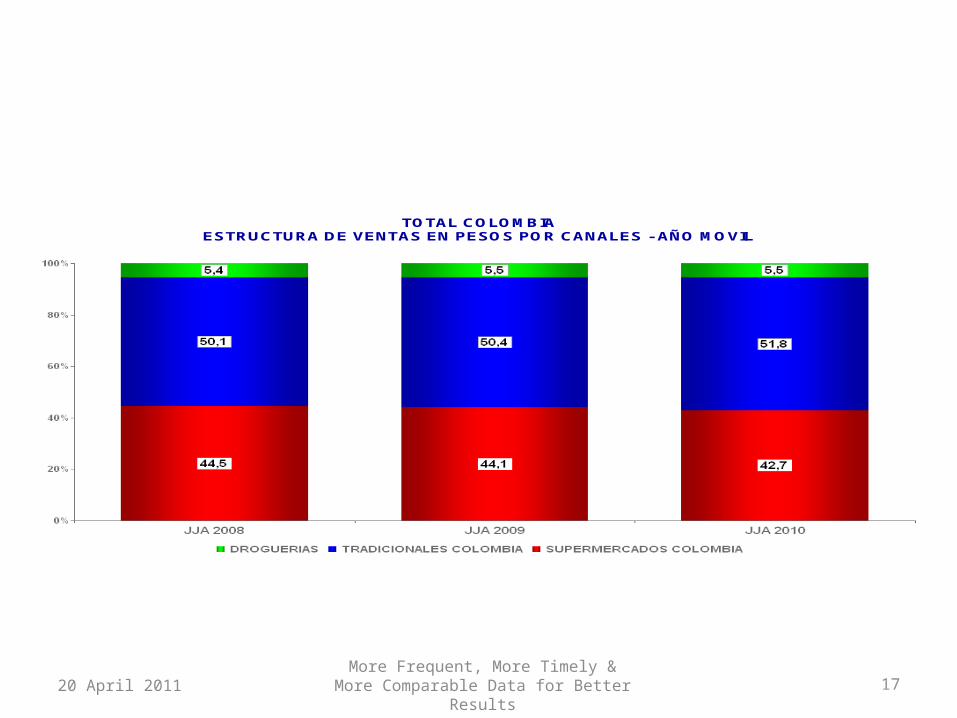
TOTAL COLOMBIAESTRUCTURA DE VENTAS EN PESOS POR CANALES - AÑO MOVIL
20 April 2011

More Frequent, More Timely & More Comparable Data for Better Results
18
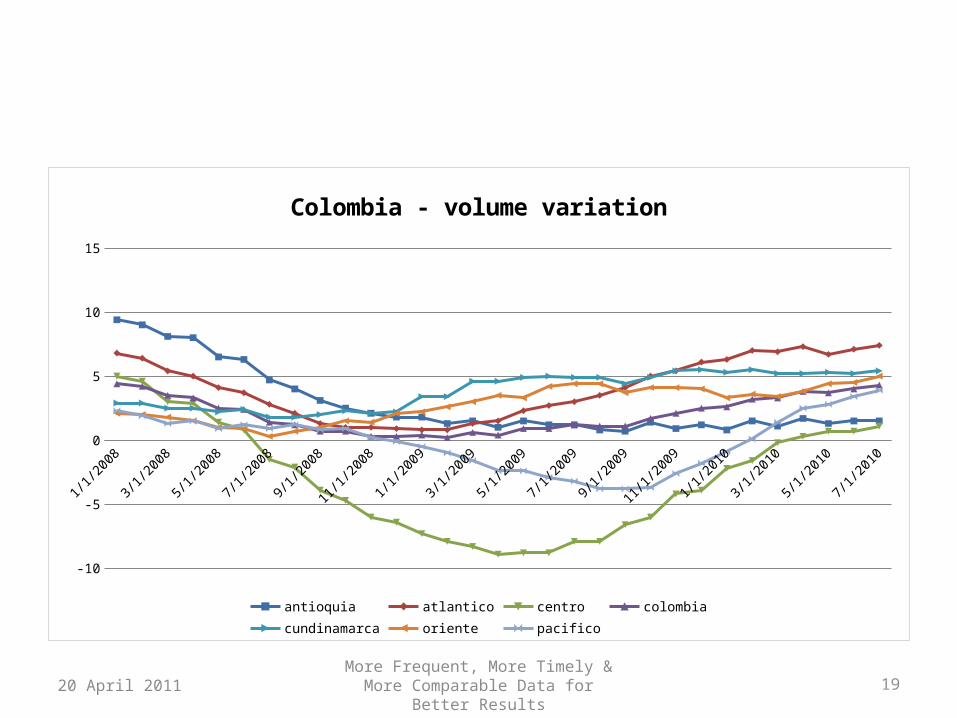
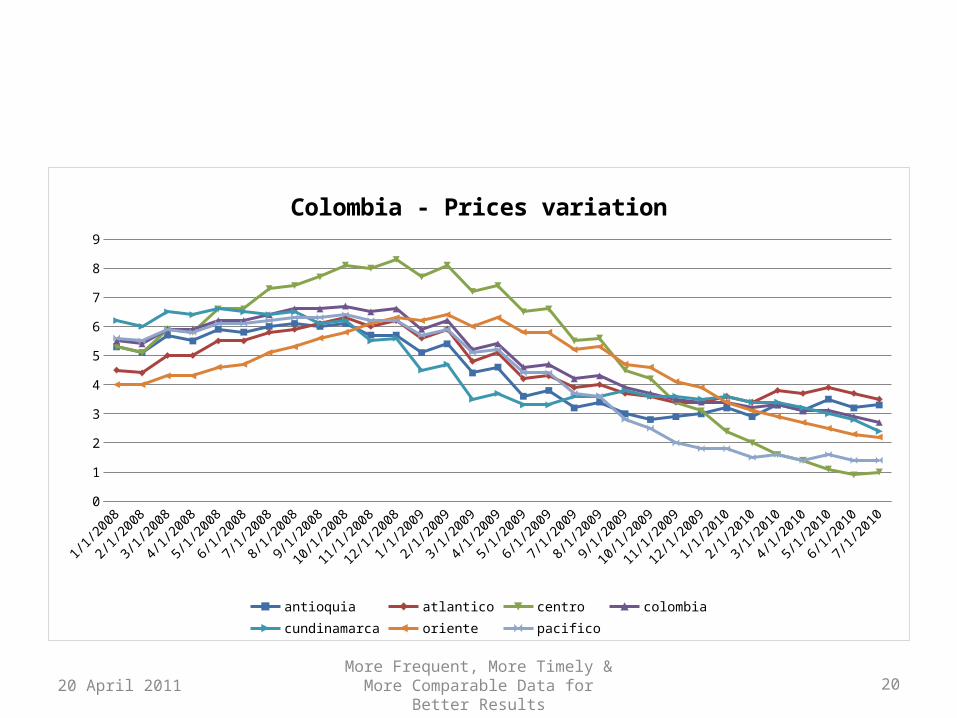
Volume and Price series
20 April 2011
Jan-08
Feb-08
Mar-08
Apr-08
May-08
Jun-08
Jul-08
Aug-08
Sep-08
Oct-08
Nov-08
Dec-08
Jan-09
Feb-09
Mar-09
Apr-09
May-09
Jun-09
Jul-09
Aug-09
Sep-09
Oct-09
Nov-09
Dec-09
Jan-10
Feb-10
Mar-10
Apr-10
May-10
Jun-10
Jul-10
0
1
2
3
4
5
6
7
8
Colombia
Average of volume Average of price
Chan
ge
More Frequent, More Timely & More Comparable Data for Better Results
1920 April 2011
1/1/2
008
2/1/2
008
3/1/2
008
4/1/2
008
5/1/2
008
6/1/2
008
7/1/2
008
8/1/2
008
9/1/2
008
10/1/2
008
11/1/2
008
12/1/2
008
1/1/2
009
2/1/2
009
3/1/2
009
4/1/2
009
5/1/2
009
6/1/2
009
7/1/2
009
8/1/2
009
9/1/2
009
10/1/2
009
11/1/2
009
12/1/2
009
1/1/2
010
2/1/2
010
3/1/2
010
4/1/2
010
5/1/2
010
6/1/2
010
7/1/2
010
-10
-5
0
5
10
15
Colombia - volume variation
antioquia atlantico centro colombia cundinamarca oriente pacifico
More Frequent, More Timely & More Comparable Data for Better Results
2020 April 2011
1/1/2
008
2/1/2
008
3/1/2
008
4/1/2
008
5/1/2
008
6/1/2
008
7/1/2
008
8/1/2
008
9/1/2
008
10/1/2
008
11/1/2
008
12/1/2
008
1/1/2
009
2/1/2
009
3/1/2
009
4/1/2
009
5/1/2
009
6/1/2
009
7/1/2
009
8/1/2
009
9/1/2
009
10/1/2
009
11/1/2
009
12/1/2
009
1/1/2
010
2/1/2
010
3/1/2
010
4/1/2
010
5/1/2
010
6/1/2
010
7/1/2
0100
1
2
3
4
5
6
7
8
9
Colombia - Prices variation
antioquia atlantico centro colombia cundinamarca oriente pacifico
More Frequent, More Timely & More Comparable Data for Better Results
2120 April 2011
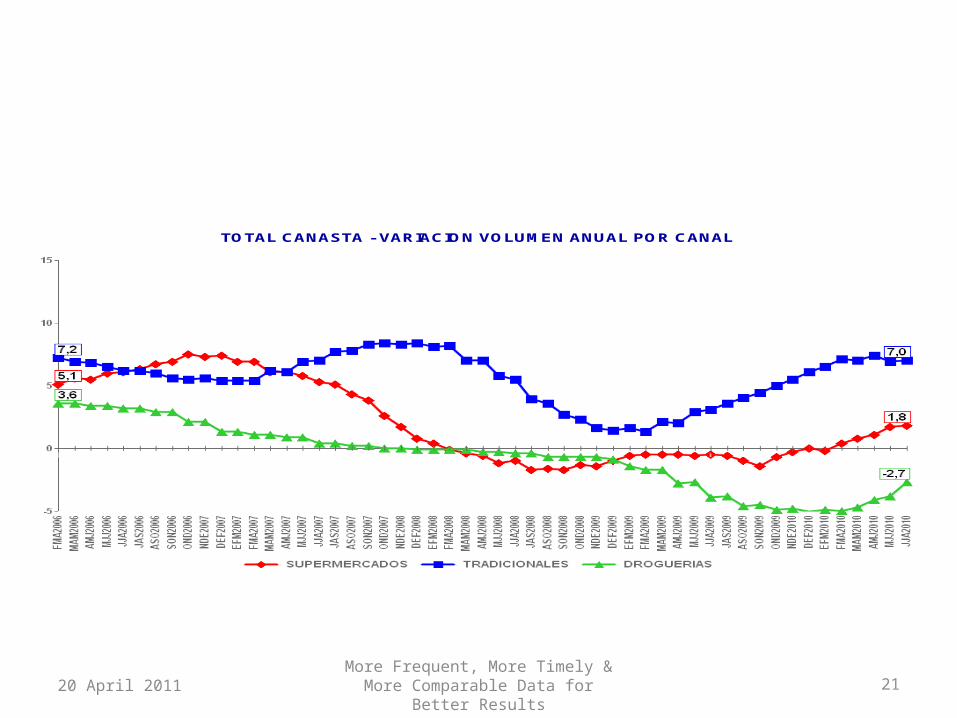
TOTAL COLOMBIAESTRUCTURA DE VENTAS EN PESOS POR CANALES - AÑO MOVIL
TOTAL CANASTA - VARIACION VOLUMEN ANUAL POR CANAL
More Frequent, More Timely & More Comparable Data for Better Results
2220 April 2011
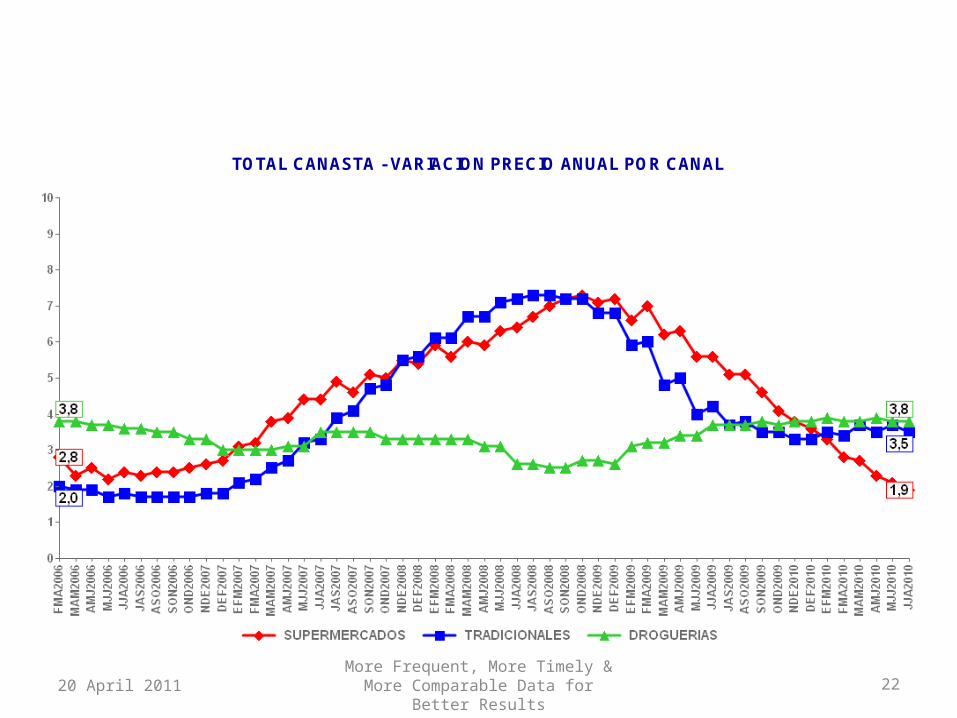
TOTAL CANASTA - VARIACION PRECIO ANUAL POR CANAL

More Frequent, More Timely & More Comparable Data for Better Results
23
Applications
• Tracking of wellbeing, proxy by consumption• Reweighting of the index to better reflect the
consumption patters of the poorer• Better estimation of elasticities and cross-
elasticities of substituion• Distributional analysis
20 April 2011

More Frequent, More Timely & More Comparable Data for Better Results
24
Final considerations
• Labor income explains most of the poverty variation
• High correlation between income, expenditure and labor income poverty measures
• Highlights the importance to improve income measure in the region
• Market research data can help
20 April 2011


