
Modern volleyball aspects
Picture of the Game - 2016
2
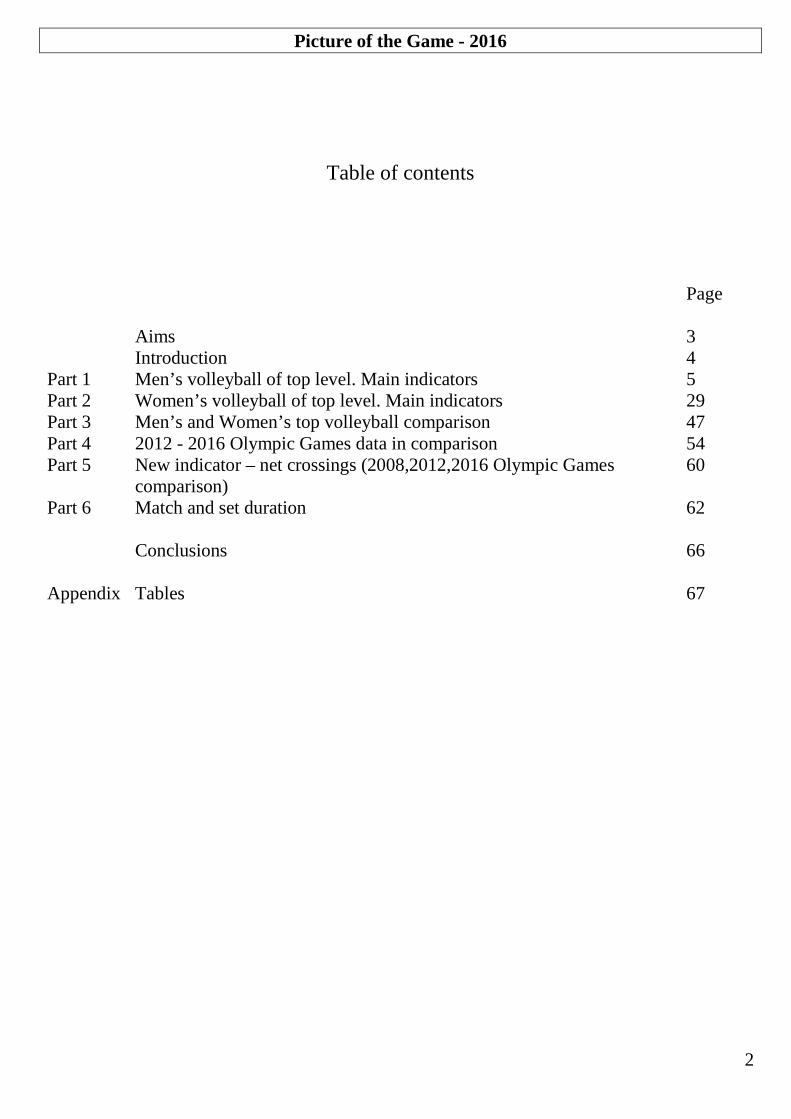
Table of contents
Page
Aims 3 Introduction 4 Part 1 Men’s volleyball of top level. Main indicators 5 Part 2 Women’s volleyball of top level. Main indicators 29 Part 3 Men’s and Women’s top volleyball comparison 47 Part 4 2012 - 2016 Olympic Games data in comparison 54 Part 5 New indicator – net crossings (2008,2012,2016 Olympic Games
comparison) 60
Part 6 Match and set duration 62
Conclusions 66
Appendix Tables 67
Picture of the Game - 2016
3
AIMS The aims of this project are as follows:
1. To investigate and collect data on critical indicators of the game. 2. To compare the data for 2015-16 with previous data. 3. To contrast specifically the data obtained for the Rio Olympics with that of the London Olympics.

Picture of the Game - 2016
4
Introduction
This year, as well as for the previous 10 years since 2006, and in line with the permanent monitoring of Volleyball development trends and evolution, the scientific research of the main Game indicators for the top level men’s and women’s teams (Joint project of the Rules of the Game and Refereeing Commissions “Picture of the Game”) is foreseen as one of the most important tasks. It is also of significant relevance to our abilities to create a product which can be marketed world-wide.
The results of this scientific statistical research are regularly reported to the FIVB President and always generate a positive response to its value. This was again confirmed during the last Joint meeting of RGC&IRC in January, 2016. The FIVB President strongly supported the idea that any changes in Volleyball must be based on sustainable scientific research. Here in aims 1 and 2 the statistical results are strong as the sample size was sufficient to guarantee validity of the findings. The comparators for London and Rio (aim 3) are less strong due to a reduced sample size – nevertheless the results for this comparison are reinforced by the different indicators telling the same story.
Taking into consideration the latest FIVB innovations: modern technology (new Hawk-eye challenge, tablets, headsets, etc.), measures for shortening intervals between rallies and the adaptation of match duration to the demands of TV, the results of the research reflect not only the dynamic of volleyball trends, but also their degree of influence on volleyball development.
In terms of structure, the report is divided into six parts or “chapters”. The reason for this is that in reality we have more than one sport of volleyball; while sharing the same rules, the men’s and women’s games show distinct characteristics of their own. In chapters one and two, the various aspects of the game are treated separately, while in chapter three the men’s and women’s games are compared and contrasted in the key areas which define our sport. In part 4, the focus becomes the comparison between the Olympic Games of London and the games of Rio de Janeiro. Here we hope to determine if in the key areas, the game has progressed or if there are aspects we should look at before we have to look at them. In part 5, we have identified a new parameter to highlight – net crossings. While we can see from our existing studies the length in time for the average rally, and may conclude that if it is shorter than before, then there is something wrong with the dynamic of the game. This would see at odds with a further statistic which reveals more ball contacts in the same time frame. If we then say that the play is faster and more dynamic, what evidence do we have to back up this premise? Hence by augmenting our existing studies with new data looking at net crossings we can see exactly what the increased athleticism and speed of the game is doing to the one aspect which we all relate to: exciting rallies where the ball crosses the net several times. The new indicator compares matches from the Olympic Finals from 2008, 2012, and 2016, in order to determine the trend in this “excitement indicator” over the period.
Part 6 deals specifically with match duration.
Finally, there is a summary of findings and recommendations, based on the previous analysis.
Sergey Titov, Sandy Steel, Picture of the Game project leader Picture of the Game project analyst

Picture of the Game - 2016
5
Part 1.
Men’s volleyball of top level. Main indicators.

Picture of the Game - 2016
6
Part 1.
Men’s volleyball of top level. Main indicators
On the basis of 2016 FIVB World League final tournament (Krakov, Poland, 13-17.07.2016) the following statistical data reflecting the main volleyball indicators and has been obtained:
1. Rally duration
Average rally duration – 5,51 sec. Average rally duration without pseudo-rallies – 6,9 sec.
Dynamic of a rally duration indicator
012345678
Average rallyduration
Average rallyduration withoutpseudo-rallies

Picture of the Game - 2016
7
Variability of a rally duration indicator
0246810121416
Average rally duration
Average rally durationwithout pseudo-rallies
2006 2007 2008 2009 2010 2011
Average rally duration 5,5 4,9 5,8 5,9 5,5 5,4 Average rally duration without pseudo-rallies 7 6,8 6,6 7,6 6,8 7,2 2012 2013 2014 2015 2016
Average rally duration 5,4 5,7 5,52 5,51 5,51 Average rally duration without pseudo-rallies 6,9 7 6,8 6,59 6,9

Picture of the Game - 2016
8
15%
85%
Rallies time
All setsduration
Comment: Rally duration is one of the key Game indicators. This has been very stable during the last 10 years, and especially over the last 3 years, despite of all our efforts to increase it. The variability between different matches is small and therefore not significant. In order to change it towards greater rally prolongation, it may be necessary to make changes involving further ball handling liberalization (perhaps some liberalization of the second team hit, for example, or a more strict view of the 1st hit reception may be required). If the pseudo-rallies factor (i.e. rallies involving only service) can be completely eliminated, it is believed that average rally duration will extend by more than one second. See recommendations at the end of the report.
2. “Flying ball” “Flying ball” – 15,43% from total duration of all sets, OR 13,05% from
total match time
BRA-ITA POL-FRA POL-SRB USA-ITA BRA-USA Average rally duration 5,07 5,43 5,32 5,33 5,57 Average rally duration without pseudo-rallies 6,38 6,92 6,67 6,75 6,96
SRB-FRA SRB-ITA FRA-BRA SRB-BRA FRA-ITA Average rally duration 5,51 6,34 5,69 5,38 5,08 Average rally duration without pseudo-rallies 6,78 7,8 6,88 6,54 6,45

Picture of the Game - 2016
9
Dynamic of a “flying ball” indicator
2006 2007 2008 2009 2010 2011 From total duration of all sets
18% 15% 17% 17% 15,7% 16,0%
From total match time --- --- 15,6% 15,5% 14,5% 14,6%
2012 2013 2014 2015 2016 From total duration of all sets
17,6% 16% 15,2% 14,68% 15,43%
From total match time 15,3% 14% 14,2% 13,42% 13,05%
0%2%4%6%8%10%12%14%16%18%20%
Portion of ralliestime in setsduration time
Picture of the Game - 2016
10
23%
77%
Pseudo-rallies
Rallies
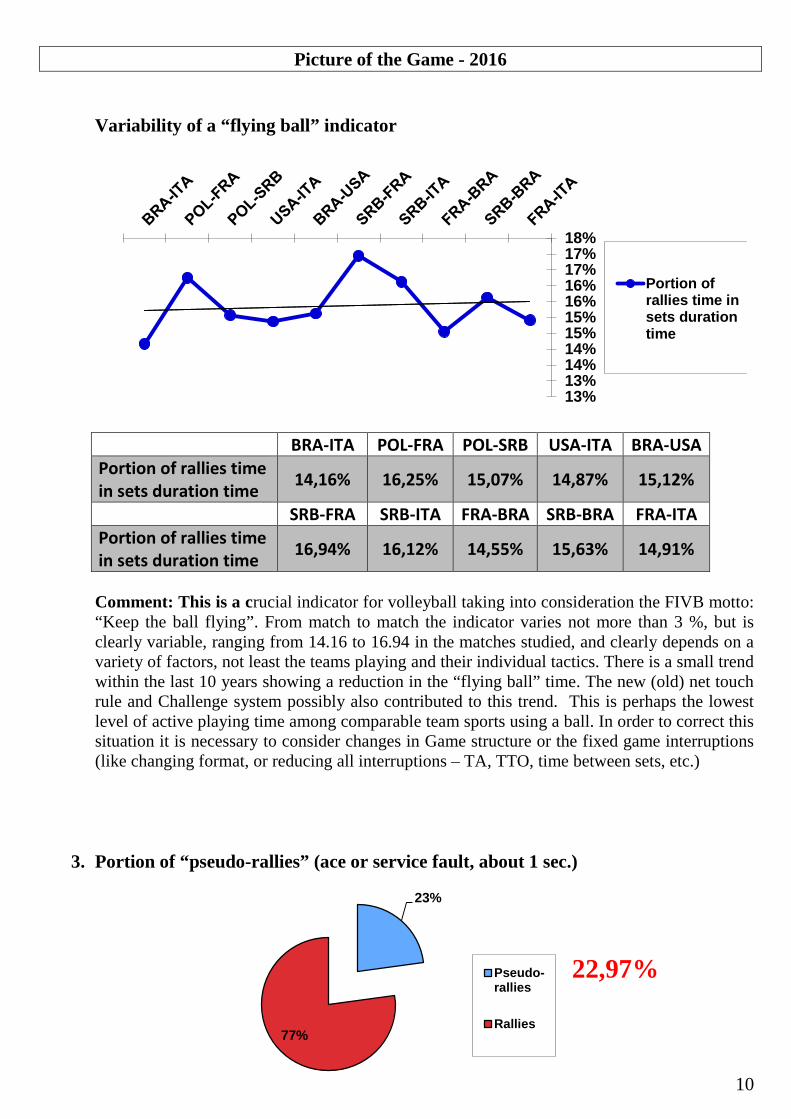
Variability of a “flying ball” indicator
BRA-ITA POL-FRA POL-SRB USA-ITA BRA-USA Portion of rallies time in sets duration time 14,16% 16,25% 15,07% 14,87% 15,12%
SRB-FRA SRB-ITA FRA-BRA SRB-BRA FRA-ITA Portion of rallies time in sets duration time 16,94% 16,12% 14,55% 15,63% 14,91%
Comment: This is a crucial indicator for volleyball taking into consideration the FIVB motto: “Keep the ball flying”. From match to match the indicator varies not more than 3 %, but is clearly variable, ranging from 14.16 to 16.94 in the matches studied, and clearly depends on a variety of factors, not least the teams playing and their individual tactics. There is a small trend within the last 10 years showing a reduction in the “flying ball” time. The new (old) net touch rule and Challenge system possibly also contributed to this trend. This is perhaps the lowest level of active playing time among comparable team sports using a ball. In order to correct this situation it is necessary to consider changes in Game structure or the fixed game interruptions (like changing format, or reducing all interruptions – TA, TTO, time between sets, etc.)
3. Portion of “pseudo-rallies” (ace or service fault, about 1 sec.)
22,97%
13%13%14%14%15%15%16%16%17%17%18%
Portion ofrallies time insets durationtime

Picture of the Game - 2016
11
Dynamic of “pseudo-rallies” indicator
Variability of “pseudo-rallies” indicator
0%
5%
10%
15%
20%
25%
30%
Portion ofpseudo-rallies
0%
5%
10%
15%
20%
25%
30%
Portion ofpseudo-rallies

Picture of the Game - 2016
12
47%
53%
Two and more attack rally
One attack rally
BRA-ITA POL-FRA POL-SRB USA-ITA BRA-USA Portion of pseudo-rallies 24,24% 25,12% 23,46% 24,62% 23,32%
SRB-FRA SRB-ITA FRA-BRA SRB-BRA FRA-ITA Portion of pseudo-rallies 21,9% 20,85% 20,29% 21,58% 25,18%
Comment: This indicator was very unstable during the last decade, but relatively stable within the last 4 years (between 20% and 25 %). The main reason for having a high percentage of “pseudo-rallies” has been the increase in the very risky jump service, due to the fact that the less risky service (less power) will most likely lead to the successful attack by the receiving team, who will then win the rally at the first attempt. One of the possible ways to decrease the need for and percentage of risky power jump services is to consider how to ensure that there is not always a very good reception after the floating service (in order to generate a less powerful attack). In other words, we really need the serving team to win the rally – this means reducing the risk of a service failure; this is where the reception should be weakened. The overhand reception creates the wrong conditions from our point of view. While we are unlikely to see this modified in the foreseeable future, some new ball structure which allows service swerve over a long distance (12 metres) but which flies true over a short distance (6-8 metres) should be considered to benefit the rally.
4. One attack rally out of all rallies (without pseudo-rallies)
2016 value: 52,97%

Picture of the Game - 2016
13
Dynamic of “one attack rally” indicator
2006 2007 2008 2009 2010 2011
One attack rally 75% 73% 63% 68% 66% 68%
2012 2013 2014 2015 2016
One attack rally 55% 52% 52,3% 52,22% 52,97%
0%
10%
20%
30%
40%
50%
60%
70%
80%
2006
2007
2008
2009
2010
2011
2012
2013
2014
2015
2016
Portion of oneattack rallies
Linear (Portionof one attackrallies)

Picture of the Game - 2016
14
24%
76%
Two and moreattack rally
One and lessattack rally
Variability of “one attack rally” indicator
BRA-ITA POL-FRA POL-SRB USA-ITA BRA-USA Portion of one attack rallies 53,03% 48,34% 53,63% 51,76% 50,67%
SRB-FRA SRB-ITA FRA-BRA SRB-BRA FRA-ITA Portion of one attack rallies 55,71% 51,18% 57% 57,55% 52,52%
Comment: This indicator was relatively stable during the past 4 years (52%-53%). There was an obvious trend of reducing the portion of one-attack rallies. The variability of this indicator in different matches is +/- 5%. (i.e. it depends very much on which teams are playing, their abilities and tactics).
5. One and less attack rallies out of all rallies (with pseudo-rallies).
42%44%46%48%50%52%54%56%58%60%
Portion ofone attackrallies
Picture of the Game - 2016
15
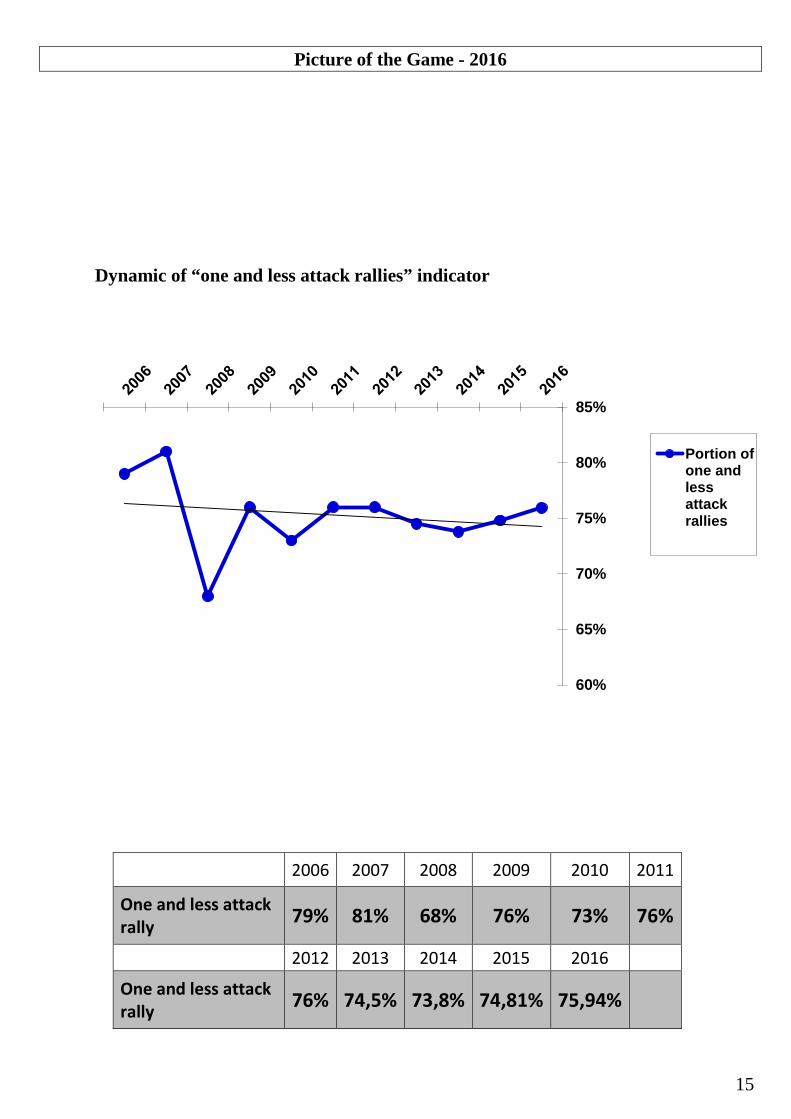
Dynamic of “one and less attack rallies” indicator
60%
65%
70%
75%
80%
85%
Portion ofone andlessattackrallies
2006 2007 2008 2009 2010 2011
One and less attack rally 79% 81% 68% 76% 73% 76%
2012 2013 2014 2015 2016 One and less attack rally 76% 74,5% 73,8% 74,81% 75,94%

Picture of the Game - 2016
16
Variability of “one attack rally” indicator
Comment: This has been a relatively stable indicator over the last 8 years (73%-76%). The variability of this indicator in different matches is between 72% and 79% that means +/- 3,5 %. Practically it means that out from 4 rallies, only one rally consists of more than one attack (long rally). This last comment is key to our understanding of the game dynamic and of our willingness to search for ways to make the game more attractive to a public which demands long rallies and spectacular defensive play.
68%
70%
72%
74%
76%
78%
80%
Portion ofone andless attackrallies
BRA-ITA POL-FRA POL-SRB USA-ITA BRA-USA Portion of one and less attack rallies 77,27% 73,46% 77,09% 76,38% 73,99%
SRB-FRA SRB-ITA FRA-BRA SRB-BRA FRA-ITA Portion of one and less attack rallies 77,61% 72,03% 77,29% 79,13% 77,7%

Picture of the Game - 2016
17
6. Average number of ball contacts during one rally (without pseudo- rallies)
2016 Value: 6,5
Dynamic of “ball contacts” indicator
2006 2007 2008 2009 2010 2011 Average number of ball contacts during one rally
4,5 4,6 4,7 5,4 4,7 4,9
2012 2013 2014 2015 2016 Average number of ball contacts during one rally
5,7 6,7 6,4 6,6 6,5
0.00
1.00
2.00
3.00
4.00
5.00
6.00
7.00
8.00
Ball contactsduring a rally

Picture of the Game - 2016
18
Variability of “ball contacts” indicator
Comment: This has been a relatively stable indicator over the last 4 years (6,4-6,7 contacts per rally on average). There is a clear trend of increasing the number of ball contacts in each rally during the last decade. This trend means that the game has become faster and the players nowadays are able to make more technical actions within one rally. The variability of this indicator in different matches is not significant (between 6,12 and 7,35).
0.001.002.003.004.005.006.007.008.00 Ball
contactsduring arally
BRA-ITA POL-FRA POL-SRB USA-ITA BRA-USA Ball contacts during a rally 6,12 6,63 6,44 6,55 6,55
SRB-FRA SRB-ITA FRA-BRA SRB-BRA FRA-ITA Ball contacts during a rally 6,34 7,35 6,44 6,23 6,25

Picture of the Game - 2016
19
23%
53%
24% pseudo-rallies
One attack rally
More than one attack rally
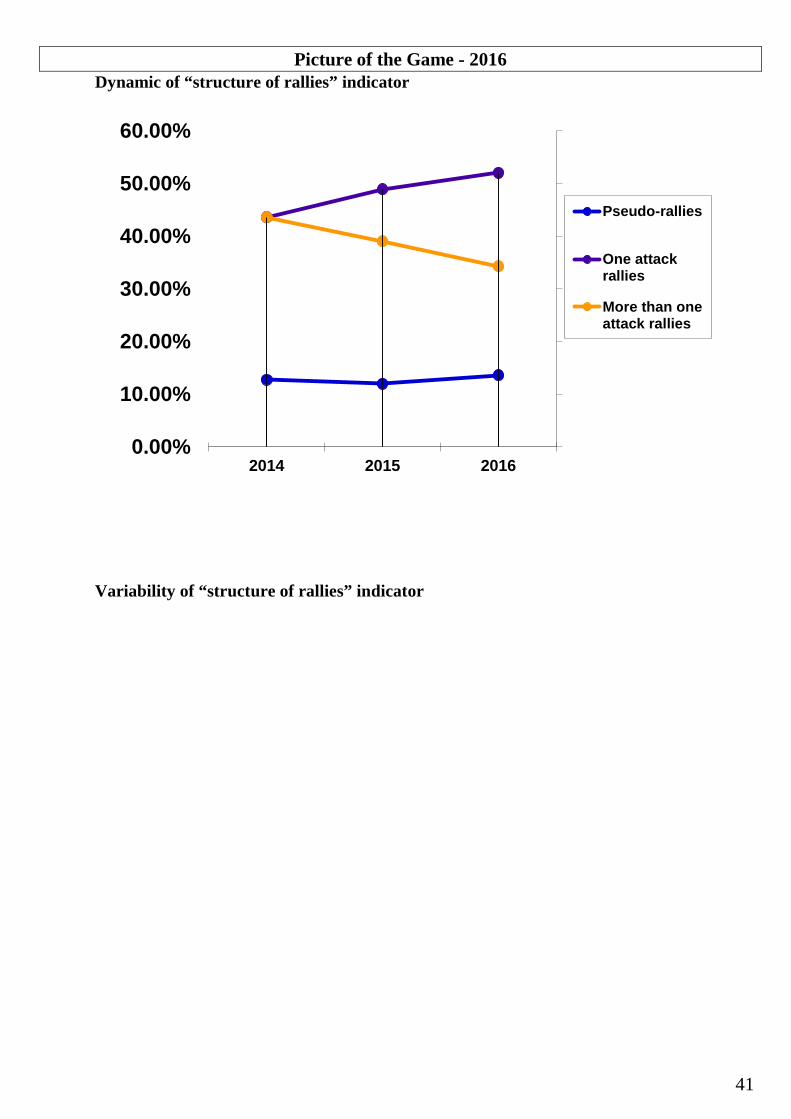
7. Structure of rallies
Dynamic of “structure of rallies” indicator
Pseudo-rallies
One attackrallies
More than oneattack rallies

Picture of the Game - 2016
20
2006 2007 2008 2009 2010 2011 Pseudo-rallies 21% 28% 12% 23% 20% 26%
One attack rallies 59% 52% 56% 53% 53% 50%
More than one attack rallies 20% 20% 32% 24% 27% 24%
2012 2013 2014 2015 2016 Pseudo-rallies 25% 22% 21,5% 21,59% 22,97%
One attack rallies 55% 52% 52,3% 50,03% 52,97%
More than one attack rallies 20% 26% 26,2% 28,38% 24,06%
Variability of “structure of rallies” indicator
Pseudo-rallies
One attack rallies
More than oneattack rallies

Picture of the Game - 2016
21
BRA-ITA POL-FRA POL-SRB USA-ITA BRA-USA Pseudo-rallies 24,24% 25,12% 23,46% 24,62% 23,32%
One attack rallies 53,03% 48,34% 53,63% 51,76% 50,67%
More than one attack rallies
22,73% 26,54% 22,91% 23,62% 26,01%
SRB-FRA SRB-ITA FRA-BRA SRB-BRA FRA-ITA Pseudo-rallies 21,91% 20,86% 20,29% 21,58% 25,18%
One attack rallies 55,71% 51,18% 57,01% 57,56% 52,52%
More than one attack rallies
22,38% 27,96% 22,7% 20,86% 22,3%
Comment: There has been more or less a stable structure of rallies within the last 4 years. The variability of this indicator in different matches is small. It is interesting that generally the percentage of pseudo-rallies is very close to the percentage of long rallies (more than one attack).

Picture of the Game - 2016
22
8. Attack-defence balance*
2016 Value: 2
* number of rallies won on the opponent service divided on number of rallies won on own service
Remark: attack-defence balance without pseudo-rallies is 1,8
Dynamic of “attack-defence balance” indicator
2006 2007 2008 2009 2010 2011
Attack-defence balance 3 2,3 2,02 2,2 2,45 2,02
2012 2013 2014 2015 2016 Attack-defence balance 2,09 1,85 2,18 2 2
00.5
11.5
22.5
33.5
4
Attack-defencebalance

Picture of the Game - 2016
23
Variability of “attack-defence balance” indicator
Comment: Here the long term trend is positive – the imbalance between attack and defense is shortening (from a high point of 3 down to a more acceptable 2). In 2016, as in 2015, this indicator shows no change - i.e. it maintains the value of 2 quoted above. The variability of this indicator in different matches is significantly large +/- 0,28. The current state of this indicator means that in men’s volleyball there is still a significant imbalance between attack and defense, and if a team receives a service, most likely (in two out of three cases) this team will win this rally. Current very “soft” and “liberal” service reception criteria are likely to be the main factor in creating this imbalance (see above). Another factor likely to contribute to this imbalance is keeping the same net height (2,43 m.) during almost 70 years while at the top level the players’ average height and physical conditions have increased significantly (although a high spike is usually met with a high block, making the net irrelevant in most cases, and the cost world wide of changing this would mitigate against the average federation’s ability to promote the game).
0
1
2
3
4
BRA-ITA
POL-FRA
POL-SRB
USA-ITA
BRA-USA
SRB-FRA
SRB-ITA
FRA-BRA
SRB-BRA
FRA-ITA
Attack-defencebalance
BRA-ITA POL-FRA POL-SRB USA-ITA BRA-USA Attack-defence balance 1,73 1,93 2,03 2,21 2,1
SRB-FRA SRB-ITA FRA-BRA SRB-BRA FRA-ITA Attack-defence balance 2,23 1,76 1,83 1,67 2,16

Picture of the Game - 2016
24
34%
66%
Rally won on ownservice
Rally won onopponent service
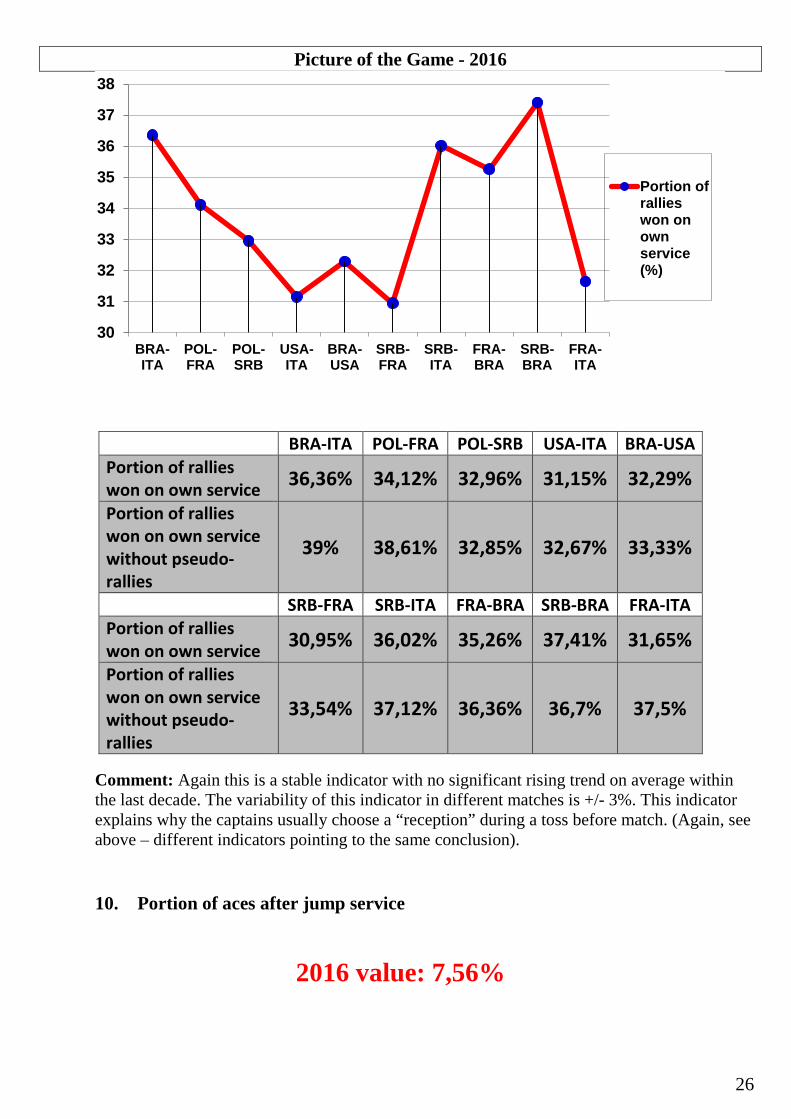
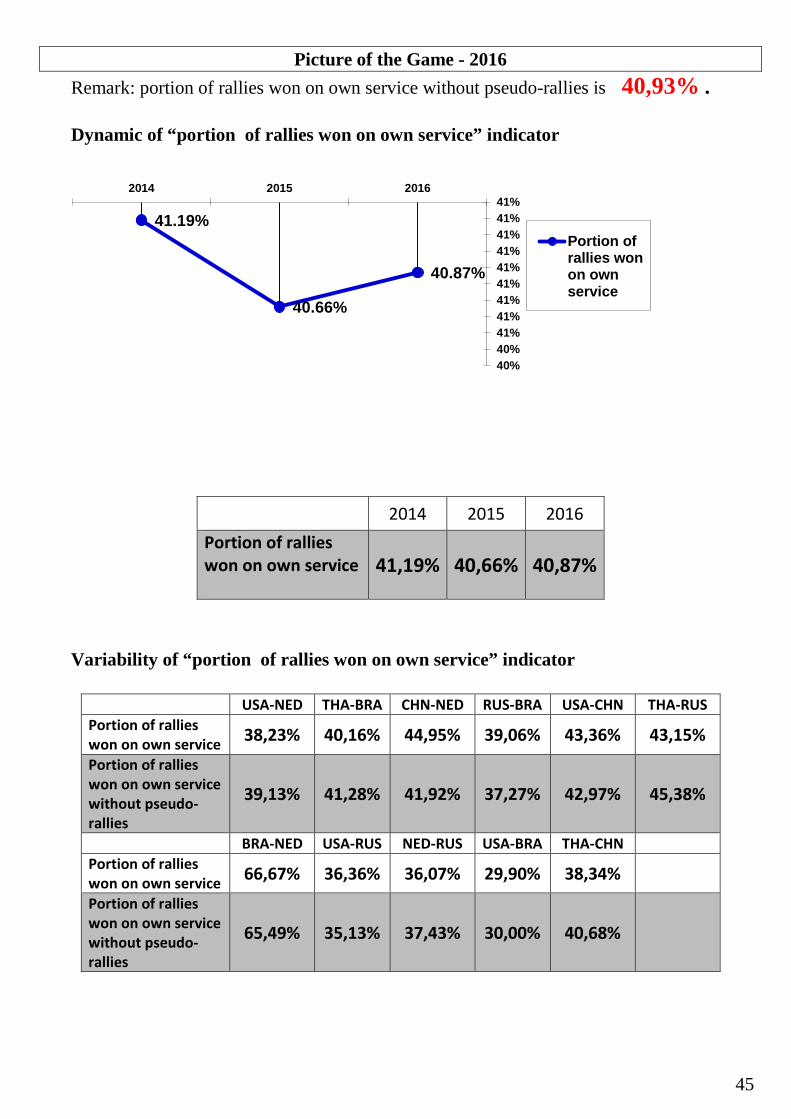
9. Portion of rallies won on own service
33,67%
Remark: portion of rallies won on own service without pseudo-rallies is 35,58%
Dynamic of “portion of rallies won on own service” indicator

Picture of the Game - 2016
25
2007 2008 2009 2010 2011
Portion of rallies won on own service 30% 33% 31% 29% 33%
2012 2013 2014 2015 2016 Portion of rallies won on own service 33% 36% 31,65% 33,53% 33,67%
Variability of “portion of rallies won on own service” indicator
25262728293031323334353637
2007 2008 2009 2010 2011 2012 2013 2014 2015 2016
Portion ofrallieswon onownservice(%)
Picture of the Game - 2016
26
Comment: Again this is a stable indicator with no significant rising trend on average within the last decade. The variability of this indicator in different matches is +/- 3%. This indicator explains why the captains usually choose a “reception” during a toss before match. (Again, see above – different indicators pointing to the same conclusion). 10. Portion of aces after jump service
2016 value: 7,56%
30
31
32
33
34
35
36
37
38
BRA-ITA
POL-FRA
POL-SRB
USA-ITA
BRA-USA
SRB-FRA
SRB-ITA
FRA-BRA
SRB-BRA
FRA-ITA
Portion ofrallieswon onownservice(%)
BRA-ITA POL-FRA POL-SRB USA-ITA BRA-USA Portion of rallies won on own service 36,36% 34,12% 32,96% 31,15% 32,29%
Portion of rallies won on own service without pseudo-rallies
39% 38,61% 32,85% 32,67% 33,33%
SRB-FRA SRB-ITA FRA-BRA SRB-BRA FRA-ITA Portion of rallies won on own service 30,95% 36,02% 35,26% 37,41% 31,65%
Portion of rallies won on own service without pseudo-rallies
33,54% 37,12% 36,36% 36,7% 37,5%

Picture of the Game - 2016
27
Dynamic of “portion of aces after jump service” indicator
2013 2014 2015 2016
Portion of aces after jump service 5,7% 5,3% 6,25% 7,56%
Variability of “portion of aces after jump service” indicator
0123456789
10
2013 2014 2015 2016
Portion ofaces afterJumpservice(%)

Picture of the Game - 2016
28
Comment: The calculation of this indicator still has a short history. Over the last 4 years this indicator has stayed relatively stable, at around 5-7 %. The variability of this indicator in different matches is large, however (3,5% - 11,1%).
0123456789
101112131415
BRA-ITA
POL-FRA
POL-SRB
USA-ITA
BRA-USA
SRB-FRA
SRB-ITA
FRA-BRA
SRB-BRA
FRA-ITA
Portionof acesafterjumpservice(%)
BRA-ITA POL-FRA POL-SRB USA-ITA BRA-USA Portion of aces after jump service
8,91% 7,25% 11,11% 7,94% 8,64%
SRB-FRA SRB-ITA FRA-BRA SRB-BRA FRA-ITA Portion of aces after jump service
3,82% 6,25% 8,02% 10,91% 3,53%

Picture of the Game - 2016
29
Part 2.
Women’s volleyball of top level. Main indicators.
Picture of the Game - 2016
30
Part 2.
Women’s volleyball of top level. Main indicators.
On the basis of the FIVB World Grand Prix final matches in Bangkok (Thailand) 06-10.07.2016 the following statistical data reflecting the main volleyball indicators for women’s volleyball has been obtained for comparison with previous editions:
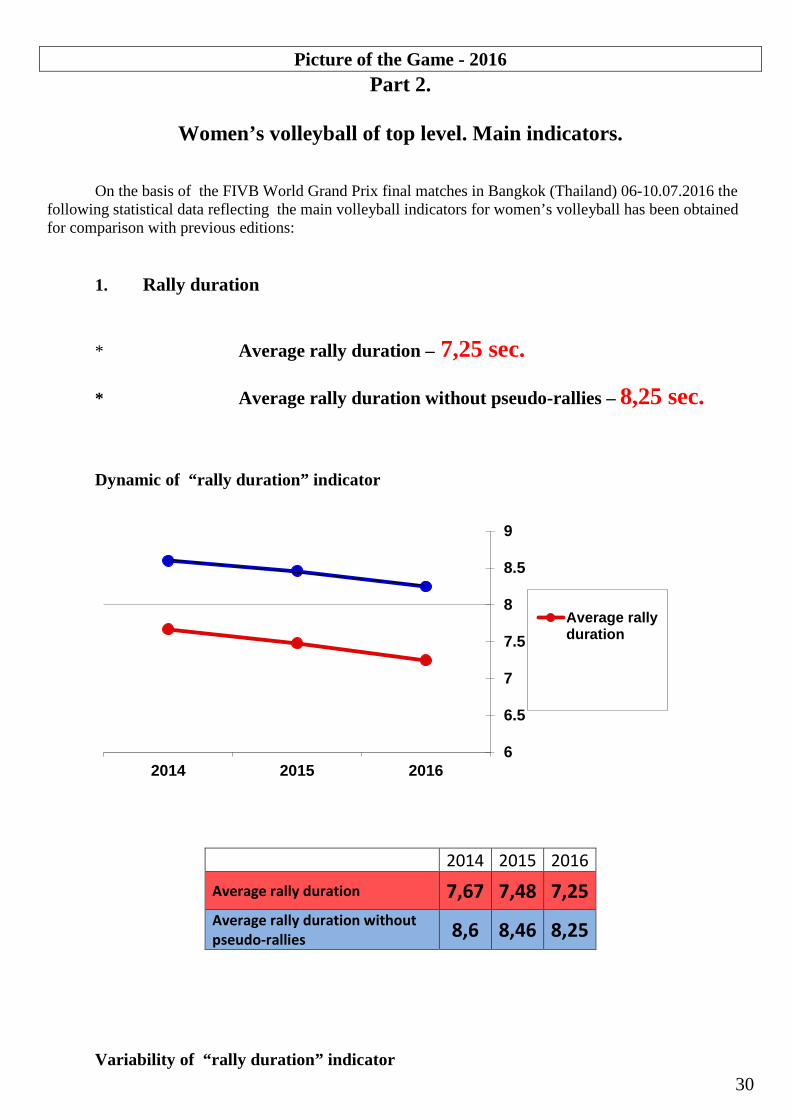
1. Rally duration
* Average rally duration – 7,25 sec. * Average rally duration without pseudo-rallies – 8,25 sec.
Dynamic of “rally duration” indicator
2014 2015 2016
Average rally duration 7,67 7,48 7,25 Average rally duration without pseudo-rallies 8,6 8,46 8,25
Variability of “rally duration” indicator
6
6.5
7
7.5
8
8.5
9
2014 2015 2016
Average rallyduration

Picture of the Game - 2016
31
21%
79%
Rallies time
All sets duration
Comment: Rally duration is one of the key Game indicators. This has been very stable in the women’s game during the last 3 years (difference within 0,5 sec.) The variability between different matches is also very not significant (+/- 0,6 sec.) 2. “Flying ball”
20,8% from total duration of all sets
OR
19,06% from total match time
Dynamic of “flying ball” indicator
4
5
6
7
8
9
10
USA-NED
THA-BRA
CHN-NED
RUS-BRA
USA-CHN
THA-RUS
BRA-NED
USA-RUS
NED-RUS
USA-BRA
THA-CHN
Average rallyduration
Average rallydurationwithoutpseudo-rallies
USA-NED THA-BRA CHN-NED RUS-BRA USA-CHN THA-RUS Average rally duration 7,32 7,56 7,58 6,64 7,52 7,77 Average rally duration without pseudo-rallies
8,42 8,65 8,99 7,57 8,28 8,6
BRA-NED USA-RUS NED-RUS USA-BRA THA-CHN Average rally duration 6,89 7,17 7,35 6,54 7,44

Picture of the Game - 2016
32
2014 2015 2016 From total duration of all sets 20,89% 20,44% 20,8%
From total match time 18,95% 18,44% 19,06%
Variability of “flying ball” indicator
20.20%
20.30%
20.40%
20.50%
20.60%
20.70%
20.80%
20.90%
21.00%2014 2015 2016
Portion of ralliestime in setsduration time
17%
18%
19%
20%
21%
22%
23%
USA-NED
THA-BRA
CHN-NED
RUS-BRA
USA-CHN
THA-RUS
BRA-NED
USA-RUS
NED-RUS
USA-BRA
THA-CHN
Portion ofralliestime insetsdurationtime

Picture of the Game - 2016
33
14%
86%
Pseudo-ralliesRallies
USA-NED THA-BRA CHN-NED RUS-BRA USA-CHN THA-RUS Portion of rallies time in sets duration time
20,30% 20,29% 20,71% 19,35% 21,79% 21,77%
BRA-NED USA-RUS NED-RUS USA-BRA THA-CHN Portion of rallies time in sets duration time
20,82% 21,30% 20,19% 19,83% 22,55%
Comment: This is a crucial indicator for volleyball, taking into consideration the FIVB motto: “Keep the ball flying”. This indicator varies up and down only to an insignificant level(+/- 0,3 %). The variability of this indicator is different in observed matches over the range +/- 1,6 %. 3. Portion of “pseudo-rallies” (ace or service fault, about 1 sec.) – 13,66 %

Picture of the Game - 2016
34
Dynamic of “pseudo-rallies” indicator
2014 2015 2016
Portion of “pseudo-rallies” 12,79% 12,01% 13,66%
Variability of “pseudo-rallies” indicator
11.00%
11.50%
12.00%
12.50%
13.00%
13.50%
14.00%2014 2015 2016
Portion ofpseudo-rallies
8%
9%
10%
11%
12%
13%
14%
15%
16%
17%
18%
USA-NED
THA-BRA
CHN-NED
RUS-BRA
USA-CHN
THA-RUS
BRA-NED
USA-RUS
NED-RUS
USA-BRA
THA-CHN
Portion ofpseudo-rallies
Picture of the Game - 2016
35
48% 52%
Two and moreattack rallyOne attack rally
USA-NED THA-BRA CHN-NED RUS-BRA USA-CHN THA-RUS Portion of pseudo-rallies
15,44% 14,17% 15,66% 14,06% 10,49% 10,96%
BRA-NED USA-RUS NED-RUS USA-BRA THA-CHN Portion of pseudo-rallies
14,39% 15,91% 10,96% 16,67% 11,28%
Comment: The dynamic of this indicator during the last 3 years is within 1,67 % (down and up). The variability of this indicator in different observed matches is +/- 3,09 % (This is a large variation but clearly depends on the identity of the teams playing).
4. One attack rally out of all rallies (without pseudo-rallies).
2016 value: 52,03% Dynamic of “one attack rally” indicator
38.00%
40.00%
42.00%
44.00%
46.00%
48.00%
50.00%
52.00%
54.00%2014 2015 2016
Portion of oneattack rallies

Picture of the Game - 2016
36
Variability of “one attack rally” indicator
USA-NED THA-BRA CHN-NED RUS-BRA USA-CHN THA-RUS Portion of one attack rallies
44,85% 46,45% 48,50% 57,03% 51,75% 51,37%
BRA-NED USA-RUS NED-RUS USA-BRA THA-CHN Portion of one attack rallies
64,60% 50,76% 58,97% 48,04% 49,62%
Comment: This indicator had a positive dynamic within the last 3 years (+ 9 %). There was an obvious trend of increasing the portion of one-attack rallies contrary to the men’s volleyball. The variability of this indicator in different observed matches is +/- 10 % (significant). This may be because the women are also increasing in height significantly and the reception issues mentioned above for the men appears to be happening also in the women’s game: reception is too easy, making the first attack decisive and thus reducing the chance of a longer rally.
40%
45%
50%
55%
60%
65%
70%
USA-NED
THA-BRA
CHN-NED
RUS-BRA
USA-CHN
THA-RUS
BRA-NED
USA-RUS
NED-RUS
USA-BRA
THA-CHN
Portionof oneattack…
2014 2015 2016
One attack rally 43,59% 48,93% 52,03%

Picture of the Game - 2016
37
34%
66%
Two and moreattack rallyOne and lessattack rally
5. One and less attack rally – 65,69% of all rallies (with pseudo-rallies).
Dynamic of “one and less attack rally” indicator
2014 2015 2016
One and less attack rally 55,49% 60,94% 65,69%
50.00%52.00%54.00%56.00%58.00%60.00%62.00%64.00%66.00%68.00%
2014 2015 2016
Portion ofone and lessattack rallies

Picture of the Game - 2016
38
Variability of “one and less attack rally” indicator
Comment: This indicator had a positive dynamic within the last 3 years (+ 10 %). There was an obvious trend of increasing the portion of “one and fewer attack rallies”. The variability of this indicator in different observed matches is +/- 9,5 % (significant). (See previous comment).
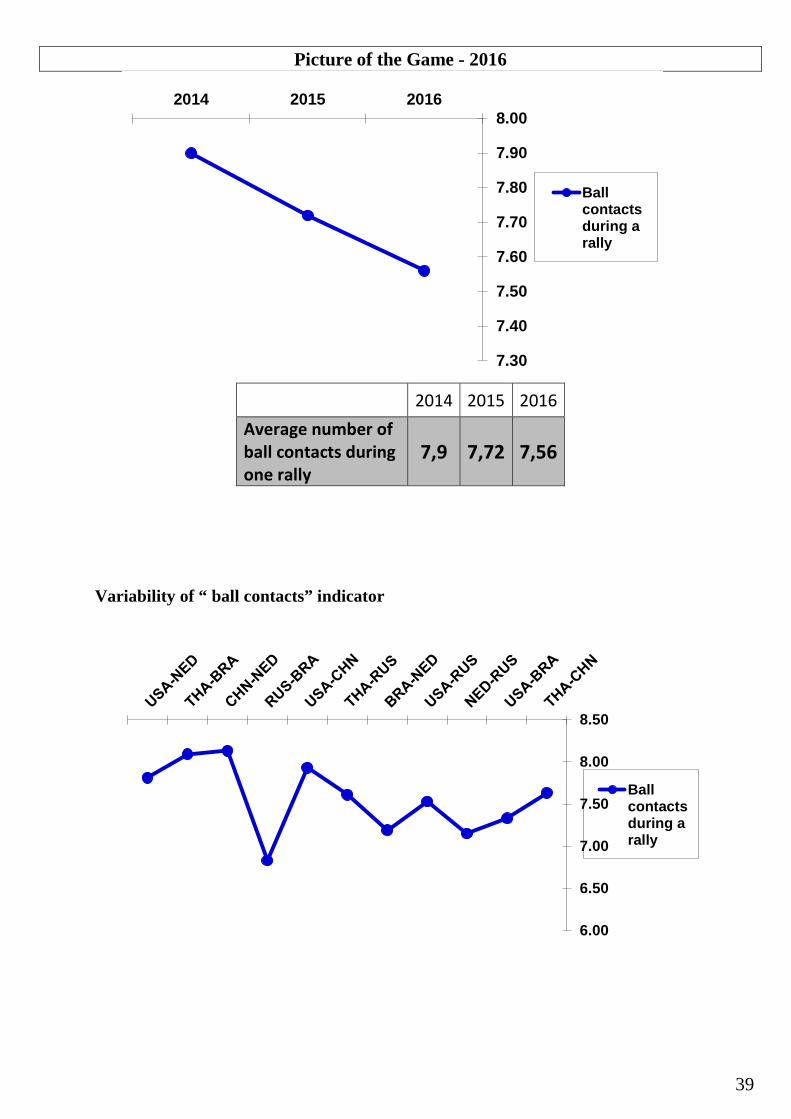
6. Average number of ball contacts during one rally – 7,56 (without pseudo-rallies)
Dynamic of “contacts” indicator
40%45%50%55%60%65%70%75%80%85%
USA-NED
THA-BRA
CHN-NED
RUS-BRA
USA-CHN
THA-RUS
BRA-NED
USA-RUS
NED-RUS
USA-BRA
THA-CHN
Portion ofone andless attackrallies
USA-NED THA-BRA CHN-NED RUS-BRA USA-CHN THA-RUS Portion of one and less attack rallies 60,29% 60,63% 64,16% 71,09% 62,24% 62,33%
BRA-NED USA-RUS NED-RUS USA-BRA THA-CHN Portion of one and less attack rallies 78,99% 66,67% 69,93% 64,70% 60,90%
Picture of the Game - 2016
39
2014 2015 2016 Average number of ball contacts during one rally
7,9 7,72 7,56
Variability of “ ball contacts” indicator
7.30
7.40
7.50
7.60
7.70
7.80
7.90
8.002014 2015 2016
Ballcontactsduring arally
6.00
6.50
7.00
7.50
8.00
8.50
Ballcontactsduring arally

Picture of the Game - 2016
40
Comment: This indicator had a slight negative dynamic within the last 3 years (- 0,34). The variability of this indicator in different observed matches is +/- 0,63.
7. Structure of rallies
* Pseudo-rallies 13,66%
* One attack rally 52,03%
* More than one attack rally 34,31%
Total: 100 %
13.66
52.03
34.31
pseudo rallies
One attack rally
More than oneattack rally
USA-NED THA-BRA CHN-NED RUS-BRA USA-CHN THA-RUS Ball contacts during a rally 7,81 8,09 8,13 6,83 7,93 7,61
BRA-NED USA-RUS NED-RUS USA-BRA THA-CHN Ball contacts during a rally 7,19 7,53 7,15 7,33 7,63
Picture of the Game - 2016
41
Dynamic of “structure of rallies” indicator
Variability of “structure of rallies” indicator
0.00%
10.00%
20.00%
30.00%
40.00%
50.00%
60.00%
2014 2015 2016
Pseudo-rallies
One attackrallies
More than oneattack rallies

Picture of the Game - 2016
42
USA-NED THA-BRA CHN-NED RUS-BRA USA-CHN THA-RUS
Pseudo-rallies 15,44% 14,17% 15,66% 14,06% 10,49% 10,96% One attack rallies 44,85% 46,45% 48,50% 57,03% 51,75% 51,37% More than one attack rallies 39,70% 39,37% 35,84% 28,91% 37,76% 37,67%
BRA-NED USA-RUS NED-RUS USA-BRA THA-CHN Pseudo-rallies 14,39% 15,91% 10,96% 16,67% 11,28% One attack rallies 64,60% 50,76% 58,97% 48,04% 49,62% More than one attack rallies 21,01% 33,33% 30,07% 35,29% 39,10%
Comment: Contrary to the men’s volleyball where the percentage of pseudo-rallies is very close to the percentage of long rallies (where there is more than one attack), in women’s volleyball the proportion of long rallies is 2,5 times bigger than the proportion of pseudo-rallies. This is a good indicator of the health of the game.
0.00%10.00%20.00%30.00%40.00%50.00%60.00%70.00%
USA-NED
THA-BRA
CHN-NED
RUS-BRA
USA-CHN
THA-RUS
BRA-NED
USA-RUS
NED-RUS
USA-BRA
THA-CHN
Pseudo-rallies
One attackrallies
More thanone attackrallies

Picture of the Game - 2016
43
8. Attack-defence balance*
2016 value: 1,64
* number of rallies won on the opponent service divided on number of rallies won on own service
Remark: attack-defence balance without pseudo-rallies is 1,61 Dynamic of “attack-defense balance” indicator
2014 2015 2016
Attack-defence balance 1,5 1,47 1,64
1.5 1.47 1.64
0
0.5
1
1.5
2
2014 2015 2016

Picture of the Game - 2016
44
41%
59%
Rally won on ownservice
Rally won onopponent service
Variability of “attack-defense balance” indicator
Comment: In the last 3 year period, this has shown to be a relatively stable indicator with only a small trend towards imbalance (from 1,5 to 1,64). The variability of this indicator in different matches is quite large, however, at +/- 0,62 (more than twice the variability in men’s volleyball).
9. Portion of rallies won on own service
40,87%
0
1
2
3
USA-NED
THA-BRA
CHN-NED
RUS-BRA
USA-CHN
THA-RUS
BRA-NED
USA-RUS
NED-RUS
USA-BRA
THA-CHN
Attack-defencebalance
USA-NED THA-BRA CHN-NED RUS-BRA USA-CHN THA-RUS Attack-defence balance 1,61 1,49 1,11 1,56 1,31 1,32
BRA-NED USA-RUS NED-RUS USA-BRA THA-CHN Attack-defence balance 2 1,75 1,77 2,34 1,61
Picture of the Game - 2016
45
Remark: portion of rallies won on own service without pseudo-rallies is 40,93% . Dynamic of “portion of rallies won on own service” indicator
2014 2015 2016 Portion of rallies won on own service
41,19% 40,66% 40,87%
Variability of “portion of rallies won on own service” indicator
41.19%
40.66%
40.87%
40%40%41%41%41%41%41%41%41%41%41%
2014 2015 2016
Portion ofrallies wonon ownservice
USA-NED THA-BRA CHN-NED RUS-BRA USA-CHN THA-RUS Portion of rallies won on own service 38,23% 40,16% 44,95% 39,06% 43,36% 43,15% Portion of rallies won on own service without pseudo-rallies
39,13% 41,28% 41,92% 37,27% 42,97% 45,38%
BRA-NED USA-RUS NED-RUS USA-BRA THA-CHN Portion of rallies won on own service 66,67% 36,36% 36,07% 29,90% 38,34% Portion of rallies won on own service without pseudo-rallies
65,49% 35,13% 37,43% 30,00% 40,68%

Picture of the Game - 2016
46
Comment: This has been a stable indicator within the last 3 years (+/- 0,27 %). The variability of this indicator in different matches is +/- 18,4 % (very big comparing with men’s volleyball). This is a value over the period of the study which is much better than in the men’s game.
10. Portion of aces after jump service 1,63 %
Dynamic of “portion of aces after jump service” indicator
2014 2015 2016
Portion of aces after jump service 2,57% 2,07% 1,63%
Variability of “portion of aces after jump service” indicator
Comment: The calculation of this indicator, like in men’s volleyball, still has a short history. Over the last 3 years, this indicator has shown itself to be stable (varying only +/- 0,47 %). The variability of this indicator in different matches is, however, considerable (varying from 0,0 % to a massive 12,5 %) and may reflect differing training regimes for the teams involved, and different physical condition for the individual players.
2.57%
2.07%
1.63%
0%
1%
1%
2%
2%
3%
3%2014 2015 2016
Portion ofaces afterjump service
USA-NED THA-BRA CHN-NED RUS-BRA USA-CHN THA-RUS Portion of aces after jump service 0,00% 0,00% 5,55% 0,00% 0,00% 0,00% BRA-NED USA-RUS NED-RUS USA-BRA THA-CHN Portion of aces after jump service 0,00% 0,00% 0,00% 0,00% 12,50%
Picture of the Game - 2016
47
Part 3
Men’s and Women’s top volleyball comparison

Picture of the Game - 2016
48
Part 3
Men’s and Women’s top volleyball comparison Table 1
N
Indicator
Men
Women
1 Average rally duration (sec.) 5,5 7,3 2 Average rally duration without pseudo-rallies (sec.) 6,9 8,3 3 “Flying ball” from total duration of all sets (%) 15,4 20,8 4 “Flying ball” from total match time (%) 13,1 19,1 5 Portion of “pseudo-rallies” (ace or service fault, about
1 sec.) (%) 23,0 13,7
6
Structure of rallies
Pseudo-rallies (%) 23 14 One attack rallies (%) 53 52 More than one attack rallies (%) 24 34
7 Average number of ball contacts during one rally (without pseudo-rallies)
6,5
7,6
8 Attack-defence balance 2 1,64 9 Attack-defence balance without pseudo-rallies 1,8 1,61 10 Portion of rallies won on own service (%) 33,7 40,9 11 Portion of rallies won on own service without pseudo-
rallies (%) 35,6 40,9
12 Portion of aces after jump service (%) 7,6 1,6
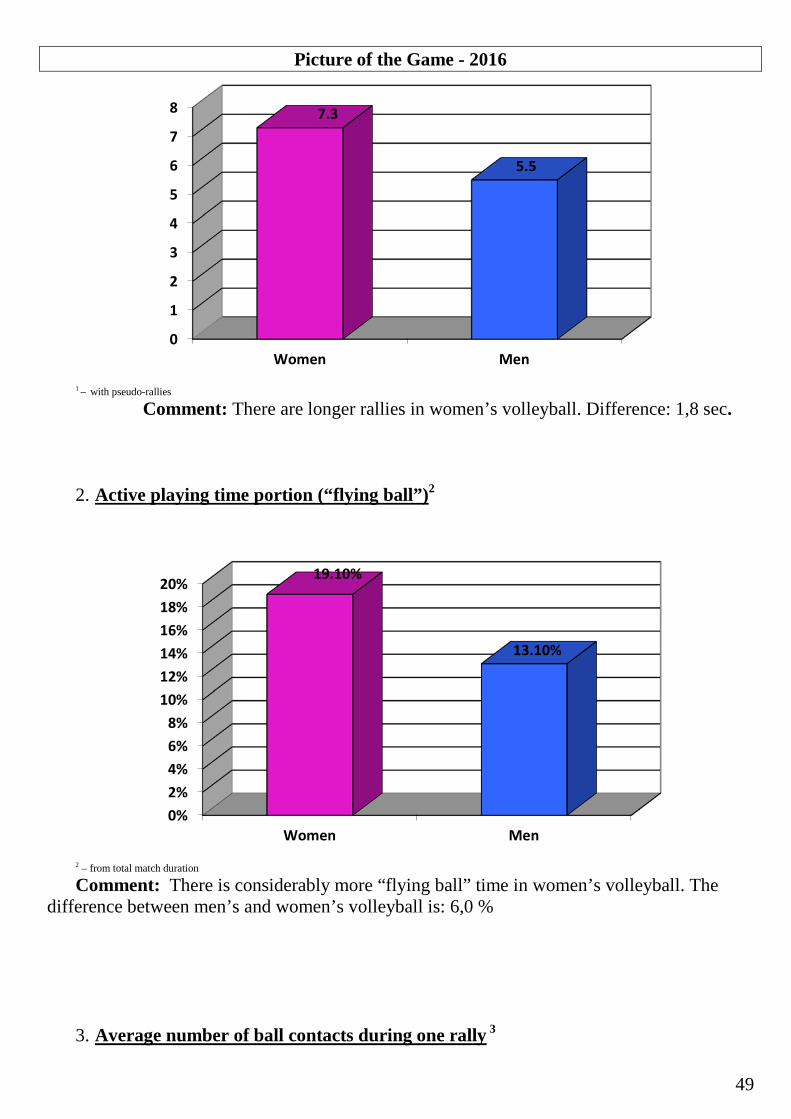
1. Average rally duration (sec.)1
Picture of the Game - 2016
49
1 – with pseudo-rallies
Comment: There are longer rallies in women’s volleyball. Difference: 1,8 sec.
2. Active playing time portion (“flying ball”)2
2 – from total match duration
Comment: There is considerably more “flying ball” time in women’s volleyball. The difference between men’s and women’s volleyball is: 6,0 %
3. Average number of ball contacts during one rally 3
0
1
2
3
4
5
6
7
8
Women Men
7.3
5.5
0%2%4%6%8%
10%12%14%16%18%20%
Women Men
19.10%
13.10%

Picture of the Game - 2016
50
3 – without pseudo-rallies. Comment: There are more ball contacts in women’s volleyball. Difference: 1,1
4. Pseudo-rallies portion4
4 – from total number of all rallies Comment: There is a smaller proportion of pseudo-rallies in women’s volleyball. The
difference: 9,3 %
5.8
6
6.2
6.4
6.6
6.8
7
7.2
7.4
7.6
Women Men
7.6
6.5
0%
5%
10%
15%
20%
25%
Women Men
13.70%
23.00%

Picture of the Game - 2016
51
5. One attack rallies
Comment: Despite appearances (graph above) there is or less the same proportion of one
attack rallies in both men’s and women’s volleyball. The difference: just 1,0 %
6. Two and more-attack rallies
Comment: More long rallies in women’s volleyball. i.e. there is more 2nd phase play and
more net crossings, because the first attack for women is not so decisive. Difference: 10,0 %.
51%
52%
52%
52%
52%
52%
53%
53%
53%
Women Men
52.0%
53.00%
0%
5%
10%
15%
20%
25%
30%
35%
Women Men
34.00%
24.00%

Picture of the Game - 2016
52
23%
53%
24%
pseudo-rallies
One attack rally
More than oneattack rally
7. General structure of all rallies
Women Men
Comment: The difference in rally structure can be explained by considering only the pseudo rallies and the long rallies, whereas the portion of one attack rallies remains practically the same.
8. Portion of rallies won on own service
Comment: In women’s volleyball there are more chances for a team to win a rally after its
own service. Difference: 7,2 %.
14
52
34
pseudorallies
One attackrally
More thanone attackrally
0%
5%
10%
15%
20%
25%
30%
35%
40%
45%
Women Men
40.90%
33.70%

Picture of the Game - 2016
53
9. Attack-defence balance5 1,64 2,0
Women Men
5 – number of rallies won on the opponent service divided on number of rallies won on own service
Comment: Women’s volleyball is much more balanced regarding power of attack and ability to play in defence. Difference: 0,36. This may not sound a lot but it is in fact a considerable difference in favour of the women.

Picture of the Game - 2016
54
Part 4
2012 - 2016 Olympic Games data in comparison

Picture of the Game - 2016
55
Average rally duration (sec.)1
1 –with pseudo-rallies
Average rally duration without pseudo-rallies (sec.)
“Flying ball” from total duration of all sets (%)
0123456
MEN - 2012London OG
MEN - 2016 RioOG
5.5 5.5
6.26.46.66.8
77.27.4
WOMEN - 2012London OG
WOMEN - 2016Rio OG
7.3
6.6
6.75
6.8
6.85
6.9
MEN - 2012London OG
MEN - 2016 RioOG
6.9
6.8
7.7
7.8
7.9
8
WOMEN - 2012London OG
WOMEN - 2016Rio OG
8
7.8
0
5
10
15
20
MEN - 2012London OG
MEN - 2016 RioOG
19.9 16.2
19
20
21
22
23
WOMEN - 2012London OG
WOMEN - 2016Rio OG
23
20.4

Picture of the Game - 2016
56
22%
53%
25%
pseudo-rallies
One attack rally
More than oneattack rally
“Flying ball” from total match time (%)
Portion of “pseudo-rallies” (ace or service fault, about 1 sec.) (%)
Structure of rallies – men (%)
Men – 2012 London OG Men – 2016 Rio OG
131415161718
MEN - 2012London OG
MEN - 2016 RioOG
17.4
14.8
16171819202122
WOMEN - 2012London OG
WOMEN - 2016Rio OG
21.8
18.5
202122232425
MEN - 2012London OG
MEN - 2016 RioOG
24.4
22.1
0
5
10
15
20
WOMEN - 2012London OG
WOMEN - 2016Rio OG
10.2
17.5
24.4
50.2
25.4
pseudorallies
One attackrally
More thanone attackrally

Picture of the Game - 2016
57
17%
49%
34% pseudo-rallies
One attack rally
More than oneattack rally
Structure of rallies – women (%)
Women – 2012 London OG Women – 2016 Rio OG
Average number of ball contacts during one rally (without pseudo-rallies)
10
55
35
pseudorallies
One attackrally
More thanone attackrally
6.45
6.5
6.55
6.6
MEN - 2012London OG
MEN - 2016 RioOG
6.6
6.5
77.17.27.37.47.5
WOMEN - 2012London OG
WOMEN - 2016Rio OG
7.5
7.2
Picture of the Game - 2016
58
Attack-defence balance
Attack-defence balance without pseudo-rallies
Portion of rallies won on own service (%)
00.5
11.5
22.5
MEN - 2012London OG
MEN - 2016 RioOG
1.9 2.3
1.65
1.7
1.75
1.8
WOMEN - 2012London OG
WOMEN - 2016Rio OG
1.7
1.8
00.5
11.5
22.5
MEN - 2012London OG
MEN - 2016 RioOG
1.6 2.1
1.55
1.6
1.65
1.7
WOMEN - 2012London OG
WOMEN - 2016Rio OG
1.6
1.7
28.5
29
29.5
30
MEN - 2012London OG
MEN - 2016 RioOG
29
30
36.4
36.6
36.8
37
37.2
WOMEN - 2012London OG
WOMEN - 2016Rio OG
37.1
36.7
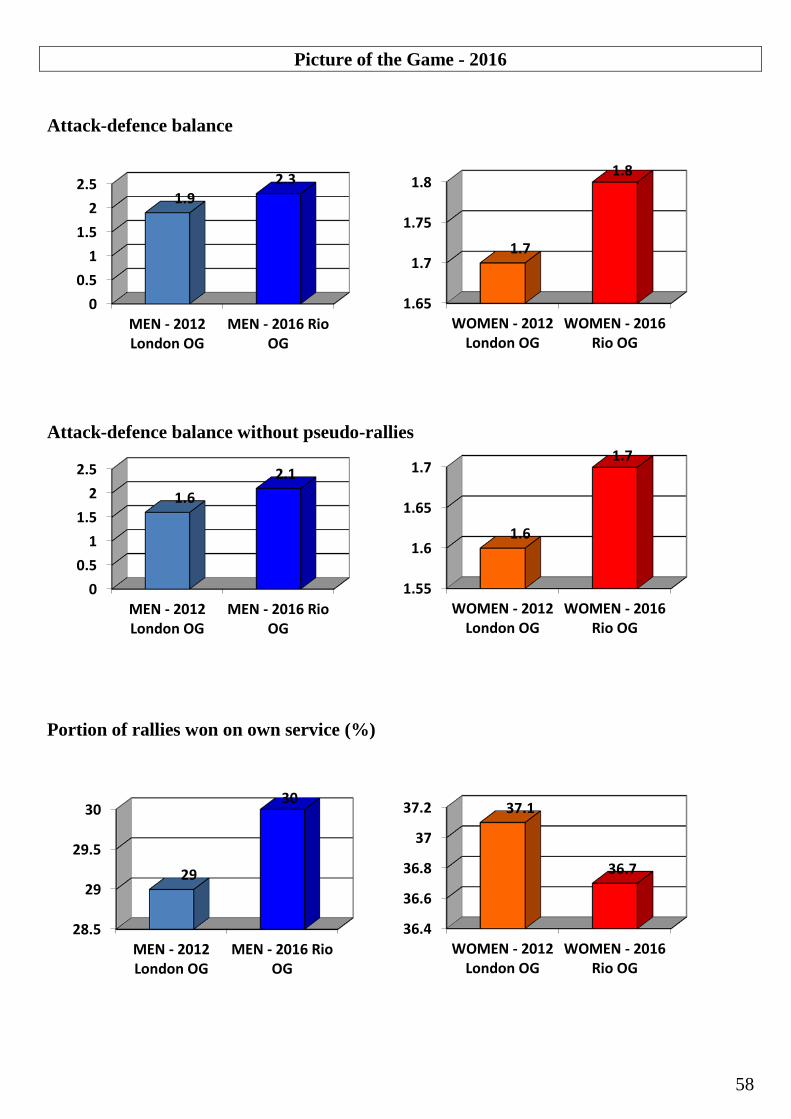
Picture of the Game - 2016
59
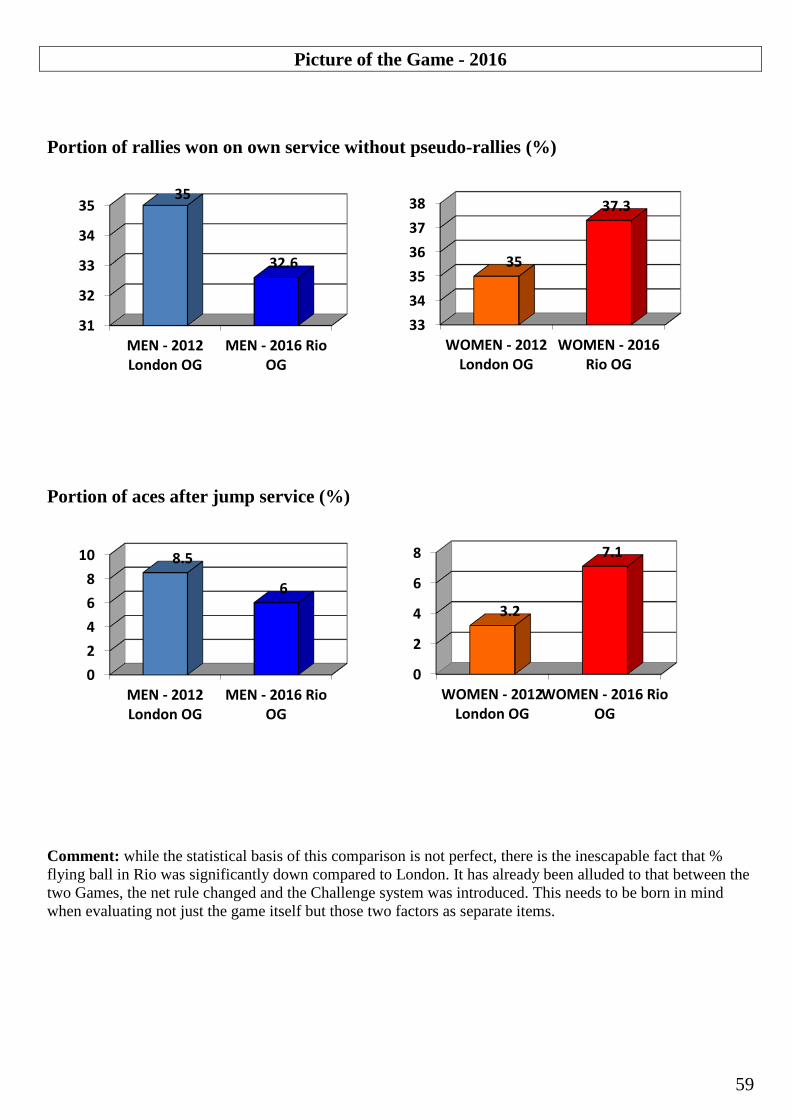
Portion of rallies won on own service without pseudo-rallies (%)
Portion of aces after jump service (%)
Comment: while the statistical basis of this comparison is not perfect, there is the inescapable fact that % flying ball in Rio was significantly down compared to London. It has already been alluded to that between the two Games, the net rule changed and the Challenge system was introduced. This needs to be born in mind when evaluating not just the game itself but those two factors as separate items.
31
32
33
34
35
MEN - 2012London OG
MEN - 2016 RioOG
35
32.6
333435363738
WOMEN - 2012London OG
WOMEN - 2016Rio OG
35
37.3
02468
10
MEN - 2012London OG
MEN - 2016 RioOG
8.5
6
0
2
4
6
8
WOMEN - 2012London OG
WOMEN - 2016 RioOG
3.2
7.1

Picture of the Game - 2016
60
Part 5
New indicator – net crossings
(2008, 2012, 2016 Olympic Games comparison)
Picture of the Game - 2016
61
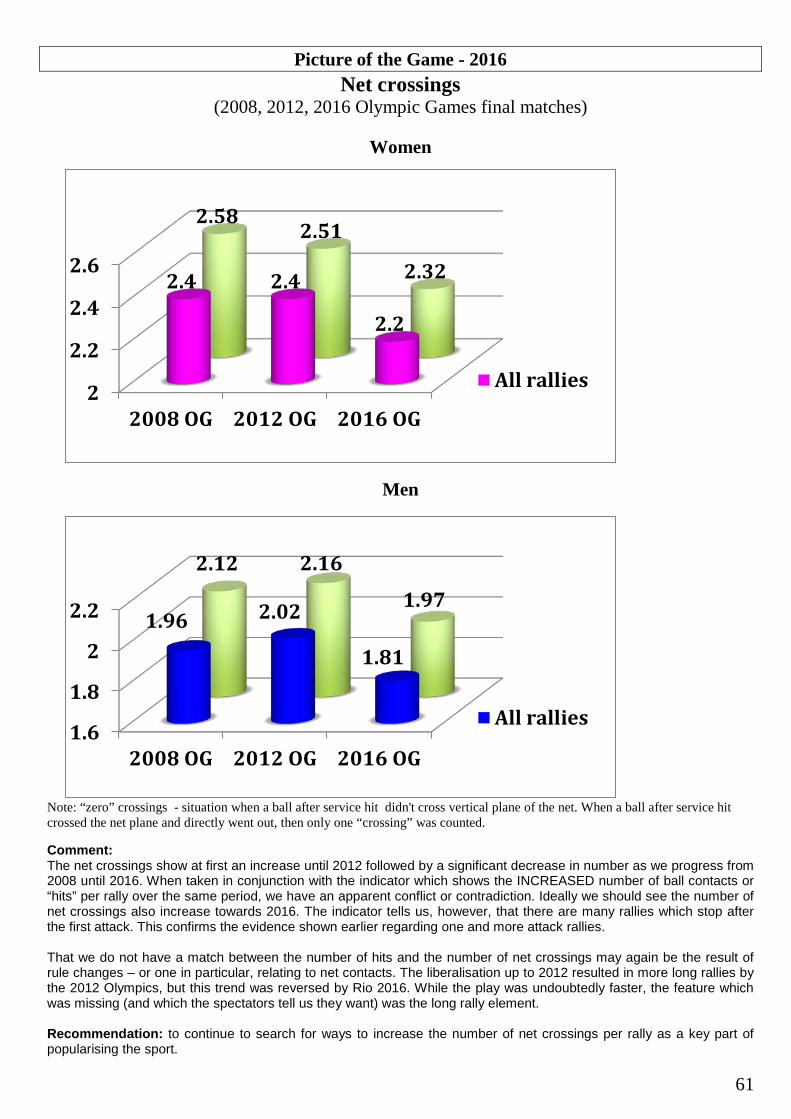
Net crossings (2008, 2012, 2016 Olympic Games final matches)
Women
Men
Note: “zero” crossings - situation when a ball after service hit didn't cross vertical plane of the net. When a ball after service hit crossed the net plane and directly went out, then only one “crossing” was counted.
Comment: The net crossings show at first an increase until 2012 followed by a significant decrease in number as we progress from 2008 until 2016. When taken in conjunction with the indicator which shows the INCREASED number of ball contacts or “hits” per rally over the same period, we have an apparent conflict or contradiction. Ideally we should see the number of net crossings also increase towards 2016. The indicator tells us, however, that there are many rallies which stop after the first attack. This confirms the evidence shown earlier regarding one and more attack rallies. That we do not have a match between the number of hits and the number of net crossings may again be the result of rule changes – or one in particular, relating to net contacts. The liberalisation up to 2012 resulted in more long rallies by the 2012 Olympics, but this trend was reversed by Rio 2016. While the play was undoubtedly faster, the feature which was missing (and which the spectators tell us they want) was the long rally element. Recommendation: to continue to search for ways to increase the number of net crossings per rally as a key part of popularising the sport.
2
2.2
2.4
2.6
2008 OG 2012 OG 2016 OG
2.4 2.4
2.2
2.58 2.51
2.32
All rallies
1.6
1.8
2
2.2
2008 OG 2012 OG 2016 OG
1.96 2.02
1.81
2.12 2.16
1.97
All rallies

Picture of the Game - 2016
62
Part 6
Match and set duration

Picture of the Game - 2016
63
Part 6
Match and set duration
Match duration
Indicator
Men
Women
2016 year data
2015 year data
OG-2016 data
2016 year data
2015 year data
OG-2016 data
Average duration (min.)
113,4 111,0 103,5 90,7 94,0 106,6
Minimum registered duration (min.)
80 76 75 74 56 68
Maximum registered duration (min.)
142 149 148 135 179 134
Average number of sets in the
match
3,6 4,1 3,6 3,6 3,4 4
Picture of the Game - 2016
64
54%
29%
17% 3 sets match
4 sets match
5 sets match30%
30%
40%
3 sets match
4 sets match
5 sets match
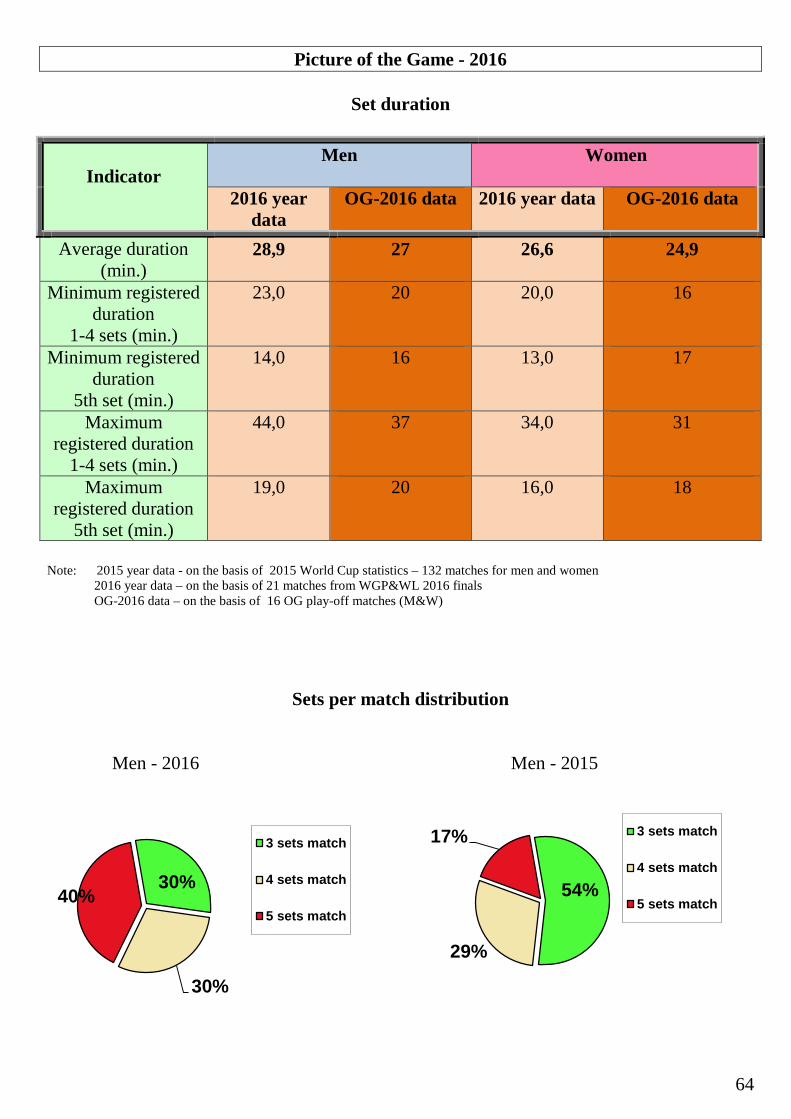
Set duration
Indicator
Men
Women
2016 year data
OG-2016 data 2016 year data OG-2016 data
Average duration (min.)
28,9 27 26,6 24,9
Minimum registered duration
1-4 sets (min.)
23,0 20 20,0 16
Minimum registered duration
5th set (min.)
14,0 16 13,0 17
Maximum registered duration
1-4 sets (min.)
44,0 37 34,0 31
Maximum registered duration
5th set (min.)
19,0 20 16,0 18
Note: 2015 year data - on the basis of 2015 World Cup statistics – 132 matches for men and women
2016 year data – on the basis of 21 matches from WGP&WL 2016 finals OG-2016 data – on the basis of 16 OG play-off matches (M&W)
Sets per match distribution Men - 2016 Men - 2015

Picture of the Game - 2016
65
70% 17%
13% 3 sets match
4 sets match
5 sets match73% 0%
27% 3 sets match
4 sets match
5 sets match
Women – 2016 Women – 2015
Conclusion Comment: It seems obvious more than ever that we have two almost different games – the men’s version and the women’s version. Even between last season and this we see that matches are either won 3-0 or 3-2. This may be a result of the competition formulae which permits more teams to take part. And the consequent mismatch of teams until the end of the Preliminary rounds. Both versions would benefit from some modification which makes service reception harder – the multiplier effect which this creates would increase rally length and reduce the one attack rallies: attack-defence balance would also change for the benefit of rallies.

Picture of the Game - 2016
66
Conclusions:
1. In relation to the above, data was obtained which covered the key areas of rally length, match duration, flying ball time and so on, which allowed a direct comparison with other editions.
2. Some aspects of the game remain relatively stable, while others vary significantly. The following can clearly be seen as significant • Number of ball contacts per rally is increasing due to increased athleticism and game speed; • Yet % flying ball time is reducing; • In men’s volleyball there is still a significant imbalance between attack and defense -the one attack
rallies predominate still – several different indicators show that the receiving team generally wins the rally, and this is something we need to change;
• In women’s volleyball the rallies are significantly longer, and the imbalance between attack and defense is much less. But we must take care not to let the women’s game follow the direction of the men.
3. Comparing the Rio and London Games, there was a noticeable shortening of rallies in Rio largely due to the imposition of a much stricter net rule, and % flying ball time is further reduced due to the additional factor of the implemented Challenge regulations. More than ever in our fight for market share of the TV audience, we still need a real “flying ball” game;
Picture of the Game - 2016
67
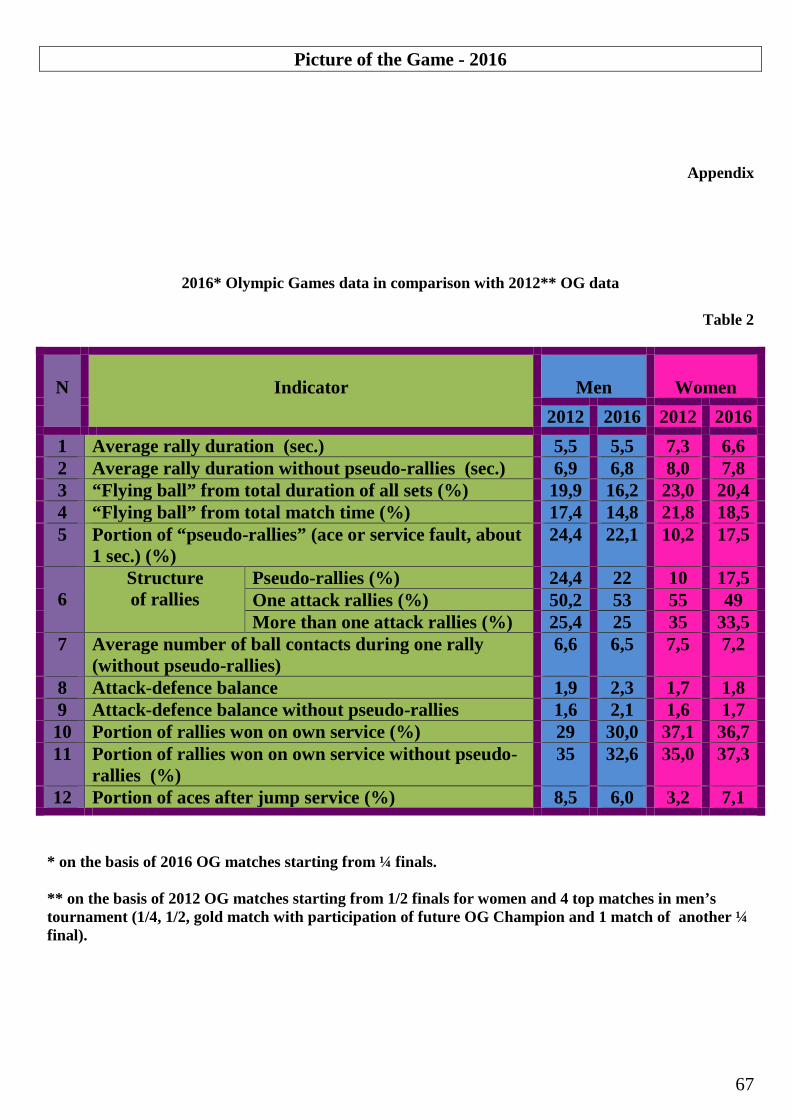
Appendix
2016* Olympic Games data in comparison with 2012** OG data
Table 2
N
Indicator
Men
Women
2012 2016 2012 2016 1 Average rally duration (sec.) 5,5 5,5 7,3 6,6 2 Average rally duration without pseudo-rallies (sec.) 6,9 6,8 8,0 7,8 3 “Flying ball” from total duration of all sets (%) 19,9 16,2 23,0 20,4 4 “Flying ball” from total match time (%) 17,4 14,8 21,8 18,5 5 Portion of “pseudo-rallies” (ace or service fault, about
1 sec.) (%) 24,4 22,1 10,2 17,5
6
Structure of rallies
Pseudo-rallies (%) 24,4 22 10 17,5 One attack rallies (%) 50,2 53 55 49 More than one attack rallies (%) 25,4 25 35 33,5
7 Average number of ball contacts during one rally (without pseudo-rallies)
6,6
6,5 7,5 7,2
8 Attack-defence balance 1,9 2,3 1,7 1,8 9 Attack-defence balance without pseudo-rallies 1,6 2,1 1,6 1,7 10 Portion of rallies won on own service (%) 29 30,0 37,1 36,7 11 Portion of rallies won on own service without pseudo-
rallies (%) 35 32,6 35,0 37,3
12 Portion of aces after jump service (%) 8,5 6,0 3,2 7,1 * on the basis of 2016 OG matches starting from ¼ finals. ** on the basis of 2012 OG matches starting from 1/2 finals for women and 4 top matches in men’s tournament (1/4, 1/2, gold match with participation of future OG Champion and 1 match of another ¼ final).


