ISSN 0003�701X, Applied Solar Energy, 2013, Vol. 49, No. 4, pp. 215–224. © Allerton Press, Inc., 2013.
215
1 INTRODUCTION
The Environmental problems have made seriousconcerns in the world. For solving the problems, therenewable energies have attracted much attention.Solar energy is one of the most important renewableenergy among all kinds of renewable energies. It can becategorized in three general groups: thermal systemsthat convert solar energy to the thermal energy, PVmodules which convert solar energy to electricity andsolar chimneys that convert solar energy to mechani�cal energy. The photovoltaic (PV) modules have beendeveloped to provide electricity in various types ofbuildings across the world and the recent develop�ments on photovoltaic/thermal PV/T concept offeredan opportunity to increase the overall efficiency bymaking use of waste heat generated in the PV module.The main parts of the research and development workson the PV/T technology have been done in the last35 years.
PV/T systems have been the subject of intensivenumerical and experimental investigations duringthese years. The PV/T collector devices enable betterspace utilization, energy consumption, cost savingand simultaneous conversion of solar radiation intothe thermal and electrical energy. They can be used inhouses, offices, hospitals, schools and other places forheating the sanitary water and electrical energy gener�ation.
1 The article is published in the original.
Kern and Russell [1] gave the concept of this sys�tem with results, by using water or air as the heatremoval fluid in 1978. The Hottel–Whiller analyti�cal model for the analysis of PV/T systems was mod�ified by Florschuetz [2]. Based on the extendedmodel, examples of both thermal and electrical per�formance of a combined collector as a function ofcollector design parameters were presented and dis�cussed. Raghuraman [3] presented the numericalmethods predicting the performances of liquid andair PV/T flat plate collectors. A PV/T system con�sisting of a PV panel placed on a thermal collector,with a gap between them to achieve an effective PVcooling, was proposed by Takashima et al. [4], alsothe energy transfer analysis between the differentcomponents of a liquid type PV/T system for obtain�ing the electrical and thermal efficiencies were ana�lyzed by Bergene and Lovvik [5]. Sopian et al. [6]presented a performance analysis of PV/T air heatersin 1996. Comparisons were made between the per�formances of the two types of combined photovoltaicthermal collectors (single�pass and double�passwater), and the results showed that the double�passphotovoltaic thermal collector had superior perfor�mance comparing to the single�pass PV/T collector.In the work of Sopian et al. [7], a double�pass pho�tovoltaic thermal solar collector, suitable for solardrying applications, was developed and tested. Anew integrated design for water heating in a PV/Twas proposed by Huang et al. [8], where a commer�cial polycrystalline PV module was used. They intro�
Modeling and Optimization of an Air�Cooled Photovoltaic Thermal (PV/T) System Using Genetic Algorithms1
A. B. Kasaeiana, M. M. Akhlaghia, S. Golzaria, and M. Dehghanib
aFaculty of New Science and Technologies, University of Tehran, Tehran, IranbResearch Institute of Petroleum Industry, Tehran, Iran
Received February 13, 2013
Abstract—The aim of this paper is to model and optimize an air PV/T system. There are some parametersthat affect on the efficiency of a PV/T solar system like thickness of the glass and Tedlar, temperature of theinlet flow, solar cell temperature and etc. All equations for PV cell and thermal collector have been derived.By genetic algorithms using, thermal efficiency and electrical efficiency of the system may be optimized. Allthe parameters that are used in genetic algorithms, are the parameters that could be changed, and the non�changeable parameters, like solar radiation cannot be used in the algorithm. By compare to other methods,we found that the GaAs are very efficient technique to estimate the design parameters of PV/T solar systems.
DOI: 10.3103/S0003701X1304004X
SOLAR POWER PLANTS AND THEIR APPLICATION
216
APPLIED SOLAR ENERGY Vol. 49 No. 4 2013
KASAEIAN et al.
duced the concept of energy�saving efficiency forthe evaluation of a PV/T system.
Raghuraman [9] presented the detailed numericalmodels for both liquid and air PV/T systems, then heand Cox [10] followed up the computer simulation onthe air�type PV/T system. Several experimental andtheoretical studies on PV/T air systems based on thedesign and operating parameters, such as channeldepth and mass flow rate, have been reported [11–13].On the channel depth analysis for a single�pass PV/Tair system, Bhargava [14] suggested that the ductdepth should be at least 10 cm for achieving realisticresults.
The yield of nine different combined PV/T collec�tor designs was considered by Zondag et al. [15]. He W.et al. presented the test results on aluminum�alloy flat�box type hybrid solar collector functioned as a ther�mosyphon system [16]. They found that the daily ther�mal efficiency could reach around 40% when the ini�tial water temperature in the system is the same as thedaily mean ambient temperature. An improved designof this hybrid PV/T collector and the sensitivity anal�ysis of some key design�elements were presented by Jiet al. [17]. An integrated combined system of a photo�voltaic thermal solar water heater has been designedand tested in outdoor conditions for a variety of cli�mate changes of New Delhi by Dubey and Tiwari [18].They also derived an analytical expression for thecharacteristic equation of this system for differentconditions as a function of design and climatic param�eters and the obtained model showed good agreementwith the experimental results. An analytical expressionfor electrical efficiency of PV/T hybrid air collectorwas presented by Dubey et al. [19]. The optimizationof number of collectors for integrated PV/T hybridactive solar was considered by Gaur and Tiwari [20].As well the indoor test procedure for thermal and elec�trical testing of PV/T collectors connected in seriesproposed by Solanki et al. [21]. This test procedurecan be used by manufacturers for testing of differenttypes of PV modules in order to optimize their prod�ucts. Also, Tiwari et al. [22] studied the energy pay�back time, the electricity production factor and the lifecycle conversion efficiency of hybrid photovoltaicmodules for the different climate changes in India.
The improvement of the system performance canbe achieved by an additional glazing using to increasethe thermal output, a booster diffuse reflector toincrease the electrical and thermal output, or both,giving the flexibility in the system design. The electri�cal and thermal efficiency and the annual energy out�put of water�cooled PV/T solar systems under theweather conditions of Patras in Greece for horizontaland tilted building roof installation were determinedby Tripanagnostopoulos et al. [23]. They found thatPV/T systems were cost effective and of better envi�
ronmental impact compared with the standard PVmodules. Experiments with dual type PV/T models ofalternative arrangement of the water and the air heatexchanging elements were performed by Tripanag�nostopoulos [24].The modified dual PV/T collectorswere combined with booster diffuse reflectors, achiev�ing a significant increase in the system thermal andelectrical energy output. Kostic� et al. [25] presentedthe results of the influence of reflectance from flatplate solar radiation reflectors made of Al sheet andAl foil on energy efficiency of PV/T collector.Recently, Gaur and Tiwari [26] optimized a PV/Tsystem by changing the number of the collectors.Kosticˆ et al. [27] optimized the system by orienta�tion of the collector.
In all works there is not an optimization of thePV/T system that optimize simultaneously designparameters like Tedlar, glass and solar cell thickness,air flow rate, the length and width of the PV/T collec�tor. However there were some works that just workedon optimizing the flow rate of the air or inlet air tem�perature or other parameters individually. Also thiswork is somehow because of using the genetic algo�rithms.
The aim of this paper is to design an optimal PV/Tsystem for using in different places. Since an optimaldesign is cost effective and reliable, the optimizationstudies about PV/T systems seem to be helpful.
SYSTEM DESCRIPTION
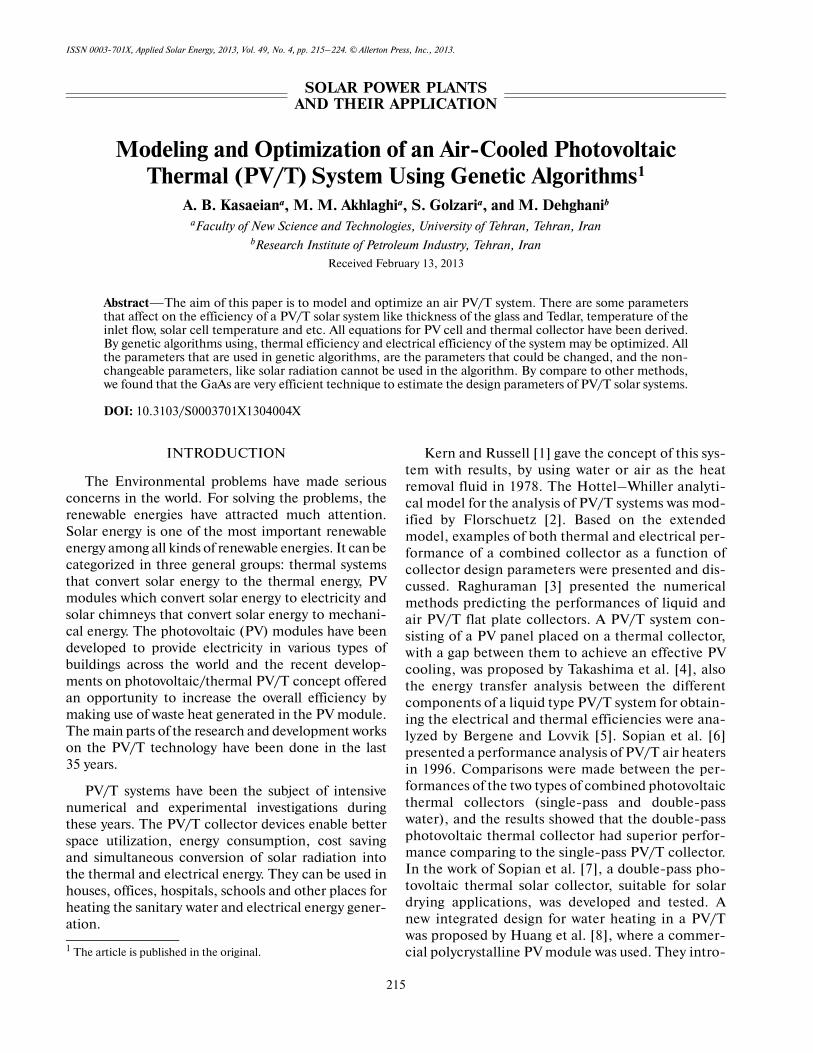
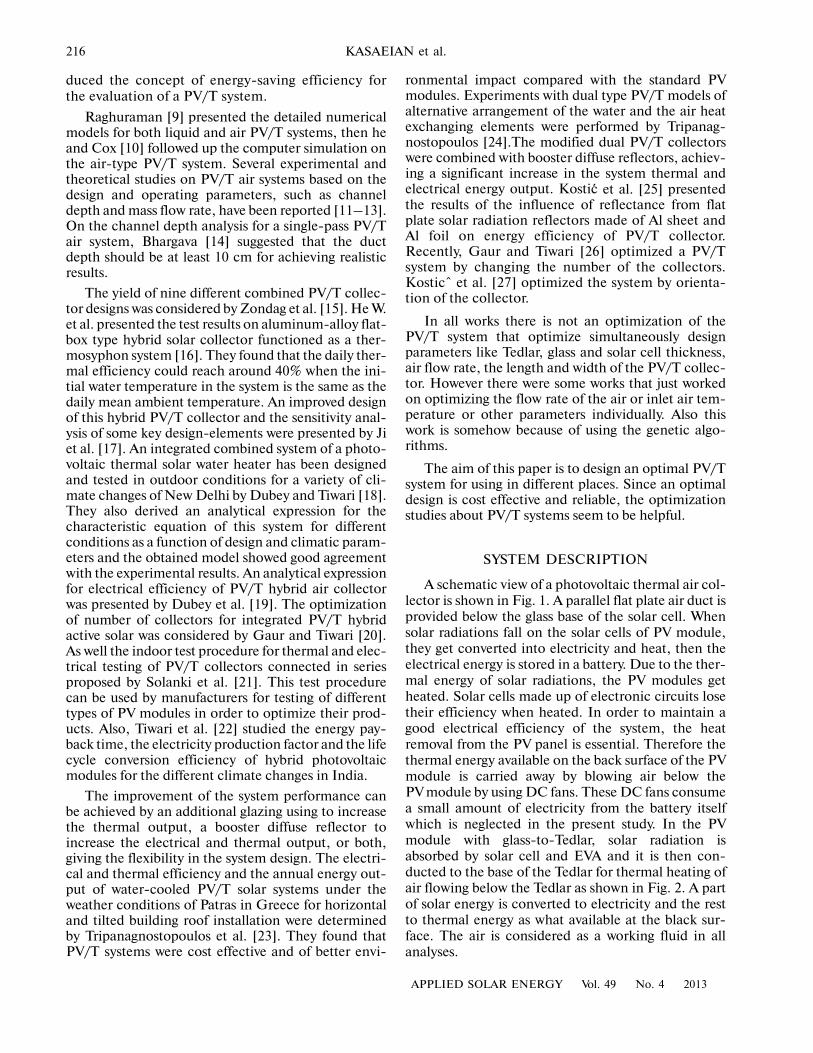
A schematic view of a photovoltaic thermal air col�lector is shown in Fig. 1. A parallel flat plate air duct isprovided below the glass base of the solar cell. Whensolar radiations fall on the solar cells of PV module,they get converted into electricity and heat, then theelectrical energy is stored in a battery. Due to the ther�mal energy of solar radiations, the PV modules getheated. Solar cells made up of electronic circuits losetheir efficiency when heated. In order to maintain agood electrical efficiency of the system, the heatremoval from the PV panel is essential. Therefore thethermal energy available on the back surface of the PVmodule is carried away by blowing air below thePV module by using DC fans. These DC fans consumea small amount of electricity from the battery itselfwhich is neglected in the present study. In the PVmodule with glass�to�Tedlar, solar radiation isabsorbed by solar cell and EVA and it is then con�ducted to the base of the Tedlar for thermal heating ofair flowing below the Tedlar as shown in Fig. 2. A partof solar energy is converted to electricity and the restto thermal energy as what available at the black sur�face. The air is considered as a working fluid in allanalyses.
APPLIED SOLAR ENERGY Vol. 49 No. 4 2013
MODELING AND OPTIMIZATION OF AN … PHOTOVOLTAIC THERMAL SYSTEM 217
ELECTRICAL EQUATIONS
The thermal analysis of PV/T air collector and itselectrical analysis are dependent to each other. Thecalculation precision of the thermal parameters of aPV/T air collector will be improved if the electricalefficiency of PV module is calculated correctly.
The theoretical expression of the current flowing ina photovoltaic cell versus the applied voltage resultedfrom the Schottky diffusion model in a PN junction isgiven by [29]:
(1)
where the ideality factor of temperature
it changes with the cell temperature.
To solve the nonlinear Eq. (1), theoretically fiveindependent equations are required. These are consid�ered as three cases including open circuit (OC), shortcircuit (SC) and maximum power (MP). In addition,the derivative at the peak of P–V curve gets zero, so weobtain the fourth equation. Two resistance values Rshand Rs are usually measured from the SC point andOC point of the I–V curve, so thereby another twoequations can be obtained. However, six equations areredundant for the five�parameter I–V characteristics.
Efficiency of the PV module will be calculate asbelow:
(2)
I IL Io–( )V IRs+
a���������������⎝ ⎠⎛ ⎞exp 1–
V IRsh+Rsh
�����������������,–=
aNsnIkTcell
q��������������������,=
η VIS
����� .=
THERMAL EQUATIONS
The proof of governing equations on PV/T air col�lector thermal analysis is not included in this study inorder to have a brief note. More details of governingequations derivations are found in Ref. [30].
Air flow
Air inletDC fans
Solar radiation
PV modules
Digital temperature
indicators
Tedlar
Frame
Battery
Solar cells
Air outlet
Wooden support Air duct
1 & 2
with EVA
–+
Fig. 1. Schematic diagram of hybrid PV/T air collector [30].
Glass
Solar cell
Tedlar
Air inlet Air outlet
and EVA
Insulation material
Tsky Tamb
Tg
Tcell
Tbs
Ti
Tamb
Fig. 2. Thermal resistance circuit diagram for a PV/T aircollector [28].
218
APPLIED SOLAR ENERGY Vol. 49 No. 4 2013
KASAEIAN et al.
The energy balance equation Writing for each com�ponent of a PV/T air collector gives the thermalparameters and thermal efficiency of a PV/T air col�lector as follows:
(3)
(4)
(5)
where Tcell, Tbs, Tamb, Tf, out, Tf; G, , Cp, L, W andηth are solar cell temperature, back surface tempera�ture, ambient temperature, outlet air temperature,average air temperature in flow duct, the rate of usefulthermal energy, solar radiation intensity, the mass flowrate of flowing air, the heat capacity of flowing air, thelength of air duct, the width of air duct and PV/T aircollector thermal efficiency, respectively.
In the above equations, the related heat transfercoefficients are defined as follows (more details of gov�erning equations derivations are found in Ref. [28].):
(6)
(7)
(8)
(9)
(10)
Some assumption have been considered on heatloss coefficients in order to simplify the calculations ofPV/T air collector thermal parameters as follows:
(11)
(12)
(13)
Tcellατ( )effG UtTamb UTTbs+ +
Ut UT+�����������������������������������������������������,=
Tbs
hp1 ατ( )effG UtTTamb hfTf+ +
UtT hf+����������������������������������������������������������,=
Q· u m· Cp Tf out,Tf in,
–( )=
= m· Cp
UL
�������� hp1hp2 ατ( )effG UL Tf in,
Tamb–( )–[ ]
× 1–WULL
m· Cp
�����������������⎝ ⎠⎛ ⎞exp– ,
Q· u, m·
ατ( )eff τg αcβc αT 1 βc–( ) βcηel–+[ ],=
hp1UT
UT Ut+���������������,=
hp2hf
UtT hf+���������������,=
UtT1Ut
���� 1UT
�����+1– UtUT
Ut UT+���������������,= =
Utf1hf
��� 1UtT
������+1– hfUtT
hf UtT+��������������� .= =
UTLsi
Ksi
�����LT
KT
�����+1–
,=
UtLg
Kg
���� 1hconv
��������� 1hrad
�������+ +1–
,=
hconv 2.8 3Vw,+=
where Vw is wind speed on the top surface of PV/T aircollector. The effective temperature of the sky (Tsky) iscalculated from the following empirical relation [14]:
(14)
In the estimation of the overall back loss coefficientfrom flowing air to the ambient (Ub), the convectiveheat transfer coefficient on the back surface of PV/Tair collector (hconv) has been calculated as below:
(15)
According to the aforementioned equation, Tcell
may be obtained and hrad can be calculated by follow�ing equation:
(16)
(17)
Having the electrical efficiency and thermal effi�ciency of the system now we can calculate the overallefficiency of the system as follow:
(18)
(19)
where Cf is the conversion factor of the thermal powerplant and it can be guessed as 0.4 for Iran.
RESULTS AND DISCUSSION
To treat with the overall efficiency curve numeri�cally, we performed a fitting procedure based opera�tion on the genetic algorithms (GAs); on the otherhand we used GAtool in MATLAB software to opti�mize the efficiency.
The procedure of the solving is defined as follow:
⎯Choosing the parameters.
⎯Defining the target function.
⎯Defining some parameters like first population.
⎯Running the toolbox.
Generally, ten parameters we chosen for GA: thelength of the air duct (L), the thickness of back insula�tion (Li), the Tedlar thickness (LT), the thickness ofsilicon solar cell (Lsi), the thickness of glass cover (Lg),the width of the PV/T air collector (W), inlet air tem�perature (Tf,in), the radiative heat transfer coefficient
(hrad), the mass flow rate of flowing air ( ) and theelectrical efficiency.
Tsky Tamb 6.–=
UbLi
Ki
���� 1hconv
���������+1–
.=
hrad εgσ Tsky Tcell+( ) Tsky2 Tcell
2+( ),=
UL Ub Utf.+=
ηthQ· u
WLG�����������,=
ηov ηthηel
Cf
�����,+=
m·
APPLIED SOLAR ENERGY Vol. 49 No. 4 2013
MODELING AND OPTIMIZATION OF AN … PHOTOVOLTAIC THERMAL SYSTEM 219
Actually, solving the problem was finished after twosteps: optimizing the thermal system, step two: opti�mizing the electrical system by using the results of thestep one.
In step one, the electrical efficiency was consideredas a parameter and calculated the best overall effi�ciency for all 10 parameters. In this step, electricalefficiency was calculated.
Interval changes obtained from references.
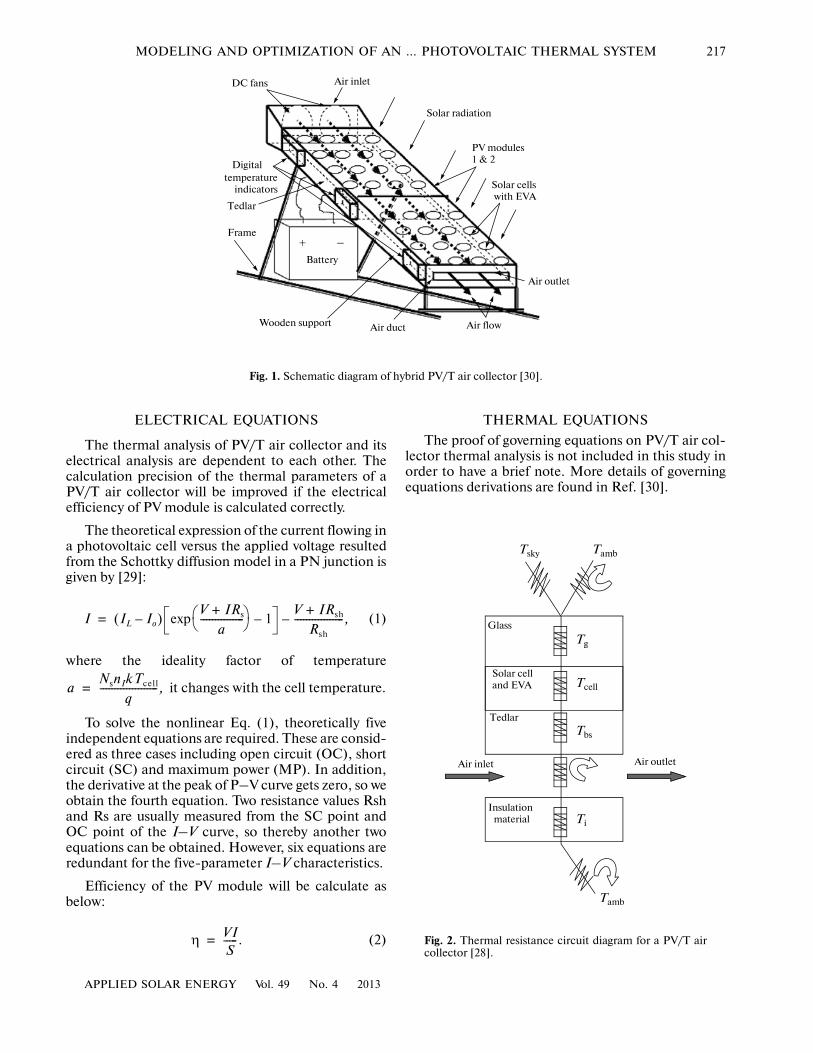
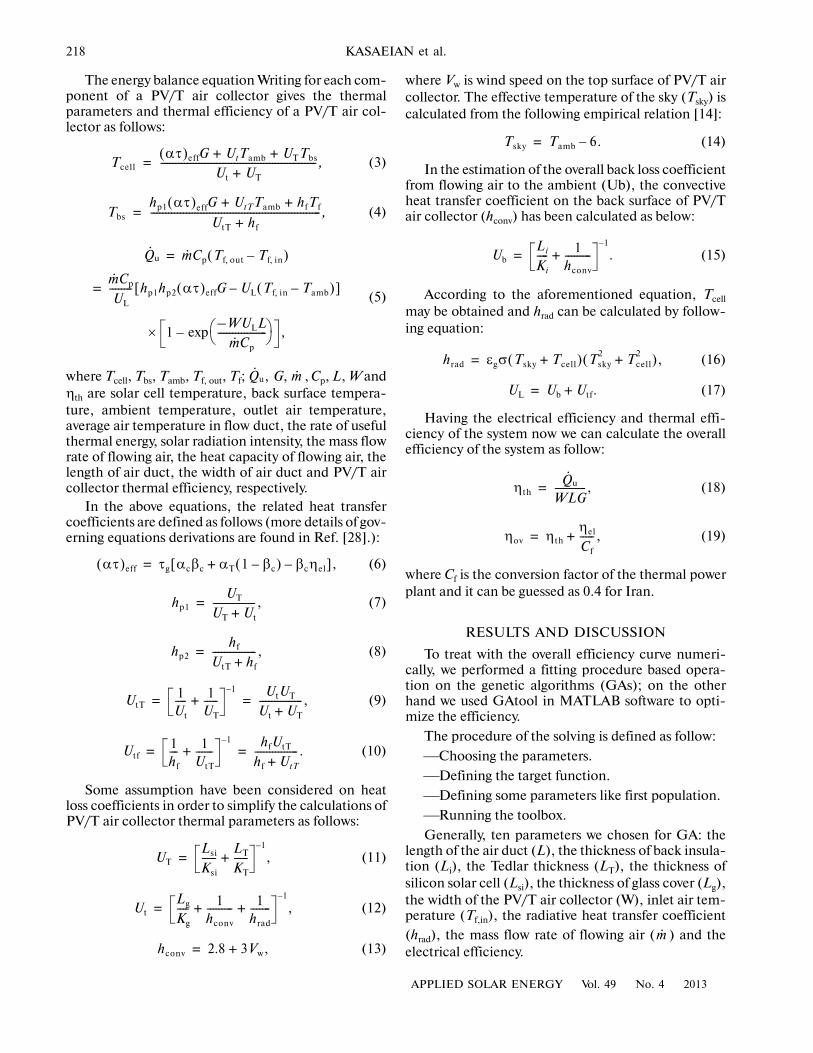
In Figs. 3–7 the variation of the overall efficiencyas a function of each parameter displayed.
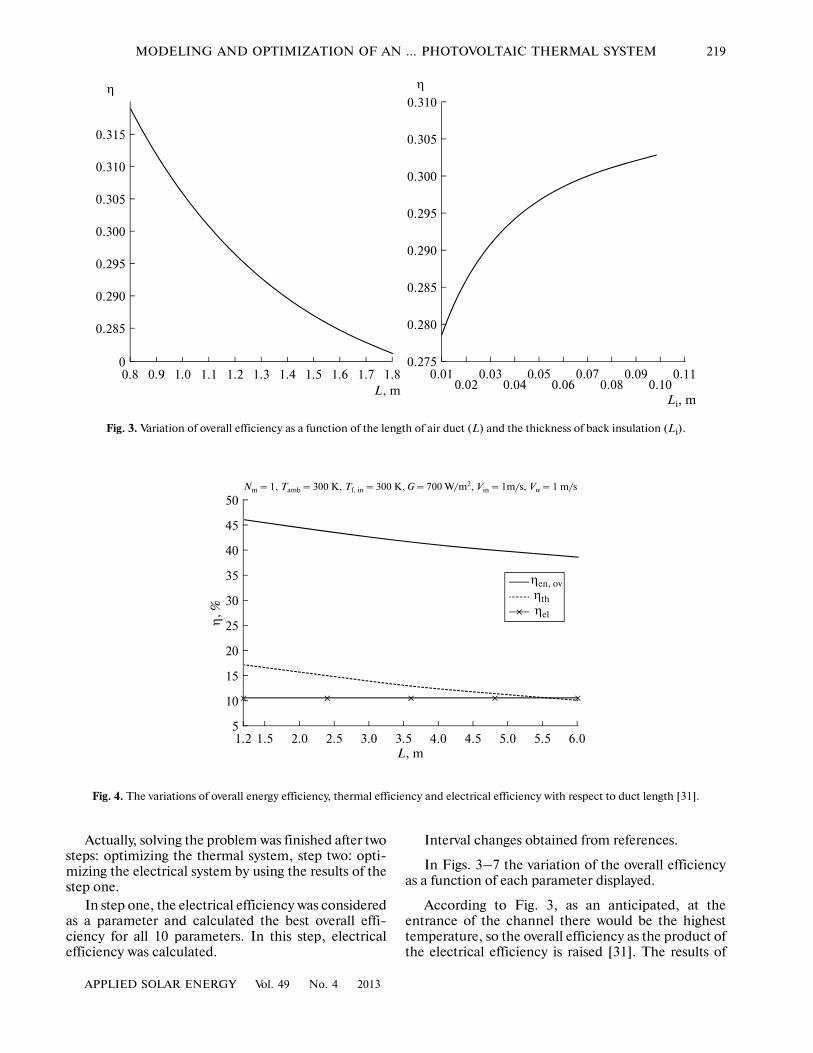
According to Fig. 3, as an anticipated, at theentrance of the channel there would be the highesttemperature, so the overall efficiency as the product ofthe electrical efficiency is raised [31]. The results of
00.8 0.9 1.0 1.1 1.2 1.3 1.4 1.5 1.6 1.7 1.8
0.285
0.290
0.295
0.300
0.305
0.310
0.315
0.2750.01
0.020.03
0.040.05
0.060.07
0.080.09
0.100.11
0.280
0.285
0.290
0.295
0.300
0.305
0.310
ηη
L, mLi, m
Fig. 3. Variation of overall efficiency as a function of the length of air duct (L) and the thickness of back insulation (Li).
10
51.2 1.5 2.0 2.5 3.0 3.5 4.0 4.5 5.0 5.5 6.0
15
20
25
30
35
40
45
50Nm = 1, Tamb = 300 K, Tf, in = 300 K, G = 700 W/m2, Vin = 1m/s, Vw = 1 m/s
ηen, ovηthηel
L, m
η,
%
Fig. 4. The variations of overall energy efficiency, thermal efficiency and electrical efficiency with respect to duct length [31].
220
APPLIED SOLAR ENERGY Vol. 49 No. 4 2013
KASAEIAN et al.
Fig. 3 were compared with the model of Sarhaddi et al.(Fig. 4) and a good agreement is observed.
So, because of increasing the thickness of the backinsulation, lower thermal energy is lost at the back.Therefore more energy will be available at the air flowexposer.
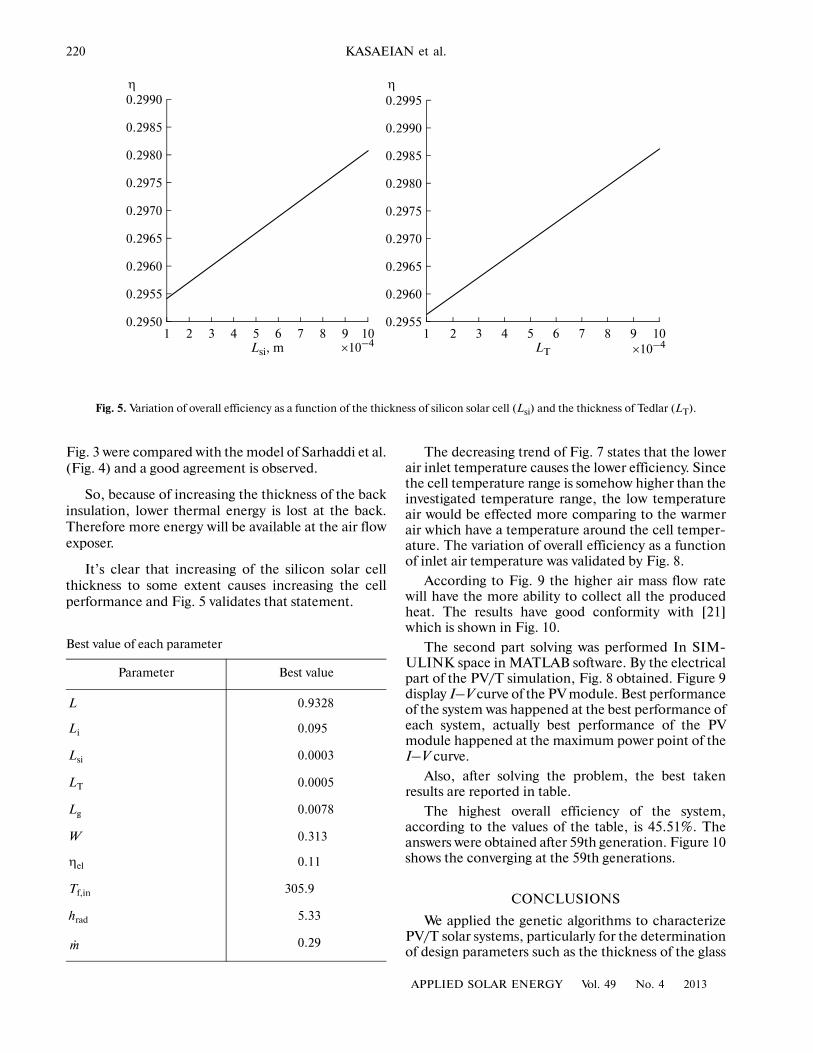
It’s clear that increasing of the silicon solar cellthickness to some extent causes increasing the cellperformance and Fig. 5 validates that statement.
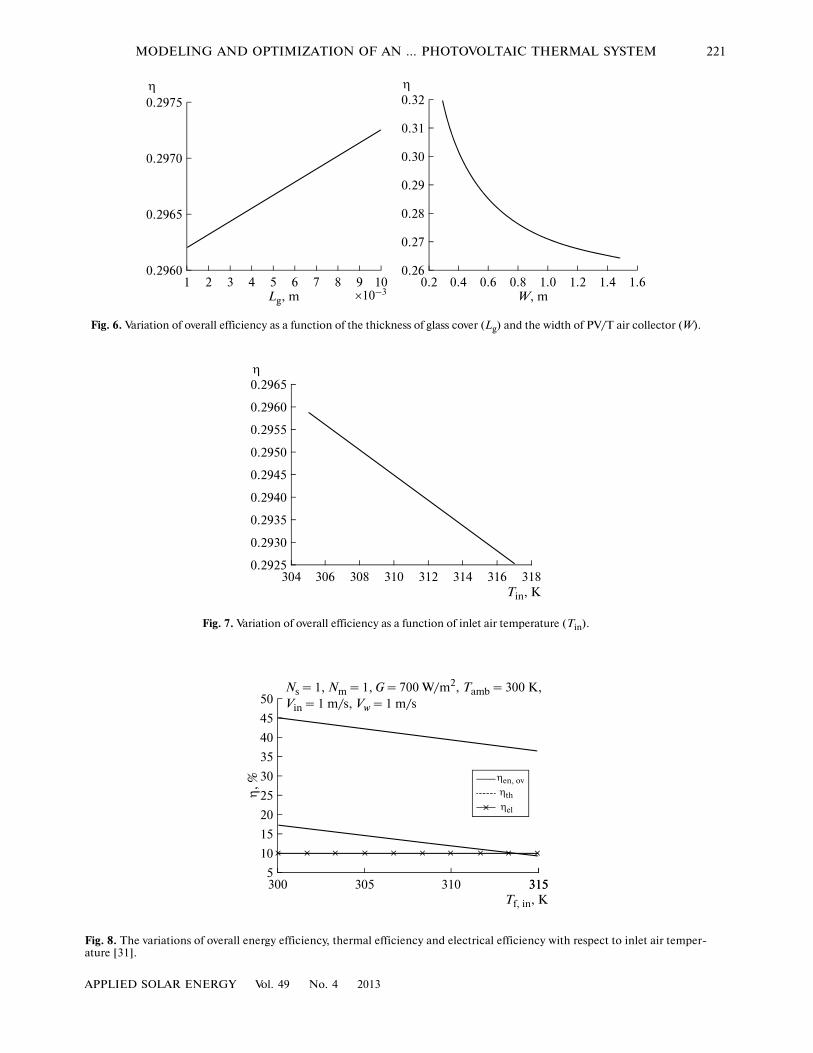
The decreasing trend of Fig. 7 states that the lowerair inlet temperature causes the lower efficiency. Sincethe cell temperature range is somehow higher than theinvestigated temperature range, the low temperatureair would be effected more comparing to the warmerair which have a temperature around the cell temper�ature. The variation of overall efficiency as a functionof inlet air temperature was validated by Fig. 8.
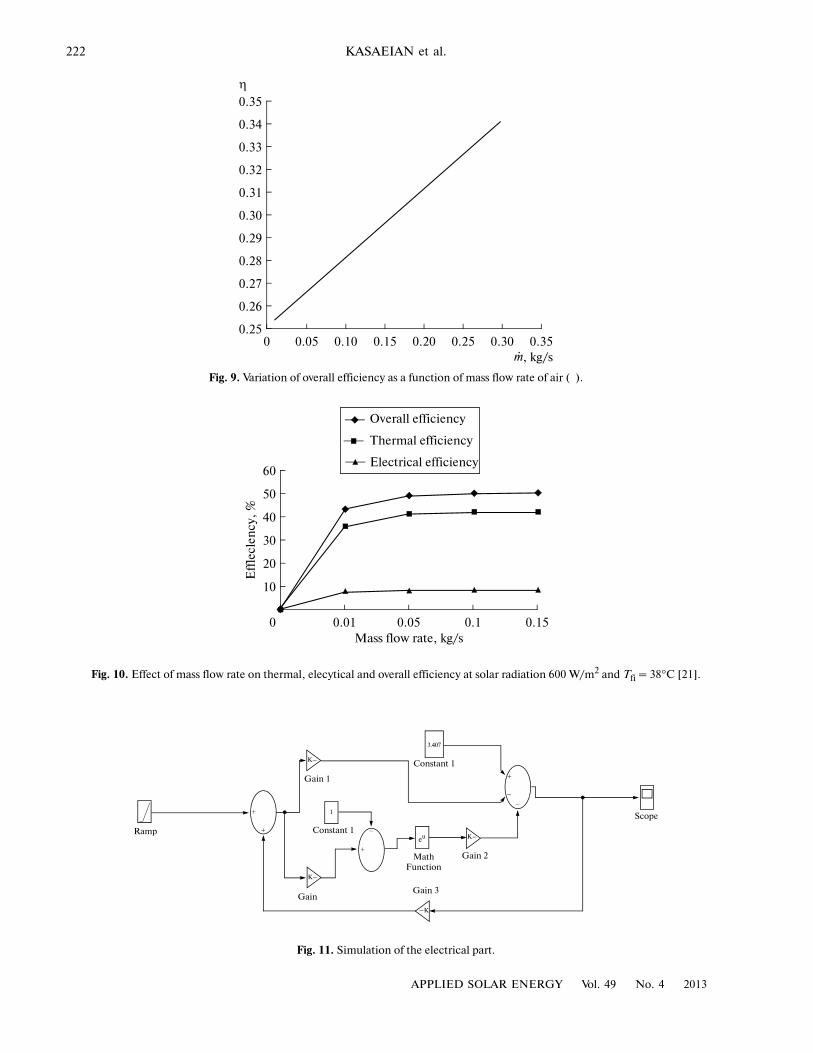
According to Fig. 9 the higher air mass flow ratewill have the more ability to collect all the producedheat. The results have good conformity with [21]which is shown in Fig. 10.
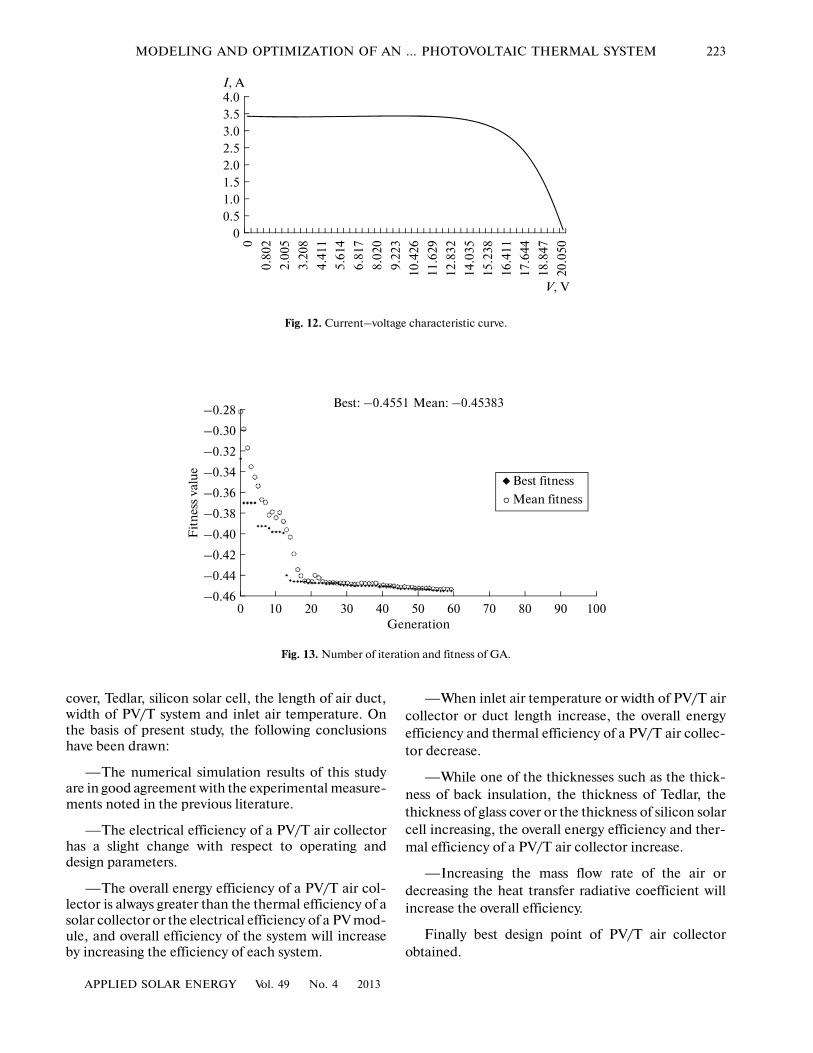
The second part solving was performed In SIM�ULINK space in MATLAB software. By the electricalpart of the PV/T simulation, Fig. 8 obtained. Figure 9display I–V curve of the PV module. Best performanceof the system was happened at the best performance ofeach system, actually best performance of the PVmodule happened at the maximum power point of theI–V curve.
Also, after solving the problem, the best takenresults are reported in table.
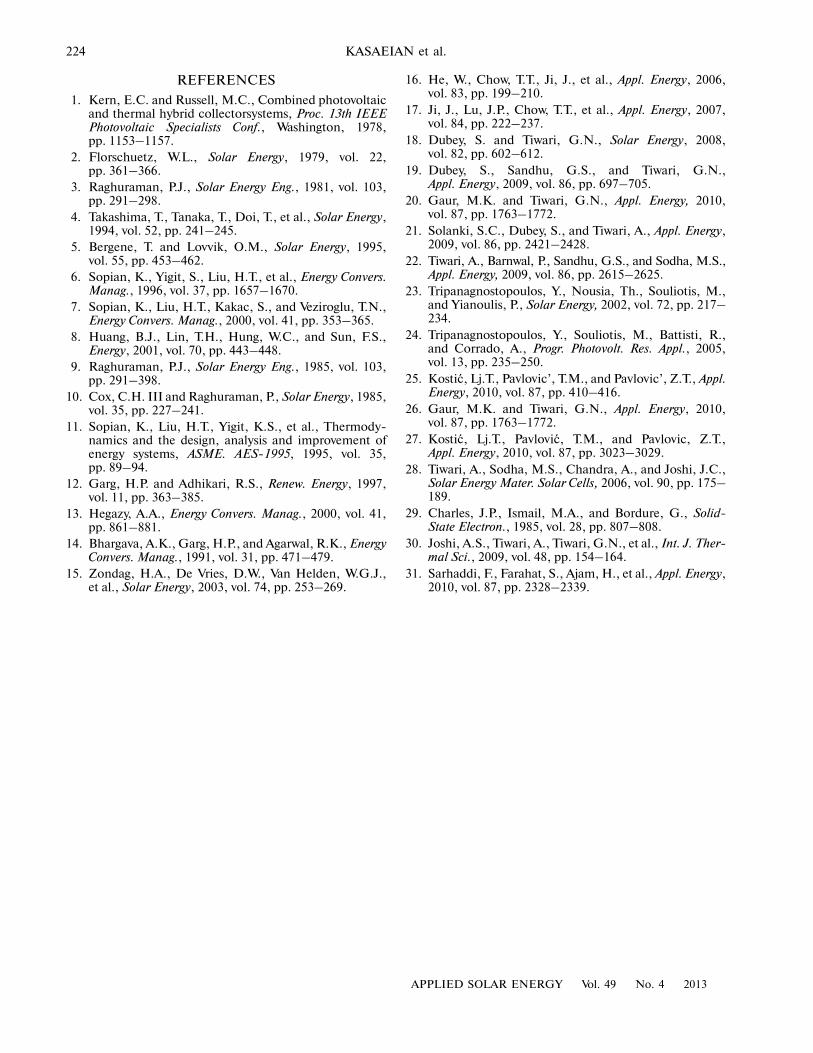
The highest overall efficiency of the system,according to the values of the table, is 45.51%. Theanswers were obtained after 59th generation. Figure 10shows the converging at the 59th generations.
CONCLUSIONS
We applied the genetic algorithms to characterizePV/T solar systems, particularly for the determinationof design parameters such as the thickness of the glass
0.29501 2 3 4 5 6 7 8 9 10
0.2955
0.2960
0.2965
0.2970
0.2975
0.2980
0.2985
0.2990
0.29551 2 3 4 5 6 7 8 9 10
0.2960
0.2965
0.2970
0.2975
0.2980
0.2985
0.2990
0.2995
LTLsi, m
η η
×10–4×10⁻⁴
Fig. 5. Variation of overall efficiency as a function of the thickness of silicon solar cell (Lsi) and the thickness of Tedlar (LT).
Best value of each parameter
Parameter Best value
L 0.9328
Li 0.095
Lsi 0.0003
LT 0.0005
Lg 0.0078
W 0.313
ηel 0.11
Tf,in 305.9
hrad 5.33
0.29m·
APPLIED SOLAR ENERGY Vol. 49 No. 4 2013
MODELING AND OPTIMIZATION OF AN … PHOTOVOLTAIC THERMAL SYSTEM 221
0.2960101 2
0.2965
0.2970
0.2975
3 4 5 6 7 8 90.26
0.2 0.4 0.6 0.8 1.0 1.2 1.4 1.6
0.27
0.28
0.29
0.30
0.31
0.32
Lg, m W, m
η η
Fig. 6. Variation of overall efficiency as a function of the thickness of glass cover (Lg) and the width of PV/T air collector (W).
0.2925304 306 308 310 312 314 316 318
0.2930
0.2935
0.2940
0.2945
0.2950
0.2955
0.2960
0.2965
Tin, K
η
Fig. 7. Variation of overall efficiency as a function of inlet air temperature (Tin).
10
5300 305
15
20
25
30
35
40
45
50
310 315
Ns = 1, Nm = 1, G = 700 W/m2, Tamb = 300 K,
Tf, in, K
η,
% ηen, ov
ηth
ηel
315
Fig. 8. The variations of overall energy efficiency, thermal efficiency and electrical efficiency with respect to inlet air temper�ature [31].
Vin = 1 m/s, Vw = 1 m/s
×10–3
222
APPLIED SOLAR ENERGY Vol. 49 No. 4 2013
KASAEIAN et al.
0.250 0.05 0.10 0.15 0.20 0.25 0.30 0.35
0.26
0.27
0.28
0.29
0.30
0.31
0.32
0.33
0.34
0.35
η
, kg/s
Fig. 9. Variation of overall efficiency as a function of mass flow rate of air ( ).
m·
0 0.01 0.05 0.1 0.15
10
20
30
40
50
60
Overall efficiency
Thermal efficiency
Electrical efficiency
Mass flow rate, kg/s
Eff
lecl
ency
, %
Fig. 10. Effect of mass flow rate on thermal, elecytical and overall efficiency at solar radiation 600 W/m2 and Tfi = 38°C [21].
Ramp
Gain 1
Constant 1
Scope
Math Gain 2
Gain Gain 3
Function
Constant 1
K–
K–
K–
+
–
+
+
+
–
–1
3.407
eu
–K
Fig. 11. Simulation of the electrical part.
APPLIED SOLAR ENERGY Vol. 49 No. 4 2013
MODELING AND OPTIMIZATION OF AN … PHOTOVOLTAIC THERMAL SYSTEM 223
cover, Tedlar, silicon solar cell, the length of air duct,width of PV/T system and inlet air temperature. Onthe basis of present study, the following conclusionshave been drawn:
—The numerical simulation results of this studyare in good agreement with the experimental measure�ments noted in the previous literature.
—The electrical efficiency of a PV/T air collectorhas a slight change with respect to operating anddesign parameters.
—The overall energy efficiency of a PV/T air col�lector is always greater than the thermal efficiency of asolar collector or the electrical efficiency of a PV mod�ule, and overall efficiency of the system will increaseby increasing the efficiency of each system.
—When inlet air temperature or width of PV/T aircollector or duct length increase, the overall energyefficiency and thermal efficiency of a PV/T air collec�tor decrease.
—While one of the thicknesses such as the thick�ness of back insulation, the thickness of Tedlar, thethickness of glass cover or the thickness of silicon solarcell increasing, the overall energy efficiency and ther�mal efficiency of a PV/T air collector increase.
—Increasing the mass flow rate of the air ordecreasing the heat transfer radiative coefficient willincrease the overall efficiency.
Finally best design point of PV/T air collectorobtained.
0.50
0
0.80
2
2.00
5
3.20
8
4.41
1
5.61
4
6.81
7
8.02
0
9.22
3
10.4
26
11.6
29
12.8
32
14.0
35
15.2
38
16.4
11
17.6
44
18.8
47
20.0
50
1.01.52.02.53.03.54.0I, A
V, V
Fig. 12. Current–voltage characteristic curve.
–0.461000 10 20 30 40 50 60 70 80 90
–0.44
–0.42
–0.40
–0.38
–0.36
–0.34
–0.32
–0.30
–0.28
Generation
Fit
nes
s va
lue
Best: –0.4551 Mean: –0.45383
Best fitness
Mean fitness
Fig. 13. Number of iteration and fitness of GA.
224
APPLIED SOLAR ENERGY Vol. 49 No. 4 2013
KASAEIAN et al.
REFERENCES
1. Kern, E.C. and Russell, M.C., Combined photovoltaicand thermal hybrid collectorsystems, Proc. 13th IEEEPhotovoltaic Specialists Conf., Washington, 1978,pp. 1153–1157.
2. Florschuetz, W.L., Solar Energy, 1979, vol. 22,pp. 361–366.
3. Raghuraman, P.J., Solar Energy Eng., 1981, vol. 103,pp. 291–298.
4. Takashima, T., Tanaka, T., Doi, T., et al., Solar Energy,1994, vol. 52, pp. 241–245.
5. Bergene, T. and Lovvik, O.M., Solar Energy, 1995,vol. 55, pp. 453–462.
6. Sopian, K., Yigit, S., Liu, H.T., et al., Energy Convers.Manag., 1996, vol. 37, pp. 1657–1670.
7. Sopian, K., Liu, H.T., Kakac, S., and Veziroglu, T.N.,Energy Convers. Manag., 2000, vol. 41, pp. 353–365.
8. Huang, B.J., Lin, T.H., Hung, W.C., and Sun, F.S.,Energy, 2001, vol. 70, pp. 443–448.
9. Raghuraman, P.J., Solar Energy Eng., 1985, vol. 103,pp. 291–398.
10. Cox, C.H. III and Raghuraman, P., Solar Energy, 1985,vol. 35, pp. 227–241.
11. Sopian, K., Liu, H.T., Yigit, K.S., et al., Thermody�namics and the design, analysis and improvement ofenergy systems, ASME. AES�1995, 1995, vol. 35,pp. 89–94.
12. Garg, H.P. and Adhikari, R.S., Renew. Energy, 1997,vol. 11, pp. 363–385.
13. Hegazy, A.A., Energy Convers. Manag., 2000, vol. 41,pp. 861–881.
14. Bhargava, A.K., Garg, H.P., and Agarwal, R.K., EnergyConvers. Manag., 1991, vol. 31, pp. 471–479.
15. Zondag, H.A., De Vries, D.W., Van Helden, W.G.J.,et al., Solar Energy, 2003, vol. 74, pp. 253–269.
16. He, W., Chow, T.T., Ji, J., et al., Appl. Energy, 2006,vol. 83, pp. 199–210.
17. Ji, J., Lu, J.P., Chow, T.T., et al., Appl. Energy, 2007,vol. 84, pp. 222–237.
18. Dubey, S. and Tiwari, G.N., Solar Energy, 2008,vol. 82, pp. 602–612.
19. Dubey, S., Sandhu, G.S., and Tiwari, G.N.,Appl. Energy, 2009, vol. 86, pp. 697–705.
20. Gaur, M.K. and Tiwari, G.N., Appl. Energy, 2010,vol. 87, pp. 1763–1772.
21. Solanki, S.C., Dubey, S., and Tiwari, A., Appl. Energy,2009, vol. 86, pp. 2421–2428.
22. Tiwari, A., Barnwal, P., Sandhu, G.S., and Sodha, M.S.,Appl. Energy, 2009, vol. 86, pp. 2615–2625.
23. Tripanagnostopoulos, Y., Nousia, Th., Souliotis, M.,and Yianoulis, P., Solar Energy, 2002, vol. 72, pp. 217–234.
24. Tripanagnostopoulos, Y., Souliotis, M., Battisti, R.,and Corrado, A., Progr. Photovolt. Res. Appl., 2005,vol. 13, pp. 235–250.
25. Kostic�, Lj.T., Pavlovic’, T.M., and Pavlovic’, Z.T., Appl.Energy, 2010, vol. 87, pp. 410–416.
26. Gaur, M.K. and Tiwari, G.N., Appl. Energy, 2010,vol. 87, pp. 1763–1772.
27. Kostic�, Lj.T., Pavlovic�, T.M., and Pavlovic, Z.T.,Appl. Energy, 2010, vol. 87, pp. 3023–3029.
28. Tiwari, A., Sodha, M.S., Chandra, A., and Joshi, J.C.,Solar Energy Mater. Solar Cells, 2006, vol. 90, pp. 175–189.
29. Charles, J.P., Ismail, M.A., and Bordure, G., Solid�State Electron., 1985, vol. 28, pp. 807–808.
30. Joshi, A.S., Tiwari, A., Tiwari, G.N., et al., Int. J. Ther�mal Sci., 2009, vol. 48, pp. 154–164.
31. Sarhaddi, F., Farahat, S., Ajam, H., et al., Appl. Energy,2010, vol. 87, pp. 2328–2339.


