F O R T H E F I S C A L Y E A R E N D E D J U N E 3 0 , 2 0 1 8
COMPREHENSIVE ANNUAL FINANCIAL REPORT
MINNESOTA SPORTS FACILITIES AUTHORITY • MINNEAPOLIS, MINNESOTA
— A COMPONENT UNIT OF THE STATE OF MINNESOTA —
This document is made available electronically by the Minnesota Legislative Reference Library as part of an ongoing digital archiving project. http://www.leg.state.mn.us/lrl/lrl.asp

FINANCE DEPARTMENT1005 FOURTH STREET SOUTH
MINNEAPOLIS, MINNESOTA 55415-1752
1
— A COMPONENT UNIT OF THE STATE OF MINNESOTA —
F O R T H E F I S C A L Y E A R E N D E D J U N E 3 0 , 2 0 1 8
COMPREHENSIVE ANNUAL FINANCIAL REPORT
MINNESOTA SPORTS FACILITIES AUTHORITY • MINNEAPOLIS, MINNESOTA

2
3
TABLE OF CONTENTS
INTRODUCTORY SECTION ........................................................................5
Letter of Transmittal ......................................................................................7
GFOA Certificate of Achievement .......................................................... 14
Commissioners and Administrative Officials ...................................... 15
Organization Chart ....................................................................................... 16
FINANCIAL SECTION ................................................................................. 17
Independent Auditors’ Report ................................................................. 19
Management’s Discussion and Analysis ............................................... 21
Basic Financial Statements
Statement of Net Position ......................................................................... 28
Statement of Revenues, Expenses and Changes in Net Position ...29
Statement of Cash Flows ..........................................................................30
Notes to the Financial Statements ......................................................... 31
Required Supplementary Information
Schedule of the Authority’s Share of Net Pension Liability
State Employees Retirement Fund ..................................................49
Schedule of Authority’s Contributions
State Employees Retirement Fund ..................................................49
STATISTICAL SECTION .............................................................................. 51
List of Statistical Tables ............................................................................. 53
Net Position by Component ......................................Table 1.1 ..............54
Changes in Net Position ............................................Table 1.2 .............. 55
User Fee Revenues by Source .................................Table 2.1 ..............56
Demographic and Economic Statistics ................Table 3.1 .............. 57
Principal Employers in Minnesota .........................Table 3.2 .............. 57
Full-time Employees by Department ....................Table 4.1 ..............58

4
5
INTRODUCTORY SECTION
The Introductory Section contains the letter of transmittal,
which provides an overview of the Minnesota Sports Facilities
Authority’s finances, economic prospects, and achievements.
Also, included in this section is the list of commissioners and
administrative officials, the organization chart, and the Certificate
of Achievement for Excellence in Financial Reporting, awarded
by the Government Finance Officers Association. It is the highest
form of recognition in governmental financial reporting.
— A COMPONENT UNIT OF THE STATE OF MINNESOTA —
F O R T H E F I S C A L Y E A R E N D E D J U N E 3 0 , 2 0 1 8
COMPREHENSIVE ANNUAL FINANCIAL REPORT
MINNESOTA SPORTS FACILITIES AUTHORITY • MINNEAPOLIS, MINNESOTA
6
7
Minnesota Sports Facilities Authority 1005 4th Street South, Suite 401, Minneapolis, MN 55415-1752
November 26, 2018
To the Honorable Chairman and Commissioners of the Minnesota Sports Facilities Authority:
I am pleased to submit to you the Comprehensive Annual Financial Report (CAFR) of the Minnesota Sports Facilities Authority (Authority) for the fiscal year ended June 30, 2018. The financial statements included in this report conform to generally accepted accounting principles as promulgated by the Governmental Accounting Standards Board (GASB). Responsibility for the accuracy of the data and the completeness and fairness of the presentation, including all disclosures, rests with management. To the best of our knowledge and belief, the enclosed data are accurate in all material respects and are reported in a manner that presents fairly the financial position and results of operations of the Authority. All necessary disclosures have been included to enable the reader to gain the maximum understanding of the Authority’s financial affairs.
The Authority’s management is responsible for establishing and maintaining an internal control structure designed to ensure that its assets are protected from loss, theft or misuse and to ensure that adequate accounting data are compiled to allow for the preparation of financial statements in conformity with generally accepted accounting principles. The internal control structure is designed to provide reasonable but not absolute assurance that these objectives are met and that the financial statements will be free from material misstatement. The concept of reasonable assurance recognizes that the cost of a control should not exceed the benefits likely to be derived. The evaluation of costs and benefits requires estimates and judgments by management.
Minnesota Statutes 473J.07, subd.7, requires the Minnesota Office of the Legislative Auditor (Legislative Auditor) to conduct an annual audit of the financial statements of the Authority. The Legislative Auditor delegated this responsibility to CliftonLarsonAllen LLP (CLA) for the current audit. CLA issued an independent auditors’ report which is presented as the first component of the financial section of this report. The goal of the audit is to provide reasonable assurance that the financial statements of the Authority, for the fiscal year ended June 30, 2018, are free of material misstatement. The audit involved examining, on a test basis, evidence supporting the amounts and disclosures in the financial statements; assessing the accounting principles used and significant estimates made by management; and evaluating the overall financial statement presentation. CLA issued an unmodified (“clean”) opinion on the Authority’s financial statements for the fiscal year ended June 30, 2018.
The reader is referred to Management’s Discussion and Analysis (MD&A) section for additional information regarding the activities and financial position of the Authority. The MD&A provides a narrative introduction, overview, and analysis of the basic financial statements. MD&A complements this letter of transmittal and should be read in conjunction with it.
Phone: 612-332-0386 TTY: 1-800-627-3529 Fax: 612-332-8334www.msfa.com Affirmative Action/Equal Opportunity Employer
8
Minnesota Sports Facilities Authority 1005 4th Street South, Suite 401, Minneapolis, MN 55415-1752
PROFILE OF THE AUTHORITY
In May 2012, the Minnesota legislature established the Authority as a public body and political subdivision of the state. Per Minnesota Statutes, 473J.07, Subd. 2 the Authority is comprised of five members, the governor of the state of Minnesota appoints the chair and two additional members, and the mayor of the city of Minneapolis appoints two members. The members serve four-year terms.
Governor Mark Dayton appointed Michael Vekich as the Chair effective July 22, 2017. Mr. Vekich replaced Kathleen Blatz who served as the Interim Chair from March 9, 2017 until July 21, 2017. The Authority appointed Richard Evans as its Executive Director effective March 13, 2017. Richard Evans resigned effective December 31, 2017. The Authority executed a contract with James Farstad for Interim Executive Director services beginning on January 1, 2018. An executive search was conducted and Mr. Farstad was hired as the Authority’s Executive Director effective May 18, 2018. The governing body sets policy for the administration of the Authority and the Executive Director directs the Authority’s operations and carries out the policies established by the board.
The Authority’s mission is to provide for the construction, financing, and long-term use of U.S. Bank Stadium and the related stadium infrastructure as a venue for professional football and a broad range of other civic, community, athletic, educational, cultural, and commercial activities.
An annual operating budget is adopted on a basis consistent with generally accepted accounting principles. Discussion and preparation of the fiscal year 2018-2019 annual operating and capital budgets began in March 2018 The Authority then approved and adopted the 2018-2019 operating and capital budgets in June 2018. This budget process will be followed for adoption of the 2019-2020 budget. Per Minnesota Statutes 3.8842, the Legislative Commission on Minnesota Sports Facilities (Legislative Commission) is required to oversee the Authority’s operating and capital budgets. An annual report is presented to the Legislative Commission. Also, staff presents quarterly budget reports to the Authority.
ECONOMIC CONDITION and OUTLOOK
Local EconomyU.S. Bank Stadium, home field for the Minnesota Vikings football team, is located in the East Town neighborhood of Minneapolis in Minnesota. East Town has been the epicenter of development for Minneapolis for several years with the construction of a number of high-profile office buildings, apartment buildings, and hotel development projects. Minneapolis is known for its professional baseball, basketball and football sports teams, an abundance of arts, music and theatre organizations, and diverse restaurant options that make it a magnet for entertainment. Guests from the Minneapolis-St. Paul metropolitan area, greater Minnesota, and from other states attend events in the stadium.
9
Minnesota Sports Facilities Authority 1005 4th Street South, Suite 401, Minneapolis, MN 55415-1752
Employment growth, consumer purchases, and household finances are important economic indicators for the sports and entertainment industry as they influence stadium event attendance, ticket revenues, food and beverage revenues, and event space rental revenues. Minnesota has a stable and business-friendly environment. It ranks ninth nationwide in the number of Fortune 500 companies with 19 Fortune 500 companies headquartered in the state. According to a 2017 report by WalletHub, Minnesota ranked as the sixth best state for jobs. This study analyzed all 50 states and considered 24 metrics including job-market strength, economic vitality, and opportunity.
Both the national and the local economy are projected to continue on a steady growth path. The Bureau of Economic Analysis estimates that U.S. real gross domestic product (GDP) grew at an annual rate of 4.2 percent in the second quarter of 2018 and they forecast that the GDP will remain strong in the second half of 2018. Growth in real consumer spending remains the largest contributor to real GDP growth.
Local economic indicators point toward a steady rate of growth for Minnesota. A tight labor market, the addition of jobs at a steady pace and a declining unemployment rate together with the high demand for labor continues to support growth in Minnesota. Minnesota’s unemployment rate dropped to 2.5 percent as of August 2018 which is a decrease of .8 percent from the August 2017 rate, this is the lowest rate in years. This rate is well below the national unemployment rate of 3.9 percent.
The Consumer Price Index (CPI) for All Urban Consumers in the Midwest Region of the United States increased 1.9 percent from September 2017 to September 2018 as reported by the U.S. Bureau of Labor Statistics. The CPI is a measure of the average change in prices over time in a fixed market basket of goods and services.
Total compensation costs for private industry workers increased 3.2 percent in the Minneapolis-St. Paul metropolitan area for the year ended June 2018 per the U. S. Bureau of Labor Statistics. Compensation costs include wages, salaries and employers’ costs for employee benefits. During this period wages and salaries, the largest component of total compensation costs, rose 3.1 percent. Nationwide, total compensation costs and wages and salaries increased 2.9 percent, over the same one-year period.
Minnesota employment gains continue to be broad-based. Minnesota has added jobs in nine of the eleven major industry sections, with the largest gains in education and health services, construction, trade, transportation and utilities, and professional and business services. Total wage and salary income are forecast to grow 5.5 percent in 2019. This is larger than the forecasted wage growth of 5.3 percent for the U.S. in 2019.
10
Minnesota Sports Facilities Authority 1005 4th Street South, Suite 401, Minneapolis, MN 55415-1752
MAJOR INITIATIVES AND ACCOMPLISHMENTS
Stadium OperatorSMG, LLP was hired as the operator of U.S. Bank Stadium in August 2014 and is responsible for event promotions, event sales and marketing, event services, stadium security, and stadium management and operations. The operations of U.S. Bank Stadium are included in the Authority’s financial statements. The first year of operation was hugely successful and SMG kicked off its second year of operations with a robust event schedule. SMG continues to aggressively market the stadium for future events and has booked a wide variety of events in U.S. Bank Stadium for its third year of operations. Following are a few highlights of the stadium:
Minnesota Vikings Football, Concerts, Motorsports events, and Other eventsThe 2017 Minnesota Vikings football season hosted ten home football games in the stadium from August 2017 through December 2017, and then on January 14, 2018 the team played the first NFL Divisional Playoff game in the stadium. Four major concerts took to the stage at U.S. Bank Stadium with music for all ages and all genres: Guns N’ Roses’ Not in this Lifetime Tour! was held on July 20, 2017, Coldplay’s Head Full of Dreams Tour was held on August 12, 2017, U2’s 2017 Joshua Tree Tour was held on September 8, 2017, and Kenny Chesney’s Trip Around the Sun Tour was held on May 5, 2018. Monster Jam motorsport shows were held on December 2, 2017 and April 7, 2018. Monster Energy AMA Supercross was held on April 14, 2018. Minneapolis X Games 2017’s first stadium event was held from July 13, to 16, 2017. There were also 80 collegiate baseball games including the University of Minnesota Dairy Queen Classic. The Minnesota High School League also hosted soccer and football championship games at the stadium.
Super Bowl LIIMonths and months of planning and preparations went into making Super Bowl LII a significant and successful event. Super Bowl LII was hosted on February 4, 2018, which was the coldest Super Bowl Sunday in history at 2°F. Attendance in the stadium reached 67,612, twenty-five countries were represented by the guests, and there were 5,800 credentialed media. “By nearly every measure, Super Bowl LII was a major success – from the live fan experience and satisfaction to the tremendous viewing audience; from the legacy left in the Minnesota community to the legacy impact on future Super Bowl planning” stated Peter O’Reilly, National Football League Senior Vice President, Events & Club Business Development.
Tour ProgramU.S. Bank Stadium was a popular tourist activity for guests to learn the facts and figures of the stadium’s operations, view the beautiful artwork throughout the stadium, and experience the clubs and stadium’s back-of-house operations. Over 45,600 guests from all fifty states and many countries toured the stadium from August 2017 through June 2018. There were 1,043 public tours, 285 group tours, and 606 event tours. A highlight of this year’s program was the launch of the Education Tour. Customized educational tours were offered for elementary, middle school and high school students. Approximately 2,700 students participated in the two-hour education journey through the stadium which described the stadium’s operations and linked it to what students are learning in the classroom.
11
Minnesota Sports Facilities Authority 1005 4th Street South, Suite 401, Minneapolis, MN 55415-1752
SustainabilityA robust sustainability program was initiated in the stadium’s first year of operations and the program continues to grow and expand. During fiscal year 2017-2018 U.S. Green Building Council awarded LEED (Leadership in Energy and Environmental Design) GOLD Certification for Design and Construction to U.S. Bank Stadium. Environmental sustainability continues to be a goal with implementation of green design elements including a waste diversion program and energy use reduction. A major achievement for this program occurred at Super Bowl LII, stadium staff were able to recycle, compost, donate, or reuse more than 91 percent of all fan generated waste and divert this waste from the trash-to-energy incinerator. More than 63 tons of waste were recycled, reused or recovered. This waste diversion initiative was so successful that it will continue to be used for future major events at the stadium. The program’s second major initiative was a commitment to energy use reduction. This initiative gained a lot of yardage in the stadium’s second year of operations. Stadium staff closely monitored and controlled the Heating Ventilation and Air Conditioning (HVAC) systems and the electrical system to reduce energy usage throughout the stadium and thereby reducing energy costs.
Stadium ConcessionaireAramark Sports and Entertainment Services, LLC (Aramark), provides the food and beverage service, premium catering service, and concession services in U.S. Bank Stadium including the six clubs, the suites, the concession stands, and the various bars, portable carts, and vending locations. Aramark reported gross sales of $39.8 million for its second year of operations at U.S. Bank Stadium. Aramark paid commissions on certain food and beverage sales to the Minnesota Vikings for their events and the Authority reported food and beverage commission revenues of $4.6 million for the second year of operations for Authority events. The Authority also reported capital contributions of $963,083 from Aramark, which is 2.5 percent of gross food and beverage sales, for deposit into the Authority’s concession capital reserve account.
Capital improvementsThe following major capital and concession capital improvements were made to U.S. Bank Stadium during the fiscal year:
Women’s Locker Room ProjectA locker room was needed for female football coaching and training staff. Space on the event level of the stadium that had been used for pre-event staging was available for this project. This area was remodeled into a multi-purpose space which could be used as a locker room, a green room and/or a production room for other events. The cost for this project was $334,891.
Hyundai Club Kitchen ProjectU.S. Bank Stadium’s Hyundai Club had an east and west concession area. A kitchen preparation area and additional electrical services were needed in order to expand the premium food and beverage service options in the stadium. Kitchen equipment was added to the existing food preparation space within the east concession stand. The cost for this project was $576,726.
12
Minnesota Sports Facilities Authority 1005 4th Street South, Suite 401, Minneapolis, MN 55415-1752
Video Production Room Cooling ProjectThe video rack room and the video production space have a large volume of video equipment that emits heat during use. The temperature in the rack room and the production spaces ranged from 80°F to 90°F during events. The maximum temperature of the room should not exceed 70°F to maximize usage of the equipment. In order to reduce the temperature in these rooms, additional cooling units were added. The cost for this project was $453,477.
Other projects• Fiber and data cabling were added to expand the technology network in the stadium, the cost for
this project was $350,000.• Food service electrical power was added throughout the stadium due to the addition of food
service equipment and video menu screens, the cost for this project was $261,303.• The stadium’s lighting controls were upgraded as an energy savings enhancement, the cost for this
project was $252,475. • Glass enclosures and railings were added around the stadium’s super truss as a life safety measure,
the cost for this project was $302,331.
Future EventsPlanning is underway for future major events to be hosted at U.S. Bank Stadium. These events will bring tremendous economic benefits to the Minneapolis-St. Paul metropolitan area as thousands of visitors from all over the country will participate in the events. These events bring a multitude of opportunities for guests to be involved in the festivities and it will have a large economic impact on the community and the stadium. Following is a list of events planned to be hosted at U.S. Bank Stadium during its third year of operations:
• Ten NFL Minnesota Vikings home football games
• Five major concerts• Three motorsports events• Minneapolis X Games 2018• NCAA Men’s Basketball Final Four
• NCAA Basketball test event game• Many tradeshows, galas, turf and
club events• High school and collegiate baseball
and football games
NCAA Men’s Basketball Final Four 2019Minneapolis will host the 2019 National Collegiate Athletic Association (NCAA) Final Four Men’s Basketball tournament on April 6 to 8, 2019. Three games, two semifinal games on Saturday and a championship game on Monday, will be played. The stadium will be transformed from a football field into a basketball court complete with court side seating and bleachers, a center hung scoreboard, and basketball hoops. There are several community events leading up to the championship games including Reese’s Final Four Friday which is an open shoot-around that will be held at the stadium, a Final Four fan festival with autographs and interactives games, a children’s basketball parade; plus three days of live music .The Authority and SMG staff continue to meet with the NCAA Final Four Host Committee to finalize event plans and preparations for this collegiate event.
13
Minnesota Sports Facilities Authority 1005 4th Street South, Suite 401, Minneapolis, MN 55415-1752
Downtown East Parking Garage and Mills Fleet Farm Parking GarageThe Authority owns the Downtown East Parking Garage which has 455 parking spaces and is located beneath the stadium plaza on a site adjacent to the stadium. The Authority also owns the six-level Mills Fleet Farm Parking Garage which has 1,610 parking spaces and is connected via the stadium skyway to U.S. Bank Stadium. Beginning on December 31, 2015 Ryan Companies assumed operational responsibility for the ramps. Ryan Companies hired a parking management company to operate both parking facilities. All parking revenues belong to Ryan Companies during their management period and they are responsible for all parking expenses.
OTHER INFORMATION
Awards and AcknowledgementsThe Government Finance Officers Association of the United States and Canada (GFOA) awarded a Certificate of Achievement for Excellence in Financial Reporting to the Authority for its CAFR for the 18-month fiscal period ended June 30, 2017. This was the fifth year that the Authority received this prestigious award. In order to be awarded a Certificate of Achievement, a governmental unit must publish an easily readable and efficiently organized comprehensive annual financial report, the contents of which conform to program standards. This report must satisfy both generally accepted accounting principles and applicable legal requirements. A Certificate of Achievement is valid for a period of one year only. We believe our current CAFR will meet the Certificate of Achievement Program’s requirements, and we are submitting it to the GFOA to determine its eligibility for a certificate. The Certificate of Achievement is a prestigious national award which recognizes conformance with the highest standards for preparation of state and local government financial reports.
This CAFR reflects our commitment to the Authority and all interested readers of this report to provide information in conformance with the highest standards of financial reporting. Preparation of this CAFR was made possible by the dedicated service of Suzanne Arcand and Caryn Goettsch, RSM. They have my sincere appreciation for the contributions they made in the preparation of this report. Appreciation is also expressed to the Commissioners for their cooperation and outstanding assistance in matters pertaining to the financial affairs of the Authority.
Respectfully submitted,
Mary Fox-Stroman, CPADirector of Finance
14
Government Finance Officers Association
Certificate of Achievement for Excellence in Financial Reporting
Presented to
Minnesota Sports Facilities Authority
For its Comprehensive Annual Financial Report
for the Fiscal Year Ended
June 30, 2017
Executive Director/CEO
15
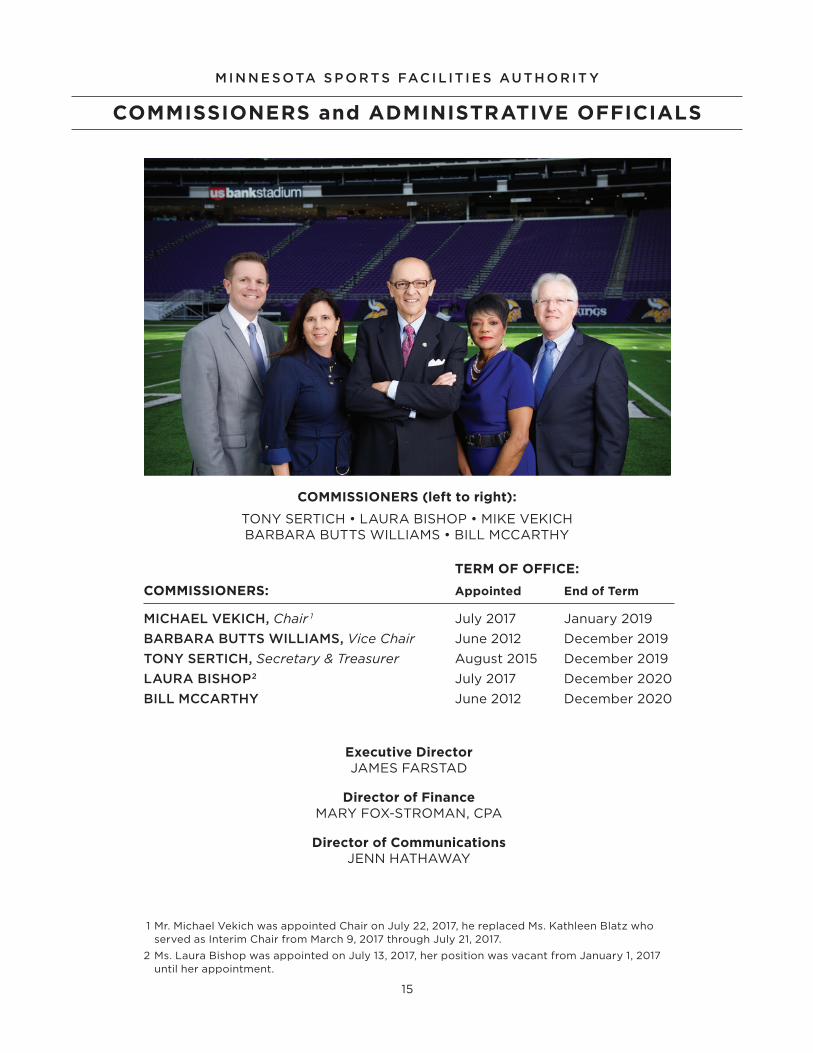
TERM OF OFFICE:
COMMISSIONERS: Appointed End of Term
MICHAEL VEKICH, Chair 1 July 2017 January 2019
BARBARA BUTTS WILLIAMS, Vice Chair June 2012 December 2019
TONY SERTICH, Secretary & Treasurer August 2015 December 2019
LAURA BISHOP2 July 2017 December 2020
BILL MCCARTHY June 2012 December 2020
Executive DirectorJAMES FARSTAD
Director of FinanceMARY FOX-STROMAN, CPA
Director of CommunicationsJENN HATHAWAY
1 Mr. Michael Vekich was appointed Chair on July 22, 2017, he replaced Ms. Kathleen Blatz who served as Interim Chair from March 9, 2017 through July 21, 2017.
2 Ms. Laura Bishop was appointed on July 13, 2017, her position was vacant from January 1, 2017 until her appointment.
COMMISSIONERS (left to right):
TONY SERTICH • LAURA BISHOP • MIKE VEKICH BARBARA BUTTS WILLIAMS • BILL MCCARTHY
COMMISSIONERS and ADMINISTRATIVE OFFICIALS
M I N N E S OTA S P O R T S FAC I L IT I E S AU T H O R IT Y
16
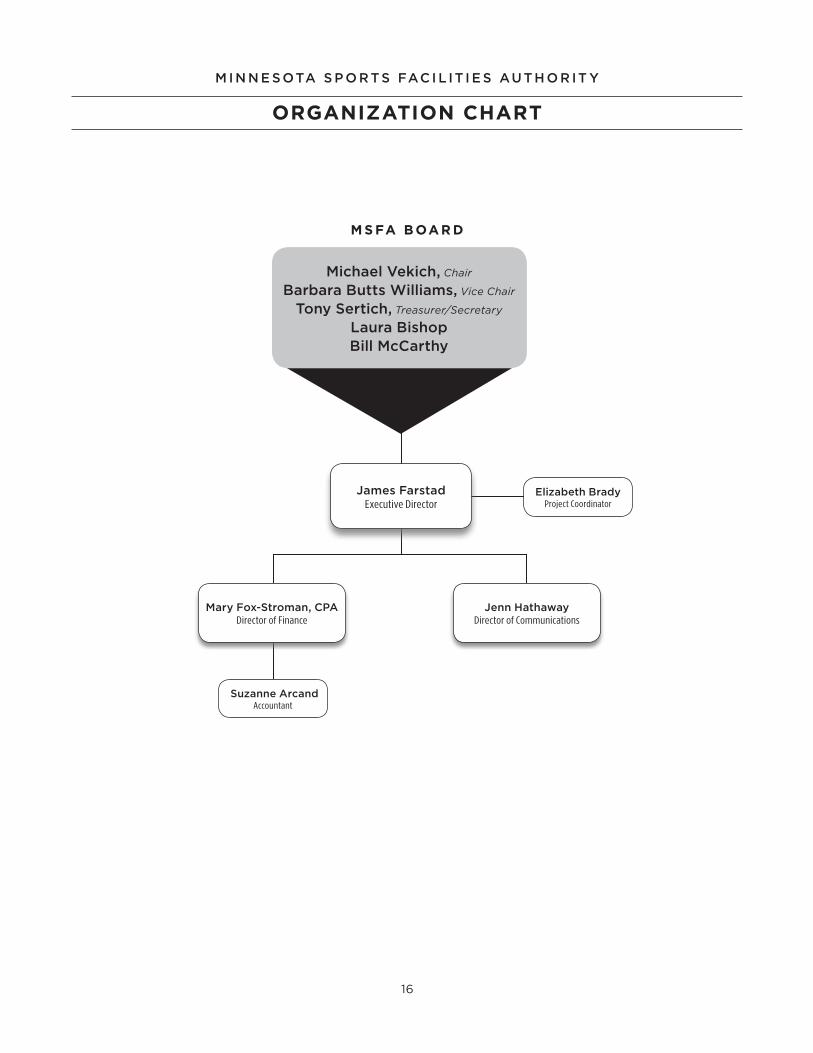
Michael Vekich, Chair
Barbara Butts Williams, Vice Chair
Tony Sertich, Treasurer/Secretary
Laura BishopBill McCarthy
Elizabeth BradyProject Coordinator
Jenn HathawayDirector of Communications
Mary Fox-Stroman, CPADirector of Finance
James FarstadExecutive Director
Suzanne ArcandAccountant
ORGANIZATION CHART
M I N N E S OTA S P O R T S FAC I L IT I E S AU T H O R IT Y
M S FA B OA R D
17
FINANCIAL SECTION
The Financial Section includes the independent auditors’ report,
management’s discussion and analysis, and the basic financial
statements including the notes to the financial statements, and
required supplementary information.
17
— A COMPONENT UNIT OF THE STATE OF MINNESOTA —
F O R T H E F I S C A L Y E A R E N D E D J U N E 3 0 , 2 0 1 8
COMPREHENSIVE ANNUAL FINANCIAL REPORT
MINNESOTA SPORTS FACILITIES AUTHORITY • MINNEAPOLIS, MINNESOTA

18
19
CliftonLarsonAllen LLPCLAconnect.com
INDEPENDENT AUDITORS’ REPORT
Board of Commissioners Minnesota Sports Facilities Authority Minneapolis, Minnesota Report on the Financial Statements We have audited the accompanying financial statements of the Minnesota Sports Facilities Authority, a component unit of the State of Minnesota, as of and for the year ended June 30, 2018, and the related notes to the financial statements, which collectively comprise the Minnesota Sports Facilities Authority’s basic financial statements as listed in the table of contents. Managementʼs Responsibility for the Financial Statements Management is responsible for the preparation and fair presentation of these financial statements in accordance with accounting principles generally accepted in the United States of America; this includes the design, implementation, and maintenance of internal control relevant to the preparation and fair presentation of financial statements that are free from material misstatement, whether due to fraud or error. Auditorsʼ Responsibility Our responsibility is to express opinions on these financial statements based on our audit. We conducted our audit in accordance with auditing standards generally accepted in the United States of America and the standards applicable to financial audits contained in Government Auditing Standards, issued by the Comptroller General of the United States. Those standards require that we plan and perform the audit to obtain reasonable assurance about whether the financial statements are free from material misstatement. An audit involves performing procedures to obtain audit evidence about the amounts and disclosures in the financial statements. The procedures selected depend on the auditors’ judgment, including the assessment of the risks of material misstatement of the financial statements, whether due to fraud or error. In making those risk assessments, the auditor considers internal control relevant to the entity’s preparation and fair presentation of the financial statements in order to design audit procedures that are appropriate in the circumstances, but not for the purpose of expressing an opinion on the effectiveness of the entity’s internal control. Accordingly, we express no such opinion. An audit also includes evaluating the appropriateness of accounting policies used and the reasonableness of significant accounting estimates made by management, as well as evaluating the overall presentation of the financial statements. We believe that the audit evidence we have obtained is sufficient and appropriate to provide a basis for our audit opinions.
20
Board of Commissioners Minnesota Sports Facilities Authority
OpinionsIn our opinion, the financial statements referred to above present fairly, in all material respects, the respective financial position the Minnesota Sports Facilities Authority as of June 30, 2018, and the respective changes in financial position and cash flows thereof for the year then ended in accordance with accounting principles generally accepted in the United States of America. Other Matters Required Supplementary Information Accounting principles generally accepted in the United States of America require that the management’s discussion and analysis, the schedule of the Authority’s share of the net pension liability – State Employees Retirement Fund, and the schedule of the Authority’s contributions – State Employees Retirement Fund, as listed in the table of contents be presented to supplement the basic financial statements. Such information, although not a part of the basic financial statements, is required by the Governmental Accounting Standards Board who considers it to be an essential part of financial reporting for placing the basic financial statements in an appropriate operational, economic, or historical context. We have applied certain limited procedures to the required supplementary information in accordance with auditing standards generally accepted in the United States of America, which consisted of inquiries of management about the methods of preparing the information and comparing the information for consistency with management’s responses to our inquiries, the basic financial statements, and other knowledge we obtained during our audit of the basic financial statements. We do not express an opinion or provide any assurance on the information because the limited procedures do not provide us with sufficient evidence to express an opinion or provide any assurance Other Information Our audit was conducted for the purpose of forming opinions on the financial statements that collectively comprise the Minnesota Sports Facilities Authority’s basic financial statements. The introductory and statistical sections are presented for purposes of additional analysis and are not a required part of the basic financial statements. They have not been subjected to the auditing procedures applied in the audit of the basic financial statements, and accordingly, we do not express an opinion or provide any assurance on it. Other Reporting Required by Government Auditing Standards In accordance with Government Auditing Standards, we have also issued our report dated November 26, 2018, on our consideration of the Minnesota Sports Facilities Authority’s internal control over financial reporting and on our tests of its compliance with certain provisions of laws, regulations, contracts, and grant agreements and other matters. The purpose of that report is solely to describe the scope of our testing of internal control over financial reporting and compliance and the results of that testing, and not to provide an opinion on the effectiveness of Minnesota Sports Facilities Authority’s internal control over financial reporting or on compliance. That report is an integral part of an audit performed in accordance with Government Auditing Standards in considering Minnesota Sports Facilities Authority’s internal control over financial reporting and compliance.
CliftonLarsonAllen LLP
Minneapolis, Minnesota November 26, 2018
21
MANAGEMENT’S DISCUSSION AND ANALYSIS
This section of the Minnesota Sports Facilities Authority (Authority) Comprehensive Annual Financial
Report (CAFR) presents a narrative overview and analysis of the Authority’s financial performance for
the fiscal year ended June 30, 2018. The intent of this discussion and analysis is to look at the Authority’s
financial performance as a whole. We encourage readers to consider the information presented here in
conjunction with additional information that we have furnished in our letter of transmittal.
Financial Highlights
The basic financial statements report information about the Authority using the economic resources
measurement focus and accrual basis of accounting. Key financial highlights for the Authority’s fiscal
year ended June 30, 2018 are as follows:
• Overall, the Authority’s net position decreased by $42,426,904, from $1,092,266,317 as of June 30,
2017 to $1,049,839,413 as of June 30, 2018.
• Operating expenses of $95,451,522 exceeded operating revenues of $44,896,992 which resulted
in an operating loss of $50,554,530 for the fiscal year ended June 30, 2018. The operating loss
is primarily due to depreciation expense of $50,459,104 which was the largest operating expense
during this fiscal year.
• Total capital assets increased by $4,358,148 from $1,142,499,482 as of June 30, 2017 to $1,146,857,630
as of June 30, 2018. This increase is due to capital and concession capital improvements, building,
building equipment, and equipment purchases.
Overview of the Financial Statements
This discussion and analysis is intended to serve as an introduction to the Authority’s basic financial
statements. The financial section of this report consists of:
(1) Independent Auditors’ Report
(2) Management’s Discussion and Analysis (presented here)
(3) Basic (Enterprise fund) Financial Statements:
a. Statement of net position
b. Statement of revenues, expenses, and changes in net position
c. Statement of cash flows
(4) Notes to the Financial Statements
This report also includes other required supplementary information in addition to the basic financial
statements.
The Authority uses fund accounting to ensure and demonstrate compliance with finance related legal
requirements. The Authority maintains one proprietary fund, an enterprise fund. The enterprise fund
financial statements report information about the Authority using accounting methods similar to
those used by private-sector businesses in which costs are recovered primarily through user charges.
Enterprise fund financial statements provide both short-term and long-term financial information
about the Authority’s overall financial status. The statements present information on the Authority’s
assets, deferred outflows of resources, liabilities, deferred inflows of resources and net position and
show how net position has changed during the year. These financial statements and explanatory notes
are prepared in conformance with generally accepted governmental accounting principles, and are
reported using the accrual basis of accounting.
22
Statement of net position
The statement of net position presents information on the financial resources and obligations of the
Authority on June 30, 2018. The difference between the sum of total assets and deferred outflows of
resources and the sum of total liabilities and deferred inflows of resources is net position. Over time,
increases or decreases in net position may serve as a useful indicator of whether the financial health of
the Authority is improving or deteriorating.
Statement of revenues, expenses and changes in net position
The statement of revenues, expenses and changes in net position presents information showing how
the Authority’s net position changed during the fiscal year ended June 30, 2018. All of the fiscal year’s
revenues and expenses are accounted for in this statement, regardless of when cash is received or paid.
Statement of cash flows
The statement of cash flows reports cash and cash equivalent activities for the fiscal year ended June
30, 2018 as a result of operating, noncapital financing, capital and investing activities.
Notes to the financial statements
The notes to the financial statements provide additional information that is essential to a full
understanding of the data provided in the enterprise fund financial statements.
Required Supplementary Information
The required supplementary information consists of two schedules, Schedule of the Authority’s Share
of Net Pension Liability State Employees Retirement Fund and Schedule of Authority’s Contributions
State Employees Retirement Fund.
Financial Analysis
Net position
The Authority’s net position decreased 3.9 percent to $1,049,839,413. The components of net position
are either restricted as to the purpose they can be used for or are invested in capital assets. The
largest portion of the Authority’s net position (99.5%) at June 30, 2018 reflects its investment in capital
assets of $1,044,474,586. These assets are comprised of land, construction in progress, buildings,
building equipment, land improvements, and equipment of U.S. Bank Stadium, Mills Fleet Farm Parking
Garage, and the Downtown East Parking Garage. Accordingly, these assets are not available for future
spending. The unrestricted component of net position showed a $628,667 deficit at the end of this
year. This deficit does not mean that the Authority does not have resources available to pay its bills
next year. Rather, it is the result of having long-term commitments that are greater than currently
available resources.
The deficit in unrestricted net position was adversely affected by two particular features of the
Authority’s financial activity:
• During the past two years, the Authority incurred costs related to construction completion that
were not funded by the project.
• The Authority incurred event costs related to Super Bowl LII.
23
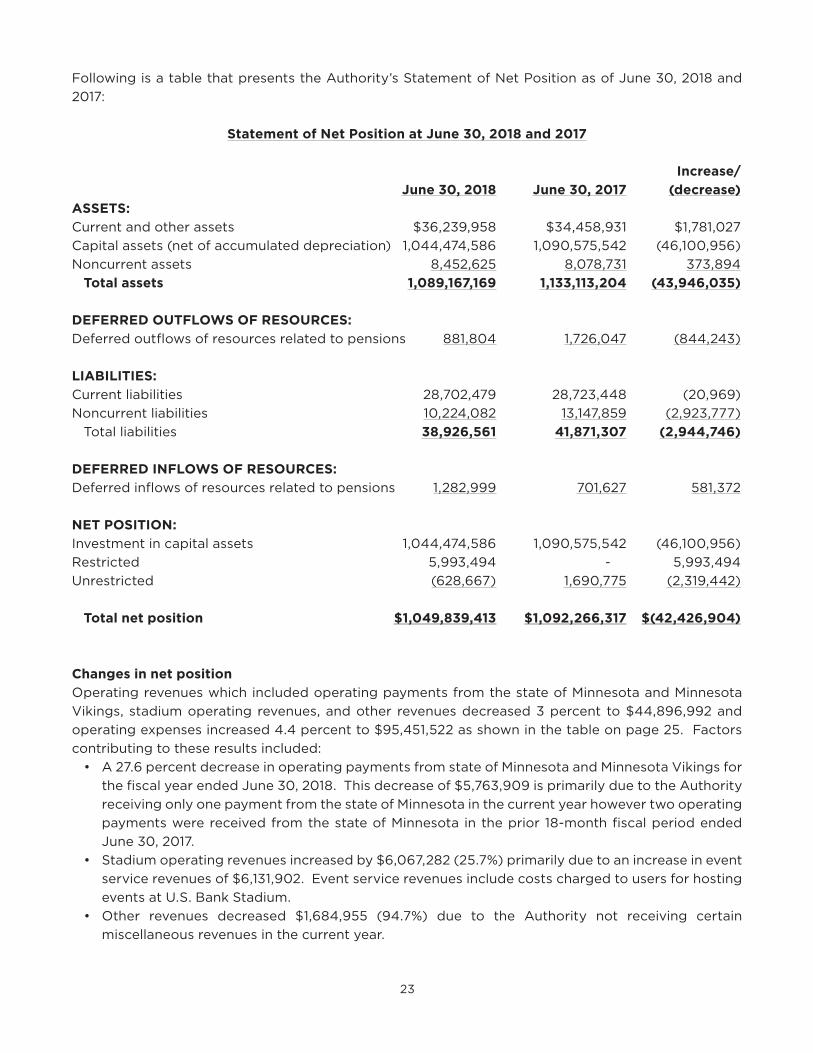
Following is a table that presents the Authority’s Statement of Net Position as of June 30, 2018 and
2017:
Statement of Net Position at June 30, 2018 and 2017
Increase/
June 30, 2018 June 30, 2017 (decrease)
ASSETS:
Current and other assets $36,239,958 $34,458,931 $1,781,027
Capital assets (net of accumulated depreciation) 1,044,474,586 1,090,575,542 (46,100,956)
Noncurrent assets 8,452,625 8,078,731 373,894
Total assets 1,089,167,169 1,133,113,204 (43,946,035)
DEFERRED OUTFLOWS OF RESOURCES:
Deferred outflows of resources related to pensions 881,804 1,726,047 (844,243)
LIABILITIES:
Current liabilities 28,702,479 28,723,448 (20,969)
Noncurrent liabilities 10,224,082 13,147,859 (2,923,777)
Total liabilities 38,926,561 41,871,307 (2,944,746)
DEFERRED INFLOWS OF RESOURCES:
Deferred inflows of resources related to pensions 1,282,999 701,627 581,372
NET POSITION:
Investment in capital assets 1,044,474,586 1,090,575,542 (46,100,956)
Restricted 5,993,494 - 5,993,494
Unrestricted (628,667) 1,690,775 (2,319,442)
Total net position $1,049,839,413 $1,092,266,317 $(42,426,904)
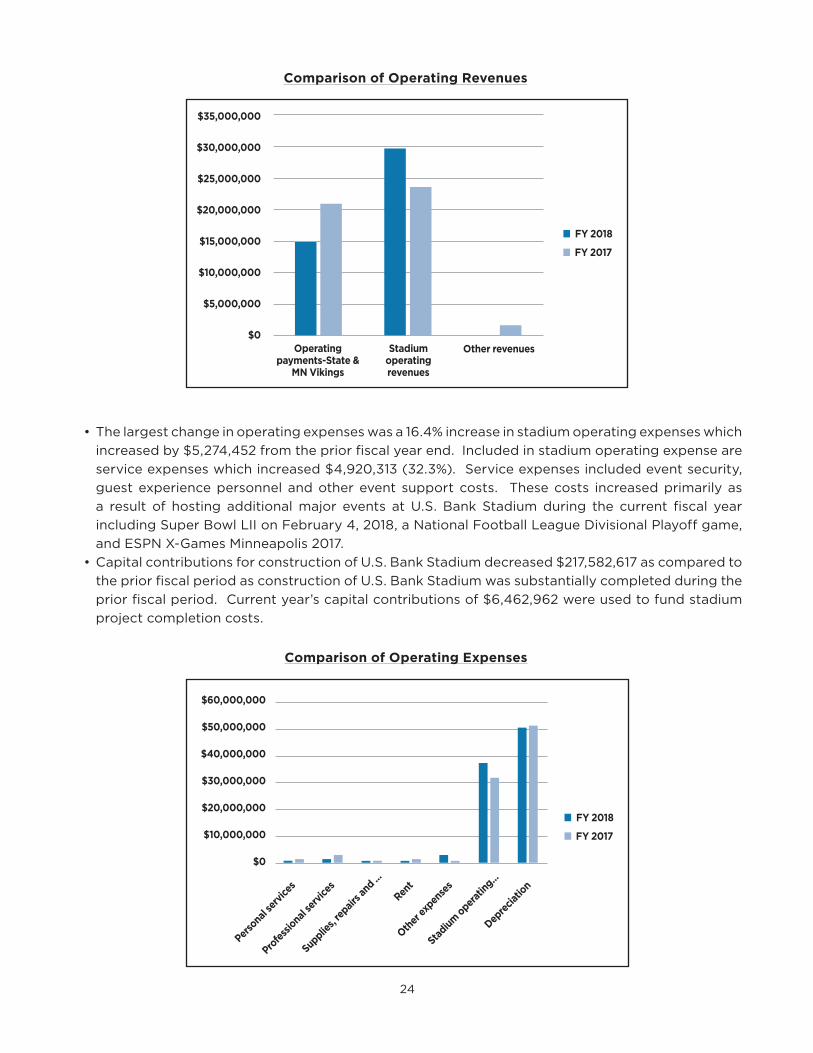
Changes in net position
Operating revenues which included operating payments from the state of Minnesota and Minnesota
Vikings, stadium operating revenues, and other revenues decreased 3 percent to $44,896,992 and
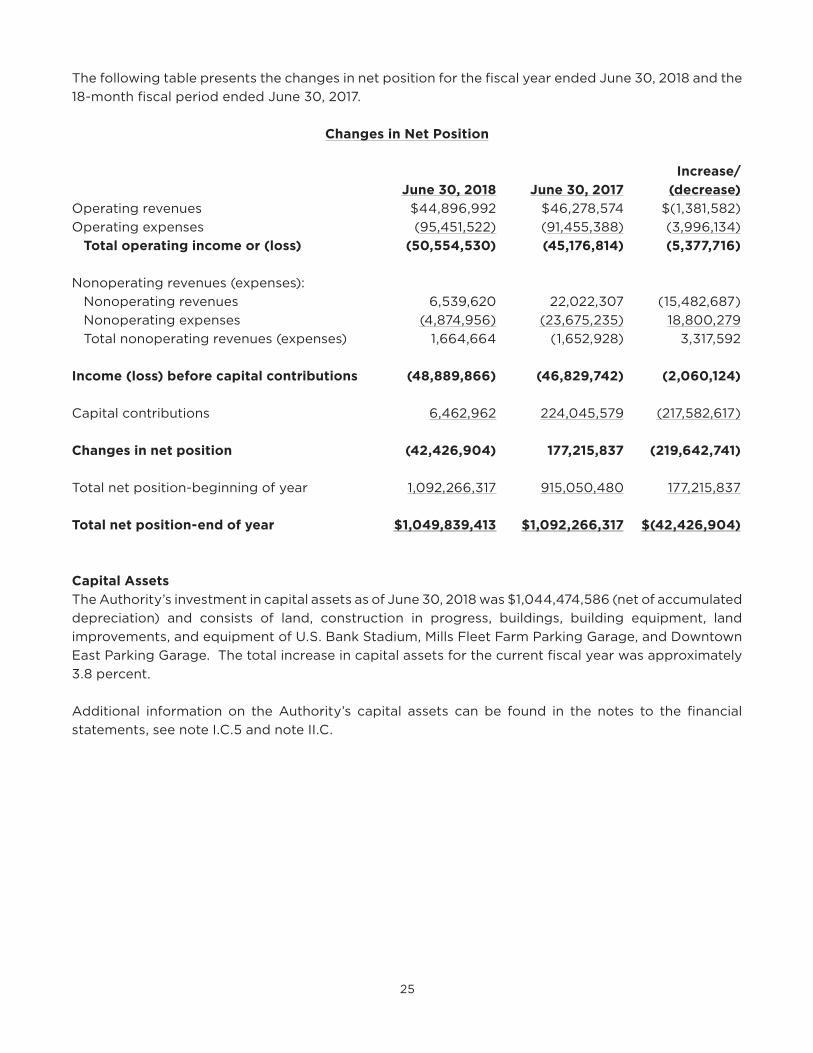
operating expenses increased 4.4 percent to $95,451,522 as shown in the table on page 25. Factors
contributing to these results included:
• A 27.6 percent decrease in operating payments from state of Minnesota and Minnesota Vikings for
the fiscal year ended June 30, 2018. This decrease of $5,763,909 is primarily due to the Authority
receiving only one payment from the state of Minnesota in the current year however two operating
payments were received from the state of Minnesota in the prior 18-month fiscal period ended
June 30, 2017.
• Stadium operating revenues increased by $6,067,282 (25.7%) primarily due to an increase in event
service revenues of $6,131,902. Event service revenues include costs charged to users for hosting
events at U.S. Bank Stadium.
• Other revenues decreased $1,684,955 (94.7%) due to the Authority not receiving certain
miscellaneous revenues in the current year.
24
• The largest change in operating expenses was a 16.4% increase in stadium operating expenses which
increased by $5,274,452 from the prior fiscal year end. Included in stadium operating expense are
service expenses which increased $4,920,313 (32.3%). Service expenses included event security,
guest experience personnel and other event support costs. These costs increased primarily as
a result of hosting additional major events at U.S. Bank Stadium during the current fiscal year
including Super Bowl LII on February 4, 2018, a National Football League Divisional Playoff game,
and ESPN X-Games Minneapolis 2017.
• Capital contributions for construction of U.S. Bank Stadium decreased $217,582,617 as compared to
the prior fiscal period as construction of U.S. Bank Stadium was substantially completed during the
prior fiscal period. Current year’s capital contributions of $6,462,962 were used to fund stadium
project completion costs.
Comparison of Operating Revenues
$35,000,000
$30,000,000
$25,000,000
$20,000,000
$15,000,000
$10,000,000
$5,000,000
$0Operating
payments-State & MN Vikings
Stadium operating revenues
Other revenues
n FY 2018
n FY 2017
Comparison of Operating Expenses
$60,000,000
$50,000,000
$40,000,000
$30,000,000
$20,000,000
$10,000,000
$0
Perso
nal s
ervic
es
Profe
ssio
nal s
ervic
es
Supplie
s, re
pairs a
nd ...
Rent
Other
expen
ses
Stad
ium
oper
atin
g...
Depre
ciatio
n
n FY 2018
n FY 2017
25
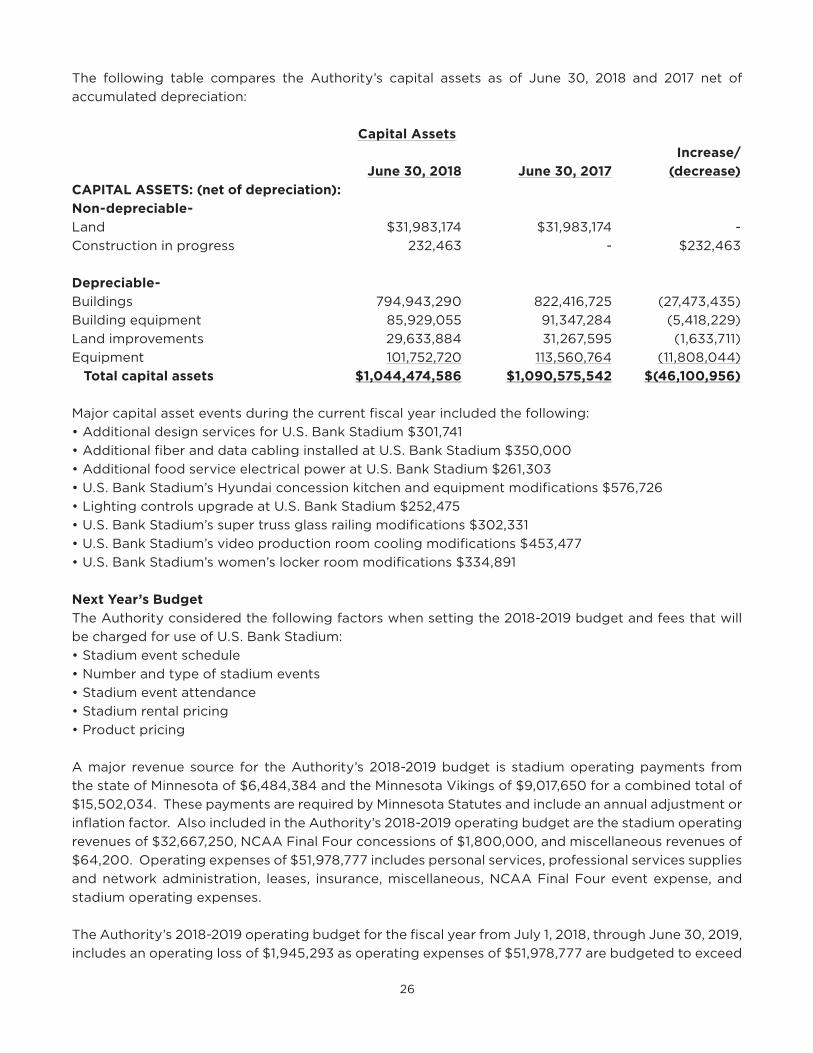
The following table presents the changes in net position for the fiscal year ended June 30, 2018 and the
18-month fiscal period ended June 30, 2017.
Changes in Net Position
Increase/
June 30, 2018 June 30, 2017 (decrease)
Operating revenues $44,896,992 $46,278,574 $(1,381,582)
Operating expenses (95,451,522) (91,455,388) (3,996,134)
Total operating income or (loss) (50,554,530) (45,176,814) (5,377,716)
Nonoperating revenues (expenses):
Nonoperating revenues 6,539,620 22,022,307 (15,482,687)
Nonoperating expenses (4,874,956) (23,675,235) 18,800,279
Total nonoperating revenues (expenses) 1,664,664 (1,652,928) 3,317,592
Income (loss) before capital contributions (48,889,866) (46,829,742) (2,060,124)
Capital contributions 6,462,962 224,045,579 (217,582,617)
Changes in net position (42,426,904) 177,215,837 (219,642,741)
Total net position-beginning of year 1,092,266,317 915,050,480 177,215,837
Total net position-end of year $1,049,839,413 $1,092,266,317 $(42,426,904)
Capital Assets
The Authority’s investment in capital assets as of June 30, 2018 was $1,044,474,586 (net of accumulated
depreciation) and consists of land, construction in progress, buildings, building equipment, land
improvements, and equipment of U.S. Bank Stadium, Mills Fleet Farm Parking Garage, and Downtown
East Parking Garage. The total increase in capital assets for the current fiscal year was approximately
3.8 percent.
Additional information on the Authority’s capital assets can be found in the notes to the financial
statements, see note I.C.5 and note II.C.
26
The following table compares the Authority’s capital assets as of June 30, 2018 and 2017 net of
accumulated depreciation:
Capital Assets
Increase/
June 30, 2018 June 30, 2017 (decrease)
CAPITAL ASSETS: (net of depreciation):
Non-depreciable-
Land $31,983,174 $31,983,174 -
Construction in progress 232,463 - $232,463
Depreciable-
Buildings 794,943,290 822,416,725 (27,473,435)
Building equipment 85,929,055 91,347,284 (5,418,229)
Land improvements 29,633,884 31,267,595 (1,633,711)
Equipment 101,752,720 113,560,764 (11,808,044)
Total capital assets $1,044,474,586 $1,090,575,542 $(46,100,956)
Major capital asset events during the current fiscal year included the following:
• Additional design services for U.S. Bank Stadium $301,741
• Additional fiber and data cabling installed at U.S. Bank Stadium $350,000
• Additional food service electrical power at U.S. Bank Stadium $261,303
• U.S. Bank Stadium’s Hyundai concession kitchen and equipment modifications $576,726
• Lighting controls upgrade at U.S. Bank Stadium $252,475
• U.S. Bank Stadium’s super truss glass railing modifications $302,331
• U.S. Bank Stadium’s video production room cooling modifications $453,477
• U.S. Bank Stadium’s women’s locker room modifications $334,891
Next Year’s Budget
The Authority considered the following factors when setting the 2018-2019 budget and fees that will
be charged for use of U.S. Bank Stadium:
• Stadium event schedule
• Number and type of stadium events
• Stadium event attendance
• Stadium rental pricing
• Product pricing
A major revenue source for the Authority’s 2018-2019 budget is stadium operating payments from
the state of Minnesota of $6,484,384 and the Minnesota Vikings of $9,017,650 for a combined total of
$15,502,034. These payments are required by Minnesota Statutes and include an annual adjustment or
inflation factor. Also included in the Authority’s 2018-2019 operating budget are the stadium operating
revenues of $32,667,250, NCAA Final Four concessions of $1,800,000, and miscellaneous revenues of
$64,200. Operating expenses of $51,978,777 includes personal services, professional services supplies
and network administration, leases, insurance, miscellaneous, NCAA Final Four event expense, and
stadium operating expenses.
The Authority’s 2018-2019 operating budget for the fiscal year from July 1, 2018, through June 30, 2019,
includes an operating loss of $1,945,293 as operating expenses of $51,978,777 are budgeted to exceed
27
operating revenues of $50,033,484. The expected loss is primarily due to expenses of $6,492,588 for
the NCAA Men’s Basketball Final Four 2019 event. This is a one-time cost to host this national event at
U.S. Bank Stadium. The Authority plans to use existing resources to fund the budgeted operating loss.
In addition to the 2018-2019 operating budget, the capital and concession capital budget includes
capital expenses of $8,912,963 and concession capital expenses of $1,085,055. These expenses will
be funded by capital revenues from the state of Minnesota and the Minnesota Vikings of $5,076,080
and the 2.5 percent concession capital reserve payment of $850,000. In addition the Authority plans
to transfer $1,000,000 from the operating account and use existing capital and concession capital
resources to fund the capital and concession capital expenses.
Requests for Information
This financial report is designed to provide a general overview of the Authority’s finances for all those
with an interest in its financial position and to demonstrate the Authority’s accountability for the
money it receives. Questions concerning any of the information provided in this report or requests
for additional information should be addressed to the Director of Finance, Minnesota Sports Facilities
Authority, 1005 Fourth Street South, Minneapolis, Minnesota 55415. This report may also be found on
the Authority’s website at www.msfa.com.
28
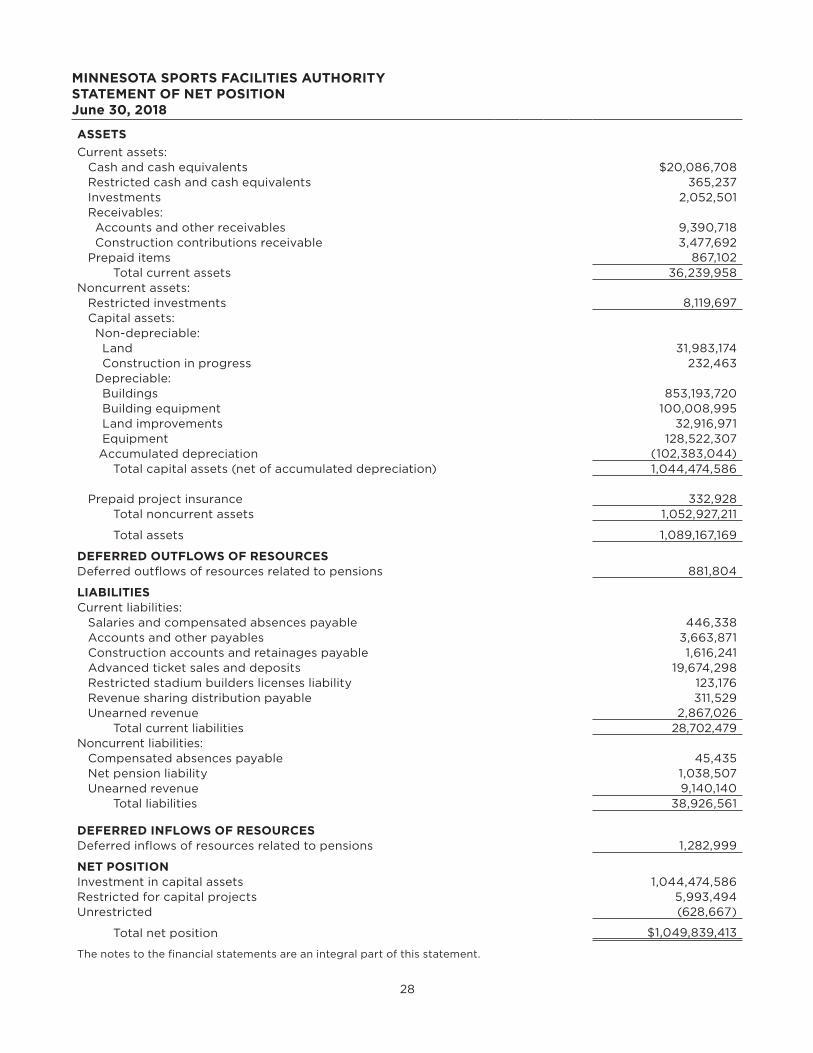
MINNESOTA SPORTS FACILITIES AUTHORITYSTATEMENT OF NET POSITION June 30, 2018
ASSETS
Current assets: Cash and cash equivalents $20,086,708 Restricted cash and cash equivalents 365,237 Investments 2,052,501 Receivables: Accounts and other receivables 9,390,718 Construction contributions receivable 3,477,692 Prepaid items 867,102 Total current assets 36,239,958 Noncurrent assets: Restricted investments 8,119,697 Capital assets: Non-depreciable: Land 31,983,174 Construction in progress 232,463 Depreciable: Buildings 853,193,720 Building equipment 100,008,995 Land improvements 32,916,971 Equipment 128,522,307 Accumulated depreciation (102,383,044) Total capital assets (net of accumulated depreciation) 1,044,474,586
Prepaid project insurance 332,928 Total noncurrent assets 1,052,927,211
Total assets 1,089,167,169
DEFERRED OUTFLOWS OF RESOURCESDeferred outflows of resources related to pensions 881,804
LIABILITIESCurrent liabilities: Salaries and compensated absences payable 446,338 Accounts and other payables 3,663,871 Construction accounts and retainages payable 1,616,241 Advanced ticket sales and deposits 19,674,298 Restricted stadium builders licenses liability 123,176 Revenue sharing distribution payable 311,529 Unearned revenue 2,867,026 Total current liabilities 28,702,479 Noncurrent liabilities: Compensated absences payable 45,435 Net pension liability 1,038,507 Unearned revenue 9,140,140 Total liabilities 38,926,561
DEFERRED INFLOWS OF RESOURCESDeferred inflows of resources related to pensions 1,282,999
NET POSITIONInvestment in capital assets 1,044,474,586 Restricted for capital projects 5,993,494 Unrestricted (628,667)
Total net position $1,049,839,413
The notes to the financial statements are an integral part of this statement.
29
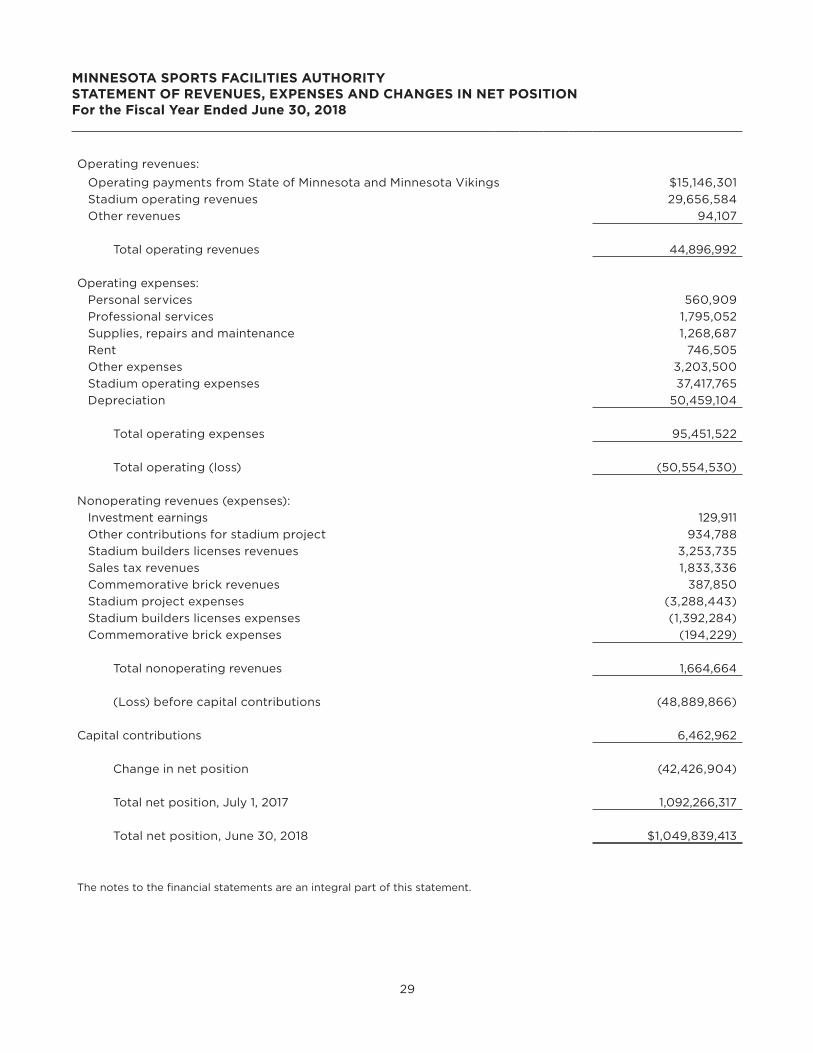
MINNESOTA SPORTS FACILITIES AUTHORITYSTATEMENT OF REVENUES, EXPENSES AND CHANGES IN NET POSITIONFor the Fiscal Year Ended June 30, 2018
Operating revenues:
Operating payments from State of Minnesota and Minnesota Vikings $15,146,301
Stadium operating revenues 29,656,584
Other revenues 94,107
Total operating revenues 44,896,992
Operating expenses:
Personal services 560,909
Professional services 1,795,052
Supplies, repairs and maintenance 1,268,687
Rent 746,505
Other expenses 3,203,500
Stadium operating expenses 37,417,765
Depreciation 50,459,104
Total operating expenses 95,451,522
Total operating (loss) (50,554,530)
Nonoperating revenues (expenses):
Investment earnings 129,911
Other contributions for stadium project 934,788
Stadium builders licenses revenues 3,253,735
Sales tax revenues 1,833,336
Commemorative brick revenues 387,850
Stadium project expenses (3,288,443)
Stadium builders licenses expenses (1,392,284)
Commemorative brick expenses (194,229)
Total nonoperating revenues 1,664,664
(Loss) before capital contributions (48,889,866)
Capital contributions 6,462,962
Change in net position (42,426,904)
Total net position, July 1, 2017 1,092,266,317
Total net position, June 30, 2018 $1,049,839,413
The notes to the financial statements are an integral part of this statement.
30
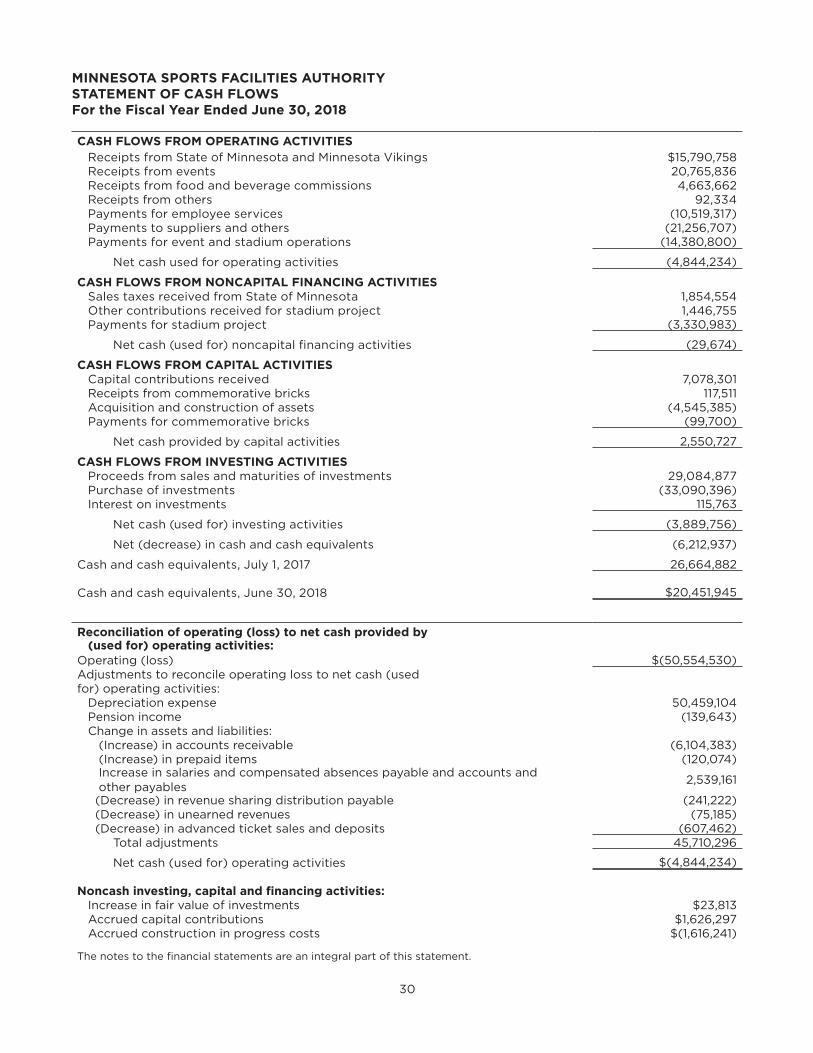
MINNESOTA SPORTS FACILITIES AUTHORITYSTATEMENT OF CASH FLOWS For the Fiscal Year Ended June 30, 2018
CASH FLOWS FROM OPERATING ACTIVITIES Receipts from State of Minnesota and Minnesota Vikings $15,790,758 Receipts from events 20,765,836 Receipts from food and beverage commissions 4,663,662 Receipts from others 92,334 Payments for employee services (10,519,317) Payments to suppliers and others (21,256,707) Payments for event and stadium operations (14,380,800)
Net cash used for operating activities (4,844,234)
CASH FLOWS FROM NONCAPITAL FINANCING ACTIVITIES Sales taxes received from State of Minnesota 1,854,554 Other contributions received for stadium project 1,446,755 Payments for stadium project (3,330,983)
Net cash (used for) noncapital financing activities (29,674)
CASH FLOWS FROM CAPITAL ACTIVITIES Capital contributions received 7,078,301 Receipts from commemorative bricks 117,511 Acquisition and construction of assets (4,545,385) Payments for commemorative bricks (99,700)
Net cash provided by capital activities 2,550,727
CASH FLOWS FROM INVESTING ACTIVITIES Proceeds from sales and maturities of investments 29,084,877 Purchase of investments (33,090,396) Interest on investments 115,763
Net cash (used for) investing activities (3,889,756)
Net (decrease) in cash and cash equivalents (6,212,937)
Cash and cash equivalents, July 1, 2017 26,664,882
Cash and cash equivalents, June 30, 2018 $20,451,945
Reconciliation of operating (loss) to net cash provided by (used for) operating activities:Operating (loss) $(50,554,530)Adjustments to reconcile operating loss to net cash (usedfor) operating activities: Depreciation expense 50,459,104 Pension income (139,643) Change in assets and liabilities: (Increase) in accounts receivable (6,104,383) (Increase) in prepaid items (120,074) Increase in salaries and compensated absences payable and accounts and
other payables 2,539,161
(Decrease) in revenue sharing distribution payable (241,222) (Decrease) in unearned revenues (75,185) (Decrease) in advanced ticket sales and deposits (607,462) Total adjustments 45,710,296
Net cash (used for) operating activities $(4,844,234)
Noncash investing, capital and financing activities: Increase in fair value of investments $23,813 Accrued capital contributions $1,626,297 Accrued construction in progress costs $(1,616,241)
The notes to the financial statements are an integral part of this statement.
31
MINNESOTA SPORTS FACILITIES AUTHORITY NOTES TO THE FINANCIAL STATEMENTS June 30, 2018
I. Summary of significant accounting policies
A. Organization and reporting entity
1. Organization
In May 2012, the Minnesota legislature enacted 2012 Minnesota Laws, Chapter 299 (codified at
Minnesota Statutes Chapter 473J) to establish the Minnesota Sports Facilities Authority (Authority).
The Authority is comprised of five board members: the chair and two members appointed by the
governor of Minnesota and two members appointed by the mayor of the city of Minneapolis. Members
serve four-year terms beginning January 1. The chair serves at the pleasure of the governor. The board
makes policies for the administration of the Authority and it appoints an executive director to act as
the administrative head of the Authority. The executive director serves at the pleasure of the board,
carries out the policies established by the board, directs business and administrative procedures, and
recommends personnel to be appointed by the board.
The Authority was created to provide for the construction, financing, and long-term operation of U.S.
Bank Stadium and the related stadium infrastructure as a venue for professional football and a broad
range of other civic, community, athletic, educational, cultural and commercial activities.
2. Financial reporting entity
As defined by U.S. generally accepted accounting principles (GAAP), the financial reporting entity
consists of a primary government, as well as its component units, which are legally separate organizations
for which the officials of the primary government are financially accountable. Financial accountability
is defined as:
a. Appointment of a voting majority of the component unit’s board and either (1) the ability to
impose will by the primary government or (2) the possibility that the component unit will provide
a financial benefit to or impose a financial burden on the primary government; or
b. Fiscal dependency on the primary government.
Based upon the application of these criteria, the Authority has no component units. However, the
Authority is a component unit of the state of Minnesota because the governor appoints three of the
five board members and the state of Minnesota is responsible for the debt incurred for the Authority’s
share of the cost of construction of the stadium and stadium infrastructure.
B. Basis of presentation and measurement focus
1. Basis of presentation
The financial statements of the Authority have been prepared in conformity with GAAP as applied to
government units in the United States of America. The Governmental Accounting Standards Board
(GASB) is the accepted primary standard-setting body for establishing governmental
32
MINNESOTA SPORTS FACILITIES AUTHORITY NOTES TO THE FINANCIAL STATEMENTS June 30, 2018
I. Summary of significant accounting policies (continued)
accounting and financial reporting principles. Significant accounting policies of the Authority are
described below.
The Authority reports its activities as a business-type activity. The operations of the Authority are
accounted for in an enterprise fund which is a set of self-balancing accounts comprised of assets,
deferred outflows of resources, liabilities, deferred inflows of resources, net position, revenues, and
expenses. The fund is used to account for the construction and operation of U.S. Bank Stadium and
related stadium infrastructure. The financial statements include a statement of net position, a statement
of revenues, expenses, and changes in net position, and a statement of cash flows. All assets, deferred
outflows of resources, liabilities (whether current or noncurrent), and deferred inflows of resources are
included on the statement of net position. Reported net position is segregated into three categories:
investment in capital assets, restricted, and unrestricted. The statement of revenues, expenses, and
changes in net position presents increases (revenues) and decreases (expenses) in total net position.
2. Measurement focus and basis of accounting
The Authority’s enterprise fund financial statements are reported using the economic resources
measurement focus and the accrual basis of accounting. Revenues are recorded when earned, and
expenses are recorded at the time liabilities are incurred, regardless of when the related cash flows take
place.
C. Assets, deferred outflows of resources, liabilities, deferred inflows of resources, and net position
1. Cash, cash equivalents and investments
The Authority has defined cash and cash equivalents as cash on hand, cash on deposit in demand deposit
accounts, commercial paper, and short-term investments with original maturities of three months or
less from the date of acquisition. Authority deposits are backed by a combination of Federal Deposit
Insurance Corporation (FDIC) and a letter of credit from Federal Home Loan Bank for the account of
U.S. Bank National Association, Cincinnati, Ohio for an amount of $3 million. The letter of credit is
irrevocable, unconditional, and nontransferable. Certain accounts are segregated and classified as
restricted and may not be used except in accordance with contractual terms.
The Authority may invest funds as authorized by Minnesota Statutes, Chapter 118A, and the Authority’s
internal investment policy. Investments are reported at fair value and are based on quoted market
prices.
2. Receivables
a. Accounts and other receivables
33
MINNESOTA SPORTS FACILITIES AUTHORITY NOTES TO THE FINANCIAL STATEMENTS June 30, 2018
I. Summary of significant accounting policies (continued)
Accounts and other receivables consist of estimates of amounts due for sales tax revenues, operating
payment from the Minnesota Vikings, commissions from the concessionaire, event revenues from
promoters, and ticket revenues and rebates.
b. Construction contributions receivable
Construction contributions receivable consist of amounts due to fund construction expenses that were
incurred prior to June 30, 2018.
3. Prepaid items
Certain payments to vendors reflect costs applicable to future accounting periods and are recorded as
prepaid items in the financial statement. Prepaid items include software and maintenance agreement
costs and insurance costs. The cost of prepaid items is recorded as an expense when consumed rather
than when purchased.
4. Prepaid project insurance
Prepaid project insurance consists of the prefunded loss reserve fund that was established at
construction inception. The insurance carrier for the owner controlled insurance program maintains
the loss reserve fund. Insurance costs are expensed when incurred.
5. Capital assets
Capital assets include land, construction in progress, buildings, building equipment, land improvements,
and equipment. Capital assets are defined by the Authority as assets with an individual or system cost
of $5,000 or more and an estimated useful life greater than three years. Such assets are recorded
at historical cost or estimated historical cost if purchased or constructed. Donated capital assets are
recorded at acquisition value at the date of donation. Costs of normal maintenance and repairs that do
not add to the value of the asset or materially extend asset lives are not capitalized.
Capital assets are depreciated over their estimated useful lives using the straight-line method. Land
and construction in progress are not depreciated. Estimated useful lives are as follows:
Capital assets Useful life
Buildings 20 - 30 years
Building equipment 5 - 20 years
Land improvements 20 - 30 years
Equipment 3 - 30 years
6. Liabilities
a. Salaries and compensated absences payable
Salaries and compensated absences payable includes salaries and benefits incurred and unpaid as of
June 30, 2018. The Authority accrues vacation and sick leave when earned. Certain employees qualify
for a vacation leave and a sick leave benefit paid at termination or retirement.
34
MINNESOTA SPORTS FACILITIES AUTHORITY NOTES TO THE FINANCIAL STATEMENTS June 30, 2018
I. Summary of significant accounting policies (continued)
The pay rate in effect at the end of the fiscal year and the employer’s share of social security contributions
are used to calculate compensated absences accruals at June 30.
b. Construction accounts and retainages payable
Construction accounts and retainages payable consist of costs incurred as of June 30, 2018 for stadium
construction. Construction retainages are released upon completion of the contractor’s work.
c. Advanced ticket sales and deposits
Revenues related to advance ticket sales for events that have not yet occurred are deferred until the
event has been held at U.S. Bank Stadium. U.S. Bank Stadium box office sells tickets through box
office sales, Ticketmaster sales, and consignment sales. Consignment sales consist of tickets pulled in
advance for the promoter. Consignment sales are considered advance ticket sales, as the promoter is
obligated to pay for the tickets at settlement which is after the event has occurred. Deposits represent
payments received from event organizers in advance of an event.
d. Restricted stadium builders licenses liability
Restricted stadium builders licenses liability consists of funds held at June 30, 2018 for the stadium
builders licenses program.
e. Revenue sharing distribution payable
As defined in the Management and Pre-Opening Agreement between the Authority and SMG, SMG is
entitled to share in U.S. Bank Stadium’s net operating income for the second year of operations that
exceeds $6,885,000. The revenue sharing amount accrued for the second year of operations was
$311,529. As of June 30, 2018 the revenue sharing distribution was unpaid.
f. Unearned revenues
Unearned revenues primarily consist of the unamortized amount of the capital investments from
Aramark, Minnesota Vikings, and SMG and revenues received from the Minnesota Vikings in advance
of the contractual time period.
7. Deferred outflows/inflows of resources
In addition to assets, the Statement of Net Position reports a separate section for deferred outflows
of resources. This separate financial statement element represents a consumption of net position that
applies to future periods and so will not be recognized as an outflow of resources (an expense) until
then. The amount recognized as deferred outflows of resources is related to pensions.
In addition to liabilities, the Statement of Net Position also reports a separate section for deferred
inflows of resources. This separate financial statement element represents an acquisition of net position
that applies to future periods and so will not be recognized as an inflow of resources
35
MINNESOTA SPORTS FACILITIES AUTHORITY NOTES TO THE FINANCIAL STATEMENTS June 30, 2018
I. Summary of significant accounting policies (continued)
(revenue) until that time. The amount recognized as deferred inflows of resources is related to pensions.
8. Net position
Net position represents the sum of total assets and deferred outflows of resources less the sum of total
liabilities and deferred inflows of resources. At June 30, 2018 the Authority had three categories of net
position, investment in capital assets, restricted and unrestricted.
• Investment in capital assets is the amount of net position representing capital assets net of
accumulated depreciation.
• Restricted net position represents resources that have external restrictions imposed by creditors,
grantors, contributors or laws or regulations of other governments or restrictions imposed by law
through constitutional provisions or enabling legislation. This category represents resources that
are restricted for future capital purchases.
• Unrestricted net position is the amount of net position that does not meet the definition of
restricted or investment in capital assets.
9. Revenues and expenses
a. Operating and nonoperating revenues and expenses
Enterprise funds distinguish operating revenues and expenses from nonoperating items. Operating
revenues and expenses generally result from providing services and producing and delivering goods in
connection with an enterprise fund’s principal ongoing operations. The principal operating revenues
of the Authority’s enterprise fund are: operating payments from the state of Minnesota and Minnesota
Vikings, stadium operating revenues, and other revenues. Stadium operating revenues include: rent,
service revenues, food and beverage, advertising, ticket rebates and facility fees, suite ticket sales,
merchandise sales, and other revenues.
Operating expenses include personal services, professional services, supplies, repairs and maintenance,
rent, other expenses, stadium operating expenses, and depreciation on capital assets. Stadium operating
expenses include operating and event expenses incurred by SMG to manage U.S. Bank Stadium
including service expenses, compensation and benefits, contract services, general and administrative,
operations, repairs and maintenance, insurance, utilities, and other expenses. All revenues and expenses
not meeting this definition and certain construction related activities are reported as nonoperating
revenues and expenses.
b. Other contributions for stadium project
Amounts reported as other contributions for the stadium project include contributions from the
Minnesota Vikings and private contributions. These contributions funded the non-capitalized stadium
construction expenses and are reported as nonoperating revenues.
36
MINNESOTA SPORTS FACILITIES AUTHORITY NOTES TO THE FINANCIAL STATEMENTS June 30, 2018
I. Summary of significant accounting policies (continued)
c. Stadium builders licenses revenues
Effective July 31, 2014, the Authority entered into an Amended and Restated Purchase and Sale
Agreement with Minnesota Stadium Funding Trust whereby the Authority agreed to sell its interest
in stadium builders licenses (SBL) tranches of SBL revenues to Minnesota Stadium Funding Trust
pursuant to SBL contracts. SBLs entitle the holder to buy season tickets to certain Minnesota Vikings
games held at U.S. Bank Stadium and for a certain seat in the stadium. The Authority has recognized a
receivable and revenue in accordance with GASB Statement No. 48, “Sales and Pledges of Receivables
and Future Revenues and Intra-Entity Transfer of Assets and Future Revenues,” as the transaction
qualifies as a sale of receivables. Revenue was recognized as proceeds were received for the purpose
of funding stadium construction costs and for costs associated with the sales of SBLs.
The total SBL tranches to be sold based on the SBL program as stated in the agreement is $125 million.
As of June 30, 2018 SBL tranches of $125 million had been sold, of that amount $100 million was used
to fund stadium construction project costs and $25 million was used to fund other expenses. These
revenues are reported as nonoperating revenues.
d. Sales tax revenues
In accordance with Minnesota Statutes, 16A.726(b) and 297A.994, Subd.4.(5)(i) and (ii), a portion
of the city of Minneapolis sales tax collections, are for the benefit of the Authority. Amounts are
recognized as revenue by the Authority in the year the sales taxes are imposed on the underlying
exchange transaction by the city of Minneapolis. The state of Minnesota withholds a portion of the
Minneapolis sales tax disbursement to the city and issues the payment to the Authority. These revenues
are reported as nonoperating revenues.
II. Detailed notes
A. Cash deposits with financial institutions
Minnesota Statutes, Chapter 118A, require that all Authority deposits in excess of available federal
deposit insurance be protected by a corporate surety bond or collateral security. An irrevocable
standby letter of credit issued by a Federal Home Loan Bank is an allowable form of collateral. The
statute further requires the total amount of collateral computed at its fair market value shall be at
least ten percent more than the amount on deposit at the close of the financial institution’s banking
day, except for irrevocable standby letters of credit, the amount of collateral shall be at least equal
to the amount on deposit at the close of the financial institution’s banking day. At June 30, 2018, the
carrying amount of the Authority’s combined demand deposit bank accounts was $18,501,081. Bank
balances were $19,471,068 of which $19,464,558 was invested in commercial paper, and $6,510 was
covered by federal depository insurance. At June 30, 2018 the balance in the money markets account
was $567,493 and the balance in the trust accounts was $1,013,310.
37
MINNESOTA SPORTS FACILITIES AUTHORITY NOTES TO THE FINANCIAL STATEMENTS June 30, 2018
II. Detailed notes (continued)
At June 30, 2018, the carrying amount of the Authority’s restricted cash demand deposit accounts was
$365,237. Bank balances were $365,237 which was partially covered by federal depository insurance
and the balance was collateralized by the letter of credit described in the above paragraph. The
difference between carrying amount and bank balance generally results from checks outstanding and
deposits in transit at June 30, 2018.
B. Cash equivalent investments
The Authority’s investment policy addresses certain risks to which it is currently exposed as follows:
Interest rate risk. Interest rate risk is the risk that changes in interest rates of debt investments will
adversely affect the fair value of an investment. Although the Authority does not have a formal
specific duration investment risk policy, it does have a formal investment policy by which the Authority
manages its exposure to declines in fair value. To meet short-term cash flow needs, the Authority’s
investment portfolio will remain sufficiently liquid to enable the Authority to meet anticipated cash
requirements without the occurrence of significant investment losses. To meet long-term needs, the
average duration of the investment portfolio should match the average duration of liabilities subject
to regulatory requirements. The Authority’s investments in commercial paper have a maturity not to
exceed 270 days.
Credit risk. Credit risk is the risk that an issuer or other counterparty to an investment will not fulfill
its obligations. Investment instruments purchased by the Authority must comply with Minnesota
Statutes, Chapter 118A, and its investment policy which is more restrictive than state law. The
Authority’s investment policy limits investments to the following: money market funds, savings/
demand deposits, bankers acceptances, commercial paper, U.S. Treasury Obligations, U.S. Agency
Securities Government Sponsored Enterprises (GSE), Municipal Securities, Repurchase Agreements,
and Guaranteed Investment Contracts. It is the Authority’s policy not to invest in inverse floaters, range
notes, interest only strips derived from a pool of mortgages, and any security that could result in a zero
interest accrual if held to maturity. The Authority’s investments in commercial paper were in a U.S.
corporation that was rated in the highest quality category and had maturities of less than 270 days.
Concentration of credit risk. Concentration of credit risk is the risk associated with investing a significant
portion of investments in the securities of a single issuer, excluding U.S. Guaranteed investments,
investment pools, and mutual funds. The Authority’s investments in commercial paper are in a single
U.S. corporation.
Custodial credit risk. The custodial credit risk for deposits is the risk that in the event of the failure of
a depository financial institution, then the Authority will not be able to recover deposits or will not be
able to recover collateral securities that are in the possession of an outside party. The custodial credit
38
MINNESOTA SPORTS FACILITIES AUTHORITY NOTES TO THE FINANCIAL STATEMENTS June 30, 2018
II. Detailed notes (continued)
risk for investments is the risk that in the event of the failure of the counter party to a transaction, the
Authority will not be able to recover the value of its investments or collateral securities that are in the
possession of an outside party. Minnesota Statutes, Chapter 118A, require that deposits be secured
by depository insurance or a combination of depository insurance and collateral securities held in
the Authority’s name. Throughout the current fiscal year, the combined depository insurance and
collateral was sufficient to meet legal requirements and secure all Authority deposits, thus eliminating
exposure to custodial credit risk.
The Authority had no foreign currency exposure at June 30, 2018.
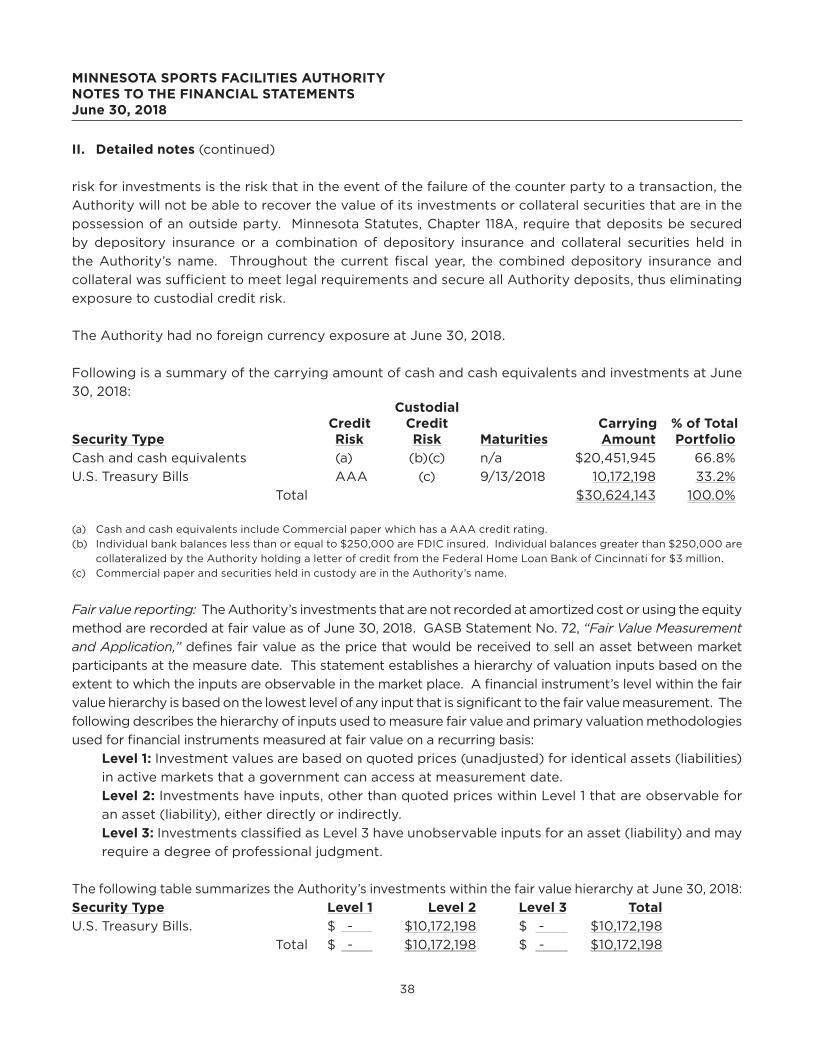
Following is a summary of the carrying amount of cash and cash equivalents and investments at June
30, 2018: Custodial Credit Credit Carrying % of TotalSecurity Type Risk Risk Maturities Amount Portfolio
Cash and cash equivalents (a) (b)(c) n/a $20,451,945 66.8%
U.S. Treasury Bills AAA (c) 9/13/2018 10,172,198 33.2%
Total $30,624,143 100.0%
(a) Cash and cash equivalents include Commercial paper which has a AAA credit rating.
(b) Individual bank balances less than or equal to $250,000 are FDIC insured. Individual balances greater than $250,000 are
collateralized by the Authority holding a letter of credit from the Federal Home Loan Bank of Cincinnati for $3 million.
(c) Commercial paper and securities held in custody are in the Authority’s name.
Fair value reporting: The Authority’s investments that are not recorded at amortized cost or using the equity
method are recorded at fair value as of June 30, 2018. GASB Statement No. 72, “Fair Value Measurement
and Application,” defines fair value as the price that would be received to sell an asset between market
participants at the measure date. This statement establishes a hierarchy of valuation inputs based on the
extent to which the inputs are observable in the market place. A financial instrument’s level within the fair
value hierarchy is based on the lowest level of any input that is significant to the fair value measurement. The
following describes the hierarchy of inputs used to measure fair value and primary valuation methodologies
used for financial instruments measured at fair value on a recurring basis:
Level 1: Investment values are based on quoted prices (unadjusted) for identical assets (liabilities)
in active markets that a government can access at measurement date.
Level 2: Investments have inputs, other than quoted prices within Level 1 that are observable for
an asset (liability), either directly or indirectly.
Level 3: Investments classified as Level 3 have unobservable inputs for an asset (liability) and may
require a degree of professional judgment.
The following table summarizes the Authority’s investments within the fair value hierarchy at June 30, 2018:
Security Type Level 1 Level 2 Level 3 Total
U.S. Treasury Bills. $ - $10,172,198 $ - $10,172,198
Total $ - $10,172,198 $ - $10,172,198
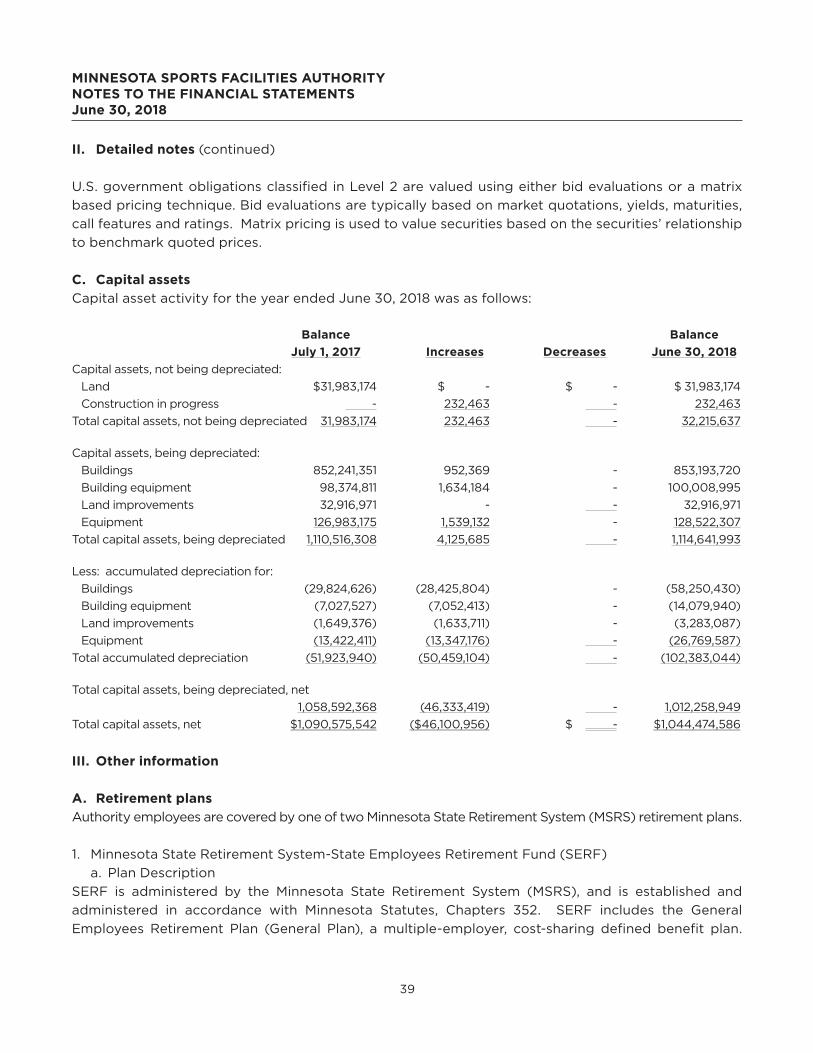
39
MINNESOTA SPORTS FACILITIES AUTHORITY NOTES TO THE FINANCIAL STATEMENTS June 30, 2018
II. Detailed notes (continued)
U.S. government obligations classified in Level 2 are valued using either bid evaluations or a matrix
based pricing technique. Bid evaluations are typically based on market quotations, yields, maturities,
call features and ratings. Matrix pricing is used to value securities based on the securities’ relationship
to benchmark quoted prices.
C. Capital assets
Capital asset activity for the year ended June 30, 2018 was as follows:
Balance Balance
July 1, 2017 Increases Decreases June 30, 2018
Capital assets, not being depreciated:
Land $31,983,174 $ - $ - $ 31,983,174
Construction in progress - 232,463 - 232,463
Total capital assets, not being depreciated 31,983,174 232,463 - 32,215,637
Capital assets, being depreciated:
Buildings 852,241,351 952,369 - 853,193,720
Building equipment 98,374,811 1,634,184 - 100,008,995
Land improvements 32,916,971 - - 32,916,971
Equipment 126,983,175 1,539,132 - 128,522,307
Total capital assets, being depreciated 1,110,516,308 4,125,685 - 1,114,641,993
Less: accumulated depreciation for:
Buildings (29,824,626) (28,425,804) - (58,250,430)
Building equipment (7,027,527) (7,052,413) - (14,079,940)
Land improvements (1,649,376) (1,633,711) - (3,283,087)
Equipment (13,422,411) (13,347,176) - (26,769,587)
Total accumulated depreciation (51,923,940) (50,459,104) - (102,383,044)
Total capital assets, being depreciated, net
1,058,592,368 (46,333,419) - 1,012,258,949
Total capital assets, net $1,090,575,542 ($46,100,956) $ - $1,044,474,586
III. Other information
A. Retirement plans
Authority employees are covered by one of two Minnesota State Retirement System (MSRS) retirement plans.
1. Minnesota State Retirement System-State Employees Retirement Fund (SERF)
a. Plan Description
SERF is administered by the Minnesota State Retirement System (MSRS), and is established and
administered in accordance with Minnesota Statutes, Chapters 352. SERF includes the General
Employees Retirement Plan (General Plan), a multiple-employer, cost-sharing defined benefit plan.
40
MINNESOTA SPORTS FACILITIES AUTHORITY NOTES TO THE FINANCIAL STATEMENTS June 30, 2018
III. Other information (Continued)
Certain employees of the Authority are covered by the General Plan. The General Plan provides
retirement, disability, and death benefits to plan members and their beneficiaries.
Minnesota Statutes, Section 352.04 requires that eligible employees contribute 5.5 percent of their
total compensation to the fund. Participating employers are also required to contribute 5.5 percent
to this fund. The Authority’s contribution to the General Plan for the year ended June 30, 2018 was
$20,216. These contributions were equal to the contractually required contributions for each year as set
by state statute. All active and deferred members are fully vested to the extent of their contributions
plus interest at a rate of 6.0 percent through June 30, 2011, and 4.0 percent thereafter. For monthly
retirement benefits, members hired before July 1, 2010, are vested after three years of covered service;
members hired after June 30, 2010, are vested after five years of covered service. MSRS issues a
publicly available financial report that may be obtained at www.msrs.state.mn.us/financial-information;
by writing to Minnesota State Retirement System, 60 Empire Drive, #300, St Paul, Minnesota 55103 or
by calling (651) 296-2761 or 1-800-657-5757.
b. Benefits provided
Retirement benefits can be computed using one of two methods: the Step formula and the Level
formula. Members hired before July 1, 1989, may use the Step or Level formula, whichever is greater.
Members hired on or after July 1, 1989, must use the Level formula. Each formula converts years and
months of service to a certain percentage. Under the Step formula, members receive 1.2 percent of the
high-five average salary for each of the first 10 years of covered service, plus 1.7 percent for each year
thereafter. It also includes full benefits under the Rule of 90 (age plus years of allowable service equals
90). In contrast, the Level formula does not include the Rule of 90. Under the Level formula, members
receive 1.7 percent of the high-five average salary for all years of covered service, and full benefits are
available at normal retirement age.
Annuitants receive post-retirement increases of 2.0 percent each year. When the SERF reaches or
exceeds a 90 percent funded ratio for two consecutive years (determined on a market value of assets
basis), the post-retirement adjustment will increase to 2.5 percent each year. If, after reverting to a
2.5 percent increase, the funded ratio declines to less than 80 percent for the most recent actuarial
valuation year, or 85 percent for two consecutive years, the post-retirement benefit increase will return
to 2.0 percent. The funding status of the SERF is actuarially calculated on an annual basis.
c. Pension liabilities, pension expense and Deferred Outflows of Resources and Deferred Inflows of
Resources Related to Pensions
At June 30, 2018, the Authority reported a liability of $1,038,507 for its proportionate share of MSRS’
net pension liability. The net pension liability was measured at June 30, 2017, and the total pension
liability used to calculate the net pension liability was determined by an actuarial valuation as of that
date. The Authority’s proportion of the net pension liability was based on the contributions received by
MSRS during the measurement period July 1, 2016, through June 30, 2017, relative to the total employer
contributions received from all of MSRS’ participating employers. At June 30, 2017 the Authority’s
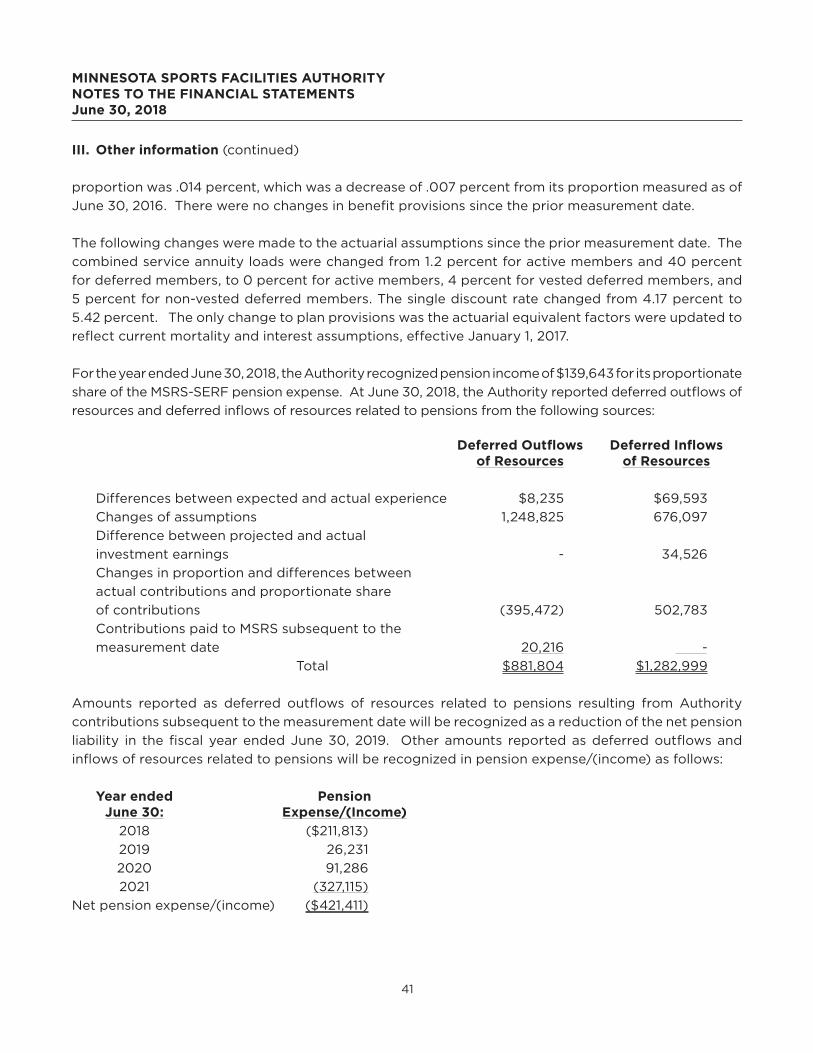
41
MINNESOTA SPORTS FACILITIES AUTHORITY NOTES TO THE FINANCIAL STATEMENTS June 30, 2018
III. Other information (continued)
proportion was .014 percent, which was a decrease of .007 percent from its proportion measured as of
June 30, 2016. There were no changes in benefit provisions since the prior measurement date.
The following changes were made to the actuarial assumptions since the prior measurement date. The
combined service annuity loads were changed from 1.2 percent for active members and 40 percent
for deferred members, to 0 percent for active members, 4 percent for vested deferred members, and
5 percent for non-vested deferred members. The single discount rate changed from 4.17 percent to
5.42 percent. The only change to plan provisions was the actuarial equivalent factors were updated to
reflect current mortality and interest assumptions, effective January 1, 2017.
For the year ended June 30, 2018, the Authority recognized pension income of $139,643 for its proportionate
share of the MSRS-SERF pension expense. At June 30, 2018, the Authority reported deferred outflows of
resources and deferred inflows of resources related to pensions from the following sources:
Deferred Outflows Deferred Inflows of Resources of Resources
Differences between expected and actual experience $8,235 $69,593
Changes of assumptions 1,248,825 676,097
Difference between projected and actual
investment earnings - 34,526
Changes in proportion and differences between
actual contributions and proportionate share
of contributions (395,472) 502,783
Contributions paid to MSRS subsequent to the
measurement date 20,216 -
Total $881,804 $1,282,999
Amounts reported as deferred outflows of resources related to pensions resulting from Authority
contributions subsequent to the measurement date will be recognized as a reduction of the net pension
liability in the fiscal year ended June 30, 2019. Other amounts reported as deferred outflows and
inflows of resources related to pensions will be recognized in pension expense/(income) as follows:
Year ended Pension June 30: Expense/(Income)
2018 ($211,813)
2019 26,231
2020 91,286
2021 (327,115)
Net pension expense/(income) ($421,411)
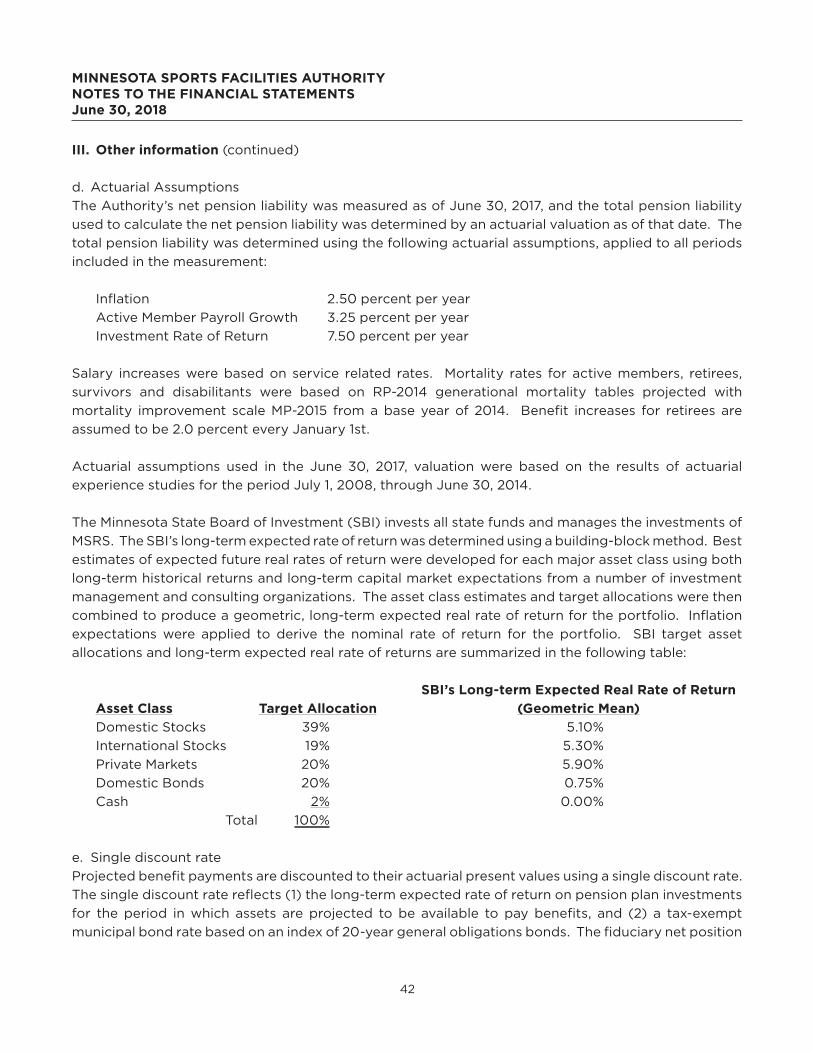
42
MINNESOTA SPORTS FACILITIES AUTHORITY NOTES TO THE FINANCIAL STATEMENTS June 30, 2018
III. Other information (continued)
d. Actuarial Assumptions
The Authority’s net pension liability was measured as of June 30, 2017, and the total pension liability
used to calculate the net pension liability was determined by an actuarial valuation as of that date. The
total pension liability was determined using the following actuarial assumptions, applied to all periods
included in the measurement:
Inflation 2.50 percent per year
Active Member Payroll Growth 3.25 percent per year
Investment Rate of Return 7.50 percent per year
Salary increases were based on service related rates. Mortality rates for active members, retirees,
survivors and disabilitants were based on RP-2014 generational mortality tables projected with
mortality improvement scale MP-2015 from a base year of 2014. Benefit increases for retirees are
assumed to be 2.0 percent every January 1st.
Actuarial assumptions used in the June 30, 2017, valuation were based on the results of actuarial
experience studies for the period July 1, 2008, through June 30, 2014.
The Minnesota State Board of Investment (SBI) invests all state funds and manages the investments of
MSRS. The SBI’s long-term expected rate of return was determined using a building-block method. Best
estimates of expected future real rates of return were developed for each major asset class using both
long-term historical returns and long-term capital market expectations from a number of investment
management and consulting organizations. The asset class estimates and target allocations were then
combined to produce a geometric, long-term expected real rate of return for the portfolio. Inflation
expectations were applied to derive the nominal rate of return for the portfolio. SBI target asset
allocations and long-term expected real rate of returns are summarized in the following table:
SBI’s Long-term Expected Real Rate of Return
Asset Class Target Allocation (Geometric Mean)
Domestic Stocks 39% 5.10%
International Stocks 19% 5.30%
Private Markets 20% 5.90%
Domestic Bonds 20% 0.75%
Cash 2% 0.00%
Total 100%
e. Single discount rate
Projected benefit payments are discounted to their actuarial present values using a single discount rate.
The single discount rate reflects (1) the long-term expected rate of return on pension plan investments
for the period in which assets are projected to be available to pay benefits, and (2) a tax-exempt
municipal bond rate based on an index of 20-year general obligations bonds. The fiduciary net position
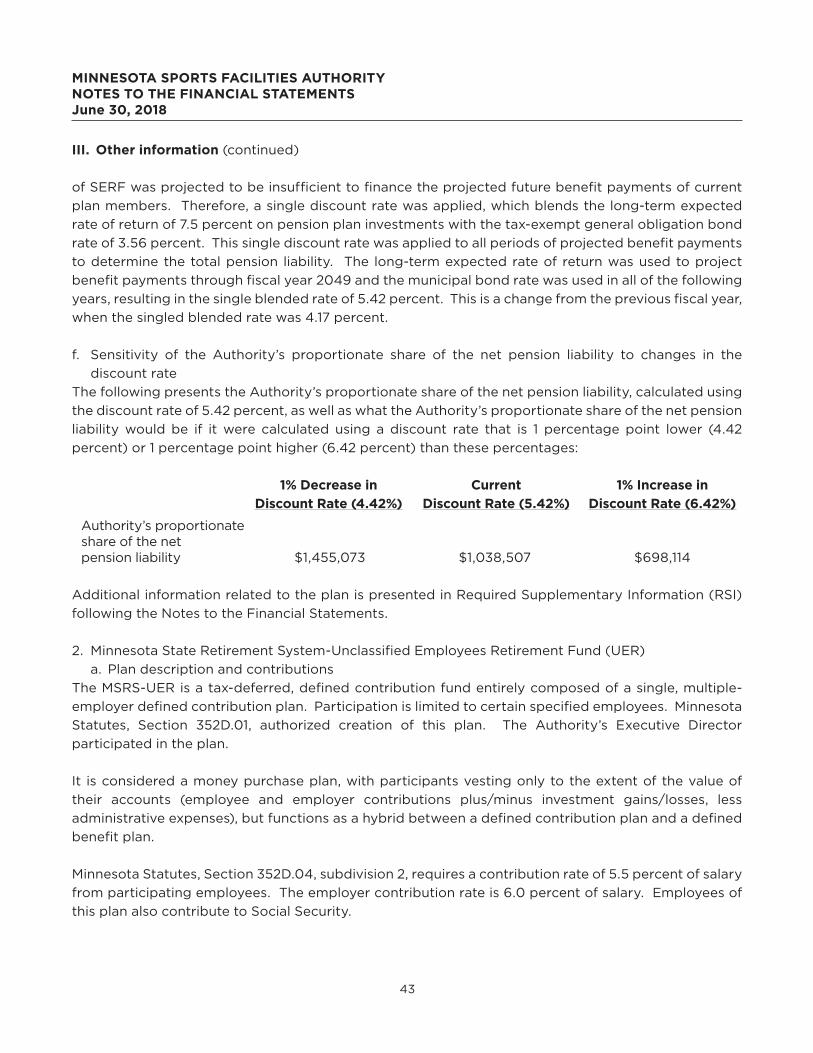
43
MINNESOTA SPORTS FACILITIES AUTHORITY NOTES TO THE FINANCIAL STATEMENTS June 30, 2018
III. Other information (continued)
of SERF was projected to be insufficient to finance the projected future benefit payments of current
plan members. Therefore, a single discount rate was applied, which blends the long-term expected
rate of return of 7.5 percent on pension plan investments with the tax-exempt general obligation bond
rate of 3.56 percent. This single discount rate was applied to all periods of projected benefit payments
to determine the total pension liability. The long-term expected rate of return was used to project
benefit payments through fiscal year 2049 and the municipal bond rate was used in all of the following
years, resulting in the single blended rate of 5.42 percent. This is a change from the previous fiscal year,
when the singled blended rate was 4.17 percent.
f. Sensitivity of the Authority’s proportionate share of the net pension liability to changes in the
discount rate
The following presents the Authority’s proportionate share of the net pension liability, calculated using
the discount rate of 5.42 percent, as well as what the Authority’s proportionate share of the net pension
liability would be if it were calculated using a discount rate that is 1 percentage point lower (4.42
percent) or 1 percentage point higher (6.42 percent) than these percentages:
1% Decrease in Current 1% Increase in
Discount Rate (4.42%) Discount Rate (5.42%) Discount Rate (6.42%)
Authority’s proportionate share of the net pension liability $1,455,073 $1,038,507 $698,114
Additional information related to the plan is presented in Required Supplementary Information (RSI)
following the Notes to the Financial Statements.
2. Minnesota State Retirement System-Unclassified Employees Retirement Fund (UER)
a. Plan description and contributions
The MSRS-UER is a tax-deferred, defined contribution fund entirely composed of a single, multiple-
employer defined contribution plan. Participation is limited to certain specified employees. Minnesota
Statutes, Section 352D.01, authorized creation of this plan. The Authority’s Executive Director
participated in the plan.
It is considered a money purchase plan, with participants vesting only to the extent of the value of
their accounts (employee and employer contributions plus/minus investment gains/losses, less
administrative expenses), but functions as a hybrid between a defined contribution plan and a defined
benefit plan.
Minnesota Statutes, Section 352D.04, subdivision 2, requires a contribution rate of 5.5 percent of salary
from participating employees. The employer contribution rate is 6.0 percent of salary. Employees of
this plan also contribute to Social Security.
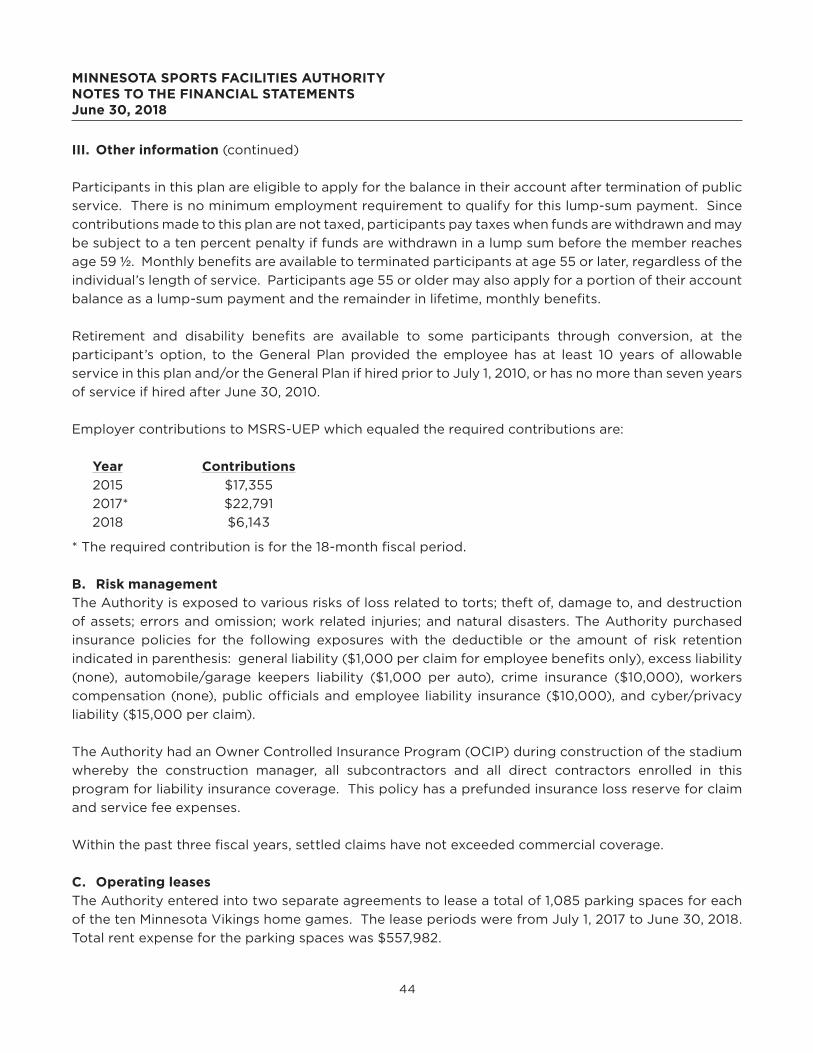
44
MINNESOTA SPORTS FACILITIES AUTHORITY NOTES TO THE FINANCIAL STATEMENTS June 30, 2018
III. Other information (continued)
Participants in this plan are eligible to apply for the balance in their account after termination of public
service. There is no minimum employment requirement to qualify for this lump-sum payment. Since
contributions made to this plan are not taxed, participants pay taxes when funds are withdrawn and may
be subject to a ten percent penalty if funds are withdrawn in a lump sum before the member reaches
age 59 ½. Monthly benefits are available to terminated participants at age 55 or later, regardless of the
individual’s length of service. Participants age 55 or older may also apply for a portion of their account
balance as a lump-sum payment and the remainder in lifetime, monthly benefits.
Retirement and disability benefits are available to some participants through conversion, at the
participant’s option, to the General Plan provided the employee has at least 10 years of allowable
service in this plan and/or the General Plan if hired prior to July 1, 2010, or has no more than seven years
of service if hired after June 30, 2010.
Employer contributions to MSRS-UEP which equaled the required contributions are:
Year Contributions
2015 $17,355
2017* $22,791
2018 $6,143
* The required contribution is for the 18-month fiscal period.
B. Risk management
The Authority is exposed to various risks of loss related to torts; theft of, damage to, and destruction
of assets; errors and omission; work related injuries; and natural disasters. The Authority purchased
insurance policies for the following exposures with the deductible or the amount of risk retention
indicated in parenthesis: general liability ($1,000 per claim for employee benefits only), excess liability
(none), automobile/garage keepers liability ($1,000 per auto), crime insurance ($10,000), workers
compensation (none), public officials and employee liability insurance ($10,000), and cyber/privacy
liability ($15,000 per claim).
The Authority had an Owner Controlled Insurance Program (OCIP) during construction of the stadium
whereby the construction manager, all subcontractors and all direct contractors enrolled in this
program for liability insurance coverage. This policy has a prefunded insurance loss reserve for claim
and service fee expenses.
Within the past three fiscal years, settled claims have not exceeded commercial coverage.
C. Operating leases
The Authority entered into two separate agreements to lease a total of 1,085 parking spaces for each
of the ten Minnesota Vikings home games. The lease periods were from July 1, 2017 to June 30, 2018.
Total rent expense for the parking spaces was $557,982.
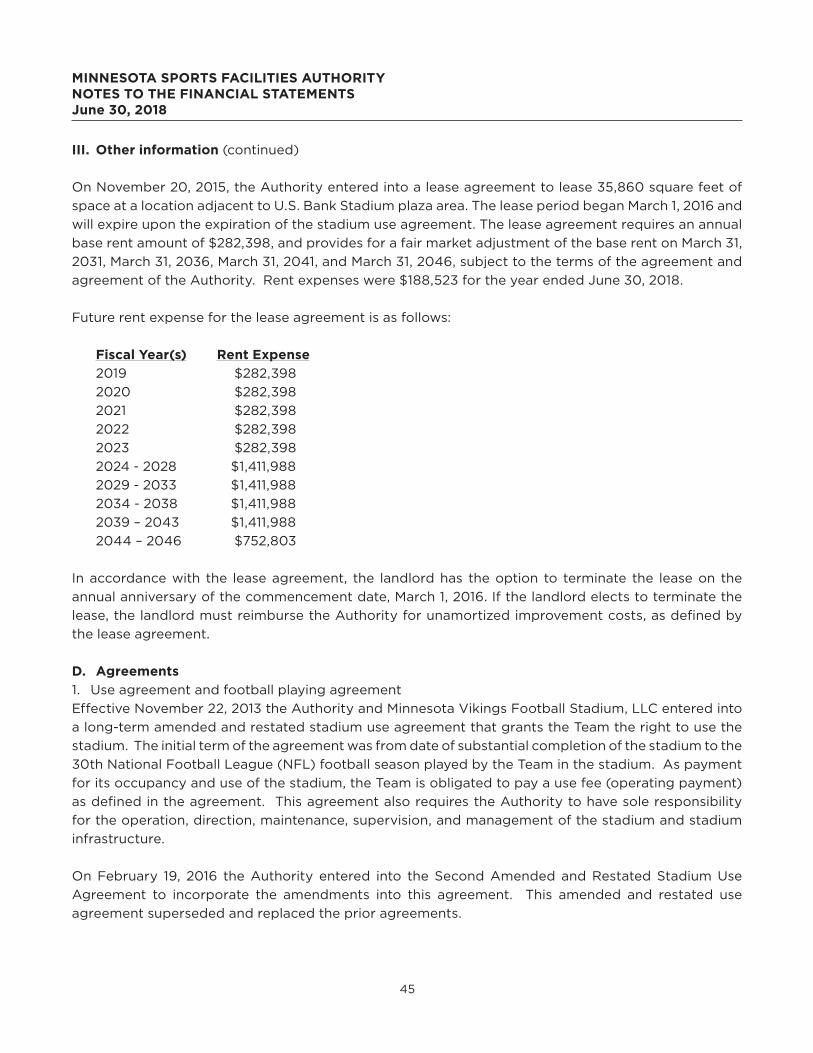
45
MINNESOTA SPORTS FACILITIES AUTHORITY NOTES TO THE FINANCIAL STATEMENTS June 30, 2018
III. Other information (continued)
On November 20, 2015, the Authority entered into a lease agreement to lease 35,860 square feet of
space at a location adjacent to U.S. Bank Stadium plaza area. The lease period began March 1, 2016 and
will expire upon the expiration of the stadium use agreement. The lease agreement requires an annual
base rent amount of $282,398, and provides for a fair market adjustment of the base rent on March 31,
2031, March 31, 2036, March 31, 2041, and March 31, 2046, subject to the terms of the agreement and
agreement of the Authority. Rent expenses were $188,523 for the year ended June 30, 2018.
Future rent expense for the lease agreement is as follows:
Fiscal Year(s) Rent Expense
2019 $282,398
2020 $282,398
2021 $282,398
2022 $282,398
2023 $282,398
2024 - 2028 $1,411,988
2029 - 2033 $1,411,988
2034 - 2038 $1,411,988
2039 – 2043 $1,411,988
2044 – 2046 $752,803
In accordance with the lease agreement, the landlord has the option to terminate the lease on the
annual anniversary of the commencement date, March 1, 2016. If the landlord elects to terminate the
lease, the landlord must reimburse the Authority for unamortized improvement costs, as defined by
the lease agreement.
D. Agreements
1. Use agreement and football playing agreement
Effective November 22, 2013 the Authority and Minnesota Vikings Football Stadium, LLC entered into
a long-term amended and restated stadium use agreement that grants the Team the right to use the
stadium. The initial term of the agreement was from date of substantial completion of the stadium to the
30th National Football League (NFL) football season played by the Team in the stadium. As payment
for its occupancy and use of the stadium, the Team is obligated to pay a use fee (operating payment)
as defined in the agreement. This agreement also requires the Authority to have sole responsibility
for the operation, direction, maintenance, supervision, and management of the stadium and stadium
infrastructure.
On February 19, 2016 the Authority entered into the Second Amended and Restated Stadium Use
Agreement to incorporate the amendments into this agreement. This amended and restated use
agreement superseded and replaced the prior agreements.
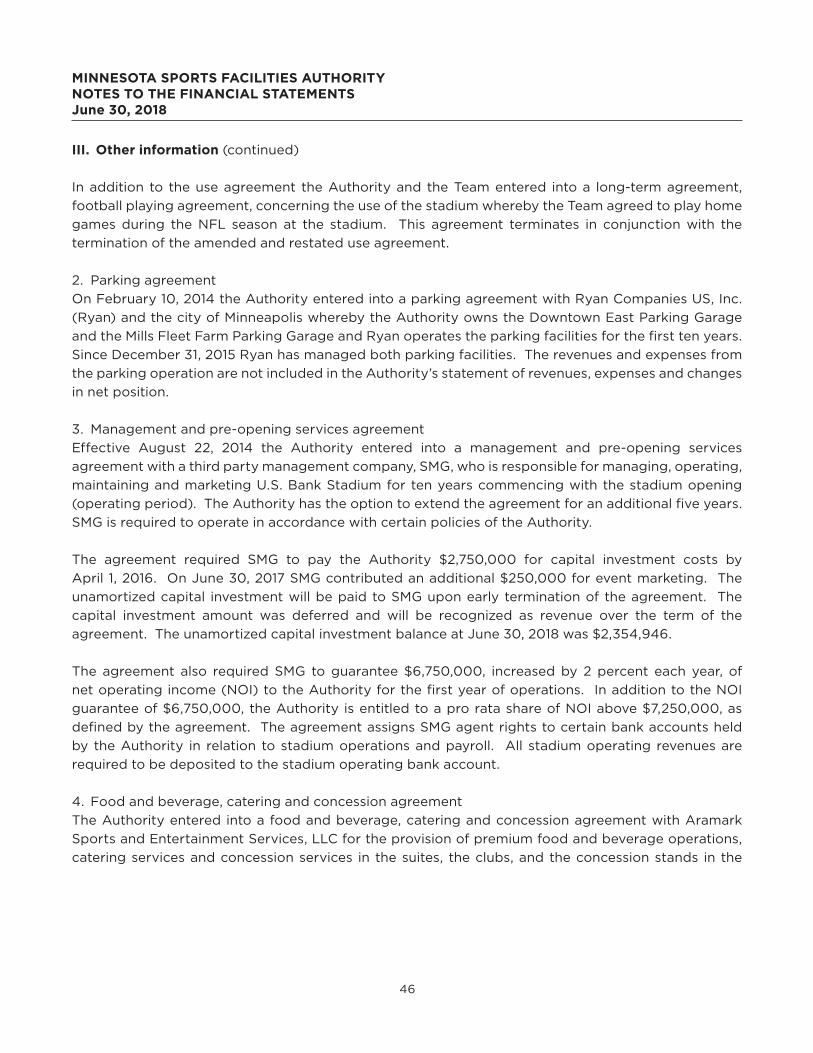
46
MINNESOTA SPORTS FACILITIES AUTHORITY NOTES TO THE FINANCIAL STATEMENTS June 30, 2018
III. Other information (continued)
In addition to the use agreement the Authority and the Team entered into a long-term agreement,
football playing agreement, concerning the use of the stadium whereby the Team agreed to play home
games during the NFL season at the stadium. This agreement terminates in conjunction with the
termination of the amended and restated use agreement.
2. Parking agreement
On February 10, 2014 the Authority entered into a parking agreement with Ryan Companies US, Inc.
(Ryan) and the city of Minneapolis whereby the Authority owns the Downtown East Parking Garage
and the Mills Fleet Farm Parking Garage and Ryan operates the parking facilities for the first ten years.
Since December 31, 2015 Ryan has managed both parking facilities. The revenues and expenses from
the parking operation are not included in the Authority’s statement of revenues, expenses and changes
in net position.
3. Management and pre-opening services agreement
Effective August 22, 2014 the Authority entered into a management and pre-opening services
agreement with a third party management company, SMG, who is responsible for managing, operating,
maintaining and marketing U.S. Bank Stadium for ten years commencing with the stadium opening
(operating period). The Authority has the option to extend the agreement for an additional five years.
SMG is required to operate in accordance with certain policies of the Authority.
The agreement required SMG to pay the Authority $2,750,000 for capital investment costs by
April 1, 2016. On June 30, 2017 SMG contributed an additional $250,000 for event marketing. The
unamortized capital investment will be paid to SMG upon early termination of the agreement. The
capital investment amount was deferred and will be recognized as revenue over the term of the
agreement. The unamortized capital investment balance at June 30, 2018 was $2,354,946.
The agreement also required SMG to guarantee $6,750,000, increased by 2 percent each year, of
net operating income (NOI) to the Authority for the first year of operations. In addition to the NOI
guarantee of $6,750,000, the Authority is entitled to a pro rata share of NOI above $7,250,000, as
defined by the agreement. The agreement assigns SMG agent rights to certain bank accounts held
by the Authority in relation to stadium operations and payroll. All stadium operating revenues are
required to be deposited to the stadium operating bank account.
4. Food and beverage, catering and concession agreement
The Authority entered into a food and beverage, catering and concession agreement with Aramark
Sports and Entertainment Services, LLC for the provision of premium food and beverage operations,
catering services and concession services in the suites, the clubs, and the concession stands in the
47
MINNESOTA SPORTS FACILITIES AUTHORITY NOTES TO THE FINANCIAL STATEMENTS June 30, 2018
III. Other information (continued)
concourses and on the plaza. The ten-year agreement has a designated commission option which
established the commission rates that would be paid by Aramark and it provided an option for the
Minnesota Vikings to contribute to the required $10 million capital investment. The Minnesota Vikings
chose the option to contribute $6.5 million to the capital investment, Aramark then contributed $3.5
million in February 2016 to the capital investment. This capital investment was a stadium project funding
source for the purchase of concession equipment. The total capital investment of $10 million was
deferred and will be recognized as revenue over the 10-year term of the agreement. The unamortized
capital investment will be paid to the Minnesota Vikings and Aramark upon early termination of this
agreement. The unamortized capital investment balance at June 30, 2018 was $8,088,710.
In addition to payment of commissions for food and beverage, catering and concession sales, Aramark
is required to pay 2.5 percent of gross receipts to the Authority for deposit into the concession capital
reserve account for future purchases.
5. Commemorative bricks agreement
The Authority entered into an agreement with Fund Raisers, Ltd. (Fund Raisers) whereby they
managed the sales and manufacture of commemorative bricks and the shipment of specially engraved
commemorative bricks, replications of commemorative bricks, and display cases. The Authority was
responsible for the installation of the commemorative bricks and maintenance and cleaning of the
commemorative bricks after installation.
A second selling phase began November 17, 2016 and continued through March 31, 2017. The Authority
recognizes revenues and expenses in accordance with GASB Statement No. 33, “Accounting and Financial
Reporting for Nonexchange Transactions,” as the transactions qualify as voluntary nonexchange
transactions. Revenues and costs for the sale of the commemorative bricks were recognized when
installation was completed at which point the contingency criterion was met. Revenues and costs
related to the sale of replication commemorative bricks and display cases are recognized in the month
the product is shipped to the customer. These revenues and expenses are reported as nonoperating.
The first $1,600,000 of net proceeds from the sale of commemorative bricks has been restricted by
the stadium development agreement for plaza improvements. Any net proceeds from the sale of
commemorative bricks in excess of $1,600,000 are designated to the stadium plaza improvements
budget. Based on this restriction, cash related to the sale of commemorative bricks is shown as
restricted assets on the statement of net position for the year ended June 30, 2018.
48
MINNESOTA SPORTS FACILITIES AUTHORITY NOTES TO THE FINANCIAL STATEMENTS June 30, 2018
III. Other information (continued)
E. Construction commitments and contingencies
Construction on the stadium project began in 2013 and continued until June 17, 2016, the date of
substantial completion of U.S. Bank Stadium. Since that date construction closeout tasks have
continued through June 30, 2018.
The Authority had two construction contracts that had commitments at June 30, 2018:
Spent to Date Remaining Commitment
Architectural and engineering services $ 41,926,321 $ 97,505
Construction management services $898,169,913 $11,452,487
The Authority did not accrue a liability for the outstanding issues and claims related to the design and
construction of U.S. Bank Stadium as it is not probable that a liability had been incurred as of June 30,
2018 and the amount of the liability could not be reasonably estimated.
The Authority is contingently liable with respect to lawsuits and other claims that arise in the ordinary
course of its operations. Although the outcome of these matters is not presently determinable, in the
opinion of the Authority’s management, the resolution of these matters will not have a material adverse
effect on the Authority’s financial condition.
49
MINNESOTA SPORTS FACILITIES AUTHORITYSCHEDULES OF REQUIRED SUPPLEMENTARY INFORMATIONLast 10 Years1
Schedule of the Authority’s Share of Net Pension Liability State Employees Retirement Fund
2014 2015 2016 2017
Authority's Proportion of the Net Pension Liability 0.051% 0.033% 0.021% 0.014%
Authority's Proportionate Share of the Net Pension Liability
$ 827,002 $ 507,998 $2,603,765 $1,038,507
Authority's Covered Payroll $1,303,478 $ 874,171 $ 563,727 $ 383,628
Authority's Proportionate Share of the Net Pension Liability as a Percentage of its Covered Payroll
63.45% 58.11% 461.88% 270.71%
Plan Fiduciary Net Position as a Percentage of the Total Pension Liability
87.64% 88.32% 47.51% 62.73%
The measurement date is June 30 of each year.
1 This schedule is intended to show information for 10 years. Additional years will be displayed as they become available.
2 The amounts presented for each fiscal year were determined as of June 30.
Schedule of Authority's ContributionsState Employees Retirement Fund
2014 2015 2017 2018
Contractually Required Contribution $ 48,519 $ 40,403 $ 36,066 $ 20,216
Contributions in Relation to the Contractually Required Contribution
$ 48,519 $ 40,403 $ 36,066 $ 20,216
Contribution Deficiency (excess) $ - $ - $ - $ -
Authority's Covered Payroll $928,080 $ 735,734 $ 638,223 $ 367,562
Contributions as a Percentage of Covered Payroll 5.23% 5.49% 5.65% 5.50%
1 This schedule is intended to show information for 10 years. Additional years will be displayed as they become available.
2 The amounts presented for 2014 and 2015 were determined as of December 31.
3 The amounts presented for 2017 are for the 18-month fiscal period from January 1, 2016 through June 30, 2017.
4 The amounts presented for 2018 were determined as of June 30.

50
51
STATISTICAL SECTION
The Statistical Section provides financial statement users with
additional historical perspective, context, and detail to assist in
using the information in the financial statements, including the
accompanying notes.
51
— A COMPONENT UNIT OF THE STATE OF MINNESOTA —
F O R T H E F I S C A L Y E A R E N D E D J U N E 3 0 , 2 0 1 8
COMPREHENSIVE ANNUAL FINANCIAL REPORT
MINNESOTA SPORTS FACILITIES AUTHORITY • MINNEAPOLIS, MINNESOTA
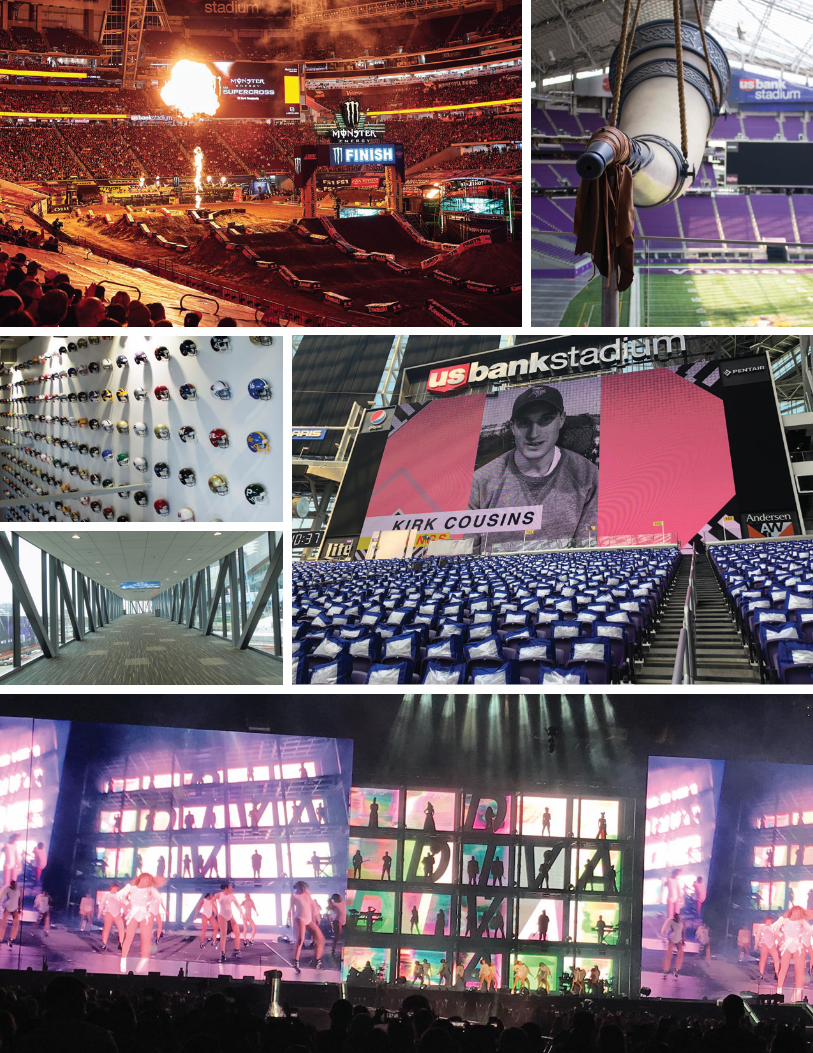
52
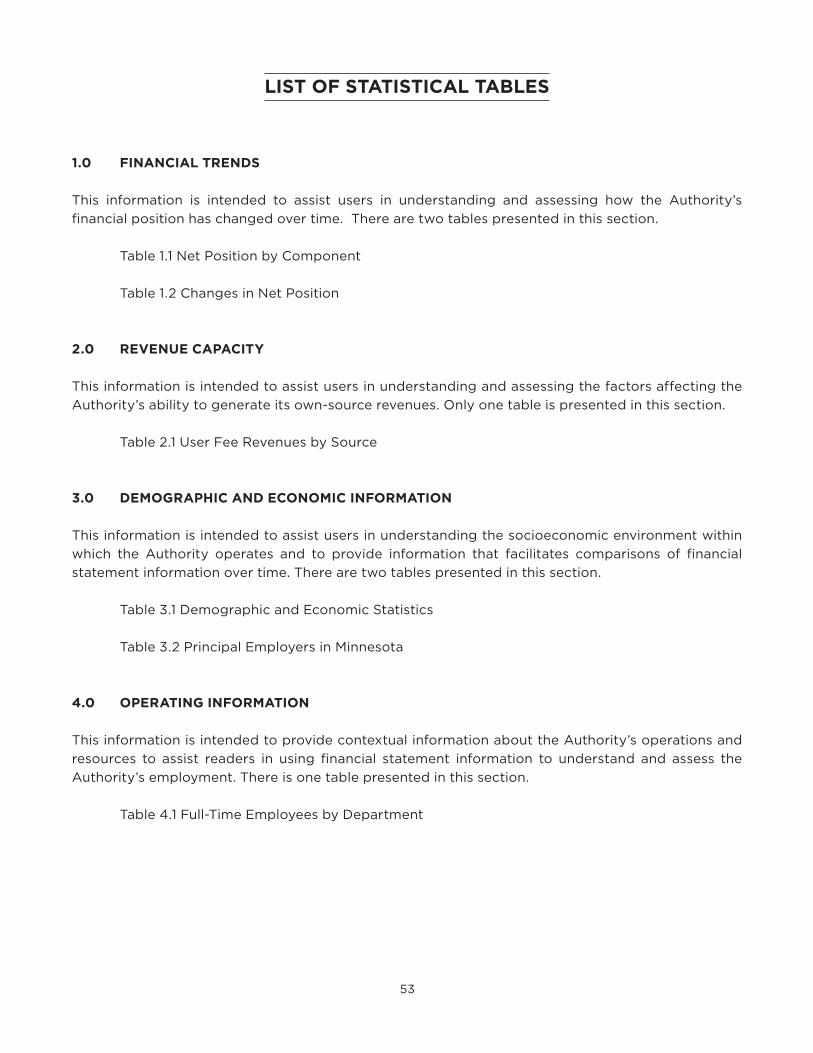
53
LIST OF STATISTICAL TABLES
1.0 FINANCIAL TRENDS
This information is intended to assist users in understanding and assessing how the Authority’s
financial position has changed over time. There are two tables presented in this section.
Table 1.1 Net Position by Component
Table 1.2 Changes in Net Position
2.0 REVENUE CAPACITY
This information is intended to assist users in understanding and assessing the factors affecting the
Authority’s ability to generate its own-source revenues. Only one table is presented in this section.
Table 2.1 User Fee Revenues by Source
3.0 DEMOGRAPHIC AND ECONOMIC INFORMATION
This information is intended to assist users in understanding the socioeconomic environment within
which the Authority operates and to provide information that facilitates comparisons of financial
statement information over time. There are two tables presented in this section.
Table 3.1 Demographic and Economic Statistics
Table 3.2 Principal Employers in Minnesota
4.0 OPERATING INFORMATION
This information is intended to provide contextual information about the Authority’s operations and
resources to assist readers in using financial statement information to understand and assess the
Authority’s employment. There is one table presented in this section.
Table 4.1 Full-Time Employees by Department
54
MINNESOTA SPORTS FACILITIES AUTHORITY Net Position by Component Last Six Fiscal Years
Table 1.1
2018 2017 2015 2014 2013 2012
Investment in capital assets
$1,044,474,586 $1,090,575,542 $907,139,710 $389,507,399 $52,256,276 $15,497,844
Restricted 5,993,494 - - - - -
Unrestricted (628,667) 1,690,775 7,910,770 16,692,006 24,144,345 12,080,223
Total net position
$1,049,839,413 $1,092,266,317 $915,050,480 $406,199,405 $76,400,621 $27,578,067
1 The Authority began operations on August 1, 2012 and net position for 2012 is reported as of December 31, 2012, for the five-month period then ended.
2 Net position for 2013, 2014, and 2015 is reported as of December 31 of each year.
3 The Authority changed its year-end from December 31 to June 30 and net position for 2017 is reported as of June 30, 2017, for the 18-month fiscal period then ended.
Unaudited
Source: Authority Finance department
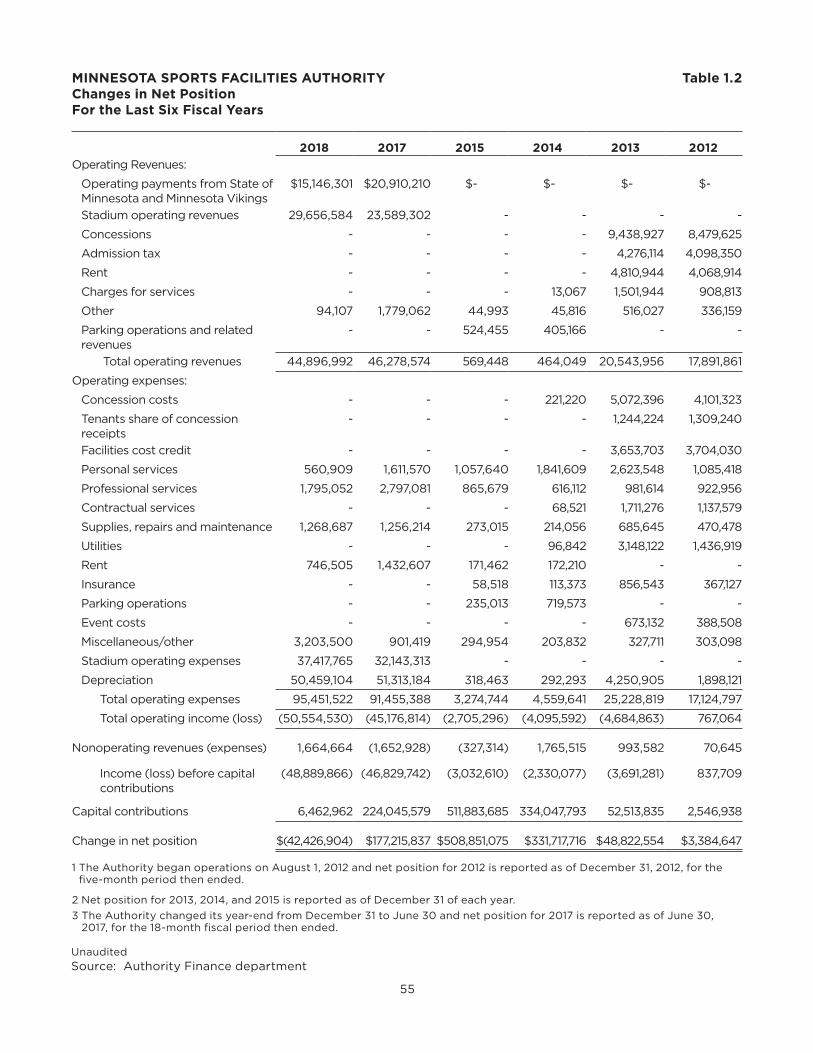
55
MINNESOTA SPORTS FACILITIES AUTHORITYChanges in Net Position For the Last Six Fiscal Years
Table 1.2
2018 2017 2015 2014 2013 2012
Operating Revenues:
Operating payments from State of Minnesota and Minnesota Vikings
$15,146,301 $20,910,210 $- $- $- $-
Stadium operating revenues 29,656,584 23,589,302 - - - -
Concessions - - - - 9,438,927 8,479,625
Admission tax - - - - 4,276,114 4,098,350
Rent - - - - 4,810,944 4,068,914
Charges for services - - - 13,067 1,501,944 908,813
Other 94,107 1,779,062 44,993 45,816 516,027 336,159
Parking operations and related revenues
- - 524,455 405,166 - -
Total operating revenues 44,896,992 46,278,574 569,448 464,049 20,543,956 17,891,861
Operating expenses:
Concession costs - - - 221,220 5,072,396 4,101,323
Tenants share of concession receipts
- - - - 1,244,224 1,309,240
Facilities cost credit - - - - 3,653,703 3,704,030
Personal services 560,909 1,611,570 1,057,640 1,841,609 2,623,548 1,085,418
Professional services 1,795,052 2,797,081 865,679 616,112 981,614 922,956
Contractual services - - - 68,521 1,711,276 1,137,579
Supplies, repairs and maintenance 1,268,687 1,256,214 273,015 214,056 685,645 470,478
Utilities - - - 96,842 3,148,122 1,436,919
Rent 746,505 1,432,607 171,462 172,210 - -
Insurance - - 58,518 113,373 856,543 367,127
Parking operations - - 235,013 719,573 - -
Event costs - - - - 673,132 388,508
Miscellaneous/other 3,203,500 901,419 294,954 203,832 327,711 303,098
Stadium operating expenses 37,417,765 32,143,313 - - - -
Depreciation 50,459,104 51,313,184 318,463 292,293 4,250,905 1,898,121
Total operating expenses 95,451,522 91,455,388 3,274,744 4,559,641 25,228,819 17,124,797
Total operating income (loss) (50,554,530) (45,176,814) (2,705,296) (4,095,592) (4,684,863) 767,064
Nonoperating revenues (expenses) 1,664,664 (1,652,928) (327,314) 1,765,515 993,582 70,645
Income (loss) before capital contributions
(48,889,866) (46,829,742) (3,032,610) (2,330,077) (3,691,281) 837,709
Capital contributions 6,462,962 224,045,579 511,883,685 334,047,793 52,513,835 2,546,938
Change in net position $(42,426,904) $177,215,837 $508,851,075 $331,717,716 $48,822,554 $3,384,647
1 The Authority began operations on August 1, 2012 and net position for 2012 is reported as of December 31, 2012, for the five-month period then ended.
2 Net position for 2013, 2014, and 2015 is reported as of December 31 of each year.
3 The Authority changed its year-end from December 31 to June 30 and net position for 2017 is reported as of June 30, 2017, for the 18-month fiscal period then ended.
Unaudited
Source: Authority Finance department
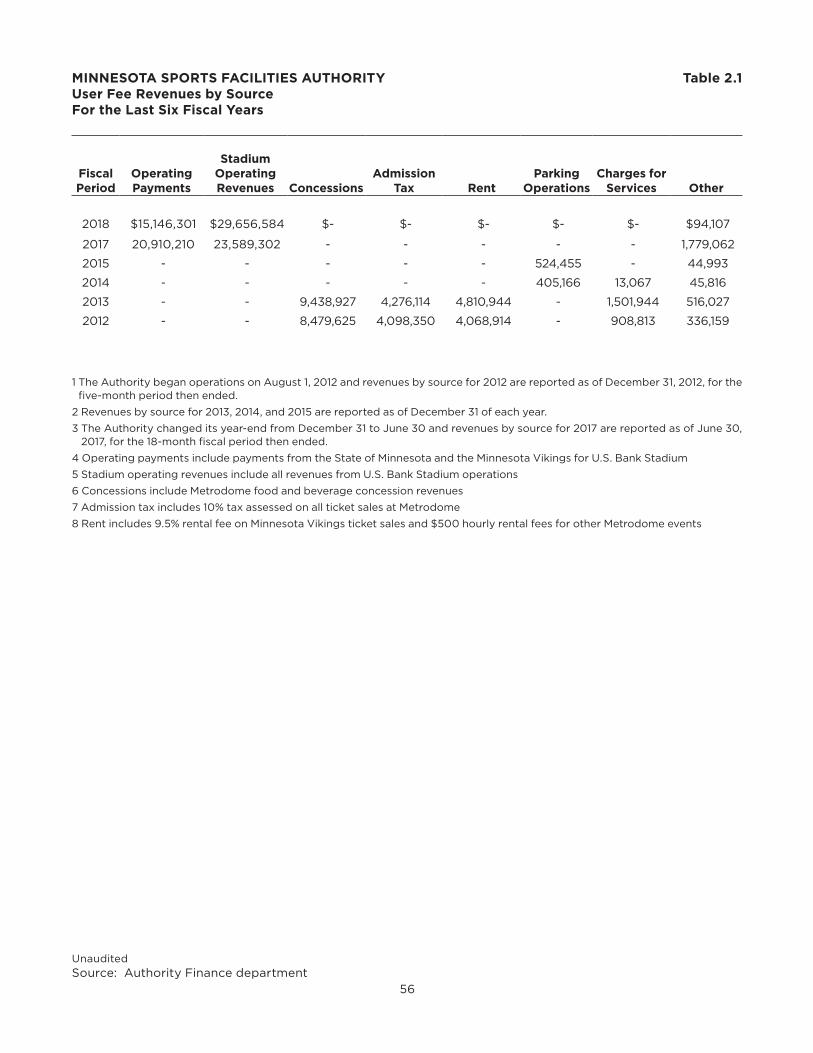
56
Unaudited
Source: Authority Finance department
MINNESOTA SPORTS FACILITIES AUTHORITY User Fee Revenues by Source For the Last Six Fiscal Years
Table 2.1
Fiscal Period
Operating Payments
Stadium Operating Revenues Concessions
Admission Tax Rent
Parking Operations
Charges for Services Other
2018 $15,146,301 $29,656,584 $- $- $- $- $- $94,107
2017 20,910,210 23,589,302 - - - - - 1,779,062
2015 - - - - - 524,455 - 44,993
2014 - - - - - 405,166 13,067 45,816
2013 - - 9,438,927 4,276,114 4,810,944 - 1,501,944 516,027
2012 - - 8,479,625 4,098,350 4,068,914 - 908,813 336,159
1 The Authority began operations on August 1, 2012 and revenues by source for 2012 are reported as of December 31, 2012, for the five-month period then ended.
2 Revenues by source for 2013, 2014, and 2015 are reported as of December 31 of each year.
3 The Authority changed its year-end from December 31 to June 30 and revenues by source for 2017 are reported as of June 30, 2017, for the 18-month fiscal period then ended.
4 Operating payments include payments from the State of Minnesota and the Minnesota Vikings for U.S. Bank Stadium
5 Stadium operating revenues include all revenues from U.S. Bank Stadium operations
6 Concessions include Metrodome food and beverage concession revenues
7 Admission tax includes 10% tax assessed on all ticket sales at Metrodome
8 Rent includes 9.5% rental fee on Minnesota Vikings ticket sales and $500 hourly rental fees for other Metrodome events
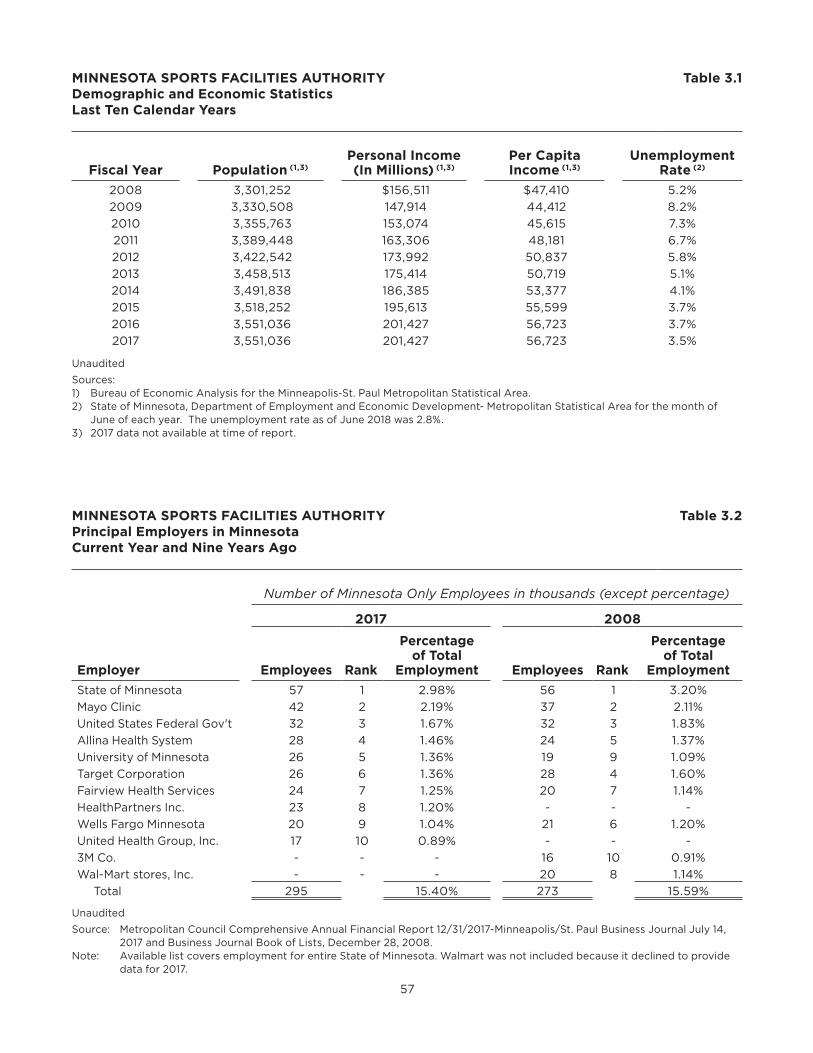
57
Unaudited
Source: Metropolitan Council Comprehensive Annual Financial Report 12/31/2017-Minneapolis/St. Paul Business Journal July 14, 2017 and Business Journal Book of Lists, December 28, 2008.
Note: Available list covers employment for entire State of Minnesota. Walmart was not included because it declined to provide data for 2017.
MINNESOTA SPORTS FACILITIES AUTHORITYDemographic and Economic StatisticsLast Ten Calendar Years
Table 3.1
MINNESOTA SPORTS FACILITIES AUTHORITYPrincipal Employers in MinnesotaCurrent Year and Nine Years Ago
Table 3.2
Fiscal Year Population (1,3)Personal Income (In Millions) (1,3)
Per Capita Income (1,3)
Unemployment Rate (2)
2008 3,301,252 $156,511 $47,410 5.2%
2009 3,330,508 147,914 44,412 8.2%
2010 3,355,763 153,074 45,615 7.3%
2011 3,389,448 163,306 48,181 6.7%
2012 3,422,542 173,992 50,837 5.8%
2013 3,458,513 175,414 50,719 5.1%
2014 3,491,838 186,385 53,377 4.1%
2015 3,518,252 195,613 55,599 3.7%
2016 3,551,036 201,427 56,723 3.7%
2017 3,551,036 201,427 56,723 3.5%
Number of Minnesota Only Employees in thousands (except percentage)
2017 2008
Employer Employees Rank
Percentage of Total
Employment Employees Rank
Percentage of Total
Employment
State of Minnesota 57 1 2.98% 56 1 3.20%
Mayo Clinic 42 2 2.19% 37 2 2.11%
United States Federal Gov't 32 3 1.67% 32 3 1.83%
Allina Health System 28 4 1.46% 24 5 1.37%
University of Minnesota 26 5 1.36% 19 9 1.09%
Target Corporation 26 6 1.36% 28 4 1.60%
Fairview Health Services 24 7 1.25% 20 7 1.14%
HealthPartners Inc. 23 8 1.20% - - -
Wells Fargo Minnesota 20 9 1.04% 21 6 1.20%
United Health Group, Inc. 17 10 0.89% - - -
3M Co. - - - 16 10 0.91%
Wal-Mart stores, Inc. - - - 20 8 1.14%
Total 295 15.40% 273 15.59%
Unaudited
Sources:1) Bureau of Economic Analysis for the Minneapolis-St. Paul Metropolitan Statistical Area.2) State of Minnesota, Department of Employment and Economic Development- Metropolitan Statistical Area for the month of
June of each year. The unemployment rate as of June 2018 was 2.8%.3) 2017 data not available at time of report.
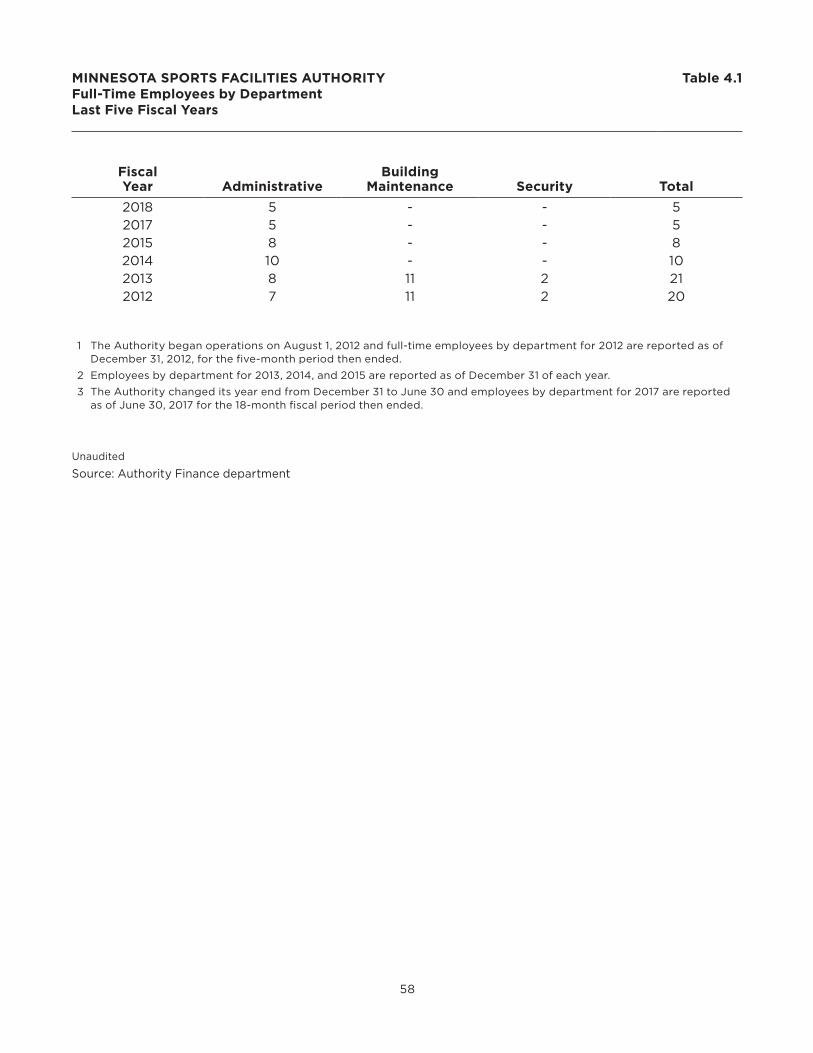
58
Unaudited
Source: Authority Finance department
MINNESOTA SPORTS FACILITIES AUTHORITYFull-Time Employees by DepartmentLast Five Fiscal Years
Table 4.1
Fiscal Year Administrative
Building Maintenance Security Total
2018 5 - - 52017 5 - - 52015 8 - - 82014 10 - - 102013 8 11 2 212012 7 11 2 20
1 The Authority began operations on August 1, 2012 and full-time employees by department for 2012 are reported as of December 31, 2012, for the five-month period then ended.
2 Employees by department for 2013, 2014, and 2015 are reported as of December 31 of each year.
3 The Authority changed its year end from December 31 to June 30 and employees by department for 2017 are reported as of June 30, 2017 for the 18-month fiscal period then ended.

59

— A COMPONENT UNIT OF THE STATE OF MINNESOTA —
MINNESOTA SPORTS FACILITIES AUTHORITY • MINNEAPOLIS, MINNESOTA
Minnesota Sports Facilities Authority 1005 Fourth Street South
Minneapolis, Minnesota 55415-1752


