
Microsoft Corporation

Agenda
• Megatrends and Government Challenges
• Government Performance Management Solution Area
• Case Studies
• Demos
• Summary of Benefits
• Next Steps

Today governments are facing a number of megatrends and challenges
Improving Staff Productivity
Increasing Operational Efficiency
Working Collaboratively and Taking Advantage of Shared Services
Leveraging the Power of Technology
Caring for the Environment
Delivering Social Care
Improving Customer (Citizen and Business) Service Delivery
Improving Compliance and Accountability
Raising Standards in Education
Sustaining the Local Economy
Continuous Cost Reduction
More Efficient and ―Greener‖ IT Infrastructure
Increased Citizen Interaction
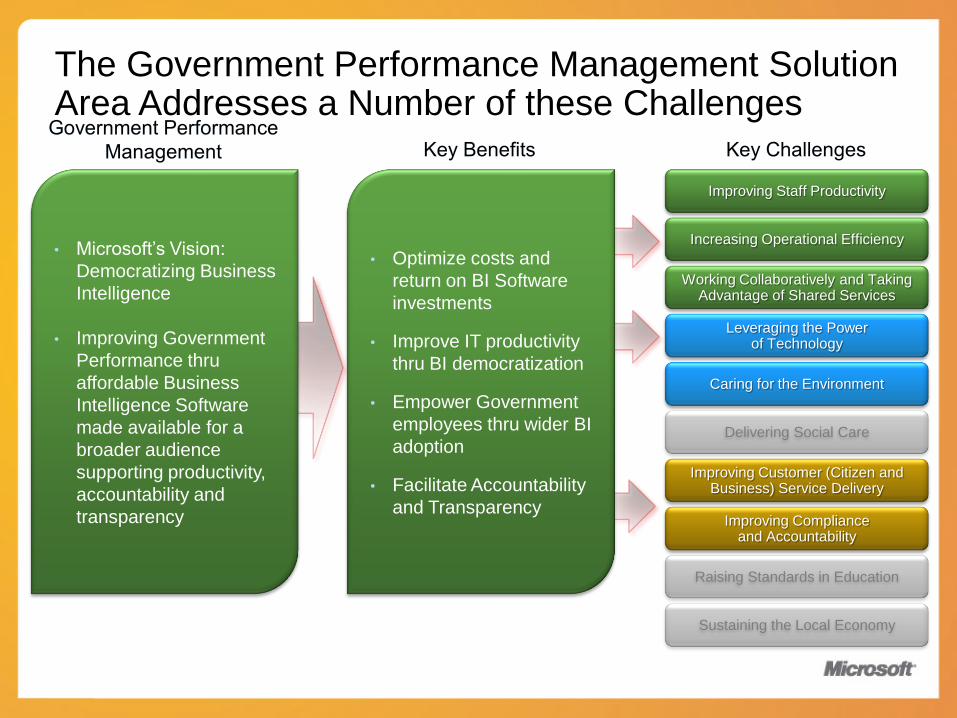
The Government Performance Management Solution Area Addresses a Number of these Challenges
Improving Staff Productivity
Increasing Operational Efficiency
Working Collaboratively and Taking Advantage of Shared Services
Leveraging the Power of Technology
Caring for the Environment
Delivering Social Care
Improving Customer (Citizen and Business) Service Delivery
Improving Compliance and Accountability
Raising Standards in Education
Sustaining the Local Economy
• Microsoft’s Vision:
Democratizing Business
Intelligence
• Improving Government
Performance thru
affordable Business
Intelligence Software
made available for a
broader audience
supporting productivity,
accountability and
transparency
• Optimize costs and
return on BI Software
investments
• Improve IT productivity
thru BI democratization
• Empower Government
employees thru wider BI
adoption
• Facilitate Accountability
and Transparency

Government Performance Management Key Benefits
• Increase individual productivity through familiar & intuitive tools
• Empower end users thru profile based reporting
• Facilitate data sharing and collaboration for better managerial alignment
• Make information available and comprehensive thru data reporting and visualization tools.
• Get Citizen engagement by sharing goals and results
• Support the Political agenda thru open communication with Citizens and political leaders
• Automate reporting and provide self service capabilities to end users
• Optimize existing BI investments thru wider deployments
• Implement dashboards and Key Performance Indicators to track and manage Gov. spending
• Reduce time and efforts to produce specific reports for end users and free-up time for other IT activities
• Reduce Integration costs between various BI technologies by leveraging Microsoft’s BI platform interoperability
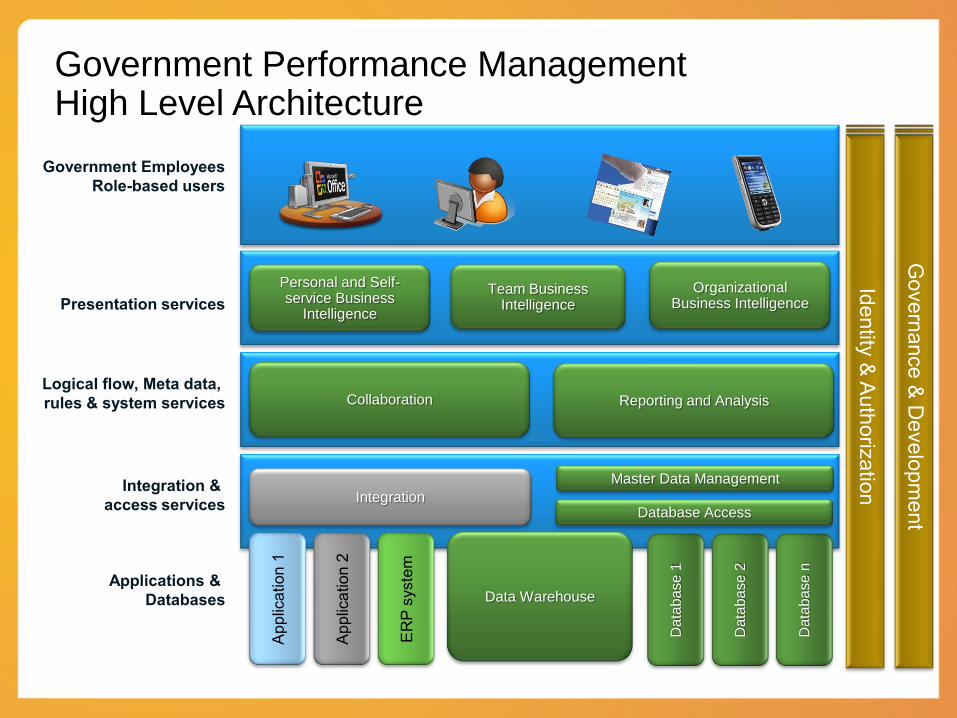
Government Performance ManagementHigh Level Architecture
Integration
Collaboration
Database Access
Team Business Intelligence
Personal and Self-service Business
Intelligence
Da
tab
ase 1
Da
tab
ase 2
Da
tab
ase n
Organizational Business Intelligence
Reporting and Analysis
Data Warehouse
Master Data Management
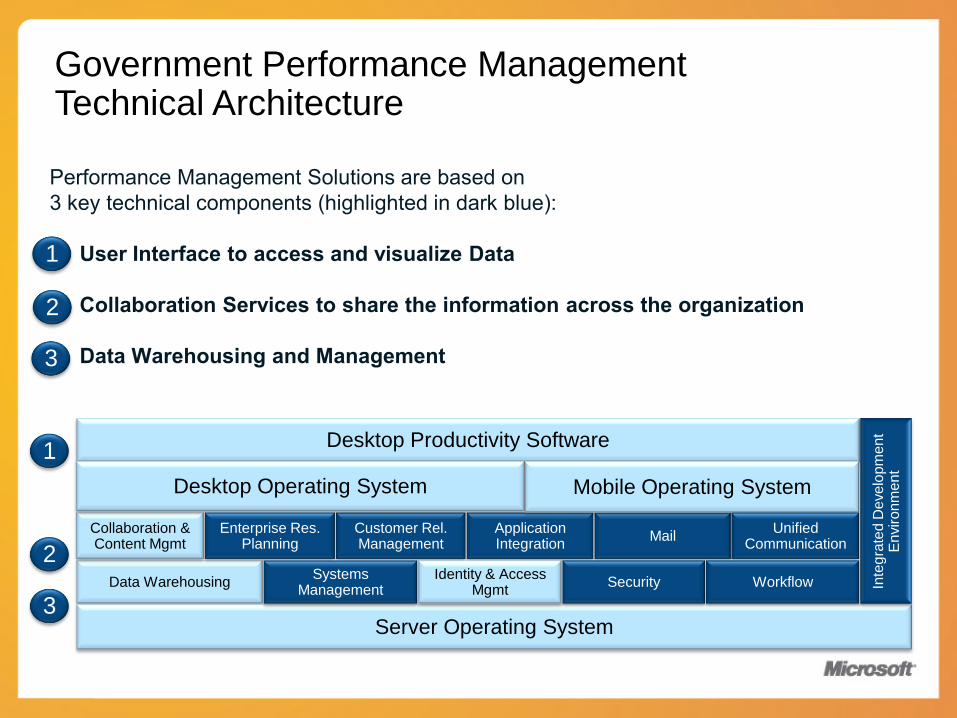
Government Performance Management Technical Architecture
1
2
3
1
2
3
Desktop Productivity Software
Data Warehousing
Collaboration & Content Mgmt
Customer Rel. Management
ApplicationIntegration
Server Operating System
Mobile Operating SystemDesktop Operating System
UnifiedCommunication
Inte
gra
ted D
eve
lopm
ent
En
viro
nm
ent
Enterprise Res. Planning
Systems Management
Identity & Access Mgmt
Security Workflow

Government Performance Management Product view
Office
Dynamics ERP
Dynamics CRM
BizTalk Exchange
Windows Server
Windows MobileWindows Client
Office Comm. Server V
isu
al S
tudio
MOSS
SQL Server System Ctr. AD/ADFS Forefront .NET Framework
Microsoft SQL Server Enterprise EditionMicrosoft SQL Server Analysis Services (SSAS)
Microsoft SQL Server Data MiningMicrosoft SQL Server Reporting Services (SSRS)
Microsoft PerformancePointServiceMicrosoft Excel 2007
1
2
3
1 2 3

UAE Performance Management Solution Drives Transformation in Public Services “According to a Gartner research report as of January 2008, Microsoft is the leader in the execution of business intelligence solutions. This was
proved when the company‟s consultants guaranteed timely delivery as well as an Arabic interface for our solution. No other vendor could offer
us both. Moreover, by signing a Microsoft Enterprise Agreement for low-cost volume licensing of software to provide an unlimited number of
users access to the new system, we could set an example of cost efficiency in project management for other public service departments.”
- Zakeya Hmoud Alameri, Head of Performance Assessment Section and Project Manager,
Government Performance Department, UAE Prime Minister’s Office
Customer ProfileThe Prime Minister’s Office (PMO), as part of Ministry of Cabinet Affairs of the United Arab Emirates (UAE), administrates federal government ministries and authorities throughout the country.The federal government initiated a groundbreaking project to support the economic wellbeing of its people with a world-class public administration system.
• The UAE Prime Minister’s Office implemented an automated performance management system based on Microsoft® technologies to measure the quarterly performance of public sector entities based on their key performance indicators.
Solution
• 100 per cent user adoption
• Analyst requirement cut
• Improved administration
• Cost-effective technology
• Strong business relationship
Customer Results/Benefits
• The PMO wanted an automated performance management system to monitor the progress of a government transformation programme aimed at achieving ambitious service targets by the end of 2010.
Customer Challenge

Westminster Dashboard for Child Protection Reduces Monitoring Time to Seconds“The most experienced members of staff would take 20 minutes to run a piece of analysis while others could take up
to an hour. With Office PerformancePoint Server, we can do this in seconds…The simplicity of the dashboard was a
real plus for our user group involved in the pilot programme. They learned how to use it after 10 minutes of training
and liked the intuitive behaviour of the new software.”
- Julie Pappacoda, Head of Integrated Children’s Information Systems Westminster City Council
Customer ProfileWestminster City Council provides local government services to 244,000 people in one of the most diverse and densely populated areas of central London
Among its many responsibilities, Westminster has a mandate to look after vulnerable people within the city area. The council’s Children’s Services Department works with children, young people, and their families to ensure children are cared for and that any child at risk is identified quickly and given appropriate safeguarding
• The council’s IT team built a dashboard solution with Microsoft Office PerformancePoint® Server 2007 software and created an enterprise-grade, scalable performance management application. Because Office PPS 2007 uses Microsoft Office as its primary interface, social workers can interact with familiar tools, such as Microsoft Office Excel® 2007
Solution
• Child protection checks take seconds
• Training cut to just 10 minutes
• Reduced risk to vulnerable children
• Social workers take ownership of data
• More proactive intervention
Customer Results/Benefits
• The Westminster City Council conducted a review and highlighted the difficulties in extracting the detailed, and often critical, information required to ensure appropriate safeguards for children. The dashboard draws together information that was otherwise difficult, or time-consuming, to collect and links management information with resource inputs
Customer Challenge

The Illinois Department of Transportation Saves Lives with Microsoft Business Intelligence Solution
“When people at other agencies see the BI solution we‟ve built with Microsoft technologies, they
quickly conclude that their IT teams can provide a similar solution, „PerformancePoint is going to
take off fast in our state.”behaviour of the new software.”
- Mark Kinkade, CIO at IDOT
Customer ProfileWith 5,500 employees, IDOT serves 12.8 million Illinois residents. From building roads and bridges to executing advertising campaigns about traffic safety, IDOT is focused on providing safe, cost-effective transportation for the residents of Illinois. Central to its work is a commitment to delivering quality. A key tenant for the organization is to ―do it right the first time, every time.‖
• Using Microsoft PerformancePoint 2007, as part of a comprehensive BI platform, the Illinois Department of Transportation has created several crucially important dashboards. These dashboards integrate data from many of the organization’s systems and provide employees with the tools they need to analyze information for decision making
Solution
• IDOT’s business intelligence solution is already paying dividends. Instead of doing three iterations of a custom report over several days or even weeks, reports now take just a few hours or less to produce. The Microsoft solution allows users to access data that has never been available to them for better decision making
Customer Results/Benefits
• IDOT employees faced a significant obstacle to making the right decisions: limited access to data residing in many disparate, siloeddata systems. Employees — from managers down to front-line workers – had to request information from the IT team when they needed to make decisions. IT personnel hadto manually run reports from the mainframe, and the reports often required numerous iterations and up to several weeks to perfect
Customer Challenge

Demos
1Stimulus 360 is Microsoft's Solution Accelerator to the "American Recovery and Reinvestment Act of 2009" (ARRA). The Solution Accelerator enables states to quickly mobilize and track federal funding sources, facilitate downstream funding requests and track allocated resources. Additionally, it provides effective means to project data, compile results, satisfy reporting and transparency requirements amongst other things
2
3
4

Summary of the Government Performance Management Solution Area
Facilitate a culture measurement and
continuous improvements
Deploy a more Transparent and
Accountable GovernmentMeasure contribution to the Environmental
Sustainability
Improve overall productivity of
Government (line of business and IT)
Consolidate data from multiple systems to
improve Citizen Services
Low Total Cost of Ownership
Leverage your existing Infrastructure
Empower Your People
Self-Service access & insight
Familiar interface & tools you own today
Improve Organizational Effectiveness
Alignment, Accountability &
Ownership
Collaborative across your value chain
Enable IT Efficiency
Trusted, scalable &
secure
IT Management &
Interoperability

Next Steps
Meet to discuss further specific opportunities around Government Performance Management
Work with you to build the business case relative to the potential Government Performance Management opportunities
Engage with our team to perform a Planning and Architecture Design Session (ADS)
Evaluate POC opportunity

Additional resources for the Government Performance Management Solution Area
• Demos (access to detailed information)
• Microsoft Resources
• Key Partners (qualification in process)
• Market Information
• Product Information
• Microsoft Services Offerings

Demos

Demos
• Public Sector demos are available for Partners and Microsoft employees at: http://fs.mspublicsectordemos.com
• For any problems accessing the site please contact: [email protected]

Demos 1Stimulus 360• The Microsoft Funds Management 360 Solution
Accelerator helps Government Agencies track, measure, and share information about national, international, or combined funding sources through easy-to-use graphical dashboards and maps. To learn more, start here: http://download.microsoft.com/download/B/6/F/B6F8250B-88DA-446B-A736-101421853A2F/MicrosoftStimulus360Datasheet.pdf
• Started as a Stimulus Solution in U.S., it is directly applicable in other countries/regions with economic stimulus programs, also it directly addresses funds management need with LDCs and Donor orgs
• Demo link:http://fs.mspublicsectordemos.com/Default.aspx
• Partner ready Materials:http://mspublicsectordemos.com/DemosSample.aspx

Demo 2Traffic Analysis • This demo tackles traffic analysis and allows
users to use geospatial presentation and information density to represent the entire data landscape. Geospatially oriented solutions help augment analytical BI with operational BI which gives users a near real-time view of events as they occur. Traffic incidents are shown and analyzed by zipcode where users can filter on accident-related parameters to analyze, drill down and detect patterns
• The solution can be driven from the map itself or the scorecard representing the associated map. The demo shows a BI solution integrating between PPS (PerformancePoint) and VE (Virtual Earth). Integrating BI with VE is essential in addressing any geospatial solution
• Demo and script can be found here:http://fs.mspublicsectordemos.com/Default.aspx
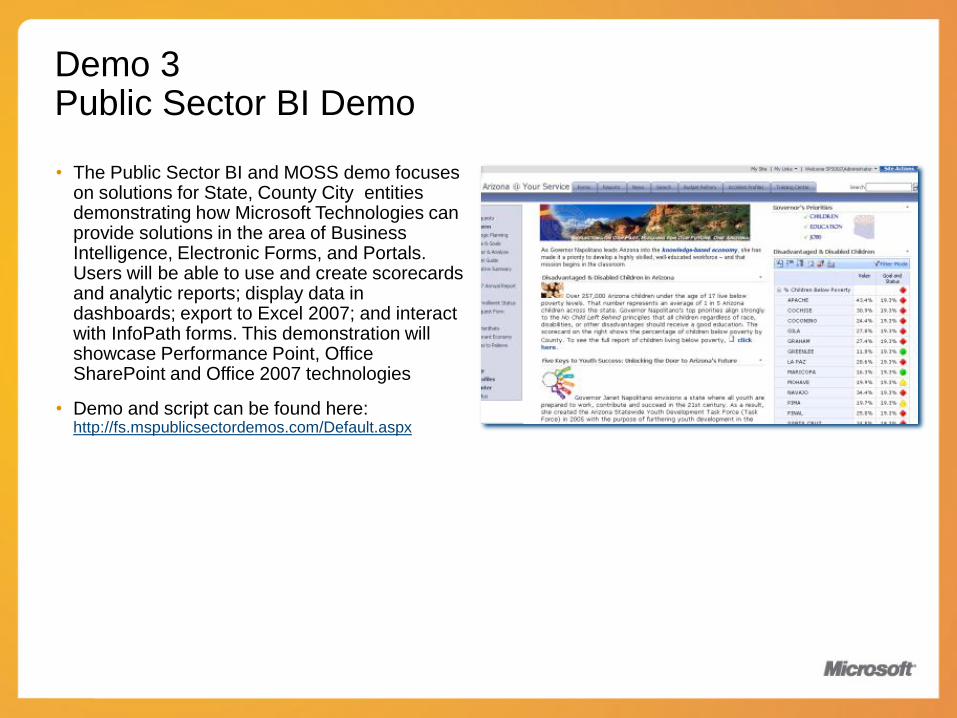
Demo 3Public Sector BI Demo
• The Public Sector BI and MOSS demo focuses on solutions for State, County City entities demonstrating how Microsoft Technologies can provide solutions in the area of Business Intelligence, Electronic Forms, and Portals. Users will be able to use and create scorecards and analytic reports; display data in dashboards; export to Excel 2007; and interact with InfoPath forms. This demonstration will showcase Performance Point, Office SharePoint and Office 2007 technologies
• Demo and script can be found here:http://fs.mspublicsectordemos.com/Default.aspx

Demo 4 IT Dashboard and Scorecard
• A framework for creating IT Operations scorecards, dashboards, and analytics with Microsoft SQL Server, Systems Center Operations Manager, and Microsoft Office PerformancePoint Server 2007
• More resources at: http://www.microsoft.com/bi/department/department.aspx?id=tab1
• White Paper at: http://download.microsoft.com/download/3/5/8/35802290-a7f6-4976-8855-74c8b3b7f035/ITOperationsScorecardsandDashboards_whitepaper.doc
Appendix

Microsoft ResourcesMicrosoft BI Portal
www.microsoft.com/bi
Government Resources
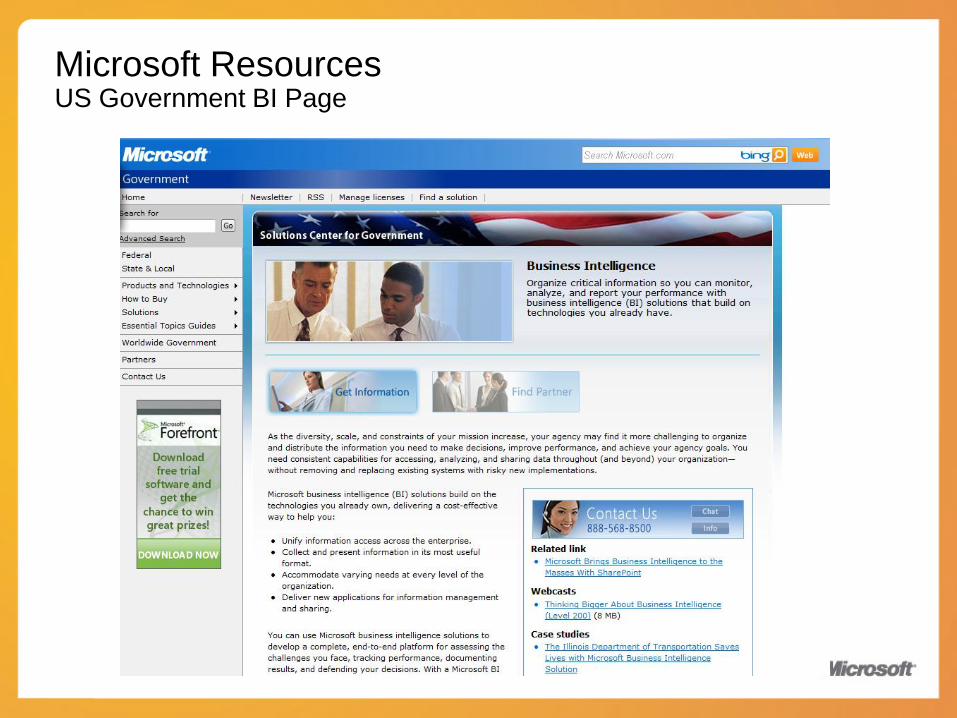
Microsoft ResourcesUS Government BI Page

Microsoft ResourcesEnvironmental Sustainability with BI
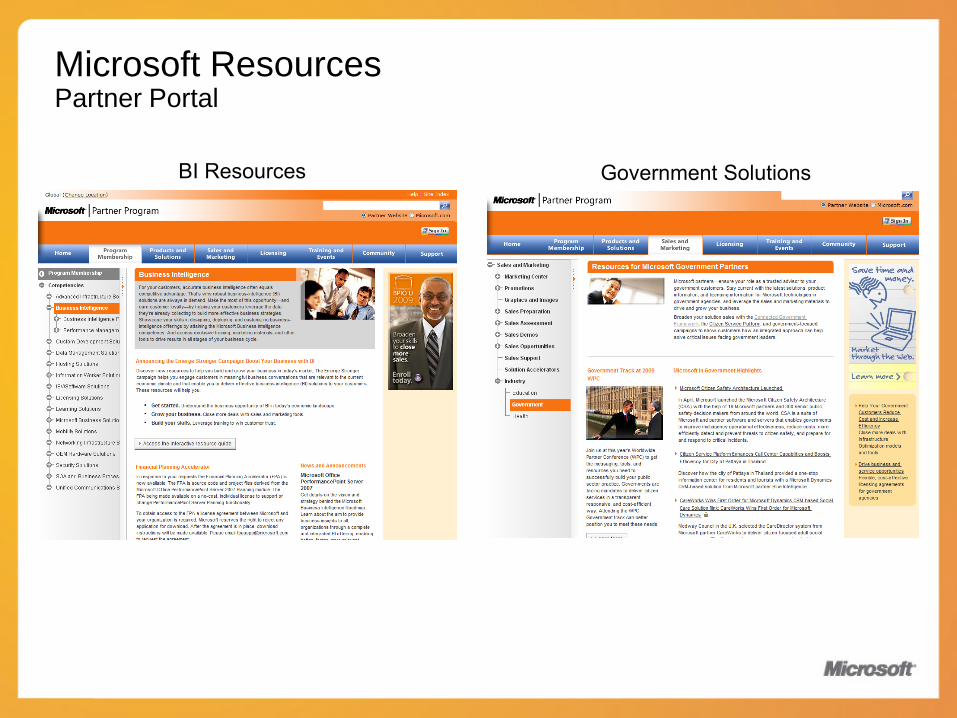
Microsoft ResourcesPartner Portal

Product Information
Data Infrastructure & BI Platform• Analysis Services
• Reporting Services
• Integration Services
• Data Mining
• Data Warehousing
Business Productivity Infrastructure• Dashboards & Scorecards
• Excel Services
• Web based forms & workflow
• Collaboration
• Search
• Content Management
• LOB data integration
Delivered through a Familiar Interface• Self-Service access & insight
• Data exploration & analysis
• Predictive analysis
• Data visualization
• Contextual visualization
BUSINESS PRODUCTIVITY INFRASTRUCTURE
BUSINESS USER EXPERIENCE
DATA INFRASTRUCTURE & BI PLATFORM
The Microsoft Government Performance Solutions are based on familiar products you probably already own
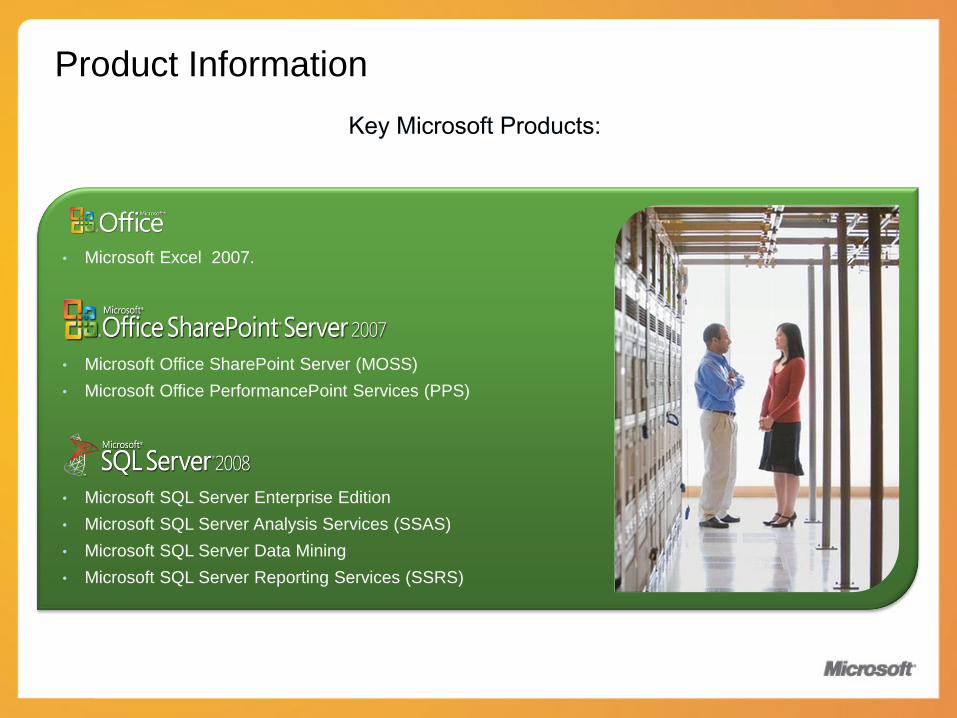
Product Information
• Microsoft Excel 2007.
• Microsoft Office SharePoint Server (MOSS)
• Microsoft Office PerformancePoint Services (PPS)
• Microsoft SQL Server Enterprise Edition
• Microsoft SQL Server Analysis Services (SSAS)
• Microsoft SQL Server Data Mining
• Microsoft SQL Server Reporting Services (SSRS)

Product Information
Microsoft Excel 2007- Excel, remains the most widely used Business Intelligence tool. The 2007 version of Excel contains numerous new capabilities: Results-oriented
user interface, More rows and columns, and other new limits , Office themes and Excel styles , Rich conditional formatting , Easy formula writing , New OLAP formulas and
cube functions , Improved sorting and filtering , Excel table enhancements , New look for charts , Shared charting , Easy-to-use PivotTables , Quick connections to external
data , New file formats , Better printing experience , New ways to share your work , Quick access to more templates.
Microsoft SQL Server – This is the very foundation of a Microsoft BI deployment. Using SQL Server Integration Services (SSIS) you set up the integration to your data
sources (ERP, payroll, CRM, point-of-sale, etc.) and schedule it for automatic updates into the SQL Server database. This now becomes your data warehouse upon which you
build the rest of the BI solution.
Microsoft SQL Server Analysis Services (SSAS) – Just like SSIS, SQL Server Analysis Services comes included with SQL Server at no additional cost. This is
the Online Analytical Processing (OLAP) tool that enables your users to quickly and easily slice and dice, drill down and analyze your business data. The OLAP cubes are built
on top of the SQL Server data warehouse.
Microsoft SQL Server Data Mining – This tool also comes with SQL Server. It consists of an Excel add-in as the user interface and a powerful set of customizable
algorithms that makes it easy for a user to mine your data for clusters, patterns and trends that ordinary analysis tools would miss.
Microsoft SQL Server Reporting Services (SSRS) – Yet another tool that is included with SQL Server. SSRS is a full-blown reporting tool that provides
formatted reports with some of the best graphics (charts, gauges, etc.) on the market. Reports can be deployed as a run-time service in the SharePoint user portal, or they can
be scheduled and automatically distributed to any number of users. Reports come in different formats, but the Excel export is one of the most popular ones.
Microsoft Office SharePoint Server (MOSS) – This web-portal is fully customizable and it has become one of the most successful products in the history of
Microsoft as organizations race to deploy a central portal where they can share documents and deploy their dashboards, scorecards and reports for easy,
secure access by end-users.
Microsoft Office PerformancePoint Services (PPS) – PerformancePoint Services is the result of the integration of PerformancePoint Server within MOSS (decided in
January 2009). It will include two main two capabilities:
• Monitoring which offers customizable, interactive dashboards with scorecards and graphics
• Analytics and essentially consists of the ProClarity ad-hoc reporting and analysis tool that Microsoft acquired in 2006.
The Planning capabilities of PerformancePoint Server will not be fully supported by the Office 14 release of SharePoint. PerformancePoint Server will be supported until 2019.

Product Information
Data mining
KPI support
Managed reporting
Enterprise-class ETL
Unified dimensionalmodel (UDM) for BI
Ad-hoc reporting,visualizations Enterprise Search,
Collaboration, Conditional Formatting, Dashboards/
Scorecards, Analytics
Content Management
Data mining in Excel
Data visualization
Enterprise Scalability
Empower Your People
Improve Organizational Effectiveness
Enable IT Efficiency
Pivot TablesPivot Charts
Connectionto SSAS
Office Integration
Self-Service BI,Re-usable report
components,New webparts
Unify Dashboards, Scorecards, Analytics with
Portal, Search, Collaboration
Massive DW scale-out
HW resource provisioning
Office-based ad-hoc reporting,
Master Data Management
BI product roadmap

Product Information
Business Process
andForms
EnterpriseContent
Management
Portal
Search
BusinessIntelligence
Collaboration
SharePoint
Reduce IT costs and complexity: consolidate disparate product investments into a single infrastructure
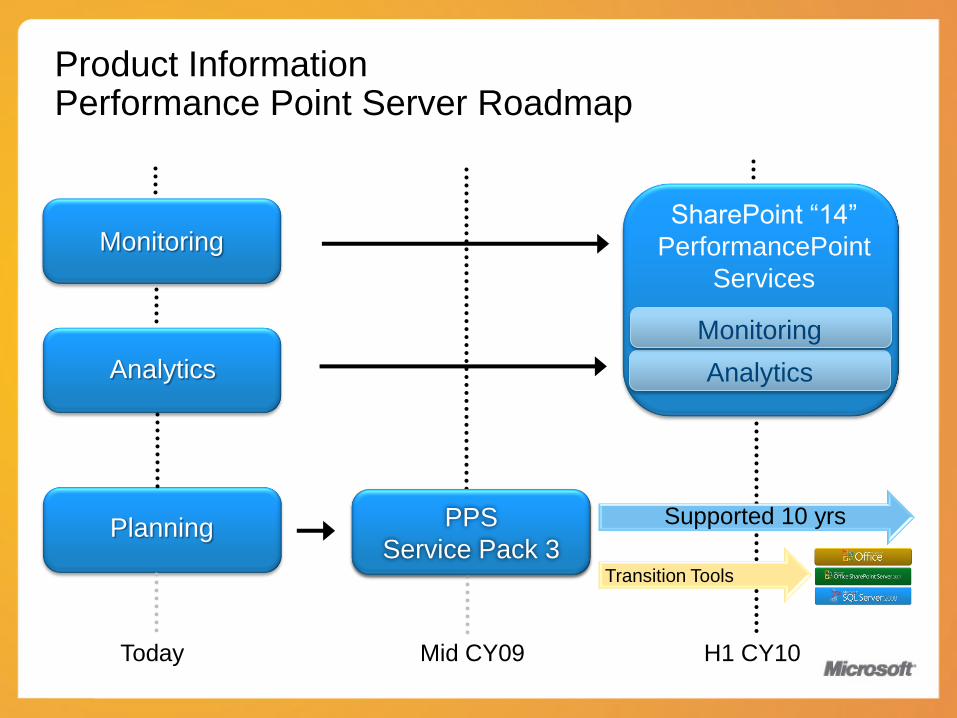
Product InformationPerformance Point Server Roadmap
Analytics
Monitoring
H1 CY10
Planning
Mid CY09
Supported 10 yrs
SharePoint ―14‖
PerformancePoint
Services
Analytics
Monitoring
Transition Tools
Today
PPS
Service Pack 3

Product InformationTransition Plan for Customers
Today: Use only PPS Planning features
Use some PPS Planning Features and SQL and SSAS Platform
Use some PPS Planning Features and SQL and SSAS Platform and Excel O14
End Goal: Use SQL Platform, Excel O14 features, SharePoint O14 and Self Service BI
Product Information
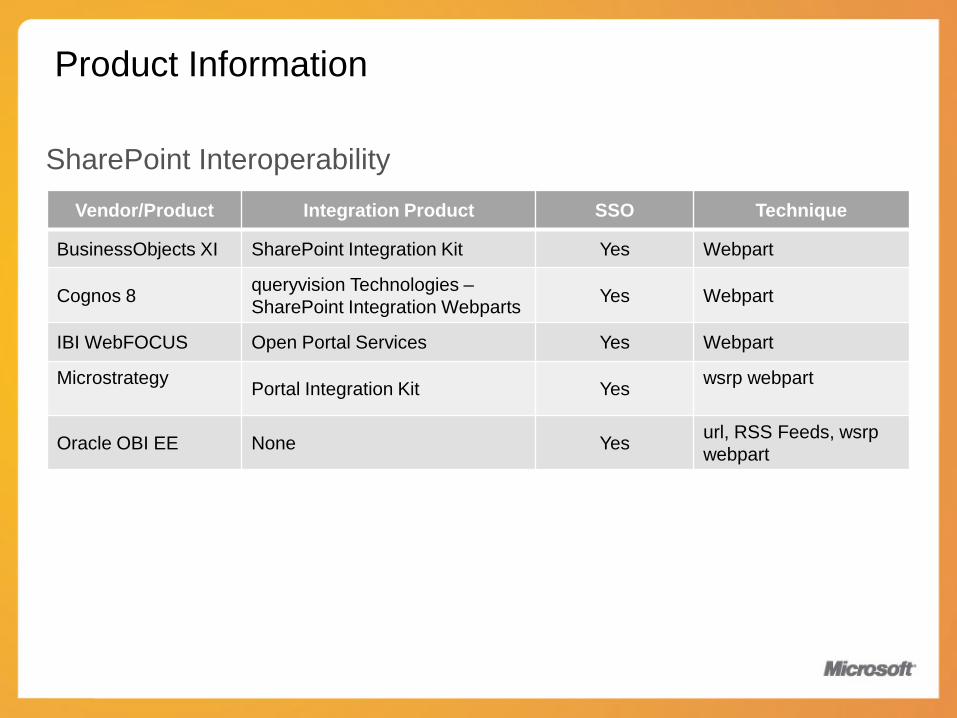
Vendor/Product Integration Product SSO Technique
BusinessObjects XI SharePoint Integration Kit Yes Webpart
Cognos 8queryvision Technologies –
SharePoint Integration WebpartsYes Webpart
IBI WebFOCUS Open Portal Services Yes Webpart
MicrostrategyPortal Integration Kit Yes
wsrp webpart
Oracle OBI EE None Yesurl, RSS Feeds, wsrp
webpart
SharePoint Interoperability

Product Information
*Source: Gartner Magic Quadrant for Business Intelligence Platforms, 2008 & Gartner Magic Quadrant for Data Warehouse DBMS, 2007
+Source: ―Worldwide Relational Database Management Systems 2007 Vendor Shares,‖ Carl W. Olofson, IDC, June 2008
#Source: NIST National Vulnerability Database
Over 1.5 Million Downloads of SQL Server 2008 RTM
In Leaders Quadrant in Gartner Magic Quadrants for DW & BI*
Leading Performance Benchmarks: TPC-H, TPC-E, & Applications
SQL Server is the Fastest Growing Relational Database WW+
SQL Server has the Fewest Vulnerabilities of Any Enterprise DB#

Microsoft Services Offerings
To learn more: http://www.microsoft.com/services/microsoftservices/default.mspx

Thank You
![Support de formation Microsoft Corporationdownload.microsoft.com/download/6/E/C/6EC45EEE-E7AA-4848...[Tâche 3] Tâches administratives Remise Suivi 16:36 Office 365 Office 365 Office](https://cdn.vdocuments.mx/doc/165x107/5fe7bf4851a63640b739c89c/support-de-formation-microsoft-tche-3-tches-administratives-remise-suivi.jpg)


