Micro- and Nano-Raman Spectroscopy
L. Borromeo1,2,*, U. Zimmermann1,2, S. Andò3, N. Egeland1,2, C. Toccafondi4, R. Ossikovski4, D. Bersani5, E. Garzanti3
1 Department of Petroleum Engineering, University of Stavanger, Norway, [email protected] The National IOR Centre of Norway, University of Stavanger, Norway
3 Department of Earth and Environmental Sciences, University of Milano-Bicocca, Italy4LPICM, CNRS, Ecole Polytechnique, Université Paris Saclay, France5 Department of Physics and Earth Sciences, University of Parma, Italy
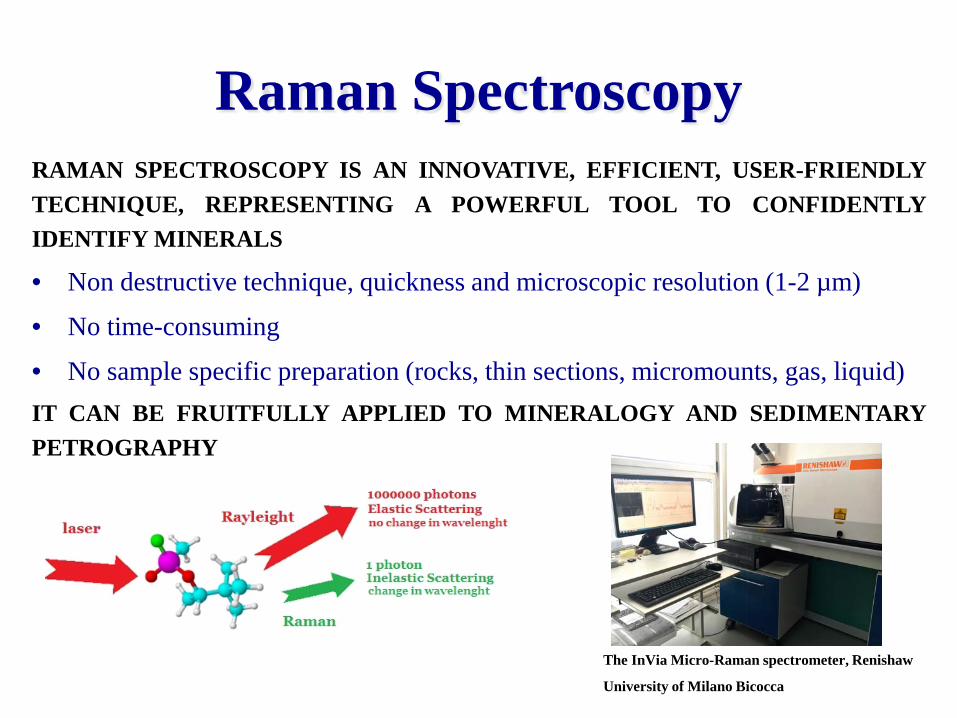
Raman SpectroscopyRAMAN SPECTROSCOPY IS AN INNOVATIVE, EFFICIENT, USER-FRIENDLYTECHNIQUE, REPRESENTING A POWERFUL TOOL TO CONFIDENTLYIDENTIFY MINERALS
• Non destructive technique, quickness and microscopic resolution (1-2 µm)
• No time-consuming
• No sample specific preparation (rocks, thin sections, micromounts, gas, liquid)IT CAN BE FRUITFULLY APPLIED TO MINERALOGY AND SEDIMENTARYPETROGRAPHY
The InVia Micro-Raman spectrometer, Renishaw
University of Milano Bicocca
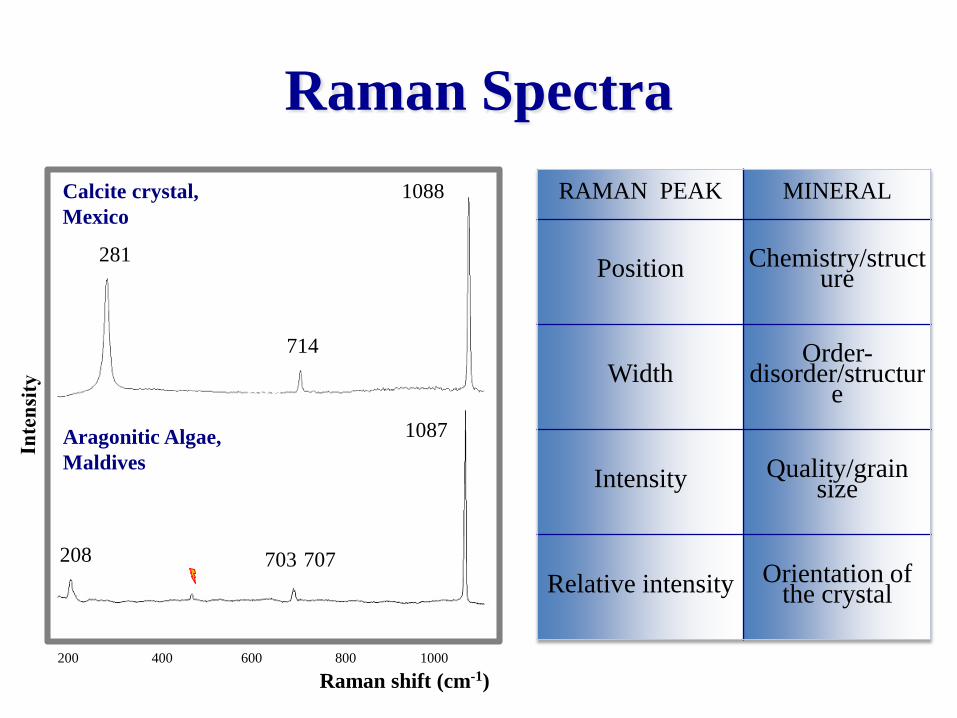
Raman Spectra
200
Calcite crystal, Mexico
Aragonitic Algae, Maldives
Raman shift (cm-1)
281
714
1088
208 703
1087
707
200 1000800600400
RAMAN PEAK MINERAL
Position Chemistry/structure
WidthOrder-
disorder/structure
Intensity Quality/grainsize
Relative intensity Orientation of the crystal
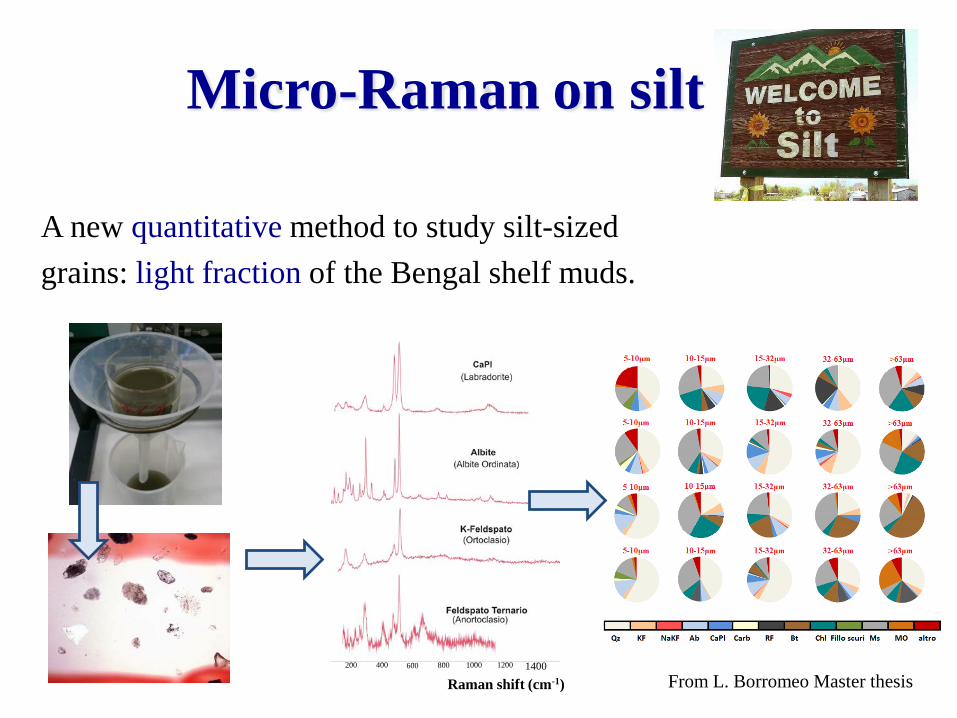
Micro-Raman on silt
A new quantitative method to study silt-sizedgrains: light fraction of the Bengal shelf muds.
Raman shift (cm-1)200 400 600 800 1000 1200 1400
From L. Borromeo Master thesis
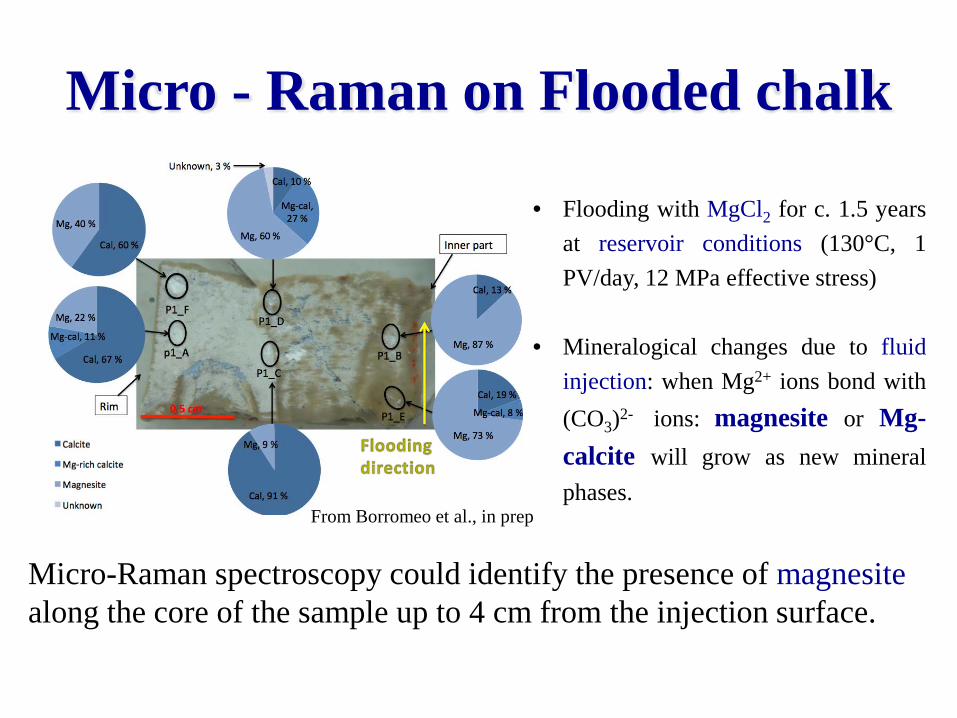
Micro - Raman on Flooded chalk
• Flooding with MgCl2 for c. 1.5 yearsat reservoir conditions (130°C, 1PV/day, 12 MPa effective stress)
• Mineralogical changes due to fluidinjection: when Mg2+ ions bond with(CO3)2- ions: magnesite or Mg-calcite will grow as new mineralphases.
Micro-Raman spectroscopy could identify the presence of magnesite along the core of the sample up to 4 cm from the injection surface.
From Borromeo et al., in prep
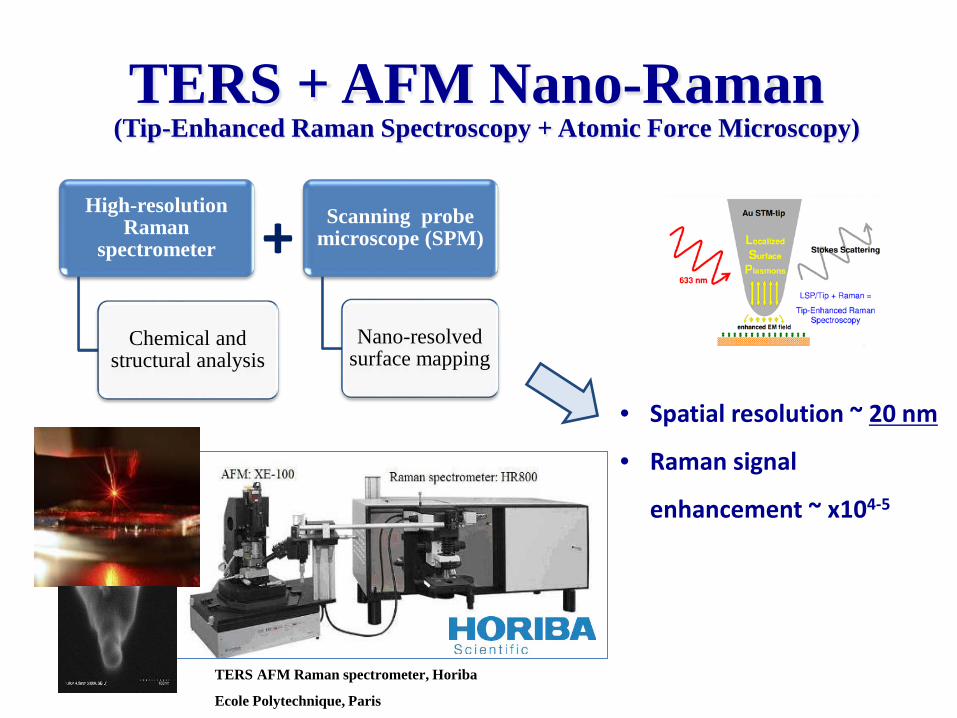
+High-resolution
Raman spectrometer
Chemical and structural analysis
Scanning probe microscope (SPM)
Nano-resolvedsurface mapping
TERS + AFM Nano-Raman
• Spatial resolution ~ 20 nm
• Raman signal
enhancement ~ x104-5
(Tip-Enhanced Raman Spectroscopy + Atomic Force Microscopy)
TERS AFM Raman spectrometer, Horiba
Ecole Polytechnique, Paris
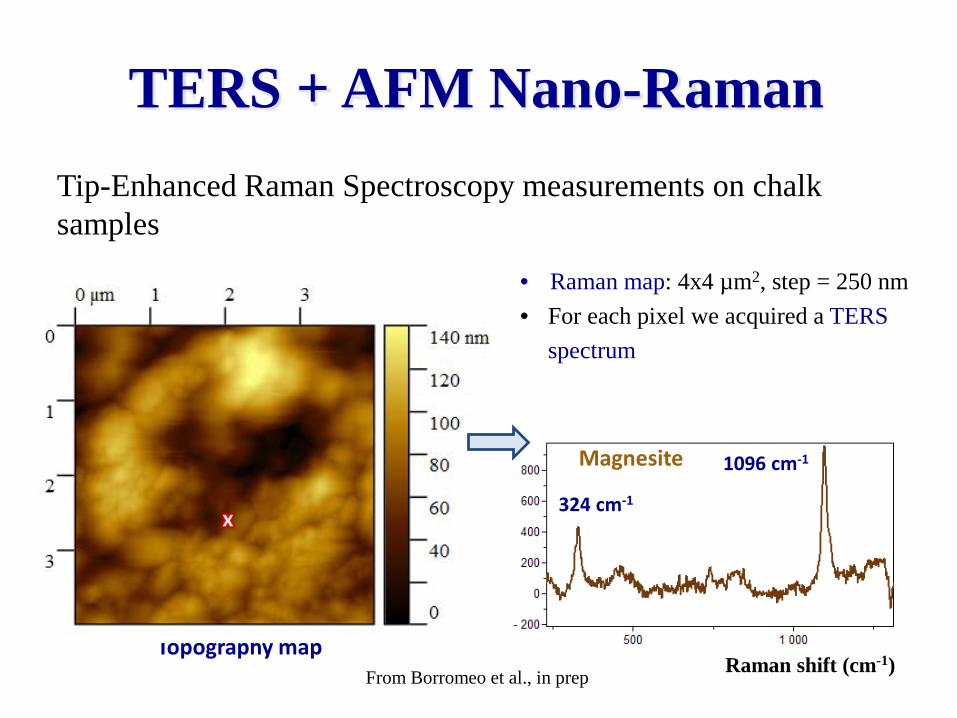
Topography map
• Raman map: 4x4 µm2, step = 250 nm• For each pixel we acquired a TERS
spectrum
Tip-Enhanced Raman Spectroscopy measurements on chalk samples
324 cm-1
1096 cm-1
TERS + AFM Nano-Raman
Raman shift (cm-1)From Borromeo et al., in prep
Magnesite
Conclusions• Raman spectroscopy is a very efficient, user-friendly point-
analysis technique that with a quick, non-destructive sample preparation allows us to obtain accurate minerochemicalinformation of micro- to nano-metric minerals.
• Raman spectroscopy provides an innovative work perspective in petroleum exploration of unconventional reservoirs, such chalk, siltstones and shales.
Grazie a tutti!
For more information:• Andò S. & Garzanti E. (2013). Raman Spectroscopy in heavy-mineral studies. Geological Society, London
Special publications;• Andò S.,Vignola P., Garzanti E., (2011). Raman counting: a new method to determine provenance of silt.
Rendiconti Lincei, 22, Issue 4, 327-347;• Borromeo L., U. Zimmermann, S. Andò, G. Coletti, D. Bersani, D. Basso, P. Gentile, B. Schulz, E.
Garzanti. Raman Spectroscopy as a tool for magnesium estimation in Mg-calcite, submitted to JRS.
C. V. Raman, 1928


