
HAL Id: hal-00909291https://hal.archives-ouvertes.fr/hal-00909291
Submitted on 26 Nov 2013
HAL is a multi-disciplinary open accessarchive for the deposit and dissemination of sci-entific research documents, whether they are pub-lished or not. The documents may come fromteaching and research institutions in France orabroad, or from public or private research centers.
L’archive ouverte pluridisciplinaire HAL, estdestinée au dépôt et à la diffusion de documentsscientifiques de niveau recherche, publiés ou non,émanant des établissements d’enseignement et derecherche français ou étrangers, des laboratoirespublics ou privés.
Metrological Investigation of the (6,5) Carbon NanotubeAbsorption Cross Section
Laura Oudjedi, A. Nicholas G. Parra-Vasquez, Antoine Godin, LaurentCognet, Brahim Lounis
To cite this version:Laura Oudjedi, A. Nicholas G. Parra-Vasquez, Antoine Godin, Laurent Cognet, Brahim Lounis.Metrological Investigation of the (6,5) Carbon Nanotube Absorption Cross Section. Journal of PhysicalChemistry Letters, American Chemical Society, 2013, 4, pp.1460. �10.1021/jz4003372�. �hal-00909291�

A metrological investigation of (6,5) carbon nanotube absorption cross-section
Laura Oudjedi1,2, A. Nicholas G. Parra-Vasquez1,2,§, Antoine G. Godin1,2, Laurent Cognet1,2,
and Brahim Lounis1,2, *
1 Univ Bordeaux, LP2N, F-33405 Talence, France
2 CNRS & Institut d’Optique, LP2N, F-33405 Talence, France
Abstract
Using single nanotube absorption microscopy, we measured the absorption cross-section of (6,5)
carbon nanotubes at their second order optical transition. We obtained a value of 3.2 10-17
cm2 per
carbon atom with a precision of 15% and an accuracy below 20%. This constitutes the first
metrological investigation of the absorption cross-section of chirality-identified nanotubes. Correlative
absorption-luminescence microscopies performed on long nanotubes reveal a direct manifestation of
exciton diffusion in the nanotube.

Single wall carbon nanotubes (SWCNTs) provide unique opportunities for applications in electronics,
optoelectronics, photonics and photovoltaics1. They are indeed nearly ideal models of infinite π orbital
conjugations where the sp² lattice provides exceptional charge carrier properties2. Moreover, their true
one-dimensional character confers them well-defined optical transitions from excitonic states3, 4
5.
While their Raman and photoluminescence properties have been extensively studied5, the basic
absorption properties of SWCNT are still poorly established in a quantitative manner, even if they are
of prime importance for applications. Indeed, common absorption measurements on ensemble of
SWCNT suffer from the problem of samples heterogeneities inherent to standard synthesis methods.
The large multiplicity of nanotube chiralities and lengths, as well as the presence of synthesis
impurities impede to assess the exact amount of a SWCNT chirality contributing to an absorption
signature. For (6,5) nanotubes, absorption cross-sections ranging from 0.5 10-18
to 1.3 × 10⁻¹⁷
cm²
per C atom can be deduced from previous reports6-9
considering an excitation light polarized along the
nanotubes and resonant with the second order transition (S22). The majority of the caveats mentioned
above which are responsible for the disparity in determination can be lifted-off by performing
measurements on individual SWCNTs.
Single SWCNT absorption measurements are challenging because the weak signals have to be
extracted from laser intensity fluctuations (including the always present shot noise) and contributions
from environment scattering10
. Luminescence microscopy, which is an intrinsic dark field method, has
been used to perform the first evaluation of for individual (6,5) nanotubes. The method was based
on the study of the luminescence dependence with excitation intensity, which deviates from linearity
at high excitation due to exciton-exciton annihilation processes11
. From the saturation intensity and the
luminescence lifetime of the SWCNT was estimated to be ~ 10-17
cm² per C atom11
. However,
individual defects that are photoinduced upon increasing excitation intensity quench the luminescence
and therefore can strongly alter the saturation behavior12, 13
. Rayleigh intensity scattering technique
combined with AFM have been used to extract an estimate of ~ 2.5 10-17
cm²/C for the resonant
absorption cross section of nanotubes of different diameters14
. Recently, a value in the range of ~ 10-17
cm²/C was reported for a large diameter (18,5) nanotube lying on opaque substrate excited around its
S33 transition using a reflective modulation imaging technique15
.
Given the large disparity in the reported absorption cross-section values, a metrological approach is
essential to provide a definitive value. Here, we present a quantitative measurement of the absorption
cross-section of chirality identified individual (6,5) nanotubes at their S22 transition peak. We choose
the (6,5) chirality as standard nanotubes since they can easily be identified by their luminescence
spectra and be excited efficiently near their second order resonance S22 using low noise CW solid-state
lasers. Futhermore, they are widely studied because of their abundance in standard synthesis methods
(CoMoCAT or HiPco for instance) and because their luminescence falls in the detection window of
σC
σC
σC
σC

Silicon detectors. Our direct measurement of carbon nanotube absorption cross-section requires
neither assumption on the sample content, nor on data interpretation. It was made possible by
combining transmission microscopy for absorption determination with luminescence microscopy for
chirality assignment and photothermal microscopy for assuring nanotube isolation.
We optimize the transmission spatial modulation technique16
to detect the extinction cross section of
small diameter SWNTs with high signal to noise ratios. For small diameter SWCNTs, the extinction
cross section is dominated by the absorption as demonstrated by Rayleigh scattering experiments
which reported scattering cross-section of the order of a few 10-20 cm²/C atom for (6,4) nanotubes14.
One limiting factor of this technique was that only relatively low frequencies (< kHz) could be used
for modulating the sample position due to mass loading17
. Thus, these measurements suffer from 1/f
noise. Our approach is based on a high frequency (f = 100 kHz) spatial modulation of a tightly focused
Gaussian beam across the nanoobject (Figure 1). In practice, the spatial modulation of a 561nm laser
beam is performed by varying the first-order diffraction angle of an acousto-optic modulator. The
incident beam is focused onto the sample by means of a high NA microscope objective (x60, NA 1.45)
and its transmission collected by a second identical objective is sent to a balanced photodetector
connected to a lock-in amplifier for demodulation. Images of the samples are obtained by raster
scanning the sample mounted on a piezo-scanning stage.
The sensitivity and metrological potential of the method is first validated on a standard nanosphere
sample. This sample consists of gold nanoparticles (NP) with mean diameter 10.0±0.8 nm (measured
on 191 NPs by TEM, figure 2 a-b) deposited on cleaned glass coverslip, embedded in immersion oil
for index matching (~1.50). In the case of small nano-objects the extinction cross section is dominated
by the absorption18
(negligible intensity scattering). For a small spherical gold NP (with dimensions
much smaller than the wavelength) at the position (x, y), the transmitted beam power writes
with the incident beam power, the NP absorption
cross-section, I(x,y) the intensity profile at the sample, and δ the amplitude of the spatial modulation
along the y-axis. Assuming a Gaussian beam profile and a small beam
modulation amplitude ( ) the demodulated power is proportional to the beam profile first
derivative along the y-axis and writes . As shown on figure
2c-d, individual gold nanoparticles are imaged with a high signal-to-noise-ratio (>20) with short
integration times of 25 ms and excitation power of 650 µW.
Ptrans (t) = Pinc −σ AuI(x, y+δ sin(2π ft)) Pinc
σAu
I(x ', y ') = I0e
−2(x '2+y '
2)
w02
δ << w0
Pmod(x, y) = −
8y
πw0
4σ Auδ ×Pince
−2(x2+y
2)
w02
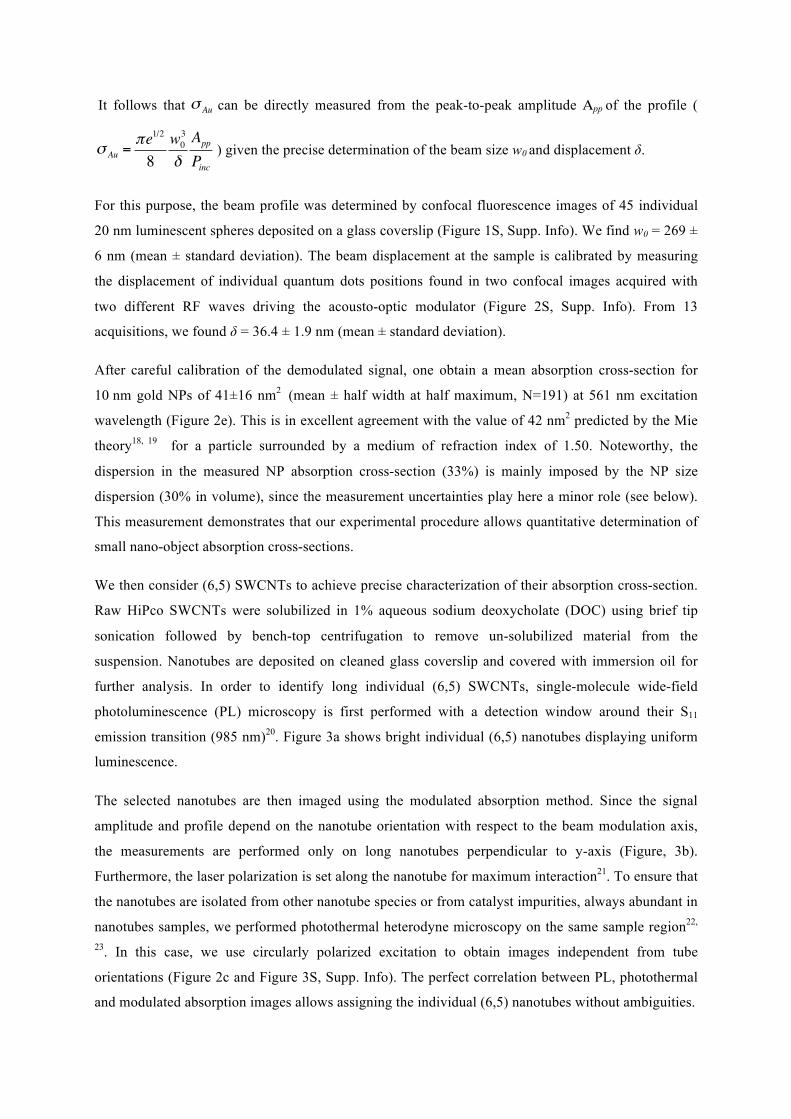
It follows that can be directly measured from the peak-to-peak amplitude Αpp of the profile (
) given the precise determination of the beam size w0 and displacement δ.
For this purpose, the beam profile was determined by confocal fluorescence images of 45 individual
20 nm luminescent spheres deposited on a glass coverslip (Figure 1S, Supp. Info). We find w0 = 269 ±
6 nm (mean ± standard deviation). The beam displacement at the sample is calibrated by measuring
the displacement of individual quantum dots positions found in two confocal images acquired with
two different RF waves driving the acousto-optic modulator (Figure 2S, Supp. Info). From 13
acquisitions, we found δ = 36.4 ± 1.9 nm (mean ± standard deviation).
After careful calibration of the demodulated signal, one obtain a mean absorption cross-section for
10 nm gold NPs of 41±16 nm2 (mean ± half width at half maximum, N=191) at 561 nm excitation
wavelength (Figure 2e). This is in excellent agreement with the value of 42 nm2 predicted by the Mie
theory18, 19
for a particle surrounded by a medium of refraction index of 1.50. Noteworthy, the
dispersion in the measured NP absorption cross-section (33%) is mainly imposed by the NP size
dispersion (30% in volume), since the measurement uncertainties play here a minor role (see below).
This measurement demonstrates that our experimental procedure allows quantitative determination of
small nano-object absorption cross-sections.
We then consider (6,5) SWCNTs to achieve precise characterization of their absorption cross-section.
Raw HiPco SWCNTs were solubilized in 1% aqueous sodium deoxycholate (DOC) using brief tip
sonication followed by bench-top centrifugation to remove un-solubilized material from the
suspension. Nanotubes are deposited on cleaned glass coverslip and covered with immersion oil for
further analysis. In order to identify long individual (6,5) SWCNTs, single-molecule wide-field
photoluminescence (PL) microscopy is first performed with a detection window around their S11
emission transition (985 nm)20
. Figure 3a shows bright individual (6,5) nanotubes displaying uniform
luminescence.
The selected nanotubes are then imaged using the modulated absorption method. Since the signal
amplitude and profile depend on the nanotube orientation with respect to the beam modulation axis,
the measurements are performed only on long nanotubes perpendicular to y-axis (Figure, 3b).
Furthermore, the laser polarization is set along the nanotube for maximum interaction21
. To ensure that
the nanotubes are isolated from other nanotube species or from catalyst impurities, always abundant in
nanotubes samples, we performed photothermal heterodyne microscopy on the same sample region22,
23. In this case, we use circularly polarized excitation to obtain images independent from tube
orientations (Figure 2c and Figure 3S, Supp. Info). The perfect correlation between PL, photothermal
and modulated absorption images allows assigning the individual (6,5) nanotubes without ambiguities.
σAu
σ Au =πe1/2
8
w0
3
δ
App
Pinc

In contrast to gold nanoparticles, which can be considered infinitely small compared to the beam
profile, the 1D geometry of the nanotube has to be taken into account in the derivation of demodulated
power:
where L is the SWCNT length
and the number of carbon atoms per tube length ( = 88271 µm-1
for (6,5) nanotubes). Figure 3d displays the signal profile along the y-axis measured
around the middle part of the tube at excitation power of 70 µW.
In the case of nanotubes significantly longer than the diffraction limit (i.e. L>1µm), can be
expressed as a function of Αpp using: . The excitation laser wavelength is
being not strictly resonant with the S22 transition; one has to account for the dependence of the
absorption on the excitation wavelength to provide a value for at the peak of this transition. For
this purpose, we acquired photoluminescence excitation (PLE) of individual (6,5) nanotubes prepared
following the same sample procedure as for absorption measurements because the optical spectra
depend on the nanotube local environment. A tunable dye laser (emission range 540-590 nm) is used
for excitation and the SWCNT luminescence signal was recorded at low excitation intensities to avoid
any saturation effect. PLE spectra displayed systematically a Lorentzian profile24
with a peak S22
transition found at 569±2 nm (Figure 4S, Supp. Info). From 8 spectra acquired, a correction factor of
1.47 ± 0.12 is deduced allowing the determination of at the S22 peak transition using the
measurements performed with low noise solid-state laser at 561 nm. Figure 3e displays the histogram
measured on 73 different (6,5) nanotubes. A unimodal distribution is obtained providing a clear
signature that all data points stem from individual chirality identified nanotubes. The histogram is well
adjusted with a Gaussian distribution centered at 3.2 10-17
cm2 with a half-width-at-half maximum of
0.5 10-17
cm2. This value compares to the upper range of previous indirect estimations of (Figure
3f)14
. Importantly, this obtained value originates from direct measurements (model independent),
therefore, we can determine both its precision and its exactitude in a straightforward manner. The
relative error on the predetermination of w0 (2%, which translate to 4% error on ), δ (5%) and the
excitation wavelength correction factor (9%) might induce a systematic bias on the determination of
thus affecting its exactitude by up to 18%. Furthermore, we estimate the precision of this
measured value to be 15% stemming from as a 10% noise-to-signal ratio for Αpp, a 1% precision in the
determination of the beam power and 2% fluctuations on w0 due to sample-to-sample focusing. We
Pmod(x, y) = −
8
π
δ
w0
3PincnCσCye
−2 y2
w02
erf2
w0
(x +L
2)
"
#$
%
&'− erf
2
w0
(x −L
2)
"
#$
%
&'
"
#$$
%
&''
nC
nC
Pmod(x = 0, y)
σC
σ c =2π e1/2
8
w0
2
ncδ
App
Pinc
σC
σC
σC
σC
σC
σC

thus conclude that the measured spread of the data (±16 %) displayed on figure 4b reflects the
precision on the determination of while its exactitude lies within 18%.
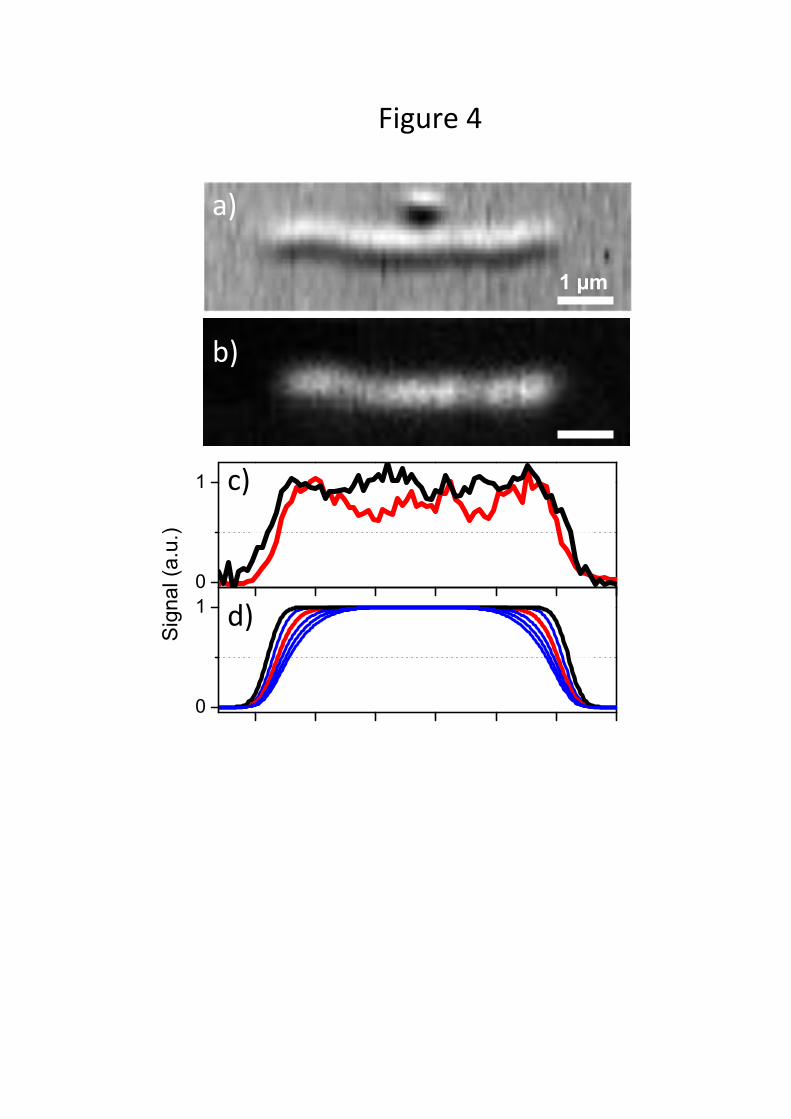
Correlative imaging (luminescence versus absorption) of long carbon nanotube provide a direct
evidence of exciton diffusion and a straightforward determination of the exciton diffusion length
before its recombination25, 26
. Previous determinations rely on stepwise quenching of nanotube
luminescence by chemical reactions27, 28
, by ensemble studies of the length dependence of PL
efficiency29
or on studying the luminescence spatial profile at nanotube ends30
. In the latter case,
determination of lD relies on fitting carefully the intensity profile at the nanotube end where local
quenching occurs.
Here we show that by simultaneous acquisition of the luminescence and absorption profiles, lD can be
directly determined by confronting the apparent nanotube ends between the two imaging modalities.
To this aim, individual nanotubes were imaged by confocal luminescence and spatial modulation
absorption microscopies with the same confocal excitation beam (Figure 4a-b). Comparison of the
images reveals that nanotube PL profiles appear systematically shorter than absorption ones (Figure
4c). This is a direct consequence of exciton diffusion. The apparent nanotube ends appear separated by
~ 150 nm between the two images. Using a simple 1D exciton diffusion model (Supp. Info) with
quenching at nanotube ends, we simulated the expected PL and absorption profiles obtained in our
confocal microscope for lD varying from 0 to 500 nm. The best agreement with the experiments is
found for lD ≈ 200 nm (figure 4d). This value is in agreement with previous determinations for
nanotube suspended in DOC30, 31
.
In conclusion, we measured the absorption cross-section of (6,5) carbon nanotubes at their second
order optical transition and obtained a value of 3.2 10-17
cm2 per carbon atom. This constitutes the first
metrological investigation of the absorption cross-section of chirality-identified nanotubes. Beside its
importance for fundamental investigations of nanotube physical properties (e.g. accurate determination
of exciton rate generation), this value is also essential for carbon nanotube material science and a key
parameter for exploiting the large application potential that nanotubes offer in optoelectronics and
photovoltaics.
ACKNOWLEDGMENT. This work was funded by the Agence Nationale de la Recherche, Région
Aquitaine, DGA and the European Research Council.
§ present address: Los Alamos National Laboratory, Los Alamos, NM 87545
σC

REFERENCES
1. De Volder, M. F. L.; Tawfick, S. H.; Baughman, R. H.; Hart, A. J., Carbon Nanotubes: Present
and Future Commercial Applications. Science 2013, 339, 535‐539.
2. Avouris, P.; Appenzeller, J.; Martel, R.; Wind, S. J., Carbon nanotube electronics.
Proceedings of the IEEE 2003, 91, 1772‐1784.
3. Wang, F.; Dukovic, G.; Brus, L. E.; Heinz, T. F., The optical resonances in carbon nanotubes
arise from excitons. Science 2005, 308, 838‐41.
4. Maultzsch, J.; Pomraenke, r.; Reich, S.; Chang, E.; Prezzi, D.; Ruini, A.; Molinari, E.; Strano,
M. S.; Thomsen, C.; Lienau, C., Exciton binding energies in carbon nanotubes from two‐photon
photoluminescence. Phys. Rev. B 2005, 72, 241402R.
5. Jorio, A.; Dresselhaus, G.; Dresselhaus, M. S., Carbon Nanotubes: Advanced topics in the
synthesis, structure, properties & applications Springer: Berlin, New‐York, 2008; p 720. 6. Islam, M. F.; Milkie, D. E.; Kane, C. L.; Yodh, A. G.; Kikkawa, J. M., Direct measurement of
the polarized optical absorption cross section of single‐wall carbon nanotubes. Phys. Rev. Lett.
2004, 93, 037404.
7. Zheng, M.; Diner, B. A., Solution Redox Chemistry of Carbon Nanotubes. Journal of the
American Chemical Society 2004, 126, 15490‐15494.
8. Carlson, L. J.; Maccagnano, S. E.; Zheng, M.; Silcox, J.; Krauss, T. D., Fluorescence Efficiency
of Individual Carbon Nanotubes. Nano Lett. 2007, 7, 3698‐3703.
9. Schöppler, F.; Mann, C.; Hain, T. C.; Neubauer, F. M.; Privitera, G.; Bonaccorso, F.; Chu, D.;
Ferrari, A. C.; Hertel, T., Molar Extinction Coefficient of Single‐Wall Carbon Nanotubes. J. Phys.
Chem. C 2011, 115, 14682‐14686.
10. Lefebvre, J.; Finnie, P., Polarized light microscopy and spectroscopy of individual single‐
walled carbon nanotubes. Nano Research 2011, 4, 788‐794.
11. Berciaud, S.; Cognet, L.; Lounis, B., Luminescence decay and the absorption cross section
of individual single‐walled carbon nanotubes. Phys. Rev. Lett. 2008, 101, 077402.
12. Georgi, C.; Hartmann, N.; Gokus, T.; Green, A. A.; Hersam, M. C.; Hartschuh, A.,
Photoinduced Luminescence Blinking and Bleaching in Individual Single‐Walled Carbon
Nanotubes. ChemPhysChem 2008, 9, 1460‐1464.
13. Santos, S. M.; Yuma, B.; Berciaud, S.; Shaver, J.; Gallart, M.; Gilliot, P.; Cognet, L.; Lounis, B.,
All‐Optical Trion Generation in Single‐Walled Carbon Nanotubes. Phys. Rev. Lett. 2011, 107,
187401.
14. Joh, D. Y.; Kinder, J.; Herman, L. H.; Ju, S.‐Y.; Segal, M. A.; Johnson, J. N.; ChanGarnet, K. L.;
Park, J., Single‐walled carbon nanotubes as excitonic optical wires. Nat Nano 2011, 6, 51‐56.
15. Christofilos, D.; Blancon, J. C.; Arvanitidis, J.; Miguel, A. S.; Ayari, A.; Del Fatti, N.; Vallée, F.,
Optical Imaging and Absolute Absorption Cross Section Measurement of Individual Nano‐objects
on Opaque Substrates: Single‐Wall Carbon Nanotubes on Silicon. The Journal of Physical
Chemistry Letters 2012, 3, 1176‐1181.
16. Arbouet, A.; Christofilos, D.; Del Fatti, N.; Vallee, F.; Huntzinger, J. R.; Arnaud, L.; Billaud,
P.; Broyer, M., Direct measurement of the single‐metal‐cluster optical absorption. Phys. Rev. Lett.
2004, 93, 127401.
17. Carey, C. R.; LeBel, T.; Crisostomo, D.; Giblin, J.; Kuno, M.; Hartland, G. V., Imaging and
Absolute Extinction Cross‐Section Measurements of Nanorods and Nanowires through
Polarization Modulation Microscopy†The Journal of Physical Chemistry C 2010, 114, 16029‐
16036.
18. Bohren, C. F.; Huffman, D. R., Absorption and scattering of light by small particles. J. Wiley
(New York) 1983.
19. Mie, G., Beiträge zur Optik trüber Medien, speziell kolloidaler Metallösungen. Ann. Phys.
1908, 330, 377–445
20. Duque, J. G.; Pasquali, M.; Cognet, L.; Lounis, B., Environmental and Synthesis‐Dependent
Luminescence Properties of Individual Single‐Walled Carbon Nanotubes. ACS Nano 2009, 3,
2153‐2156.
21. Lefebvre, J.; Finnie, P., Polarized Photoluminescence Excitation Spectroscopy of Single‐
Walled Carbon Nanotubes. Physical Review Letters 2007, 98, 167406.
22. Berciaud, S.; Cognet, L.; Blab, G. A.; Lounis, B., Photothermal Heterodyne Imaging of
Individual Nonfluorescent Nanoclusters and Nanocrystals. Phys. Rev. Lett. 2004, 93, 257402.
23. Berciaud, S.; Cognet, L.; Poulin, P.; Weisman, R. B.; Lounis, B., Absorption spectroscopy of
individual single‐walled carbon nanotubes. Nano Lett. 2007, 7, 1203‐1207.
24. Cambré, S.; Santos, S. M.; Wenseleers, W.; Nugraha, A. R. T.; Saito, R.; Cognet, L.; Lounis, B.,
Luminescence Properties of Individual Empty and Water‐Filled Single‐Walled Carbon
Nanotubes. ACS Nano 2012, 6, 2649‐2655.
25. Wang, F.; Dukovic, G.; Knoesel, E.; Brus, L. E.; Heinz, T. F., Observation of rapid Auger
recombination in optically excited semiconducting carbon nanotubes. Phys. Rev. B 2004, 70,
241403(R).
26. Ma, Y. Z.; Valkunas, L.; Dexheimer, S. L.; Bachilo, S. M.; Fleming, G. R., Femtosecond
spectroscopy of optical excitations in single‐walled carbon nanotubes: Evidence for exciton‐
exciton annihilation. Phys. Rev. Lett. 2005, 94, 1.
27. Cognet, L.; Tsyboulski, D. A.; Rocha, J. D.; Doyle, C. D.; Tour, J. M.; Weisman, R. B., Stepwise
quenching of exciton fluorescence in carbon nanotubes by single‐molecule reactions. Science
2007, 316, 1465‐8.
28. Cognet, L.; Tsyboulski, D. A.; Weisman, R. B., Subdiffraction Far‐Field Imaging of
Luminescent Single‐Walled Carbon Nanotubes. Nano Lett. 2008, 8, 749‐753.
29. Hertel, T.; Himmelein, S.; Ackermann, T.; Stich, D.; Crochet, J., Diffusion Limited
Photoluminescence Quantum Yields in 1‐D Semiconductors: Single‐Wall Carbon Nanotubes. ACS
Nano 2010, 4, 7161‐7168.
30. Crochet, J. J.; Duque, J. G.; Werner, J. H.; Lounis, B.; Cognet, L.; Doorn, S. K., Disorder
Limited Exciton Transport in Colloidal Single‐Wall Carbon Nanotubes. Nano Letters 2012, 12,
5091‐5096.
31. Siitonen, A. J.; Tsyboulski, D. A.; Bachilo, S. M.; Weisman, R. B., Surfactant‐Dependent
Exciton Mobility in Single‐Walled Carbon Nanotubes Studied by Single‐Molecule Reactions. Nano
Letters 2010, 10, 1595‐1599.

FIGURES CAPTIONS
Figure 1: Schematics of the experimental setup. A sample placed at the focal plane of a microscope
objective and containing isolated nano-objects (gold nanoparticle or carbon nanotubes) is mounted on
a piezo-scanner. An acousto-optic modulator is used to modulate the position of the exciting beam in
the sample plane (beam modulation amplitude of 36nm along the y-axis at 100kHz). The transmitted
beam is collected by second microscope objective and sent to a fast photodiode connected to a lock-in
amplifier. The signal is the demodulated power Pmod as a function of the sample position. A typical
profile shape of Pmod along the y-axis is illustrated (see text).
Figure 2: a) TEM image of 10nm individual gold NP used in this study. b) Histogram of the diameters
measured on 191 NP and its Gaussian fit. c) Modulated absorption image of a single 10 nm gold NP
excited at 561 nm (P0 = 650 µW, 25ms/pixel). d) Corresponding profile averaged over 4 lines of c). e)
Histogram of the absorption cross-sections deduced for 100 individual 10 nm gold NPs with its
Gaussian fit (see text).
Figure 3: Luminescence (a, 300 ms integration time), photothermal (b, 5 ms/pixel) and modulated
absorption (c, 25 ms/pixel) images of the same individual (6,5) carbon nanotube. Scale bars 1µm. d)
Absorption profile perpendicular to the nanotube axis averaged over 10 lines of c). e) Histogram of the
absorption cross sections deduced for 71 individual (6,5) carbon nanotubes and its Gaussian fit (see
text). The mean value of the distribution is 3.2 10-17
cm2 and its standard deviation 0.5 10
-17 cm
2. f)
Comparison with the values reported in the literature for (6,5) nanotubes (all values were normalized
to an excitation at the S22 transition with a polarization along the nanotube axis): 6;
7;
8;
11;
9;
14; this work.
Figure 4: Confocal microscopy images ((a) modulated absorption, (b) luminescence, 50ms/pixel) of an
individual (6,5) carbon nanotube using the same excitation beam. c) Corresponding absorption (black)
and luminescence (red) profiles along the nanotube axis. d) Simulated profiles using a 1D diffusion
equation (see text and Supp. info): absorption (black) and photoluminescence (red and blue) for
varying diffusion lengths (100 to 500 nm). The best agreement with experiments is obtained for lD
=200 nm (red).


0 40 80
0
20
Counts
σAu,(nm²)
6 8 10 12 14
0
50
Counts
Diameter4(nm)
50.6
50.8
51
51.2
51.4
0.0 0.5 1.0
%50
0
50
!
Power+(n
W)
y +(µm)
250'nm'
50'nm'
a)' b)'
c)'
d)'
e)'
Figure'2'

2004 2007 2010 2013
0.1
1
10
!
!
σC)(x)10
,17)cm²)
Year2 3 4
$10
0
10
!P((nW
)
y ((µm)
a)' e)'
c)' d)'
b)'
f)'
0 3 60
20
Counts
σC +(x +10
/17+cm²)
Figure'3'
0
1
0
1
Sig
nal (a
.u.)
1 µm
a)'
b)'
c)'
d)'
Figure'4'


