
Tom Bruulsema, Phosphorus Program DirectorGuelph, ON, Canada
Metrics of sustainable phosphorus management
Trent University, Peterborough, OntarioTuesday, 13 June 2017

The International Plant Nutrition Institute is supported by leading fertilizer manufacturers.
Its mission is to develop and promote science for responsible management of crop nutrition.

Outline – metrics of sustainable P management
1. Sustainability Perspectives
– Ecosystem services
– Global stocks and flows
2. Metrics & Indicators
– Balances, footprints, and use efficiency
– Soil tests: up to the task?
3. Quantification of management impacts
– 4R Research efforts
http://phosphorus.ipni.net/

Phosphorus Sustainability Perspectives
• Food industry
– Needs clear simple metrics of sustainability impact
• Producers
– Burden of sustainability reporting requirements
• Scientists
– Management impact on P loss too complex to quantify
– Lack of consensus on metrics and material flows

Ecosystem ServicesFood-fiber-fuelNutrient cycling
C storageWater retention
Landscape aesthetic
Impacts of PCrop productivity
BiodiversityWater quality
FishRecreation
Property value
Adapted from MacDonald et al 2017

4R Phosphorus for Sustainable Crop Nutrition
Actions(adoption metrics)
Key Outcomes(impact metrics)
1. Farmland productivity
2. Soil health
3. Nutrient use efficiency
4. Water quality

Global P material flow analysis
Cordell & White, 2014
PUE: 19% (3.5/18)
Loss ratio:[2009] 46%[here] 28% [Bouwman et al., 2009] 14% (fert only) or 6% (all inputs)
5±3 Tglosses

Watershed scale: Maumee River
River export: 5-20% of fertilizer input
Powers et al., 2016. Nature Geoscience 9(5):353-356.
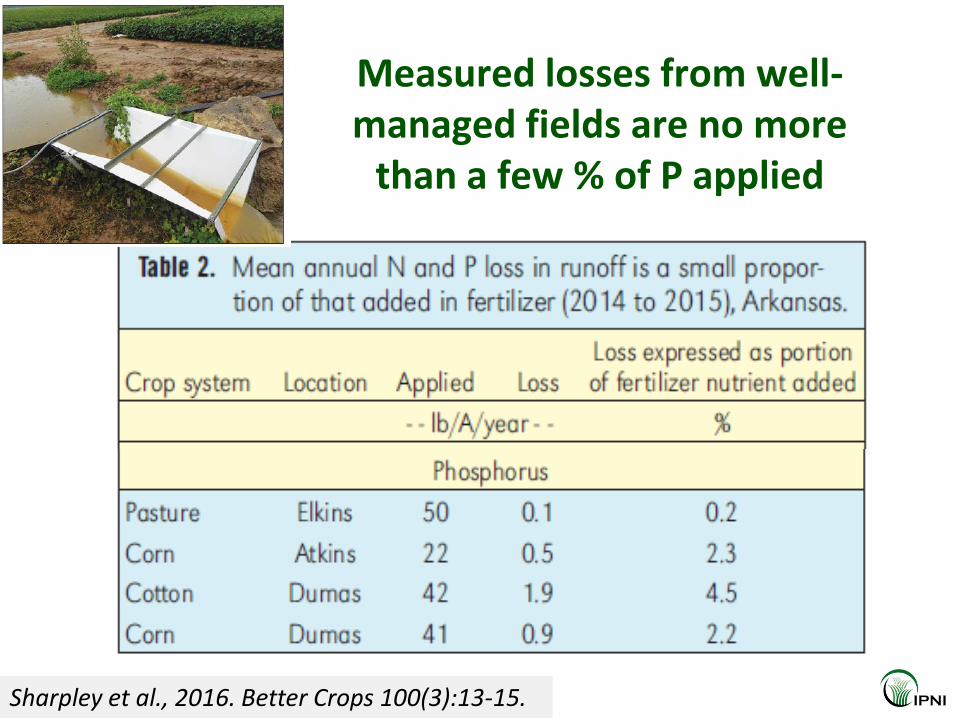
Measured losses from well-managed fields are no more
than a few % of P applied
Sharpley et al., 2016. Better Crops 100(3):13-15.

North American Phosphorus Balance, 1900-2010
Zhang, Beusen, et al., 2017. Biogeosciences, 14, 2055–2068.
(off-take)

Soil Erosion:making progress?
Terra MODIS Direct Broadcast Images 7 May 2017

The Dubious Relationship
Between P Use
Efficiency and Loss
Mitigation

Western Lake Erie: dissolved P trends increasing since 2002
Jarvie et al., 2016, J Environ. Qual.
Cu
mu
lati
ve D
RP
load
(kg
P2O
5 h
a-1)
0
4
8
2
16
2
0
0.8 kg P2O5
ha-1 y-1
0.4 kg P2O5 ha-1 y-1
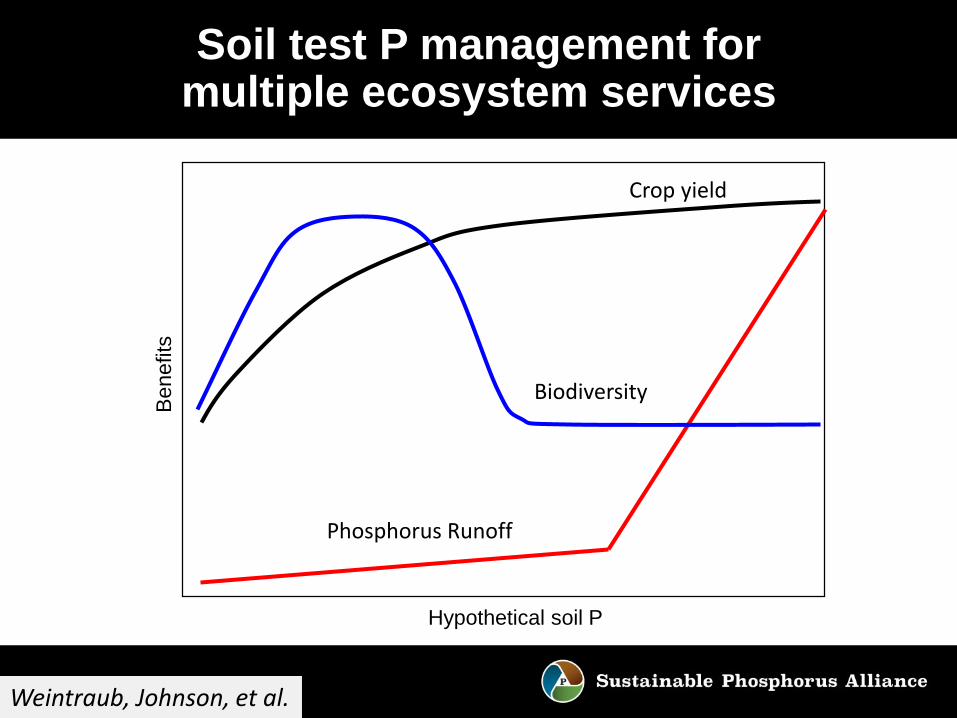
Soil test P management for multiple ecosystem services
Bene
fits
Phosphorus Runoff
Hypothetical soil P
Crop yield
Biodiversity
Weintraub, Johnson, et al.

Australia – Better Fertilizer Decisions for Crops
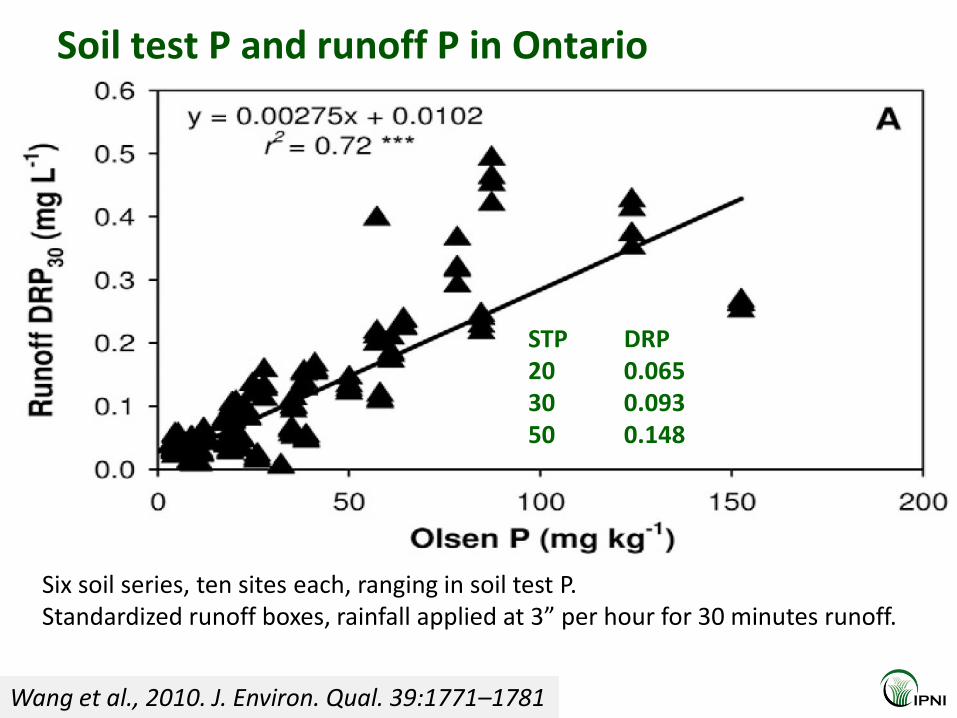
Soil test P and runoff P in Ontario
STP DRP20 0.06530 0.09350 0.148
Wang et al., 2010. J. Environ. Qual. 39:1771–1781
Six soil series, ten sites each, ranging in soil test P.Standardized runoff boxes, rainfall applied at 3” per hour for 30 minutes runoff.

East versus West: a contrast in soil test P
http://soiltest.ipni.net
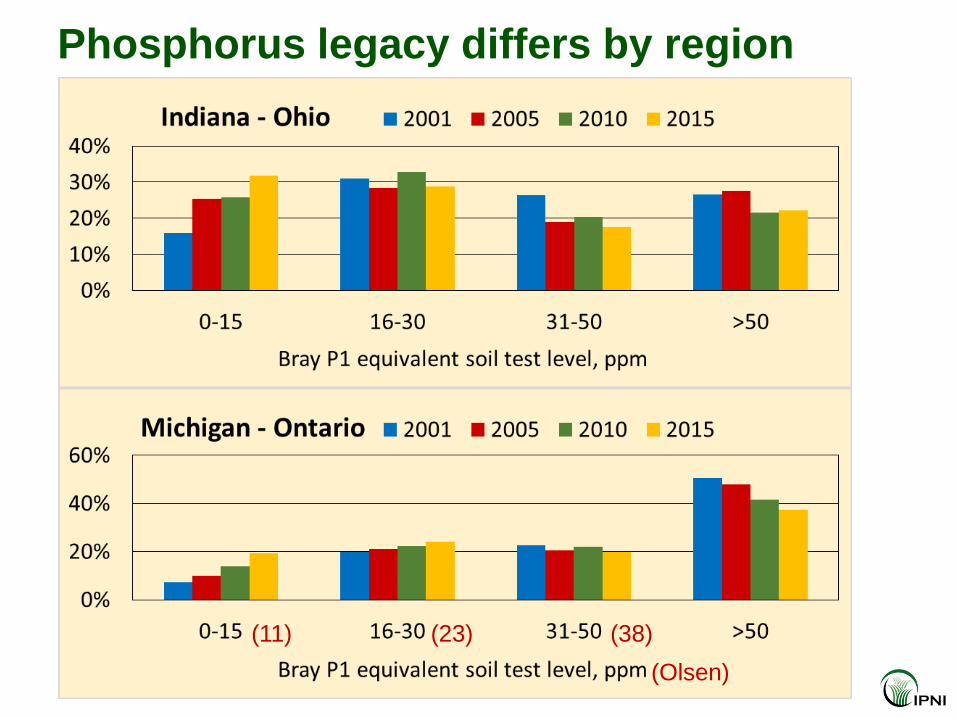
Phosphorus legacy differs by region
(Olsen)
(11) (23) (38)

Soil Drainage Research Unit
4R Research Fund USA-4RN09USDA-ARS: USDA-Agriculture Research ServiceCEAP: Conservation Effects Assessment ProjectEPA: DW-12-92342501-0Ohio Agri-BusinessesOhio Corn and Wheat Growers
Funding Sources:
CIG: 69-3A75-12-231 (OSU)CIG: 69-3A75-13-216 (Heidelberg University)MRBI: Mississippi River Basin InitiativeThe Nature ConservancyBecks Hybrids/Ohio State UniversityOhio Soybean Association
Kevin King, USDA-ARS, Columbus, Ohio
4R Research FundLEW project:Monitoring P loss at edge of field & in stream
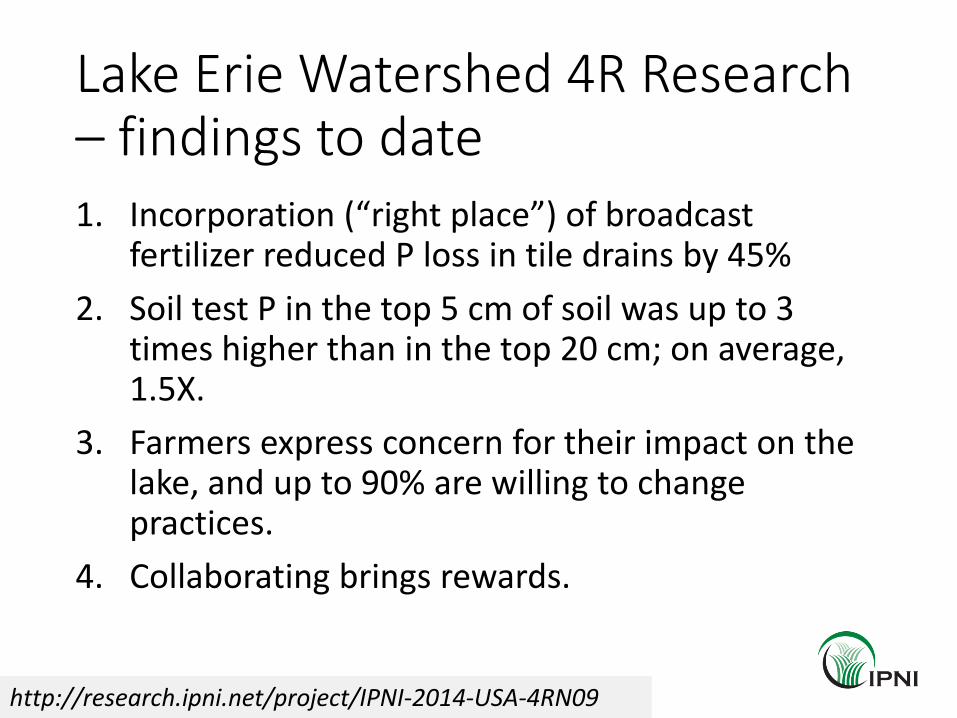
Lake Erie Watershed 4R Research – findings to date1. Incorporation (“right place”) of broadcast
fertilizer reduced P loss in tile drains by 45%
2. Soil test P in the top 5 cm of soil was up to 3 times higher than in the top 20 cm; on average, 1.5X.
3. Farmers express concern for their impact on the lake, and up to 90% are willing to change practices.
4. Collaborating brings rewards.
http://research.ipni.net/project/IPNI-2014-USA-4RN09

http://phosphorus.ipni.net/

Participating Scientists 1. Brian Arnall, Oklahoma State U2. Doug Beegle, Penn State U3. Don Flaten, U of Manitoba4. Laura Good, U of Wisconsin5. Kevin King, USDA-ARS, Columbus, OH6. Quirine Ketterings, Cornell U7. Josh McGrath, U of Kentucky8. Antonio Mallarino, Iowa State U
9. Rao Mylavarapu, U of Florida with input from other colleagues.
10. David Mulla, U of Minnesota11. Nathan Nelson, Kansas State U12. Keith Reid, Agriculture and Agri-
Food Canada13. Nathan Slaton, U of Arkansas -
with input from Bruce Linquist, UC-Davis, Bobby Golden, Mississippi State U, Dustin Harrell, Louisiana State U.
14. Charles Shapiro, U of Nebraska15. Andrew Sharpley, U of Arkansas16. Doug Smith, USDA-ARS, Temple,
TX17. Ivan O’Halloran, U of Guelph18. Deanna Osmond, North Carolina
State U19. David Tarkalson, USDA-ARS,
Kimberly, ID - with input from Bryan Hopkins, Brigham Young U, and others.

Regions and Cropping Systems
2011 National Land Cover Database - http://www.mrlc.gov
1
5
4
3
2
1. Western Corn and Soybean
2. Eastern Cereals and Oilseeds
3. Wheat in the Great Plains
4. Irrigated Potatoes in the Northwest
5. Rice
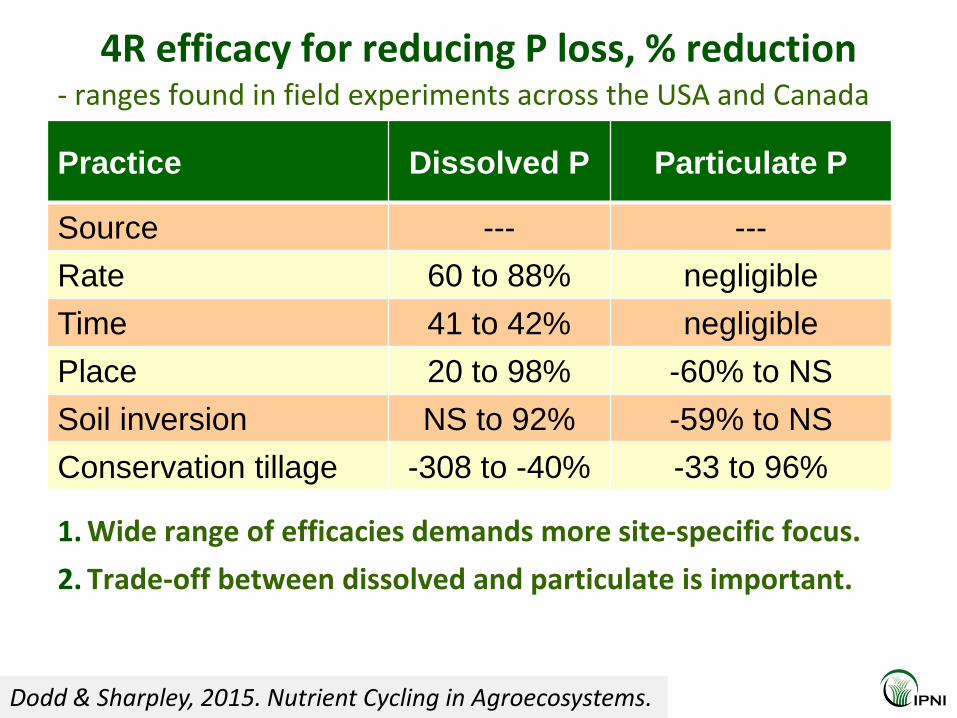
4R efficacy for reducing P loss, % reduction
1. Wide range of efficacies demands more site-specific focus.
2. Trade-off between dissolved and particulate is important.
Practice Dissolved P Particulate P
Source --- ---
Rate 60 to 88% negligible
Time 41 to 42% negligible
Place 20 to 98% -60% to NS
Soil inversion NS to 92% -59% to NS
Conservation tillage -308 to -40% -33 to 96%
- ranges found in field experiments across the USA and Canada
Dodd & Sharpley, 2015. Nutrient Cycling in Agroecosystems.
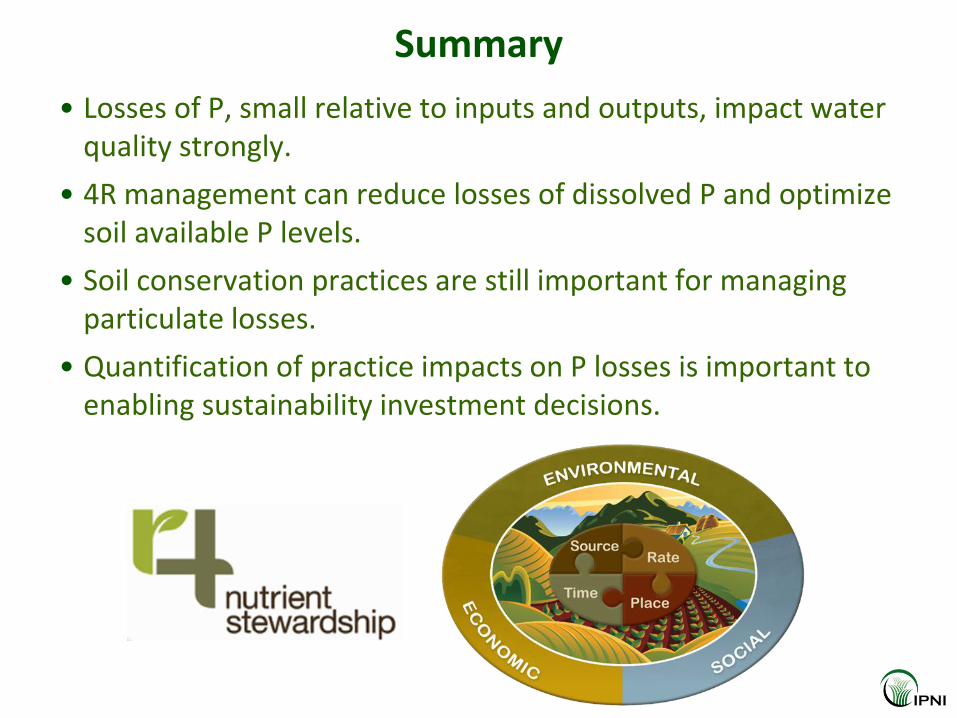
Summary
• Losses of P, small relative to inputs and outputs, impact water quality strongly.
• 4R management can reduce losses of dissolved P and optimize soil available P levels.
• Soil conservation practices are still important for managing particulate losses.
• Quantification of practice impacts on P losses is important to enabling sustainability investment decisions.


