
1
CLOVER INDUSTRIES LIMITED
Merrill Lynch conference
Sun City – 15 March 2013

2
AGENDA
• Introduction & background
• Business drivers
• Challenges
• Potential
• What keeps us awake

3
INTRODUCTION
AND BACKGROUND

4
CLOVER IS…
• A JSE listed Branded Consumer Goods (BCG) Company with a
114 year heritage
• One of the largest distribution companies in SA
• The largest chilled distributor in South Africa
• Substantial critical mass due to its milk delivery frequency
• Strong Beverages brand portfolio

5
The of Italy
The of New Zealand
The of France
The of Spain
The of Argentina
CLOVER IS…

6
Vision
To be a leading branded foods and beverages group in South Africa and
selected African countries, providing accessible nutrition to all consumers
Mission
Clover's mission is to reach the Group’s widely dispersed customers on a daily
basis, and to provide trusting consumers with quality products through its
extensive network underpinned by its leading dairy business. Care is taken to
develop or acquire brands which have the potential to occupy the number one or
two positions in their chosen segments. It focusses on way better operations
across the supply chain including services to the trade, and on delivering
sustainable shareholder value by being a responsible corporate citizen and
preferred employer

7
OUR BRANDS

8
KEY RECENT EVENTS
Change in mind-set
at Clover
Evolution of the
business platform
from a co-operative
dynamic to a
corporate dynamic
Achieved with the
full support of milk
producers
Clover positioned to raise capital
to implement growth and efficient plans
2003
2006
2007
2010
2011
• National Co-operative Dairies Limited converted to Clover Industries Limited
• Fundamental shift from a “supply driven” company to a “demand driven” company
• Clover SA acquires Danone’s 39.5% shareholding in Clover Beverages
• Sale of UltraMel custard brand to Danone
• Sale of 45% shareholding in Danone Clover for R1.08bn to Danone
• Dual share structure abolished
• Delinking of ordinary shares from milk delivery agreements together with the
amendment to the rights attached to the preference shares
• Buy-back of Hosken Consolidated Investments ordinary shares
• Listing on the JSE
• Buy out of minority shareholders in Clover Beverages Limited
• Transfer of the Clover Beverages business into Clover SA

9
THE SOUTHERN AFRICAN DAIRY MARKET
• South African national dairy production is ±2,7bn litres
• The market is predominantly a liquid (drinking) milk market
• Fresh milk constitutes the majority of the liquid milk market
• The annual market is approximately R36bn for dairy based products
• Clover buys approximately 24% of national milk production
(including milk for Danone)
• Import potential limited to cheese, butter, powders and long life milk
• Unlike Europe and the USA liquid milk is still very much a branded domain
with DOB market shares in the top end (Spar, Shoprite, Pick n Pay) being:
› Fresh milk 31%
› UHT 45%
› Butter 28%
› Cheese 12%

10
THE SOUTHERN AFRICAN
NON-ALCOHOLIC BEVERAGE MARKET
• South African national market for non-alcoholic beverages is ±R56bn
• Markets not currently serviced and investigated by Clover are:
› Carbonated beverages
› Long life fruit drinks
11
0
10
20
30
40
50
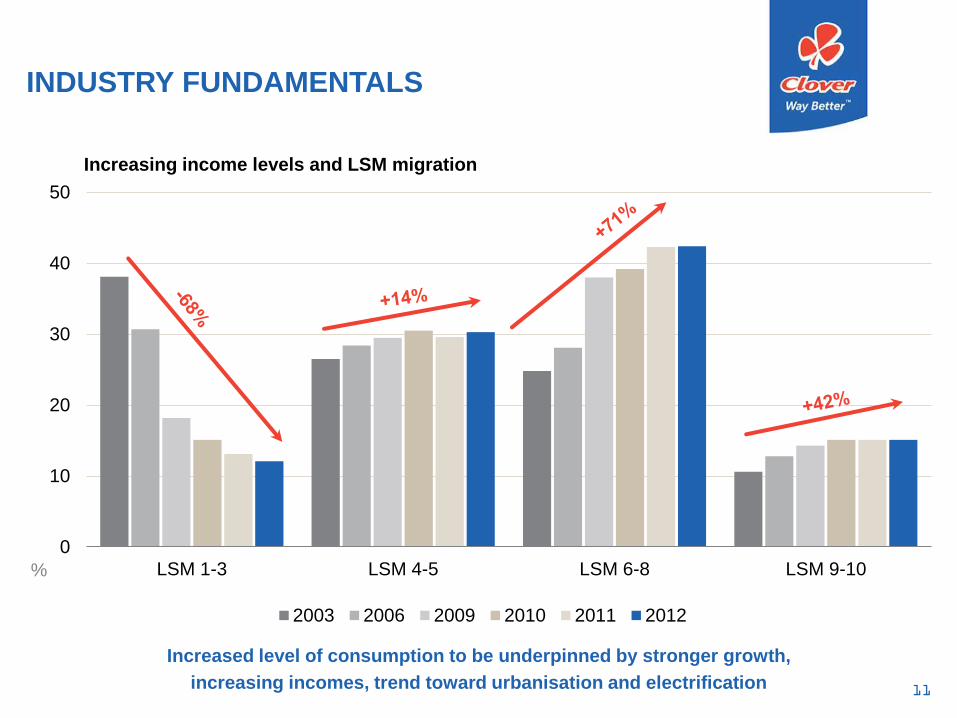
LSM 1-3 LSM 4-5 LSM 6-8 LSM 9-10%
Increasing income levels and LSM migration
2003 2006 2009 2010 2011 2012
INDUSTRY FUNDAMENTALS
Increased level of consumption to be underpinned by stronger growth,
increasing incomes, trend toward urbanisation and electrification

12
MILK CONSUMPTION PER CAPITA

13
100% JUICE AND NECTAR
ANNUAL CONSUMPTION PER CAPITA
33.331.3
27.826.6
22.8
8.7 8.0
2.41.1
0
5
10
15
20
25
30
35
Germany Finland USA France UK SouthAfrica
Mexico Brazil NigeriaLitresper capita
Developed market median of 28 litres per capita

14
KEY BUSINESS DRIVERS

15
KEY BUSINESS DRIVERS
• Strong brands with leading market position
• Extensive distribution platform
• Increasing efficiencies and capacity (Project Cielo Blu)

16
STRONG BRANDS WITH LEADING MARKET POSITION

17
STRONG BRANDS
123
123
123
123
124
126
126
127
132
134
Cadbury
Handy Andy
Nokia
Standard…
Woolworths
KFC
Shoprite
Clover
Coca-Cola
Pick 'n Pay
SA top 10 most engaging brands
1.92
1.95
2.03
2.08
2.43
2.44
3.00
3.00
4.00
16.00
BMW
Levi
Nokia
SAB
KFC
Clover
Nike
KOO
Vodacom
Coca-Cola
SA’s most favourite brand
This is a totally spontaneous mention question –
people can vote for any brand they love

18
34
34
35
35
36
37
37
37
39
40
41
43
45
46
46
47
47
47
47
48
50
50
50
55
57
57
60
65
0 10 20 30 40 50 60 70
Aromat
Simba
All Gold
Eskort
Koo fruit
Pick n Pay
Jik
Black & Crosswell
Ackermans
Vodacom
KFC
Clover
Nokia
Sunlight
MTN
Dulux
Jet
Black Cat
JC Le Roux
Albany
Coca-Cola
Robertsons
Sunlight
Koo
Mr Price
Huletts
All Gold
Edgars
Average
STRONG BRANDS
15 236 interviews over 10 months across 8 000 brands in 450 product categories

19
Clover awards: F2012/13
Awards Brand Comments
Apex Awards Tropika Bronze Sustainable brand in marketing and business
Arrow Awards
Tropika
Clover Krush
Clover Milk
Clover Cheese
Diamond
Diamond
1st (Gold)
1st (Gold)
Best marketing campaign
Most successful product launch
Sunday Times
Top Brands
Tropika
Krush
Top 3
Winner
Sunday Times
Youth SurveyTropika Top 10
6th
4th
Cold drinks
Dairy drinks category
Products
of the Year
Danao
Clover UHT Prisma
Clover 800g Cheese
Winner
Innovation
Icon Brands
2012
Clover Fresh Milk
Clover Cheese
Icon status
3rd Dairy category
STRONG BRANDS

20
TANGIBLE BRAND PREMIUMS
10%13%
23%
-7%
23%
29%
3%
32%
8%
-12%-10%
20%
13%11%
40%
Clover 2ltFresh
Clover 1LUHT milk
Fresh Milk1L
CloverFeta
cheese400gr
CloverPre-packNaturalCheese240gr
Elite Pre-pack
NaturalCheese300gr
CloverPre-packNaturalCheese450gr
Tropikadairy fruit
mix 2lt
Krush purefresh juice
1.5lt
Manhattanice tea500ml
Aquartz500ml Still
water
Super Mflavoured
milk 300ml
FreshCream250ml
Butter -Mooi River
500gr
Danao 1Ldairy fruit
mix

21
MARKET POSITION
Source: Aztec (Total Defined Supermarkets (Incl Pnp Grp, Shprt/Checkers Grp, Spar Scanning Grp)
Note: The Krush & Quali fresh juices market shares include the real Beverage Co. market shares for all three years
28.4% 29.0%31.0%
Dec 10 Dec 11 Dec 12
Fresh and UP milk
24.7% 25.6%
19.6%
Dec 10 Dec 11 Dec 12
UHT milk
40.0% 38.8%41.7%
Dec 10 Dec 11 Dec 12
Cream
47.0% 46.6% 46.6%
Dec 10 Dec 11 Dec 12
Krush and Quali fresh juices
38.5%
30.2%
36.9%
Dec 10 Dec 11 Dec 12
Feta cheese
47.2% 45.4%40.2%
Dec 10 Dec 11 Dec 12
Pre-packed cheese
22
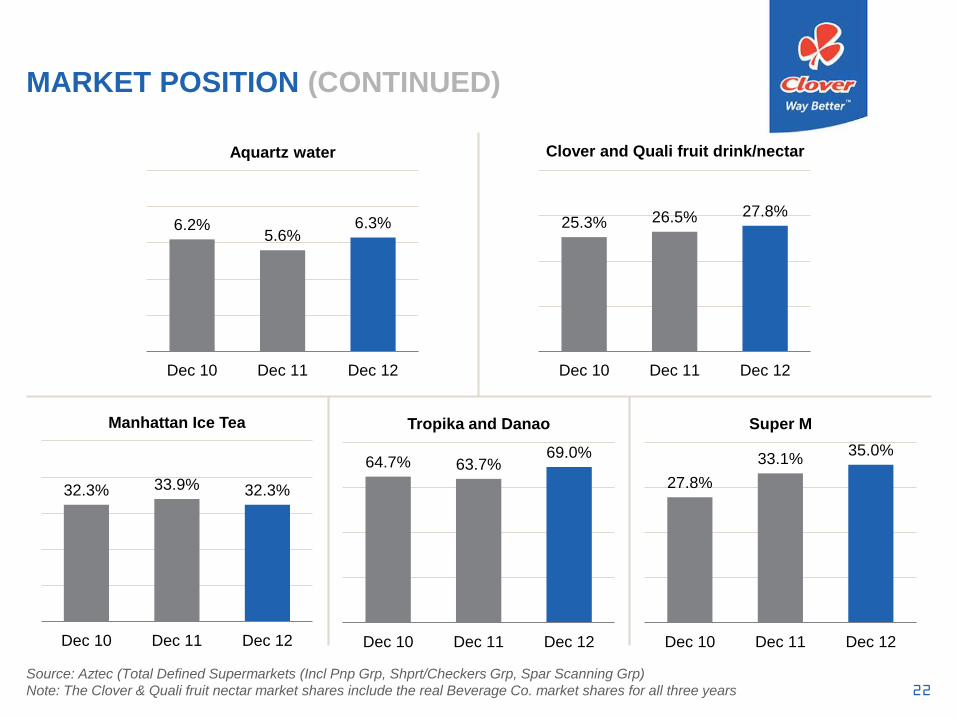
6.2%5.6%
6.3%
Dec 10 Dec 11 Dec 12
Aquartz water
25.3% 26.5% 27.8%
Dec 10 Dec 11 Dec 12
32.3% 33.9% 32.3%
Dec 10 Dec 11 Dec 12
Manhattan Ice Tea
64.7% 63.7%69.0%
Dec 10 Dec 11 Dec 12
Tropika and Danao
27.8%
33.1%35.0%
Dec 10 Dec 11 Dec 12
Super M
MARKET POSITION (CONTINUED)
Source: Aztec (Total Defined Supermarkets (Incl Pnp Grp, Shprt/Checkers Grp, Spar Scanning Grp)
Note: The Clover & Quali fruit nectar market shares include the real Beverage Co. market shares for all three years
Clover and Quali fruit drink/nectar

23
EXTENSIVE DISTRIBUTION PLATFORM

24
EXTENSIVE DISTRIBUTION NETWORK
Distribution network
is a key enabling
platform, is a
sustainable
competitive
advantage and is
central to the growth
prospects of Clover
Deep penetration
with c. 14,000
delivery points with
high frequency of
delivery due to milk

25
INCREASING EFFICIENCIES AND CAPACITY
(PROJECT CIELO BLU)

26
INCREASING EFFICIENCIES:
PROJECT CIELO BLU
Project Cielo Blu creates
efficiencies in production and
capacities in the distribution
network to support current and
future growth
Project Cielo Blu seeks to:
• Address historical
inefficiencies in the supply
chain
• Create capacity to sustain
growth of the business
• Improve profitability
Mayfair beverages production
moved to Clayville facility
JohannesburgPretoria
Port ElizabethCape Town
Durban
Clayville UHT facilities
moved to Pinetown
and Port Elizabeth
Clayville, Queensburgh and
PE distribution capacity
extensions

27
73 48 34 019 71 58 10
73
120
154 154
19
90
148157
0
50
100
150
200
0
20
40
60
80
2010/11 2011/12 2012/13 2013/14
Cum
ula
tive c
apex s
pend (
Rm
)
Annual ca
pe
xsp
en
d (
Rm
)
Capex expenditure: planned August 2010 Capex expenditure: updated January 2013
Original cumulative estimate Updated cumulative estimate
PROJECT CIELO BLU
PRODUCTION: CAPITAL EXPENDITURE

28
4
12
36
63
5
13
27
60
0
10
20
30
40
50
60
70
2010/11 2011/12 2012/13 2013/14Rm
Original projected annual savings Updated projected annual savings
PROJECT CIELO BLU
PRODUCTION: SAVINGS (EBITDA)

29
147 16 2069 12 82 21
147
163
184 184
6981
163
184
0
50
100
150
200
0
40
80
120
160
2010/11 2011/12 2012/13 2013/14
Cum
ula
tive c
apex s
pend (
Rm
)
An
nu
al ca
pe
x s
pe
nd
(R
m)
Capex expenditure: planned August 2010 Capex expenditure: planned December 2012
Original cumulative estimate Updated cumulative estimate
PROJECT CIELO BLU
DISTRIBUTION: CAPITAL EXPENDITURE
30
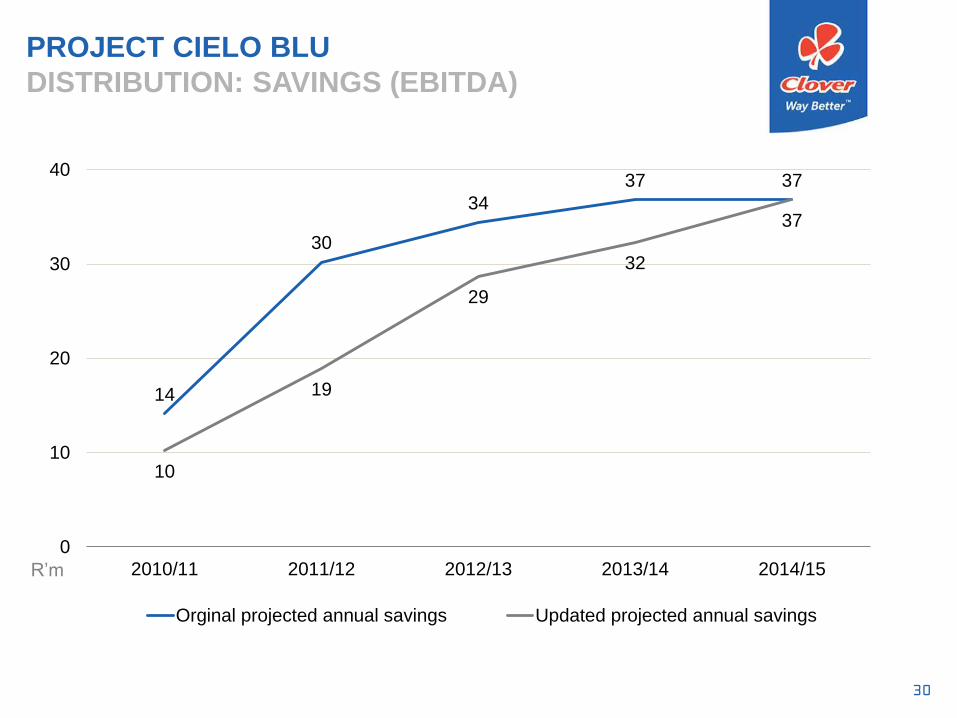
PROJECT CIELO BLU
DISTRIBUTION: SAVINGS (EBITDA)
14
30
34
37 37
10
19
29
32
37
0
10
20
30
40
2010/11 2011/12 2012/13 2013/14 2014/15R’m
Orginal projected annual savings Updated projected annual savings

31
CHALLENGES
FACING THE BUSINESS

32
CHALLENGES FACING THE BUSINESS
Africa expansion
• Pilot project in Nigeria with Tropika dairy fruit mix
• Contract manufacturing by Nigerian company
• Sales and distribution partner
• Aim of pilot is to understand route to market
• Production facilities are key to sustainable model and search is on
• Eventual aim to expand product basket
• Existing presence in Southern African countries with view to expand
influence

33
CHALLENGES FACING THE BUSINESS
Balancing local milk production with local demand
• Milk producers require growth in excess of local market growth
• Traditionally not sufficient raw milk balancing capacity in SA
• Much more long life capacity created in last 18 months
• Locally produced product not always internationally competitive:
› Foreign farmer subsidies
› Economies of scale
• Strong growth in SA exports

34
POTENTIAL

35
ATTRACTIVE GROWTH PROSPECTS
clover
Leveraging
the sales and
distribution
network
Leveraging
the brand
– immense
potential
Product
innovation
Product
extension
Supply chain
cost
efficiencies
Route
to market
FMCG
industry
consolidation
Africa
36
WHAT KEEPS US AWAKE

37
WHAT KEEPS US AWAKE
• Project Cielo Blu implementation:
› Within budget
› Achieving projected benefits
› On time
• Prioritisation of capital for productivity and expansion projects
• Balancing short term shareholder expectations with long term
strategic direction

38
DISCLAIMER
This report contains certain forward-looking statements. Forward-looking statements include, but are not limited to, those with
respect to capital expenditures, cost savings associated with capital projects, timing of capital projects, currency fluctuations,
national milk production, farm gate inflation and expected selling price movements. In certain cases, forward-looking statements
can be identified by the use of words such as "plans", "expects" or "does not expect", "is expected", "budget", "scheduled",
"estimates", "forecasts", "intends", "anticipates", or "does not anticipate", or "believes" or variations of such words and phrases,
or state that certain actions, events or results "may", "could", "would", "might" or "will" be taken, occur or be achieved. Forward-
looking statements involve known and unknown risks, uncertainties and other factors which may cause the actual results,
performance or achievements of the Company to be materially different from any future results, performance or achievement
expressed or implied by the forward-looking statements. Although the Company has attempted to identify important factors that
could cause actual actions, events or results to differ materially from those described in forward-looking statements, there may
be other factors that cause actions, events or results not to be as anticipated, estimated or intended.
It is important to note, that:
• unless otherwise indicated, forward-looking statements indicate the Group’s expectations as at 26 March 2012;
• actual results may differ materially from the Group’s expectations if known and unknown risks or uncertainties affect its
business, or if estimates or assumptions prove inaccurate;
• the Group cannot guarantee that any forward-looking statement will materialise and, accordingly, readers are cautioned not
to place undue reliance on these forward-looking statements; and
• the Group disclaims any intention and assumes no obligation to update or revise any forward-looking statement even if
new information becomes available, as a result of future events, or for any other reason.
39
THANK YOU
Questions and Answers


