
1
Megafaunal Benthic Ecology of the Submarine Canyons of
Southern California
Grant Duffy, University of Southampton/NOCS, UK
Mentors: Charlie Paull, Lonny Lundsten
Summer 2011
Keywords: Megafauna, ROV, Southern California, submarine canyon
ABSTRACT
Submarine canyons have been studied to a very limited extent in spite of their important
biological roles as hotspots of secondary production and organic matter conduits between
the shelf and the deep sea. The heterogeneity and rugged terrain of submarine canyons
makes them difficult to sample using traditional means such as trawling, however there
has be a great deal of success in using ROVs to study these important yet poorly
understood environments. A number of ROV dives were executed within the submarine
canyons of Southern California during research expeditions in 2005 and 2010. Although
these dives were planned and executed with geological research in mind, the video data
obtained during these dives can be utilised for ecological research. Video transects from a
range of depths in five submarine canyons have been analysed to produce
presence/absence data for each site and a comparison of benthic communities in differing
depths, locales, and canyons has been performed. No difference was found between
canyons based on canyon activity however there was a significant trend for community
composition to vary between water depths. This depth-related trend is in agreement with
the findings of previous studies and is most probably tied to the depth ranges of the
various organisms studied, which is dictated by their tolerances of depth depth-correlated
variables such as temperature, salinity and oxygen concentration.

2
INTRODUCTION
Forming deep incisions into the continental shelf, submarine canyons are large
topographic features with unique hydrographic, sedimentological, and geochemical
characteristics. Most submarine canyons resemble terrestrial valleys with a V-shaped
profile and high, steep walls with rocky outcrops (Shepard & Dill, 1969), for descriptive
purposes they can be divided into upper, middle, and lower regions based upon water-
depth and bottom-topography (de Stigter et al., 2007; Lastras et al., 2009; Vanney &
Mougenot, 1990). Examples of typical submarine canyons include the Nazaré Canyon,
off the coast of Portugal, the Monterey Canyon, off the Californian coast, and the Tokyo
Canyon at the entrance to Tokyo Bay.
Submarine canyons exhibit a high degree of variability on both an intra-canyon and inter-
canyon level (Gage & Tyler, 1992; Tyler et al., 2009). This heterogeneity is the result of
a number of biotic and abiotic factors including shelf morphology, proximity to river
systems, bottom topography, oceanographic conditions, large and small-scale canyon
events, sedimentation rates, nutrient input, and depth.
While these larger canyons are prime examples of typical submarine canyons, they occur
relatively infrequently along the World's continental margins. Smaller canyons,
sometimes referred to as submarine valleys, pepper continental margins around the globe
(DeLeo et al., 2010), and while these canyons are relatively small they still demonstrate
the same heterogeneity, albeit on a much smaller scale. Canyons can be classified using
various criteria and while attempts to classify quantitatively have occurred (eg. Goff,
2001), most classification is on a qualitative basis. One classification system of particular
interest to biologists and geologist alike is that of canyon activity, where canyons are
categorised based upon their rate of sediment throughput.
All submarine canyons intercept sediment being laterally transported along the
continental shelf (Cúrdia et al., 2004). Large, active canyons, such as Nazaré, which

3
penetrates almost the entire width of the continental shelf, intercept a greater amount of
sediment than those with reduced shelf penetration (Van Weering et al., 2002). This
sediment interception results in almost all canyons experiencing high levels of organic
matter input. Like continental margins, the amount of organic matter found within
canyons depends upon the production of associated surface waters. Macrophyte
communities, such as the kelp forests found near canyons along the Pacific Coast,
contribute substantially to the total organic matter entering the canyon system (Vetter &
Dayton, 1998).
The high levels of organic matter that accumulate in submarine canyons result in
increased food for resident filter-feeders and detritivores (Sorbe, 1999), making them
hotspots of secondary production (DeLeo et al., 2010). Secondary production is the rate
at which biogenic energy stores are incorporated into heterotrophic organisms (Soliman
& Rowe, 2008), where the energy source is effectively recycled carbon from detrital
sources and faecal matter (Jannasch & Taylor, 1984). The heightened levels of secondary
production within canyons may have resulted in the development of distinct faunal
assemblages with high faunal and biomass densities relative to other deep-sea ecosystems
at comparable depths (Ormond et al., 1999). Organisms that are able to alter their feeding
strategies and take advantage of any feeding opportunities that may arise generally thrive
in the unpredictable canyon environment (Cúrdia et al., 2004).
Many submarine canyons not only catch sediment but also channel it down from the
continental shelf to the abyssal plain. While inactive canyons have little role in sediment
transportation to the abyss, with sediment accumulating within the canyon channel over
time, active canyons act as vital conduits for sediment. By channelling sediment and
expediting its movement from the continental shelf to the associated basin (Vetter &
Dayton, 1998) active canyons provide an important means to supply organic carbon to
the deep sea.

4
The effect of canyon activity upon the faunal composition of communities inhabiting
submarine canyons has yet to be discussed in published literature. This may be in part
due to the difficulties of studying fauna in such complex environments or due to the
opportunity to execute such a study not arising. It is hoped that this study will provide a
means to test the faunal differences between active and inactive canyons and facilitate an
improved understanding of the canyon faunal assemblages as a whole.
In spite of their importance as hotspots of secondary production and role in connecting
the continental shelf to the deep sea (Vetter & Dayton, 1998), our understanding of
submarine canyons, their formation, processes, and ecosystems, is relatively limited
(Ramirez-Llodra et al., 2010). In recent years there have been a number of programmes
targeting submarine canyons (e.g. EUROSTRATFORM, HERMES, HERMIONE),
however complete multidisciplinary comprehension of these complex systems is still far
away, with numerous submarine canyon systems remaining wholly unstudied. A number
of studies have aimed to survey canyons from a geological perspective with minimal
regard to the study of canyon ecology, however this does not mean that ecological details
cannot be gleaned from the data collected on these expeditions.
As a matter of course video recordings are made during all MBARI ROV dives in order
to provide a record of the dive for future reference. This results in a great deal of video
data being collected during all dives that can potentially be used as part of a video survey
of local fauna. There are a number of limitations associated with using this data that will
be discussed later in this report.

5
MATERIALS AND METHODS
Over 67 hours of ROV footage was recorded during research expeditions to the
submarine canyons off the coast of Southern California in 2005 and 2010. In total five
submarine canyons were sampled (Figure 1) over the course of these two expeditions.
Figure 1: Map of study sites. H; Hueneme Canyon (28km long), M; Mugu (16km), SMo; Santa Monica (22km), R: Redondo (18km), LJ; La Jolla (27km).
Hueneme (Figure 2a), Redondo (Figure 2b), and Santa Monica (Figure 2c) Submarine
Canyons were surveyed during the 2005 expedition using ROV Tiburon. ROV Tiburon
was used for all dives during the 2005 expedition. This ROV was deployed from the RV
Western Flyer and equipped with a standard definition (SD) camera, which was used to
survey these submarine canyons. Footage was recorded to tape for subsequent analysis in
the MBARI video lab.

6
a)
b)
c)
d)
e)
Figure 2: Bathymetric maps of the study canyons with dive tracks indicated by coloured dots. Coloured shading represents bottom depth ranging from 0m deep (Red) to 750m deep (Blue). Canyons in order are:
a) Huenene; b) Redondo; c) Santa Monica; d) Mugu; e) La Jolla.

7
During the 2010 expedition Mugu (Figure 2d) and La Jolla (Figure 2e) Submarine
Canyons were surveyed using ROV Doc Ricketts. Once again this vehicle was tethered to
and piloted from RV Western Flyer. ROV Doc Ricketts was equipped with a high
definition (HD) video camera, all footage was recorded onto high definition tape and
analysed upon return to MBARI.
The duration and distance travelled during each dive varied greatly and was dictated by
the geological sampling requirements of each dive and operational considerations, such
as crew availability and sea conditions. For this reason each dive was divided into a
number of randomly selected 50m long transects, this also aided in zone and substratum
classification as many dives traversed a number of zones and substrata.
Three discrete zones were identified (<45° slope, >45° slope, and wall) with transects
being classified using bathymetric data collected using an AUV equipped with a
multibeam array, BPI index calculated using the Benthic Terrain Modeller plugin for
ArcGIS, and observations made using video footage. Substratum (sand, soft, rocky, and
hard) was identified using observations from ROV footage and knowledge of the
substratum obtained during the primary geological survey.
Each transect was annotated using MBARI’s proprietary Video Annotation and
Reference Software (VARS). Initial outline annotations were performed by Lonny
Lundsten, Linda Kuhnz, and Susan Von Thun. The author reviewed all footage in greater
detail to identify any potential sources of error and to ensure consistency between dives.
Due to the nature of this study no voucher specimens were collected during dives, the
distance that the camera was from the benthos also varied substantially and while a
limited number of organisms were viewed close-up many were observed at some
distance. These reasons, coupled with the use of SD video during the 2005 dives and HD
video during the 2010 dives meant that the level of certainty of identification of
organisms was highly variable.
8
Due to this variability in identification certainty some organisms could be identified to
lower taxonomic levels than others. Even without clear footage some organisms could be
confidently identified to species level (eg. Strongylocentrtotus fragilis) or grouped as a
morphologically-similar species (eg. Asteroid sp. A) while others had to be grouped to
family level to ensure consistency between footage of varying quality (eg. Sebastes spp.
and Sebastolobus spp. grouped into Sebastidae). For this reason analysis was performed
using fauna classified as Operational Taxonomic Units (OTUs), with organisms
identified to the taxonomic level that provide the most confidence that consistent
identification occurred across all dives. Throughout the process of video analysis the
substratum and zone indicative features were noted, if an OTU was numerically dominant
this was also noted.
Annotations for all dives were sorted into the appropriate OTU as necessary and counted,
this data was subsequently converted into presence/absence data. It was determined that
analysis of presence/absence data was the most appropriate approach due to the
variability of field-of-view. While it is known that all transects were 50m in length the
distance from the benthos varied considerably making the total area observed difficult to
determine and the collection of representative abundance data infeasible.
A resemblance matrix of the data was created based upon Bray-Curtis similarity and used
to create a Multi-dimensional scaling plot using PRIMER statistical software (Plymouth
Routines In Multivariate Ecological Research; Clarke & Gorley, 2006). Data were then
analysed using a factorial analysis. Due to the unbalanced design of this study of
opportunity it was decided that a PERMANOVA analysis (Anderson, 2005) using the
PERMANOVA+ add-on for PRIMER provided the best approach as it is able to take into
account a number of factors and accommodates for more complex experimental designs
than an ANOSIM (Clarke, 1993) test.

9
The PERMANOVA design file was created with Canyon as the top tier factor. Nested
within this was zone and depth. Average transect depths were grouped into 100m depth
bins to be used as a factor for analysis. Temperature, oxygen concentration, and salinity
were closely correlated to depth and as such only depth was used as a representative
factor to reduce the total number of factors and therefore the computations power
required to run the PERMANOVA. Substratum was additionally nested within zone. In
order to assess the effect of canyon activity, a contrast was built into this design grouping
Hueneme, Mugu, and La Jolla Canyons against Santa Monica Canyon. Redondo canyon
was grouped either with the active canyons, the inactive canyons, or excluded altogether
to test where this intermediate canyon lies. The PERMANOVA was run using 9999
permutations to produce a P(Perm) value indicating the significance of any effect that
each factor may be having upon variability.
10
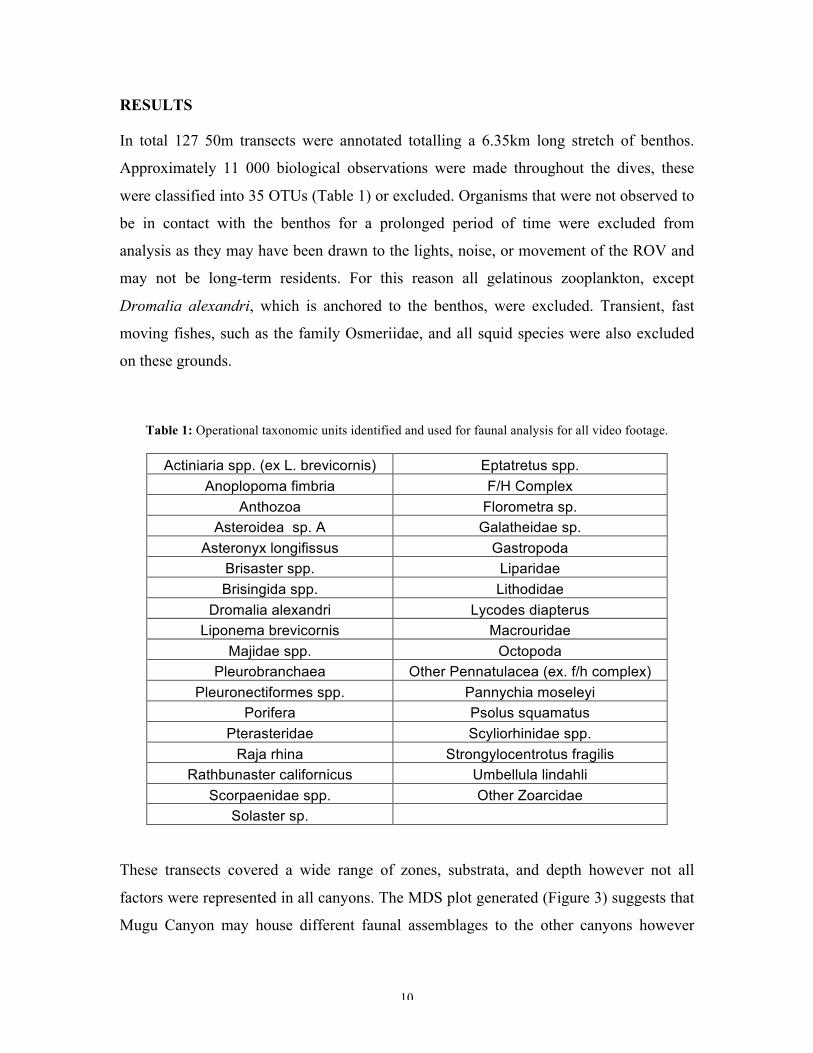
RESULTS
In total 127 50m transects were annotated totalling a 6.35km long stretch of benthos.
Approximately 11 000 biological observations were made throughout the dives, these
were classified into 35 OTUs (Table 1) or excluded. Organisms that were not observed to
be in contact with the benthos for a prolonged period of time were excluded from
analysis as they may have been drawn to the lights, noise, or movement of the ROV and
may not be long-term residents. For this reason all gelatinous zooplankton, except
Dromalia alexandri, which is anchored to the benthos, were excluded. Transient, fast
moving fishes, such as the family Osmeriidae, and all squid species were also excluded
on these grounds.
Table 1: Operational taxonomic units identified and used for faunal analysis for all video footage.
Actiniaria spp. (ex L. brevicornis) Eptatretus spp. Anoplopoma fimbria F/H Complex
Anthozoa Florometra sp. Asteroidea sp. A Galatheidae sp.
Asteronyx longifissus Gastropoda Brisaster spp. Liparidae Brisingida spp. Lithodidae
Dromalia alexandri Lycodes diapterus Liponema brevicornis Macrouridae
Majidae spp. Octopoda Pleurobranchaea Other Pennatulacea (ex. f/h complex)
Pleuronectiformes spp. Pannychia moseleyi Porifera Psolus squamatus
Pterasteridae Scyliorhinidae spp. Raja rhina Strongylocentrotus fragilis
Rathbunaster californicus Umbellula lindahli Scorpaenidae spp. Other Zoarcidae
Solaster sp.
These transects covered a wide range of zones, substrata, and depth however not all
factors were represented in all canyons. The MDS plot generated (Figure 3) suggests that
Mugu Canyon may house different faunal assemblages to the other canyons however

11
these plots are often open to interpretation and the apparent dissimilarity requires testing
especially given how the unbalanced sampling effort. A PERMANOVA test indicated
that there was no significant difference between canyons (DF= 4, pseudoF= 1.2689,
P(Perm)= 0.2353) or based on canyon activity, irrespective of whether Redondo was
classified as active, inactive, or excluded altogether (DF= 1, pseudoF= 0.81419,
P(Perm)= 0.6716; DF= 1, pseudoF= 0.75723, P(Perm)= 0.7009; DF= 1, pseudoF=
0.92151, P(Perm)= 0.5640 respectively).
Figure 3: Two-dimensional MDS based on Bray-Curtis Similarity matrix created from comparison between all transects (n=127). Points categorised by canyon.
The effect of zone was not significant (DF= 9, pseudoF= 1.9404, P(Perm)= 0.0523) but a
relatively high pseudoF value coupled with the near-significant P(Perm) value suggest
that zone may still be having some influence upon community composition. Substratum
was found to have no significant effect upon community dissimilarity (DF= 9, pseudoF=
1.9404, P(Perm)= 0.0523).

12
Figure 4: Two-dimensional MDS based on Bray-Curtis Similarity matrix created from comparison between all transects (n=127). Points categorised by canyon, points grouped together by the green line are
25% similar to one another based on transect depth.
Depth was found to have a significant effect upon the community composition of these
canyons (DF= 9, pseudoF= 2.9992, P(Perm)= 0.002). This concurs with observation
made by the author while reviewing video footage. This explains why Mugu Canyon
appeared to vary from the other canyons when reviewing the MDS plot (Figure 3)
although no significant variation was detected by the PERMANOVA. If one plots
similarity of data based on depth (Figure 4) it becomes apparent that these Mugu
transects were much deeper than most others. Plotting the depth of every observation of
the ten most common OTUs (Figure 5) demonstrates that some species are only found
within specific depth boundaries.
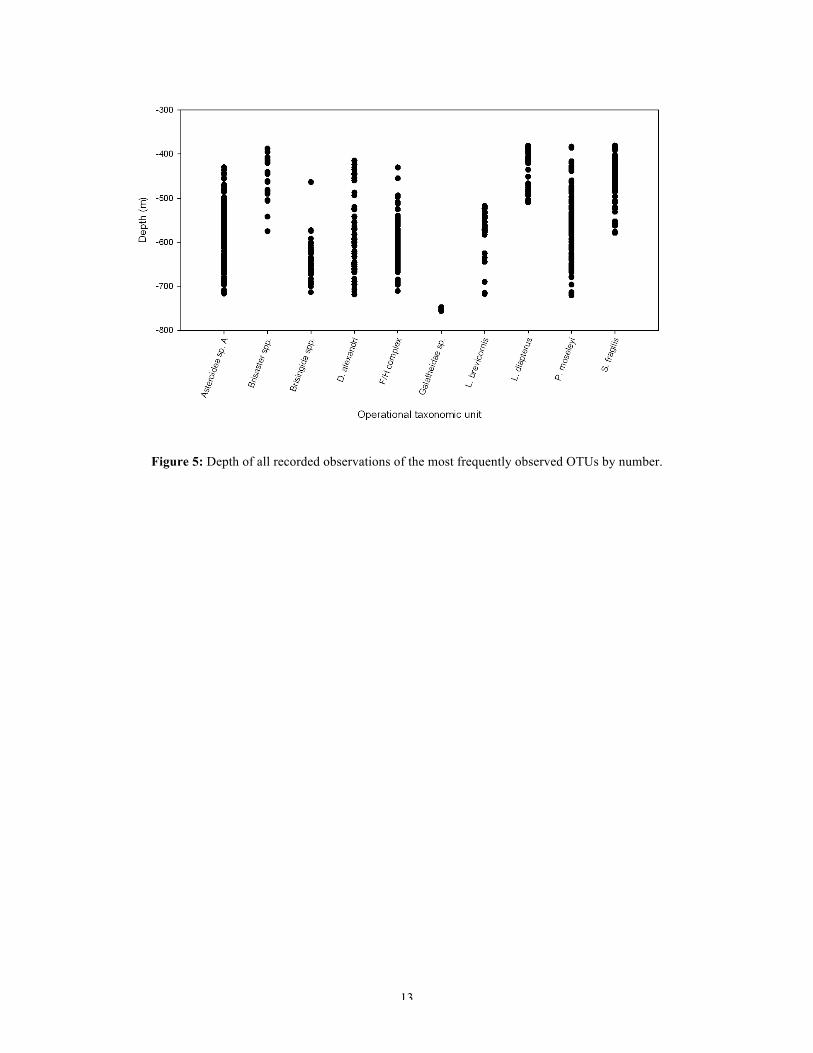
13
Figure 5: Depth of all recorded observations of the most frequently observed OTUs by number.

14
DISCUSSION
Based on the results of the PERMANOVA test if canyon activity does have any effect on
community composition it has not been detected as part of this study. In the opinion of
the author, this could be a result of the unbalanced study of these canyons as the depths
and zones surveyed were not consistent between canyons. Based upon what is known
about the effect that reduced canyon activity has upon the morphology of the canyon,
reduction of main channel width and size, reduced steep slopes, build-up of soft muddy
sediments, one would only expect to see differences when looking at the megahabitat
(Greene et al., 1999; between-canyon) level of comparison as fewer smaller
macrohabitats (eg. sandy flats) would occur in the less active canyons. Without equal and
representative surveying of all canyons it is not possible to perform this analysis with
confidence.
Although the trend was not significant, there is evidence of a correlation between zone
and community composition. Fauna frequently found on gentle slopes and flats may be
lack the necessary ability to remain affixed to the steeper topography of slopes greater
than 45° and that of near-vertical walls. Fauna such as the sponges, Porifera, require the
harder substratum commonly found forming walls in order to anchor themselves securely
and as such are most commonly found within this zone. It is likely that the differences
seen were not significant due to the continuous nature of the zones and frequent zone
overlap during some transects (eg. small sections of flat terrace on walls) confounding the
analysis.
The effect of depth upon community composition has been observed on numerous
occasions in a wide variety of habitats over a range of fauna (eg. Haedrick et al., 1980;
Cartes, 1993; Cartes and Sardá, 1993). Following plotting of observations by depth it is
clear that the depth range of a number of the organisms observed is restricted. Based on
observations made during video footage analysis this is not particularly surprising as
trends can be observed while watching dives that traverse a range of depths. Based on the
data from all five canyons it is possible to describe the trends that one observes in benthic

15
communities while travelling down the canyon from the head on continental shelf to the
mouth emptying out to the basin below.
Some OTUs were found over the whole range of depths surveyed. The holothurian
Pannychia moseleyi Theél 1882 was one such organism being found frequently in
varying numbers between 375m and 725m deep. Dromalia alexandri Bigelow 1911, a
benthic siphonophore that anchors itself to the seafloor, was also found at almost all
depths ranging from approximately 400m-725m deep. This species was not found in the
shallowest transects, however the majority of these shallow dives were focussed on the
main canyon channel where currents may have been too strong for D. alexandri to remain
tethered.
The shallowest transects (~375m-500m deep) were characterised by Lycodes diapterus
Gilbert 1892, a teleost fish, being found in high numbers in the main canyon channel.
This species was not observed at all below 525m water depth. Brisaster spp. were
frequently observed on gentle slopes in shallow depths but there occurrence was sporadic
below 500m and unobserved below 600m deep. The deep-sea urchin Strongylocentrotus
fragilis Jackson 1912 was found in very high numbers on slopes and flats with soft
muddy sediment shallower than 600m deep. Below this depth it was rarely observed,
being usurped by Asteroidea sp. A as the numerically dominant organism.
Asteroidea sp. A was seen frequently in high numbers between 425m and 725m deep.
Below 500m it numerically dominated a number of transects, occurring alongside S.
fragilis at the shallower end of this range. Below 500m a large number of sea-pens
belonging to the Fuculina/Halipteris Complex are observed on both gentle and steep
muddy slopes. On almost all occasions, Asteronyx longifissus Döderlein 1927, an
organism that was rarely seen on the benthos, is observed attached to these sea-pens.

16
The pom-pom anemone, Liponema brevicornis McMurrich 1893, was observed
sporadically in footage recorded below 500m deep but was not seen at all above this
depth. Basket stars belonging to the family Brisingida began to increase in number below
600m, often being seen alongside Asteroidea sp. A and P. moselyi on flat muddy terraces
and gentle slopes.
The transects below 725m deep were dominated by the squat lobster Galatheoidea sp.,
which was found in very high numbers and high densities in the deeper dives at the
mouth of the canyon. These organisms were also seen in high numbers in footage taken
from the Santa Monica Mounds that are located in the Santa Monica Basin, which a
number of the studied canyons empty into. This suggests that conditions in the mouth of
the canyon are similar to those of the basin, this is of little surprise due to their proximity
to one another.
The restrictions in depth distributions of some OTUs may be an indication of their
physiological tolerance limits with regard to depth-related environmental variables. A
principal components analysis showed that within the studies canyons depth, and
therefore pressure, temperature, and oxygen concentration all correlated so as to form one
principal component accounting for 94% of environmental variability. Therefore while
pressure itself may not be the limiting factor for each organism it is not possible to
discern between depth and these other variables.
Another possible cause for the faunal zonation observed that requires further
investigation is the nutrient availability of each depth zone, as this has been found to
affect faunal distributions in the deep sea as some organisms thrive in higher energy
environments (Cartes and Carrassón, 2004), this is another factor that could potentially
co-vary with the survey depth. At the time of writing very little information regarding the
nutrient availability at various depths within the canyon is available in order to test this
theory.

17
Beyond the physiological limitations than may be controlling the depth distribution of the
various fauna observed, there may also be some degree of interspecific competition
dictating what fauna is found within each depth band, zone, or substratum. As an
example, L. diapterus was found frequently within the main channel of the canyon while
other organisms were not. As a teleost fish, L. diapterus is comparatively motile and so
can quickly escape the channel should a large, potentially life threatening, sediment flow
occur. Other, less motile, organisms while not excluded from the channel due to pressure,
temperature, oxygen concentration, or salinity would be unlikely to survive long in the
main channel and as such will be less frequently observed in this area.

18
CONCLUSIONS/RECOMMENDATIONS
While it has not been possible to determine the effect, if any, that canyon activity may
have upon the communities found within them, this study has nevertheless shown an
interesting result with regards to the varying communities encounters as one descends
into the submarine canyons of Southern California. Submarine canyons are still relatively
understudied environments that are poorly understood, as such, studies of opportunity
like this can greatly benefit researchers and are a worthwhile scientific endeavour.
Lessons learned from this work can be applied to future analysis of opportunistic video
datasets such as this one and for planning of future ROV work in order to capitalise on
any dive time that is available and ensure that surveys are perhaps performed in such a
way as to appease both geologists and biologists resulting in a more comprehensive and
multifaceted research programme.
In order to confidently determine if canyon activity affects community composition it is
recommended that a more rigorous and uniform surveying technique is practised in order
to encompass a more even spread of transects in a range of depth bands and zones within
all canyons. This would require careful prior planning, ideally using detailed bathymetric
maps, which have proven invaluable during this study. This will ensure that dive time is
well-used and hopefully provide a dataset that is both robust and thorough for any
subsequent data analysis. This should be entirely possible while still meeting the needs of
geologists although some compromises may have to be made on both sides due to time
and financial constraints.
19
ACKNOWLEDGEMENTS
I’d like to thank Charlie Paul and Lonny Lundsten for arranging a whole new project
before I even knew the original project was unlikely to go ahead due to technical issues.
Their advice and guidance has helped a great deal in completing this project. I’d also like
to thank Eve Lundsten and Krystle Anderson for helping me out with all of my computer-
related problems, I now no longer despise ArcGIS. Everyone in the video lab has been
great especially seeing as I pretty much invaded while doing the video analysis.
George and Linda, thanks so much for organising and running the internship programme.
It has been incredible. We’ve done so much in 10 weeks and that’s thanks to your
amazing efforts in looking after us and making sure we have a great time.
Also thanks to everyone at MBARI and the Packard Foundation, this place is truly
amazing. The Challenger Society and HERMIONE Project provided funds to cover some
of my travel and visa costs so without them I literally wouldn’t be where I am today.
Thank you.
20
References:
Anderson, M. J. (2005). PERMANOVA: a FORTRAN computer program for permutational multivariate analysis of variance. Department of Statistics, University of Auckland, New Zealand.
Cartes, J. E. (1993). ‘Deep-Sea Decapod Fauna of the Western Mediterranean: Bathymetric Distribution and Biogeographic Aspects’, Crustaceana 65(1), 29-40.
Cartes, J. E. & Carrassón, M., ‘Influence of trophic variables on the depth-range distributions and zonation rates of deep-sea megafauna: the case of the Western Mediterranean assemblages’, Deep Sea Research Part I 51(2), 263-279.
Cartes, J.E. & Sardá, F. (1993). ‘Zonation of deep-sea decapod fauna in the Catalan Sea (Western Mediterranean)’, Marine Ecology Progress Series 94, 27-34.
Clarke, K. (1993), ‘Non-parametric multivariate analyses of changes in community structure’, Australian Journal of Ecology 18, 117–143.
Clarke, K. & Gorley, R. (2006), PRIMER v6: User Manual/Tutorial, PRIMER-E, Plymouth, UK.
Cúrdia, J., Carvalho, S., Ravara, A., Gage, J., Rodrigues, A. & Quintino, V. (2004), ‘Deep macrobenthic communities from Nazaré submarine canyon (NW Portugal)’, Scientia Marina 68, 171–180.
De Leo, F. C., Smith, C. R., Rowden, A. A., Bowden, D. A. & Clark, M.R. (2010), ‘Submarine canyons: hotspots of benthic biomass and productivity in the deep sea’, Proceedings of the Royal Society of London: B doi:10.1098/rspb.2010.0462.
De Stigter, H. C., Boer, W., Mendes, P. A. d. J., Jesus, C. C., Thomsen, L., van den Bergh, G. D. & van Weering, T. C. E. (2007), ‘Recent sediment transport and deposition in the Nazaré Canyon, Portuguese continental margin’, Marine Geology 246(2- 4), 144–164.
Gage, J. & Tyler, P. (1992), Deep-Sea Biology: A Natural History of Organisms at the Deep-Sea Floor, Cambridge University Press, Cambridge, UK.
Goff, J. A. (2001), ‘Quantitative classification of canyon systems on continental slopes and a possible relationship to slope curvature’, Geophysical Research Letters 28(23), 4359.
Greene, H. G., Yoklavich, M. M., Starr, R. M., O'Connell, V. M., Wakefield, W. W., \ Sullivan, D.E., McRea, J. E. & Cailliet, G. M. (1999), ‘A classification scheme for deep seafloor habitats’, Oceanologica Acta 22(6) 663-678.
Haedrich, R. L., Rowe, G. T. & Polloni, P. T. (1980), ‘The megabenthic fauna in the deep sea south of New England, USA’, Marine Biology 57(3) 165-179.

21
Jannasch, H. & Taylor, C. (1984), ‘Deep-sea microbiology’, Annual Reviews in Microbiology 38(1), 487–487.
Lastras, G., Arzola, R. G., Masson, D. G., Wynn, R. B., Huvenne, V. A. I., Huhnerbach, V. & Canals, M. (2009), ‘Geomorphology and sedimentary features in the Central Portuguese submarine canyons, Western Iberian margin’, Geomorphology 103(3), 310– 329.
Ormond, R., Gage, J. & Angel, M. (1999), Marine Biodiversity: Patterns and Processes, Cambridge University Press, Cambridge, UK.
Ramirez-Llodra, E. Z., Brandt, A.,Danovaro, R., De Mol, B., Escobar, E., German, C. R., Levin, L. A., Martinez Arbizu, P., Menot, L.; Buhl-Mortensen, P., Narayanaswamy, B. E., Smith, C. R., Tittensor, D. P., Tyler, P. A., Vanreusel, A., Vecchione, M. (2010). ‘Deep, diverse and definitely different: unique attributes of the world's largest ecosystem’, Biogeosciences 7(9): 2851-2899.
Shepard, F. P. & Dill, R. F. (1969), Submarine Canyons and Other Sea Valleys, Rand McNally & Co., Chicago, USA.
Soliman, Y. & Rowe, G. (2008), ‘Secondary production of Ampelisca mississippiana Soliman and Wicksten 2007 (Amphipoda, Crustacea) in the head of the Mississippi Canyon, northern Gulf of Mexico’, Deep-Sea Research Part II 55(24-26), 2692–2698.
Sorbe, J. (1999), ‘Deep-sea macrofaunal assemblages within the Benthic Boundary Layer of the Cap-Ferret Canyon (Bay of Biscay, NE Atlantic)’, Deep-Sea Research Part II 46(10), 2309–2329.
Tyler, P., Amaro, T., Arzola, R., Cunha, M., de Stigter, H., Gooday, A., Huvenne, V., Ingels, J., Kiriakoulakis, K., Lastras, G., Masson, D., Oliveira, A., Pattenden, A., Vanreusel, A., Van Weering, T., Vitorino, J., Witte, U. & Wolff, G. (2009), ‘Europe’s Grand Canyon: Nazar ́e Submarine Canyon’, Oceanography 22(1), 46–57.
Van Weering, T., De Stigter, H., Boer, W. & De Haas, H. (2002), ‘Recent sediment transport and accumulation on the NW Iberian margin’, Progress in Oceanography 52(2-4), 349–371.
Vanney, J. & Mougenot, D. (1990), ‘A gouf-type canyon, the Canhao Da-Nazare (Portugal)’, Oceanologica Acta 13(1), 1–14.
Vetter, E. & Dayton, P. (1998), ‘Macrofaunal communities within and adjacent to a detritus-rich submarine canyon system’, Deep-Sea Research Part II 45(1-3), 25–54.


