Cities 26 (2009) 133–140
Contents lists available at ScienceDirect
Cities
journal homepage: www.elsevier .com/locate /c i t ies
Measuring objective accessibility to neighborhood facilitiesin the city (A case study: Zone 6 in Tehran, Iran)
Sedigheh Lotfi a,*, Mohammad Javad Koohsari b
a Department of Urban Planning, Faculty of Humanities and Social Sciences, University of Mazandaran, Iranb Department of Urban and Regional Planning, Faculty of Fine Arts, University of Tehran, Tehran, Iran
a r t i c l e i n f o
Article history:Received 28 April 2008Received in revised form 22 January 2009Accepted 15 February 2009Available online 5 May 2009
Keywords:AccessibilityNeighborhoodPublic spaceSocio-economic statusDeprivationTehran
0264-2751/$ - see front matter � 2009 Published bydoi:10.1016/j.cities.2009.02.006
* Corresponding author. Tel.: +98 9112122854; faxE-mail addresses: [email protected] (S. Lotfi),
Koohsari).
a b s t r a c t
Access to public spaces could be one of the important factors in their use. Whilst measuring accessibilityto public spaces has received considerable attention, there are few studies outside the Anglophone world,especially in developing countries such as Iran. The present research targets two important goals. First itattempts to create a new methodology for measuring objective accessibility to public spaces (such asparks, schools and shops) at the neighborhood scale and second it investigates the distribution of suchspaces by examining the socio-economic status of citizens. The goal is achieved by applying a new andstraightforward method of GIS and fuzzy logic. This methodology was applied in the study area andthe results presented in the form of tables and maps. The results revealed that there are spatial disparitiesin some parts of the area with lower accessibility to such spaces. The study indicates that the generalunderstanding of people with high level deprivation having less access to public space is incorrect.
� 2009 Published by Elsevier Ltd.
Introduction
The desire to improve the quality of life (QOL) in a particularplace or for a particular group is an important focus of attentionfor planners. We could go further, and suggest that the enterpriseof planning as a public activity is strongly motivated and justifiedin terms of its potential contributions to citizens’ QOL (Massam,2002, p. 142). The latter consists of two dimensions, the objectiveand the subjective. The latter dimension relates to the tendenciesand characters of citizens, while the objective is dependent uponthe physical environment of their living place. The characteristicsof objective quality of life are important issue for study.
Urban public spaces are the important locations which influ-ence the quality of life and the welfare of people, both directlyand indirectly. Implicit in the public provision of amenities suchas parks, recreational facilities and social and cultural services, isa belief that they are beneficial to residents’ well-being (Wittenet al., 2003).
Accessibility is in turn an important factor which impacts all as-pects of public space in both direct and indirect ways. Accessibilitycan be defined in different ways, and once more objective and sub-jective dimensions are important. Objective accessibility is a keyfactor and physical distance is still important in developingcountries.
Elsevier Ltd.
: +98 [email protected] (M.J.
The use of public facilities can be linked to accessibility, andthus residential proximity to facilities and services can be theo-rized as contributing to health and wellbeing in a number of ways.In addition to easier and more direct access to places to shop, exer-cise, work, meet neighbors, have a health check, etc., it confersopportunities by reducing the time and financial costs of access,which in turn frees individual and household resources for useelsewhere (Pearce et al., 2006, p. 389). There have been many stud-ies in the field of public spaces; these cover different scales, fromneighborhood units (Larsen and Gilliland, 2008) to the national le-vel (Pearce et al., 2008) and include a broad range of public spacesincluding access to healthy food provision (Cummins and Macin-tyre, 2002; Apparicio et al., 2007), access to green space (Hillsdonet al., 2006; Coutts, 2008), access to health services (Luo and Wang,2003; Tanser et al., 2006), access to recreational services (DiezRoux et al., 2007; Robitaille and Herjean, 2008), and access to openspaces (Witten et al., 2008).
Generally speaking, these researchers have addressed differentmethods of analyzing the accessibility to public spaces (Fortneyet al., 2000; Fone et al., 2006; Yang et al., 2006) or by presentinga new method for measuring accessibility with respect to the pre-vious methods attempted to examine the socio-economic charac-ters of place and then compared their findings with the level ofaccessibility to public spaces (Witten et al., 2003; Apparicio et al.,2007; Pearce et al., 2008).
This research has, however, had some limitations in the field ofmeasuring objective accessibility to public spaces. The most com-mon of these limitations has been the arbitrary nature in which
134 S. Lotfi, M.J. Koohsari / Cities 26 (2009) 133–140
neighborhoods have been ‘‘conceptualized and operationalized”(Macintyre et al., 2002).
In many instances, neighborhood has been predefined as theadministrative unit (often census area) for which data are easilyavailable (Cummins et al., 2005). Also, these studies have confinedthemselves to certain scales (such as a neighborhood unit or a city)due to shortages of statistical data at different scales; this has lim-ited the option of integrating accessibility measurement. Such lim-itations, however, have been mitigated by applying geographicinformation analysis (GIS) in some degree and this has provideda good ground for integration of accessibility level information atdifferent scales.
Whilst measuring accessibility to public facilities has receivedconsiderable attention on the US, UK, Australia, New Zealand andCanada, there are few studies outside of the Anglophone world,especially in developing countries such as Iran. Megalopolises inthe developing world are experiencing an unprecedented growth,and even the ever increasing budgets of the national and local gov-ernments cannot cope with the huge and diverse problems of thesecities. Statistics show that the growth of Iran’s capital has slack-ened in recent years but now the redistribution of urban resourcesneeds attention. The present research is one of the first studies topursue the following goals.
1 Constructing a new methodology for measuring the level ofobjective accessibility to public spaces by using GIS.
2 Investigating the distribution of the public spaces with respectto the socio-economic characteristics of the citizens in a hith-erto unexplored setting such as Tehran.
The study presents a precise and straightforward methodologyand aims to be simple for application by urban authorities whoneed to measure objective accessibility to public spaces. There isan argument between traffic engineers and urban planners, asthe former generally use complicated models associated withmany indicators to measure accessibility. These models often arevery complicated which make interpretation and explanation verydifficult even for many of the experts. In contrast, urban plannersuse models which are simpler and perceivable, although the neces-sity of applying complicated models is quite usual. Since the imple-mentation and feasibility of such models is strongly dependentupon the cooperation of many bodies like urban experts, authori-ties and residents, the clarity and simplicity could help every oneto participate.
The second goal, with higher importance, would be developedby proposing two subsequent questions.
� Are there spatial inequalities in objective access to public spaces(such as local parks, stores and elementary schools) in selectedsettings?
� Are there socio-economic inequalities in objective access to pub-lic spaces (such as: local parks, stores and elementary schools) inselected settings?
Finding the responses could help and guide urban authorities inthe distribution and allocation of the different resources andopportunities in the city.
Background
Measuring accessibility
Accessibility is a frequently-used concept but there is no con-sensus about its definition. It is a common term experienced by di-verse individuals (i.e. characterized by different needs, abilities and
opportunities) at any place and moment of the day, which resultsin considerable variation in components included in its measure-ment, and in how it is formulated (Vandenbulcke et al., 2008, p.2). Accessibility refers to the ease with which a building, place orfacility can be reached by people and/or goods and services (Cow-an, 2005, p. 2). It can thus be said to measure the relative opportu-nity for interaction or contact with a given phenomenon such as apark (Gregory, 1986). Accessibility is commonly defined as the easewith which activities can be reached from a certain place and witha certain system of transport (Morris et al., 1979; Johnston et al.,2000). From Lynch (1981) we can view accessibility as contributingto the ability of urban residents to have good access to activities,resources, services, information and the like. He considers accessi-bility as one of the main functional characters of urban spatialform. The concept of accessibility spans a variety of aspects, suchas the physical, mental, economic, and financial,depending on thenature of the land use and transport in question (Doi et al., 2008,p. 1).
In a general view, the quality of access could be measured onthe basis of subjective and objective factors by using qualitativeand quantitative data. Subjective assessment is usually includingfield studies such as questionnaires and interviews to understandurban residents’ tendencies and geographical imagination. Anobjective assessment approach usually uses quantitative indicatorsand is more economic. For example, the researcher questions theavailability of schools in the accessibility radius in a neighborhood,while in subjective accessibility the questions address the satisfac-tion of residents about their access to schools. Planners should beaware that the results of these two measuring approaches arenot always same. For example, it is possible that the residentswho do not have appropriate access to school are still more satis-fied compared to the residents who have a good access to school(and vice versa). Subjective assessment however is beyond theaims of this study; this paper concentrates on objective measuringat a local scale.
Objective accessibility can be measured in many ways (for a re-view, see Talen and Anselin, 1998). Several types of objectiveaccessibility measures are used in urban planning and transporta-tion planning studies, for example:
� Container (e.g. the number of green spaces in each neighbor-hood unit);
� Coverage (e.g. the number of kindergartens in 800 m from resi-dential centriod blocks);
� Minimum Distance (e.g. The distance from neighborhood unitscenter to the nearest park);
� Travel cost (e.g. average distance between centroid of censusblocks and all neighborhood facilities);
� Gravity (e.g. all neighborhood facilities divided by distance) andso on.
In this paper, we have chosen to use the minimum distancemethod for our analysis. Minimum distance is simply the distancefrom an origin to the nearest facility of interest (for example: thedistance from a neighborhood unit center to the nearest park).Accessibility is inversely related to this measure, and dependingon the facility type, other measures may more accurately capturethe essence of accessibility. For such reasons the minimum dis-tance was used in this research.
The level of accessibility to the local facilities was measured. Atthis scale, the dominant way of movement is walking and the res-idents usually prefer to use the shortest distance. Also the researchattempts to create a straightforward method for measuring acces-sibility which is simple and perceivable by the local urban author-ities. The minimum distance was used as it is less complicated
S. Lotfi, M.J. Koohsari / Cities 26 (2009) 133–140 135
compared to other methods and moreover could be used simply ina GIS based model.
Another methodological issue that arises in spatial accessibilityresearch is the choice of distance metric. In general, there are threetypes of distance that can be used: Euclidian distance (straight-line), Manhattan distance (distance along two sides of a right-angled triangle, the base of which is the Euclidian distance) andshortest network paths (Cromley and McLafferty, 2002; Apparicioet al., 2007). The most commonly used types of distance measurein accessibility research are shortest network paths (Ottensmann,1994; Talen, 1997; Cervero et al., 1999; Nicholls, 2001; Wittenet al., 2003; Apparicio and Séguin, 2006; Robitaille and Herjean,2008; Larsen and Gilliland, 2008) and, to a lesser extent, Euclidean(straight-line) distance (Truelove, 1993, 2000; Fone et al., 2006). Inthis paper we used network distance since it gives the possibilitythat the distances from facilities are calculated most exactly inthe street networks compared the physical distance. Also we se-lected shortest network distances rather than shortest networktimes, since we aimed to consider the level of accessibility to thelocal facility through walking.
The quality of scoring the neighborhood unit is another issuewhich has been approached differently in the measuring access re-search. For example, in some studies (such as Talen, 2003) the min-imum distance was assigned (e.g. about a mile was optimum) andso the values of 0 and 1 were given to the census blocks; if the cen-tre of these units were placed at an optimum distance the valuewould be 1, and 0 was scored for the other units. The sum of suchweighting was used for accessibility measurement of the wholeneighborhood unit. It should be mentioned that a block only afew centimeters from the optimum distance obtained no scoresand its local accessibility is thus the same as the block which is ahundred meters from optimum distance.
In this paper, in order to decrease such problems, fuzzy logicis replaced with a Boolean approach. Zadeh (1965) originally sug-gested fuzzy set theory to solve problems caused by the crisp ap-proach. Fuzziness is a type of imprecision characterizing classeswhich, for various reasons, cannot have, or do not have, sharplydefined boundaries: for example, the ambiguity in subjectivelabeling such as ‘approximately 7’, ‘about 5 km’, ‘old man’. Theseimprecisely defined classes are called fuzzy sets (Burrough andFrank, 1996). Such sets defined over continuous domains havea membership function that defines a degree of membershipfor each value in the domain (Altman, 1994). The reason of usingfuzzy logic is that unlike the Boolean, a fuzzy set has the poten-tial to give membership to factors a consistent range (Zadeh,1975).
Accessibility to public spaces and socio-economic characteristics
There has been great emphasis on the role and importance ofpublic spaces in different aspects of socio-cultural and health is-sues in the literature of design and planning (Krier, 1984; Glazerand Lilla, 1987; Moudon, 1992; Sorkin, 1992; Tibbalds, 1992; Wor-pole, 1992; Madanipour, 1992; Calthorpe, 1993; Katz, 1994).Accessibility to public spaces can have considerable effects onthe other aspects of these spaces.
The practical importance of service distribution in urban areasis based on the need for services (such as police and fire protection,water supply, sanitation and waste disposal and transportation) forthe viability of urban life (Erkip, 1997, p. 353) and the role thatphysical accessibility plays in public facilities distribution derivesfrom the nature of public facilities as public goods. The distributionof the benefits of consuming them is distance dependent (White,1979, p. 19). Residential location determines a household’s accessto an assortment of community resources such as shops, parks,schools, and health services (Knox, 1987).
Erkip (1997) argues that for most of the fixed urban servicessuch as parks, libraries and public health facilities, physical prox-imity is required. Pinch (1985) suggests that such’point-specific’services create a tapering effect because of travel costs togetherwith time and effort, all of which tend to increase with distance.There has been much discussion regarding physical accessibilitybut the issue has been questioned by some researchers recently.Do the new virtual spaces influence and decrease the importanceof physical accessibility? If so, is there a need for considering thematter? It can be discussed that the issue is important for two ma-jor reasons and should be evaluated in accessibility. This is causedby both the nature of opportunities and people’s preferences forand need for face-to-face interaction (Graham and Marvin, 1999,p. 95). They note, despite the growth of online retailers, a widerange of consumer services, such as tourism, shopping, visitingmuseums and leisure attractions, eating and drinking, sport, the-atre, cinema and so on, that remains embedded in urban locationsand seems likely to resist any simple, substantial substitution byonline equivalents. The case could be further discussed that thevirtual spaces proceed only sluggishly in the developing worldcompared to advanced countries. As Pressman argued in his con-centrated city form, continuing face to face interaction in most ofeconomic activities (in Knox, 1987, p. 329) encourages people tohave good access to physical means.
In any case, the spatial distribution of services affects the distri-bution of health and well-being among citizens and this is mostmarked in developing countries. Therefore, comparison betweensocio-economic characteristics with the level of accessibility topublic spaces can be useful for future planning.
There is substantial research, especially in the health/epidemi-ology literature, concerned with issues such as measuringaccessibility to public spaces and comparing it with area-levelsocio-economic status. Cummins and Macintyre (1999) describeda preliminary analysis of the location of food outlets in the GreaterGlasgow Health Board Area. They did not find any evidence for theexistence of ‘food deserts’, and found that food stores were morenumerous in the more deprived localities and postcode districtsin the study site. Zenk et al. (2005) evaluated the spatial accessibil-ity of large ‘‘chain” supermarkets in relation to neighborhood racialcomposition and poverty in Metropolitan Detroit. They used a GISto measure Manhattan block distance to the nearest supermarketfor 869 neighborhoods (census tracts) in metropolitan Detroit.The results indicate that distance to the nearest supermarket wassimilar among the least impoverished neighborhoods, regardlessof ethnic composition. Among the most impoverished neighbor-hoods, however, neighborhoods in which African Americans re-sided were, on average, 1.1 miles further from the nearestsupermarket than were Anglo neighborhoods. Pearce et al. (2007)used GIS to calculate geographical access to 16 types of communityresources (including recreational amenities, and shopping, educa-tional and health facilities) in 38,350 small census areas acrossthe country. The distribution of these access measures by neigh-borhood socio-economic deprivation was determined. The resultsof this research indicate that for 15 out of 16 measures of commu-nity resources, access was clearly better in more deprived neigh-borhoods. These results challenge the widely held, but largelyuntested, view that areas of high social disadvantage have pooreraccess to community resources. Similarly, poor locational accessto community resources among deprived neighborhoods in NewZealand does not appear to be an explanation of poorer health inthese neighborhoods.
Larsen and Gilliland (2008) explored the evolution of food de-serts in a mid-sized Canadian city (London, Ontario) by using aGIS to map the precise locations of supermarkets in 1961 and2005; multiple techniques of network analysis were used to assesschanging levels of supermarket access in relation to neighborhood
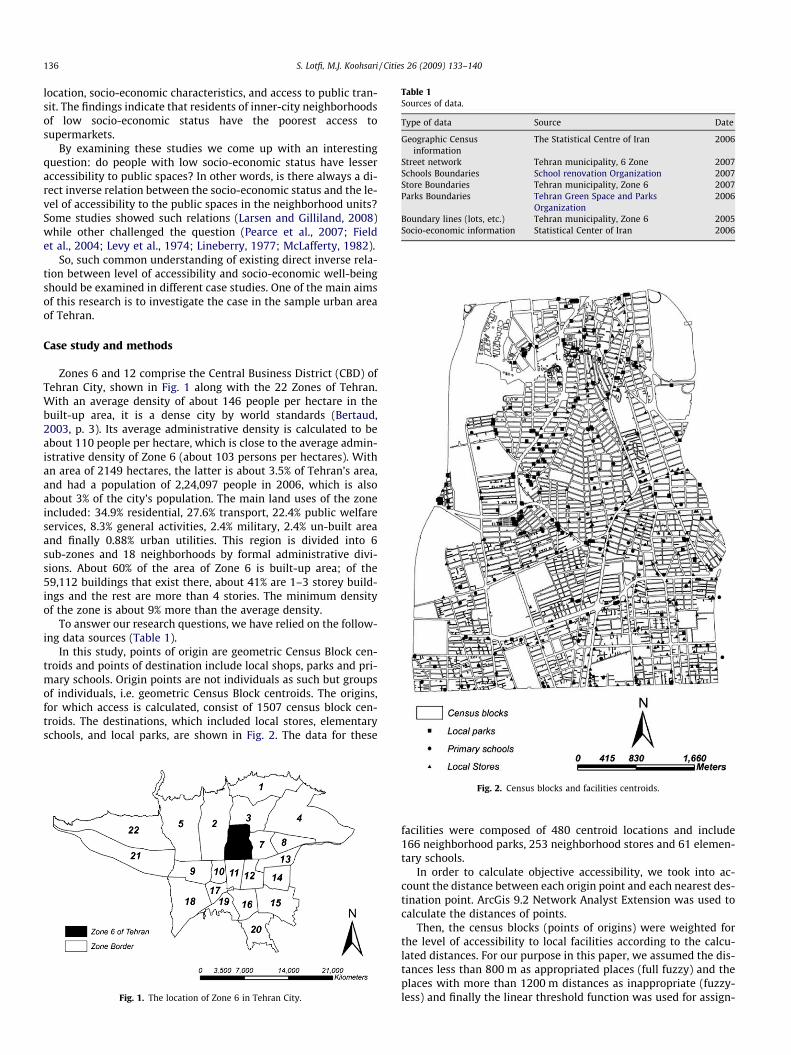
Table 1Sources of data.
Type of data Source Date
Geographic Censusinformation
The Statistical Centre of Iran 2006
Street network Tehran municipality, 6 Zone 2007Schools Boundaries School renovation Organization 2007Store Boundaries Tehran municipality, Zone 6 2007Parks Boundaries Tehran Green Space and Parks
Organization2006
Boundary lines (lots, etc.) Tehran municipality, Zone 6 2005Socio-economic information Statistical Center of Iran 2006
136 S. Lotfi, M.J. Koohsari / Cities 26 (2009) 133–140
location, socio-economic characteristics, and access to public tran-sit. The findings indicate that residents of inner-city neighborhoodsof low socio-economic status have the poorest access tosupermarkets.
By examining these studies we come up with an interestingquestion: do people with low socio-economic status have lesseraccessibility to public spaces? In other words, is there always a di-rect inverse relation between the socio-economic status and the le-vel of accessibility to the public spaces in the neighborhood units?Some studies showed such relations (Larsen and Gilliland, 2008)while other challenged the question (Pearce et al., 2007; Fieldet al., 2004; Levy et al., 1974; Lineberry, 1977; McLafferty, 1982).
So, such common understanding of existing direct inverse rela-tion between level of accessibility and socio-economic well-beingshould be examined in different case studies. One of the main aimsof this research is to investigate the case in the sample urban areaof Tehran.
Case study and methods
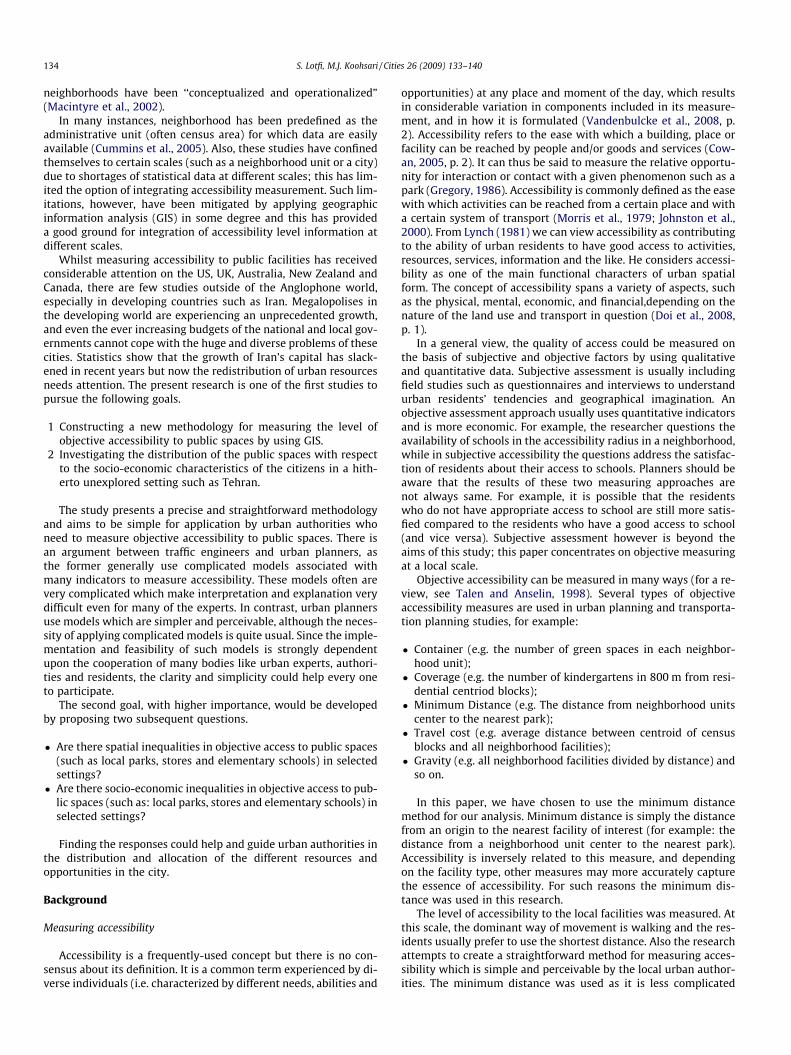
Zones 6 and 12 comprise the Central Business District (CBD) ofTehran City, shown in Fig. 1 along with the 22 Zones of Tehran.With an average density of about 146 people per hectare in thebuilt-up area, it is a dense city by world standards (Bertaud,2003, p. 3). Its average administrative density is calculated to beabout 110 people per hectare, which is close to the average admin-istrative density of Zone 6 (about 103 persons per hectares). Withan area of 2149 hectares, the latter is about 3.5% of Tehran’s area,and had a population of 2,24,097 people in 2006, which is alsoabout 3% of the city’s population. The main land uses of the zoneincluded: 34.9% residential, 27.6% transport, 22.4% public welfareservices, 8.3% general activities, 2.4% military, 2.4% un-built areaand finally 0.88% urban utilities. This region is divided into 6sub-zones and 18 neighborhoods by formal administrative divi-sions. About 60% of the area of Zone 6 is built-up area; of the59,112 buildings that exist there, about 41% are 1–3 storey build-ings and the rest are more than 4 stories. The minimum densityof the zone is about 9% more than the average density.
To answer our research questions, we have relied on the follow-ing data sources (Table 1).
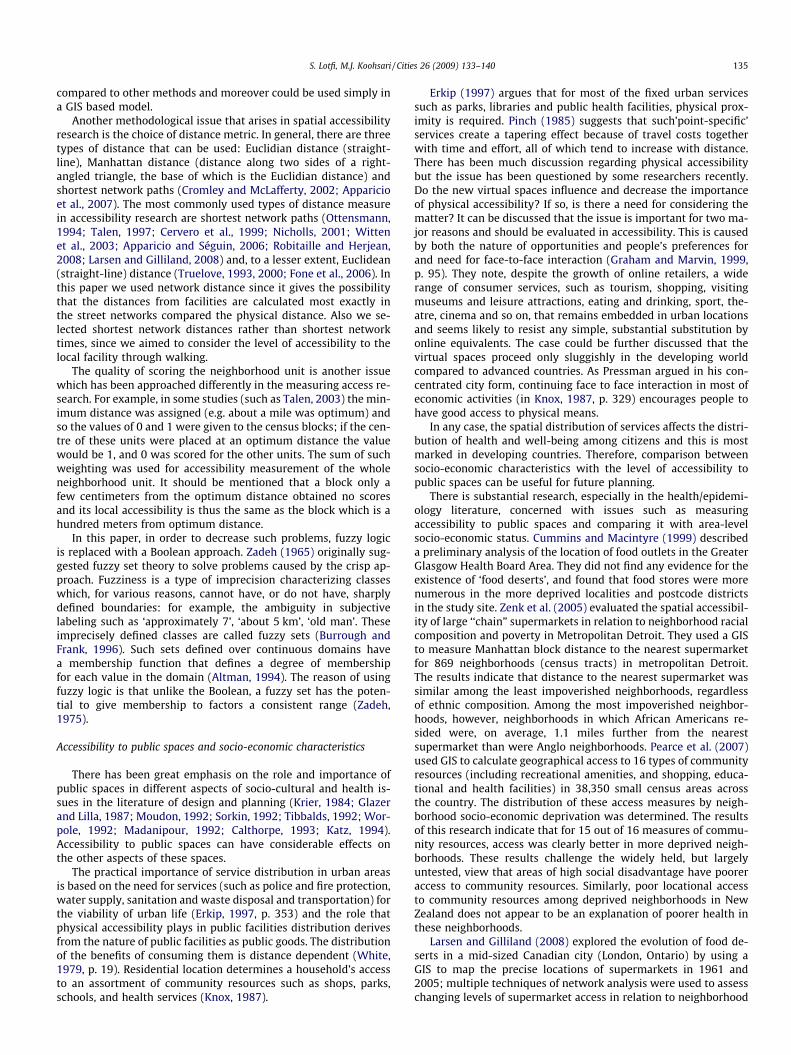
In this study, points of origin are geometric Census Block cen-troids and points of destination include local shops, parks and pri-mary schools. Origin points are not individuals as such but groupsof individuals, i.e. geometric Census Block centroids. The origins,for which access is calculated, consist of 1507 census block cen-troids. The destinations, which included local stores, elementaryschools, and local parks, are shown in Fig. 2. The data for these
Fig. 1. The location of Zone 6 in Tehran City.
Fig. 2. Census blocks and facilities centroids.
facilities were composed of 480 centroid locations and include166 neighborhood parks, 253 neighborhood stores and 61 elemen-tary schools.
In order to calculate objective accessibility, we took into ac-count the distance between each origin point and each nearest des-tination point. ArcGis 9.2 Network Analyst Extension was used tocalculate the distances of points.
Then, the census blocks (points of origins) were weighted forthe level of accessibility to local facilities according to the calcu-lated distances. For our purpose in this paper, we assumed the dis-tances less than 800 m as appropriated places (full fuzzy) and theplaces with more than 1200 m distances as inappropriate (fuzzy-less) and finally the linear threshold function was used for assign-
S. Lotfi, M.J. Koohsari / Cities 26 (2009) 133–140 137
ing fuzziness of distances between 800 and 1200 ms (per followingequation).
FðxÞ ¼1 x < 800 mXmax�X
DX 800 m < x < 1200 m0 X > 1200 m
8><>:
Therefore, the distance of the all blocks to local facilities wasweighted by using fuzzy logic via which each block scored from0 to 1.
After that, the total scores of facility accessibility for a neigh-borhood are obtained by using the sum scores of different censusblocks of a study area. For such purposes, the scores of thesecensus blocks were equiponderated. Population indices of eachcensus block were used to assign their scores of neighborhoodaccessibility. Population has differing importance to the level ofneighborhood accessibility as whole. For example, two neighbor-hoods may be placed at the same distance from facilities and soscored the same, but one of them has 1000 residents and the other3000, so obviously we can not give them the same score; the latterblock should receive more score as it provided accessibility formore population. At this stage, populations of census blocks areclassified and weighted by different methods. Interval values could
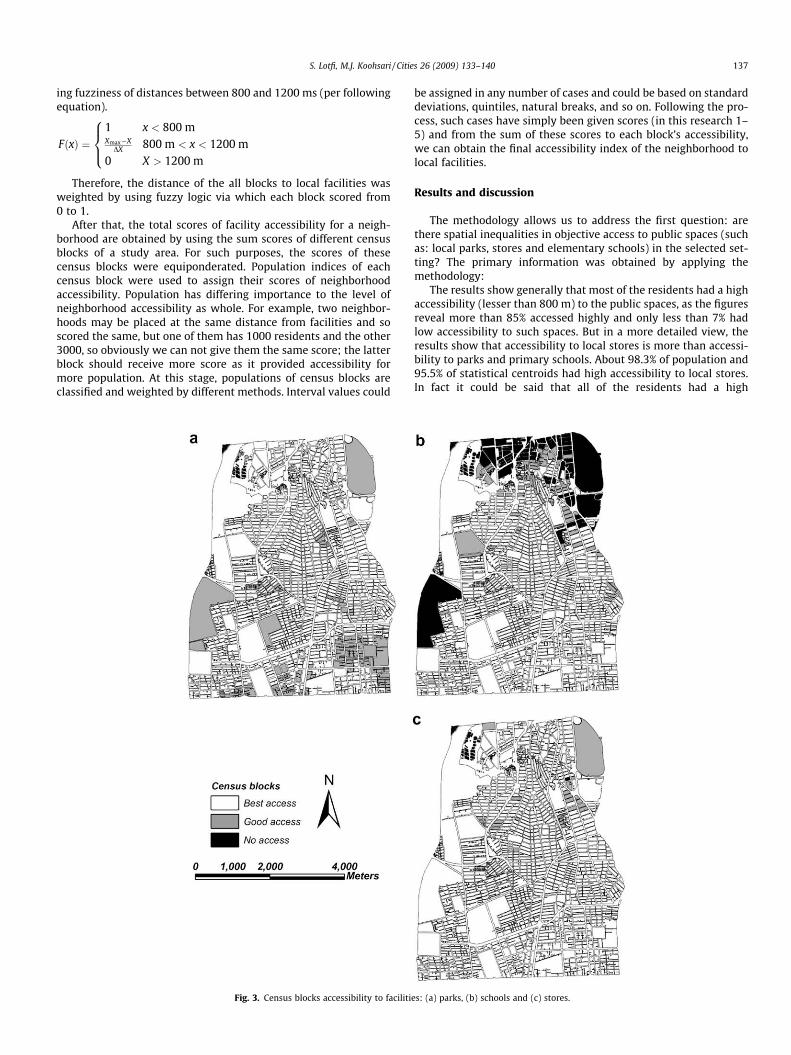
Fig. 3. Census blocks accessibility to faciliti
be assigned in any number of cases and could be based on standarddeviations, quintiles, natural breaks, and so on. Following the pro-cess, such cases have simply been given scores (in this research 1–5) and from the sum of these scores to each block’s accessibility,we can obtain the final accessibility index of the neighborhood tolocal facilities.
Results and discussion
The methodology allows us to address the first question: arethere spatial inequalities in objective access to public spaces (suchas: local parks, stores and elementary schools) in the selected set-ting? The primary information was obtained by applying themethodology:
The results show generally that most of the residents had a highaccessibility (lesser than 800 m) to the public spaces, as the figuresreveal more than 85% accessed highly and only less than 7% hadlow accessibility to such spaces. But in a more detailed view, theresults show that accessibility to local stores is more than accessi-bility to parks and primary schools. About 98.3% of population and95.5% of statistical centroids had high accessibility to local stores.In fact it could be said that all of the residents had a high
es: (a) parks, (b) schools and (c) stores.
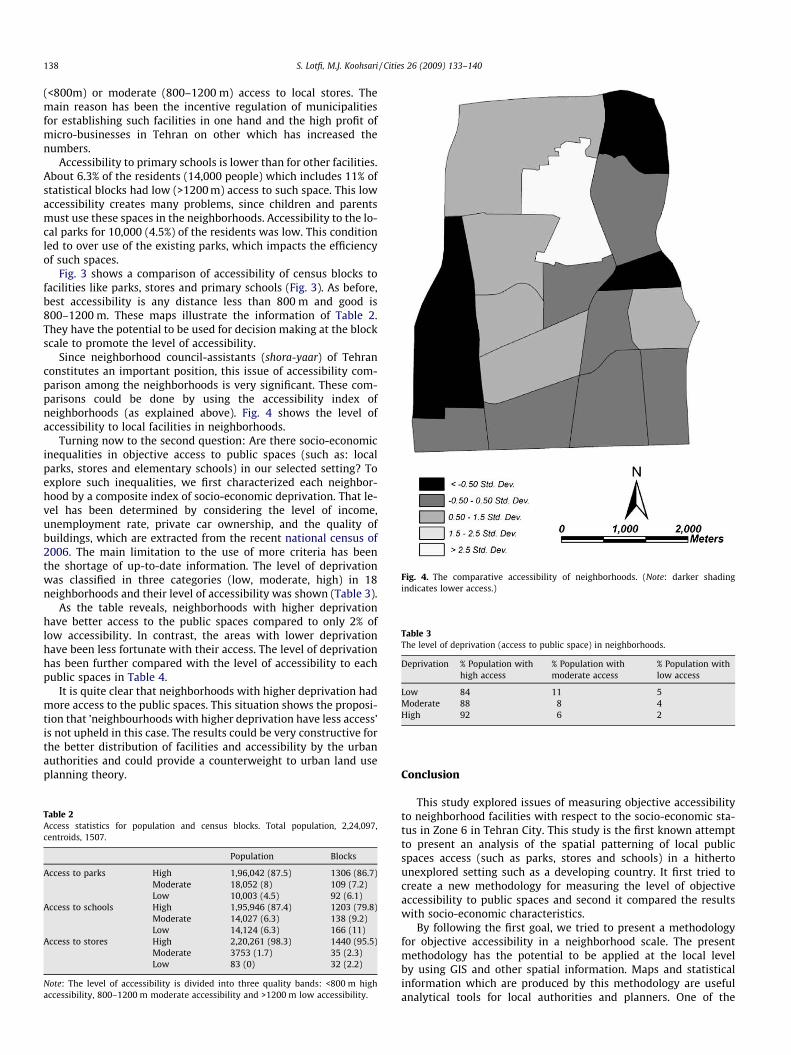
Fig. 4. The comparative accessibility of neighborhoods. (Note: darker shadingindicates lower access.)
Table 3The level of deprivation (access to public space) in neighborhoods.
Deprivation % Population withhigh access
% Population withmoderate access
% Population withlow access
Low 84 11 5Moderate 88 8 4High 92 6 2
138 S. Lotfi, M.J. Koohsari / Cities 26 (2009) 133–140
(<800m) or moderate (800–1200 m) access to local stores. Themain reason has been the incentive regulation of municipalitiesfor establishing such facilities in one hand and the high profit ofmicro-businesses in Tehran on other which has increased thenumbers.
Accessibility to primary schools is lower than for other facilities.About 6.3% of the residents (14,000 people) which includes 11% ofstatistical blocks had low (>1200 m) access to such space. This lowaccessibility creates many problems, since children and parentsmust use these spaces in the neighborhoods. Accessibility to the lo-cal parks for 10,000 (4.5%) of the residents was low. This conditionled to over use of the existing parks, which impacts the efficiencyof such spaces.
Fig. 3 shows a comparison of accessibility of census blocks tofacilities like parks, stores and primary schools (Fig. 3). As before,best accessibility is any distance less than 800 m and good is800–1200 m. These maps illustrate the information of Table 2.They have the potential to be used for decision making at the blockscale to promote the level of accessibility.
Since neighborhood council-assistants (shora-yaar) of Tehranconstitutes an important position, this issue of accessibility com-parison among the neighborhoods is very significant. These com-parisons could be done by using the accessibility index ofneighborhoods (as explained above). Fig. 4 shows the level ofaccessibility to local facilities in neighborhoods.
Turning now to the second question: Are there socio-economicinequalities in objective access to public spaces (such as: localparks, stores and elementary schools) in our selected setting? Toexplore such inequalities, we first characterized each neighbor-hood by a composite index of socio-economic deprivation. That le-vel has been determined by considering the level of income,unemployment rate, private car ownership, and the quality ofbuildings, which are extracted from the recent national census of2006. The main limitation to the use of more criteria has beenthe shortage of up-to-date information. The level of deprivationwas classified in three categories (low, moderate, high) in 18neighborhoods and their level of accessibility was shown (Table 3).
As the table reveals, neighborhoods with higher deprivationhave better access to the public spaces compared to only 2% oflow accessibility. In contrast, the areas with lower deprivationhave been less fortunate with their access. The level of deprivationhas been further compared with the level of accessibility to eachpublic spaces in Table 4.
It is quite clear that neighborhoods with higher deprivation hadmore access to the public spaces. This situation shows the proposi-tion that ’neighbourhoods with higher deprivation have less access’is not upheld in this case. The results could be very constructive forthe better distribution of facilities and accessibility by the urbanauthorities and could provide a counterweight to urban land useplanning theory.
Table 2Access statistics for population and census blocks. Total population, 2,24,097,centroids, 1507.
Population Blocks
Access to parks High 1,96,042 (87.5) 1306 (86.7)Moderate 18,052 (8) 109 (7.2)Low 10,003 (4.5) 92 (6.1)
Access to schools High 1,95,946 (87.4) 1203 (79.8)Moderate 14,027 (6.3) 138 (9.2)Low 14,124 (6.3) 166 (11)
Access to stores High 2,20,261 (98.3) 1440 (95.5)Moderate 3753 (1.7) 35 (2.3)Low 83 (0) 32 (2.2)
Note: The level of accessibility is divided into three quality bands: <800 m highaccessibility, 800–1200 m moderate accessibility and >1200 m low accessibility.
Conclusion
This study explored issues of measuring objective accessibilityto neighborhood facilities with respect to the socio-economic sta-tus in Zone 6 in Tehran City. This study is the first known attemptto present an analysis of the spatial patterning of local publicspaces access (such as parks, stores and schools) in a hithertounexplored setting such as a developing country. It first tried tocreate a new methodology for measuring the level of objectiveaccessibility to public spaces and second it compared the resultswith socio-economic characteristics.
By following the first goal, we tried to present a methodologyfor objective accessibility in a neighborhood scale. The presentmethodology has the potential to be applied at the local levelby using GIS and other spatial information. Maps and statisticalinformation which are produced by this methodology are usefulanalytical tools for local authorities and planners. One of the
Table 4Comparison the level of deprivation with the level of access to each public spaces in neighborhoods.
Deprivation Access to parks Access to schools Access to stores
% Populationwith highaccess
% Populationwith moderateaccess
% Populationwith lowaccess
% Populationwith highaccess
% Populationwith moderateaccess
% Populationwith lowaccess
% Populationwith highaccess
% Populationwith moderateaccess
% Populationwith lowaccess
Low 82 12 6 76 16 8 93 4 3Moderate 87 9 4 83 12 5 95 4 1High 91 7 2 87 9 5 98 2 0
S. Lotfi, M.J. Koohsari / Cities 26 (2009) 133–140 139
innovations of the present research was using a fuzzy approachfor measuring objective accessibility. It should be mentionedhowever, that the methodology has some limitations. For exam-ple collecting socio-economic date is very costly and time-con-suming at local scales but these data are very important for theanalysis and interpretation of the results. Also in this methodol-ogy the main consideration is concentrated on quantities of localfacilities. This problem could be solved by integrating the resul-tant objective accessibility with the subjective accessibility ofthe citizens. It means that the weight and importance of the facil-ities should be assigned by the resident attitudes (from measur-ing subjective accessibility) and then measured with objectiveaccessibility. This method has the potential to be applied in urbanzones with different scales and could be an important guide forurban authorities, experts and agendas.
The results clarified that many parameters have to be taken inaccount for urban public space distribution. For instance, it canbe argued that poor households usually use the nearest facilitiesto avoid transport costs, while high income groups prefer to travelfarther distances to stay away from crowded parks, schools andother public spaces. Overall, the case of Tehran has shown that ur-ban designers have to correct their understanding about urban is-sues and consider the social behaviour of the residents who may belive in deprived neighborhoods but it does not necessarily meanthat they are excluded from using public spaces, as they are phys-ically closer to these places.
Acknowledgements
We would like to thank Professor Kirby and two anonymousreviewers for their valuable and insightful comments andsuggestions.
References
Altman, D A (1994) Fuzzy set theoretic approaches for handling imprecision inspatial analysis. International Journal of GIS 8, 271–289.
Apparicio, P and Séguin, A M (2006) Measuring the accessibility of services andfacilities for residents of public housing in Montréal. Urban Studies 43(1), 187–211.
Apparicio, P, Cloutier, M S and Shearmur, R (2007) The case of Montreal’s missingfood deserts: Evaluation of accessibility to food supermarkets. InternationalJournal of Health Geographies 6(4). doi:10.1186/1476-072X-6-4.
Bertaud A (2003) Tehran Spatial Structure: Constraints and Opportunities for FutureDevelopment, Ministry of Housing and Urban Development, Tehran.
Burrough, P A and Frank, A U (Eds) (1996) Geographic Objects with IndeterminateBoundaries, Taylor and Francis, London.
Calthorpe, P (1993) The Next American Metropolis. Princeton Architectural Press,New York.
Cervero, R, Rood, T and Appleyard, B (1999) Tracking accessibility: employment andhousing opportunities in the San Francisco Bay Area. Environment and PlanningA 31, 1259–1278.
Coutts, C (2008) Greenway accessibility and physical-activity behavior. Environmentand Planning B 35, 552–563.
Cowan, R (2005) The Dictionary of Urbanism. Streetwise Press, Wiltshire.Cromley, E K and McLafferty, S (2002) GIS and Public Health. Guilford Press, New
York.Cummins, S and Macintyre, S (1999) The location of food stores in urban areas: a
case study in Glasgow. British Food Journal 101(7), 545–553.Cummins, S and Macintyre, S (2002) A systematic study of an urban foodscape: the
price and availability of food in Greater Glasgow. Urban Studies 39, 2115–2130.
Cummins, S, Macintyre, S, Davidson, S and Ellaway, A (2005) A methodology formeasuring neighbourhood social and material context: generation andinterpretation using routine and non-routine data. Health and Place 11(3),249–260.
Diez Roux, A, Evenson, K, McGinn, A, Brown, D G, Moore, L, Brines, S and Jacobs, D R(2007) Availability of recreational resources and physical activity in adults.American Journal of Public Health 97, 493–499.
Doi, K, Kii, M and Nakanishi, H (2008) An integrated evaluation method ofaccessibility, quality of life, and social interaction. Environment and Planning B35(6), 1098–1116. doi:10.1068/b3315t.
Erkip, F (1997) The distribution of urban public services: the case of parks andrecreational services in Ankara. Cities 14(6), 353–361.
Field, A, Witten, K, Robinson, E and Pledger, M (2004) Who gets to what? Access tocommunity resources in two New Zealand cities. Urban Policy and Research 22,189–205.
Fone, D L, Christie, S and Lester, N (2006) Comparison of perceived and modelledgeographical access to accident and emergency departments: a cross-sectionalanalysis from the Caerphilly Health and Social Needs Study. International Journalof Health Geographics 5(16). doi:10.1186/1476-072X-5-16.
Fortney, J, Rost, K and Warren, J (2000) Comparing alternative methods ofmeasuring geographic access to health services. Health Services & OutcomesResearch Methodology 1(2), 173–184.
Glazer, N and Lilla, M (1987) The Public Face of Architecture. Free Press, New York.Graham, S and Marvin, S (1999) Planning cybercities? Integrating telecommuni-
cations into urban planning? Town Planning Review 70, 79–114.Gregory, D (1986) Accessibility. In The Dictionary of Human Geography, R J Johnston,
D Gregory and D R Stoddart (eds.), second ed, p. 2. Blackwell, Oxford, England.Hillsdon, M, Panter, J, Foster, C and Jones, A (2006) The relationship between access
and quality of urban green space with population physical activity. Public Health120, 1127–1132.
Johnston, R J, Gregory, D, Pratt, G and Watts, M (2000) The Dictionary of HumanGeography. Blackwell Publishing, Oxford.
Katz, P (1994) The New Urbanism: Toward an Architecture of Community. McGrawHill, New York.
Knox, P (1987) Urban Social Geography, an Introduction. second ed. LongmanScientific & Technical.
Krier, L (1984). Houses, Palaces and Cities. St. Martin’s Press, New York.Larsen, K and Gilliland, J (2008) Mapping the evolution of ‘food deserts’ in a
Canadian city: supermarket accessibility in London, Ontario, 1961–2005.International Journal of Health Geographics 7(16). doi:10.1186/1476-072X-7-16.
Levy, F, Meltsner, A and Wildavsky, A (1974) Urban Outcomes: Schools, Streets, andLibraries. University of California Press, San Francisco, CA.
Lineberry, R L (1977) Equality and Urban Policy: The Distribution of Municipal PublicServices. Sage, Beverly Hills, CA.
Luo, W and Wang, F (2003) Measures of spatial accessibility to health care in a GISenvironment: synthesis and a case study in the Chicago region. Environment andPlanning B 30, 865–884.
Lynch, K (1981) Good City Form. MIT Press, Cambridge, MA.Macintyre, S, Ellaway, A and Cummins, S (2002) Place effects on health: how can we
conceptualise, operationalise and measure them? Social Science and Medicine55, 125–139.
Madanipour, A (1992) Design of Urban Space: An Inquiry into a Socio-Spatial Process.Wiley, West Sussex.
Massam, B H (2002) Quality of life: public planning and private living. Progress inPlanning 58, 141–227.
McLafferty, S (1982) Urban structure and geographical access to public services.Annals of the Association of American Geographers 72, 347–354.
Morris, J M, Dumble, P L and Wigan, M R (1979) Accessibility indicators fortransportation planning. Transportation Research A 13, 91–109.
Moudon, A V (1992) A Catholic approach to organizing what urban designers shouldknow. Journal of Planning Literature 6(4), 331–349.
Nicholls, S (2001) Measuring the accessibility and equity of public parks: a casestudy using GIS. Managing Leisure 6(4), 201–219.
Ottensmann, J R (1994) Evaluating equity in service delivery in library branches.Journal of Urban Affairs 16, 109–123.
Park and Green Space Organization of Tehran (2006) Static of parks and green space.Pearce, J, Witten, K and Bartie, P (2006) Neighbourhoods and health: a GIS approach
to measuring community resource accessibility. J Epidemiol Community Health60, 389–395.
Pearce, J, Witten, K, Hiscock, R and Blakely, T (2007) Are socially disadvantagedneighbourhoods deprived of health-related community resources? InternationalJournal of Epidemiology 36, 348–355.
140 S. Lotfi, M.J. Koohsari / Cities 26 (2009) 133–140
Pearce, J, Witten, K, Hiscock, R and Blakely, T (2008) Regional and urban-ruralvariations in the association of neighbourhood deprivation with communityresource access: a national study. Environment and Planning A 40, 2469–2489.
Pinch, S (1985) Cities and Services. Routledge & Kegan Paul, London.Robitaille, E and Herjean, P (2008) An analysis of the accessibility of video lottery
terminals: the case of Montréal. International Journal of Health Geographics 7(2).doi:10.1186/1476-072X-7-2.
School Renovation Organization (2007) Primary school information of Tehran city,Tehran.
SCI Center of Iran The National census of 1996 and 2006.Sorkin, M (1992) Variations on a Theme Park: The New American City and the End of
Public Space. Hill and Wang, New York.Talen, E (1997) The social equity of urban service distribution: an exploration of
park access in Pueblo, Colorado, and Macon, Georgia. Urban Geography 18, 521–541.
Talen, E and Anselin, L (1998) Assessing spatial equity: an evaluation of measures ofaccessibility to public playgrounds. Environment and Planning A 30, 595–613.
Talen, E (2003) Neighborhoods as service providers: a methodology for evaluatingpedestrian access. Environment and Planning B 30, 181–200.
Tanser, F, Gijsbertsen, B and Herbst, K (2006) Modelling and understanding primaryhealth care accessibility and utilization in rural South Africa: An explorationusing a geographical information system. Social Science & Medicine 63, 691–705.
Tibbalds, F (1992) Making People Friendly Towns: Improving the Public Environmentsin Towns and Cities. Longman Press, Harlow, Essex.
Truelove, M (1993) Measurement of spatial equity. Environment and Planning C 11,19–34.
Truelove, M (2000) Services for immigrant women: an evaluation of locations. TheCanadian Geographer 44, 135–151.
Vandenbulcke, G, Steenberghen, T and Thomas, I (2008) Mapping accessibility inBelgium: a tool for land-use and transport planning? Journal of TransportGeography. doi:10.1016/j.jtrangeo.2008.04.008.
Witten, K, Exeter, D and Field, A (2003) The quality of urban environments:mapping variation in access to community resources. Urban Studies 40(1), 161–177.
Witten, K, Hiscock, R, Pearce, J and Blakely, T (2008) Neighborhood access to openspaces and the physical activity of residents: a national study. PreventiveMedicine 47, 299–303.
White, A N (1979) Accessibility and public facility location. Economic Geography55(1), 18–35.
Worpole, K (1992) Towns for People: Transforming Urban Life. Buckingham UniversityPress.
Yang, D H, Goerge, R and Mullner, R (2006) Comparing GIS-based methods ofmeasuring spatial accessibility to health services. Journal of Medical Systems30(1), 23–32.
Zadeh, L A (1965) Fuzzy sets. Information and Control 8, 338–353.Zadeh, L A (1975) The concept of linguistic variable and its application to
approximate reasoning. Information Sciences 8, 199–249.Zenk, S N, Schulz, A J, Israel, B A, James, S A, Bao, S and Wilson, M L (2005)
Neighborhood racial composition, neighborhood poverty, and the spatialaccessibility of supermarkets in Metropolitan Detroit. American Journal ofPublic Health 95(4), 660–667.


