
Measuring Gaze Depth with an Eye Tracker During Stereoscopic Display
Andrew T. Duchowski, Brandon Pelfrey, Donald H. House, Rui Wang∗
School of Computing, Clemson University
Abstract
While determining 2D gaze position using eye tracking is commonpractice, the efficacy of using eye tracking to measure 3D gazepoint in a stereoscopic display has not been carefully studied. Inthis paper we explore this issue using a custom Wheatstone stereo-scope augmented with an eye tracker. In a pilot study, we showedthat there is strong evidence that eye vergence measurements do,in fact, track the depth component of the 3D stereo gaze point. Ina subsequent full study, we compare depth estimation for a sceneviewed in four different ways: without either stereo or motion par-allax, without stereo but with motion parallax, with stereo but with-out motion parallax, and with both stereo and motion parallax. Weshow a significant effect related to depth from eye vergence for bothof the stereo cases, but no effect for the monoscopic cases. Sincedepth from vergence is very noisy, we use a Butterworth filter tosmooth the data and show that this greatly improves the stability ofthe depth reading without significant lag or loss in accuracy. Wealso demonstrate that using quadratic regression to perform a depthcalibration can greatly improve the accuracy of the depth measure-ment.
CR Categories: I.3.3 [Computer Graphics]: Picture/Im-age Generation—Display algorithms; I.3.6 [Computer Graphics]:Methodology and Techniques—Ergonomics;
Keywords: eye tracking, stereoscope, stereoscopic rendering
1 Introduction
Since their 1838 introduction by Sir Charles Wheatstone [Wheat-stone 1838; Lipton 1982], stereoscopic images have appeared ina variety of forms, including dichoptic stereo pairs (different im-age to each eye), random-dot stereograms [Julesz 1964], autostere-ograms (e.g., the popular Magic Eye and Magic Eye II images), andanaglyphic images and movies, with the latter currently resurgingin popularity in American cinema (e.g., Avatar, Twentieth CenturyFox Film Corporation).
Eye trackers, while still expensive compared to the cost of com-puters, are readily available, reliable, accurate and relatively easyto use. Perhaps less dramatically, there is a developing perceptualscience behind the design of visualizations for optimal data or in-formation display. Most notably, the texts by Ware [2004; 2008]focus on perceptual issues in visualization design. While there isa natural and obvious tie between eye tracking and the science be-hind the perceptual optimization of visualization design, there havebeen as yet no such studies in the important area of stereoscopicvisualization.
∗Email: {andrewd | bpelfre | dhouse | rwang3}@cs.clemson.edu
This paper is directed at beginning to build a solid understandingof how to track gaze for stereo displays, with the ultimate goal ofgaining new insights into visualization design principles for stereodisplays. It describes a study that exploits binocular eye trackingin a simple perceptual experiment designed to elicit vergence eyemovement. Specifically, a remote eye tracker is used to measuredepth from ocular vergence when viewing stimuli presented usinga Wheatstone stereoscope. We show that the measured depth isnoisy, but clearly responds to the depth component of a 3D stereotarget.
The paper presents techniques for smoothing the noisy signal aswell as for fitting it to targets at known depth. The combined ap-proach points the way to a sound new method for pre-calibratingand utilizing a viewer’s gaze depth in real-time under stereoscopicconditions.
2 Background
The convergent movement of the eyes (binocular convergence), i.e.,their simultaneous inward rotation toward each other (cf. diver-gence which denotes the outward rotation), ensures that the pro-jection of images on the retina of both eyes are in registration witheach other, allowing the brain to fuse the images into a single per-cept. This fused percept provides stereoscopic vision of three-dimensional space. Normal binocular vision is primarily charac-terized by this type of fusional vergence of the disparate retinalimages [Shakhnovich 1977]. Vergence driven by retinal blur isdistinguished as accommodative vergence [Buttner-Ennever 1988].Fusional vergence and accommodative vergence are known to betightly coupled in the human visual system [Fincham and Walton1957].
Dichoptic presentation of stereo displays typically decouplesthe link between vergence and accommodation—the eye’s fo-cusing ability—by changing the curvature of the eye’s crys-talline lens. Stereoscopic decoupling occurs when the viewer’saccommodation-vergence reflex verges the eyes at a fixation pointat the screen surface while the binocular disparity component ofthe depth signal can move freely in front of or behind the screensurface. This decoupling is considered to be the source of eyestrain and fatigue leading to discomfort with the use of such sys-tems [Howard and Rogers 2002].
While the dissociative problems of accommodation and vergencehave been studied over the last few years, measurement techniques,especially of vergence, have not improved much over this time. Inparticular, no eye-tracking system exists that could measure ver-gence in real-time with no restriction of the field of view or headmovement. An infra-red limbus tracker has been used to recordvergence eye movements during the use of a Helmet-Mounted Dis-play, or HMD [Wann et al. 1995]. Since then, the vergence issue hasmainly been investigated indirectly via systematic manipulation ofeasily adjustable parameters, namely those of head-mounted opticsand screen disparity.
To gauge the effect of stereo display on ocular vergence, it is suffi-cient to measure the disparity between the left and right horizontalgaze coordinates, e.g., xr−xl given the left and right gaze points,(xl, yl), (xr, yr) as delivered by current binocular eye trackers.Thus far, to our knowledge, the only such vergence measurements

Figure 1: Wheatstone stereoscope used in the study.
to have been carried out have been performed over random dotstereograms or anaglyphic stereoscopic video [Essig et al. 2004;Daugherty et al. 2010].
In this paper, vergence measurements are made with a commer-cially available eye tracker when viewing the Wheatstone stereo-scope’s fused display. Although depth perception has been stud-ied on desktop 3D displays [Holliman et al. 2007], eye movementswere not used to verify vergence. Holliman et al. conclude thatdepth judgment cannot always be predicted from display geome-try alone. The only other similar effort we are aware of is mea-surement of interocular distance on a stereo display during ren-dering of a stereo image at five different depths [Kwon and Shul2006]. Interocular distance was seen to range by about 10 pixelsacross three participants. In this paper, we report observations onhow gaze depth responds to targets at different stereo depths whenshown monoscopically or stereoscopically.
3 Methodology
Our study was designed to gauge the relationship between gazedepth as determined by eye vergence response and presentationdepth in a stereoscopic display. To do so we used an eye trackerto infer 3D gaze position from the gaze directions of the two eyes,while the viewer observed a set of stimuli arranged in space anddisplayed in stereo. All subjects were tested for the ability to cor-rectly understand depth relationships in a random dot stereogram,and subjective impressions of the displays were obtained using aquestionnaire.
3.1 Apparatus
A custom built, high-resolution, Wheatstone-style stereoscope,whose original design was first reported by Bair et al. [2006], wasused for our experiments. Figure 1 shows this stereoscope in use.It was constructed by fixing two IBM T221 “Big Bertha” LCD dis-plays on a track, on opposite sides of two small mirrors angled at45◦ from the medial axis. The screens are 48 cm wide and 30 cmhigh (16:10), with a screen resolution of 3840×2400, or 9.2 millionpixels. The screens were set at a viewing distance of 86 cm fromthe nominal eye point. This yielded a visual angle per pixel of ap-proximately 30 seconds of arc. This is comparable to the size of thereceptors in the fovea and is sufficient to display the finest gratingpattern that can be resolved by the human eye—about 60 cycles perdegree, corresponding to 1 cycle per minute of visual angle [Camp-bell and Green 1965]. According to the manufacturer, the screencontrast ratio is 400:1, and maximum brightness is 235 cd/m2. Im-
left screen right screen
virtual screen
eyes
mirrors
Figure 2: Optics of a Wheatstone stereoscope.
ages were rendered assuming an eye separation of 6.3 cm. Themonitors and mirrors were carefully aligned so that when lookinginto the mirrors, both monitors are fused into a single virtual image,as illustrated in Figure 2. By displaying a view rendered from theleft eye position on the left monitor, and the right eye position onthe right monitor, a very high quality, high luminance stereoscopicimage is formed.
Eye tracking cameras from LC Technologies were mounted beneatheach monitor. The cameras were part of LC Technologies’ EyegazeSystem that is used to image the viewer’s eyes as seen by the cam-eras in the mirrors. Each of the cameras houses a small, low power,infrared light emitting diode (LED) located at the center of the cam-era lens illuminating the eye [Hutchinson 1989]. The Eyegaze sys-tem uses the Pupil-Corneal Reflection (P-CR) method to measurethe direction of the eye’s gaze, sampling at 60 Hz with Root MeanSquared (RMS) tracking error of 0.635 cm or less [LC Technolgies,Inc. 2010]. A proprietary algorithm is used to provide gaze depth(z), along with the xy coordinates of the gaze points of the twoeyes.
The Eyegaze System server ran on a Mac Mini running the WindowsXP operating system. The client display application ran on an In-tel Xeon E5502 Quadcore PC equipped with two NVIDIA QuadroFX 5800 graphics cards and running the CentOS Linux operatingsystem. One graphics card drives the left half of each of the BigBertha monitors using clone mode stereo, and the other card drivesthe right half. The client/server PCs were connected via 1 Gb Eth-ernet (connected via a switch on the same subnet).
3.2 Stimulus
To elicit the perception of depth, a 5×5 grid of cubes was renderedwith the closest row of cubes shown at 30 cm in front of the screenwith each of the four remaining rows 12 cm farther from the viewerthan the last (see Figure 3). Each cube measured 2×2×2 cm. Aright-handed coordinate system was used so that the screen planewas aligned at z = 0, three cube rows were made to project in frontof the screen at depths z = 30, z = 18 and z = 6, and two rowsreceded into the screen at depths z = −6 and z = −18.
In order to provide depth cues from motion, the cube grid was de-signed so that it can rock around its vertical center by a total angleof 80◦ (40◦ to the left and right) within a 5-second cycle. Note thatthis is equivalent to rotating the camera around the vertical centerof the scene, and induces motion parallax. In order to draw theviewer’s attention to the cube that they were to attend to, individualcubes could also rock. Individual cubes rock 7◦ (3.5◦ to the leftand right) over each 5-second viewing cycle.

(a) Stimulus rocking left (b) Stimulus at center (c) Stimulus rocking right
Figure 3: Stimulus: a 5×5 grid of cubes rendered with the closest row of cubes shown at 30 cm in front of the screen with each of the fourremaining rows 12 cm farther from the viewer. The cube grid can rotate, or rock around its vertical center, (a) 40◦ to the left, (c) 40◦ to theright, or (b) remain fixed. An individual cube can rock, indicating to the viewer which cube to fixate (as shown in (a)).
Figure 4: Random-dot stereogram pair used for pre-screening.
3.3 Experimental Design
The experiment consisted of a within-subjects 2 (display) × 2 (mo-tion parallax) × 5 (depth) design. The display was either renderedmonoscopically or stereoscopically, motion parallax was inducedby either rocking the cube grid or holding it steady (fronto-parallelto the image plane), and depth was indicated to the viewer by rock-ing the individual cube that the viewer was asked to fixate.
The primary task assigned to participants was to visually fixatewhichever single cube was rocking. Individual cube rocking orderalways proceeded along either the left, center, or right column ofthe cube grid. The column selected went from left to right or rightto left, and the starting row either began at the front (protruding outof the screen) or at the back (receding toward the screen interior).
Familiarity and fatigue effects were mitigated by counterbalanc-ing both the 2 × 2 stereo and motion combinations, and by al-ternating depth order. Treating stereo and motion as four condi-tions, {A, B, C, D}, referring to the tensor product combinationsof {monoscopic, stereoscopic} ⊗ {static, rocking}, respectively,viewing trials were presented in rotated Latin square order. Depthwas varied so that all even-number participants were asked to fixatecubes at a depth starting in the back and progressing to the front,and odd-number participants from front to back.
3.4 Participants
Twenty college students (18 M, 2 F; ages 16-34) participated inthe study, recruited verbally on a volunteer basis. Two of the par-ticipants wore contact lenses, the rest wore no type of correctivelenses. All had a minimum of six years experience with computersand all spent at least two hours per day at a computer. Only threeparticipants had previously seen a stereoscopic film.
Participants were not pre-screened for color blindness, but werepre-screened for depth perception by showing them the random-dotstereogram display of two tiles as depicted with left and right eyeviews superimposed in Figure 4. For persons with normal stereovision, the left tile’s disparity placed it behind the screen, and theright tile’s disparity placed it in front of the screen. All but oneparticipant was able to see this depth difference correctly, with thisparticipant seeing the two tiles at the same depth.
3.5 Procedure
Following introductions and reading of the Institutional ReviewBoard’s approved informational letter, demographic informationwas collected consisting of the participant’s age, gender, usage ofcorrected lenses and computer experience. Each participant filledout a short pre-test questionnaire regarding their familiarity withstereoscopic displays. The stereogram pair was then presented andthe participant was asked whether either of the stereograms pro-truded out of the screen, receded into the screen, or was alignedflat with the screen plane (the right stereogram protruded out of thescreen in all cases).
A quick (two-dimensional) calibration of the eye tracker was thenperformed by having participants visually follow a roving dot be-tween nine different locations on the screen. After presentation ofthe initial nine targets, the calibration procedure can be acceptedand terminated by the experimenter, or it can be allowed to pro-ceed until the average calibration error is reduced to an acceptablelevel. A pilot study conducted prior to the experiment indicated thatgaze depth estimation was heavily dependent on calibration accu-racy. Thus, we chose to continue calibration until the average accu-racy was reduced below 1.3 cm accuracy. An example of the serverscreen displaying calibration results is shown in Figure 5. The cali-bration points are shown as round dots, and the corresponding aver-age gaze points are shown as crosses. The two image inserts showthe two eye tracker camera views, and the selected eye regions ofthese views.
After 2D calibration, the participant was shown the first of fourvariations of the cube grid. Following visual fixation of 15 cubes
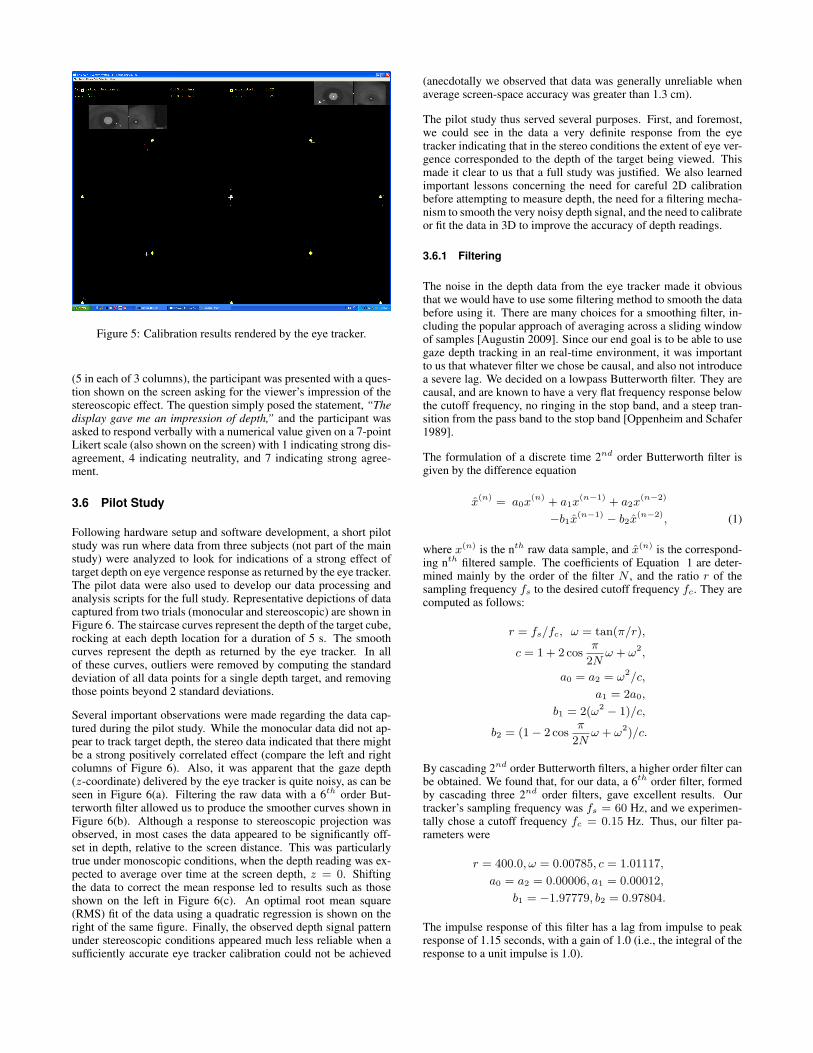
Figure 5: Calibration results rendered by the eye tracker.
(5 in each of 3 columns), the participant was presented with a ques-tion shown on the screen asking for the viewer’s impression of thestereoscopic effect. The question simply posed the statement, “Thedisplay gave me an impression of depth,” and the participant wasasked to respond verbally with a numerical value given on a 7-pointLikert scale (also shown on the screen) with 1 indicating strong dis-agreement, 4 indicating neutrality, and 7 indicating strong agree-ment.
3.6 Pilot Study
Following hardware setup and software development, a short pilotstudy was run where data from three subjects (not part of the mainstudy) were analyzed to look for indications of a strong effect oftarget depth on eye vergence response as returned by the eye tracker.The pilot data were also used to develop our data processing andanalysis scripts for the full study. Representative depictions of datacaptured from two trials (monocular and stereoscopic) are shown inFigure 6. The staircase curves represent the depth of the target cube,rocking at each depth location for a duration of 5 s. The smoothcurves represent the depth as returned by the eye tracker. In allof these curves, outliers were removed by computing the standarddeviation of all data points for a single depth target, and removingthose points beyond 2 standard deviations.
Several important observations were made regarding the data cap-tured during the pilot study. While the monocular data did not ap-pear to track target depth, the stereo data indicated that there mightbe a strong positively correlated effect (compare the left and rightcolumns of Figure 6). Also, it was apparent that the gaze depth(z-coordinate) delivered by the eye tracker is quite noisy, as can beseen in Figure 6(a). Filtering the raw data with a 6th order But-terworth filter allowed us to produce the smoother curves shown inFigure 6(b). Although a response to stereoscopic projection wasobserved, in most cases the data appeared to be significantly off-set in depth, relative to the screen distance. This was particularlytrue under monoscopic conditions, when the depth reading was ex-pected to average over time at the screen depth, z = 0. Shiftingthe data to correct the mean response led to results such as thoseshown on the left in Figure 6(c). An optimal root mean square(RMS) fit of the data using a quadratic regression is shown on theright of the same figure. Finally, the observed depth signal patternunder stereoscopic conditions appeared much less reliable when asufficiently accurate eye tracker calibration could not be achieved
(anecdotally we observed that data was generally unreliable whenaverage screen-space accuracy was greater than 1.3 cm).
The pilot study thus served several purposes. First, and foremost,we could see in the data a very definite response from the eyetracker indicating that in the stereo conditions the extent of eye ver-gence corresponded to the depth of the target being viewed. Thismade it clear to us that a full study was justified. We also learnedimportant lessons concerning the need for careful 2D calibrationbefore attempting to measure depth, the need for a filtering mecha-nism to smooth the very noisy depth signal, and the need to calibrateor fit the data in 3D to improve the accuracy of depth readings.
3.6.1 Filtering
The noise in the depth data from the eye tracker made it obviousthat we would have to use some filtering method to smooth the databefore using it. There are many choices for a smoothing filter, in-cluding the popular approach of averaging across a sliding windowof samples [Augustin 2009]. Since our end goal is to be able to usegaze depth tracking in an real-time environment, it was importantto us that whatever filter we chose be causal, and also not introducea severe lag. We decided on a lowpass Butterworth filter. They arecausal, and are known to have a very flat frequency response belowthe cutoff frequency, no ringing in the stop band, and a steep tran-sition from the pass band to the stop band [Oppenheim and Schafer1989].
The formulation of a discrete time 2nd order Butterworth filter isgiven by the difference equation
x(n) = a0x(n) + a1x
(n−1) + a2x(n−2)
−b1x(n−1) − b2x
(n−2), (1)
where x(n) is the nth raw data sample, and x(n) is the correspond-ing nth filtered sample. The coefficients of Equation 1 are deter-mined mainly by the order of the filter N , and the ratio r of thesampling frequency fs to the desired cutoff frequency fc. They arecomputed as follows:
r = fs/fc, ω = tan(π/r),
c = 1 + 2 cosπ
2Nω + ω2,
a0 = a2 = ω2/c,
a1 = 2a0,
b1 = 2(ω2 − 1)/c,
b2 = (1− 2 cosπ
2Nω + ω2)/c.
By cascading 2nd order Butterworth filters, a higher order filter canbe obtained. We found that, for our data, a 6th order filter, formedby cascading three 2nd order filters, gave excellent results. Ourtracker’s sampling frequency was fs = 60 Hz, and we experimen-tally chose a cutoff frequency fc = 0.15 Hz. Thus, our filter pa-rameters were
r = 400.0, ω = 0.00785, c = 1.01117,
a0 = a2 = 0.00006, a1 = 0.00012,
b1 = −1.97779, b2 = 0.97804.
The impulse response of this filter has a lag from impulse to peakresponse of 1.15 seconds, with a gain of 1.0 (i.e., the integral of theresponse to a unit impulse is 1.0).

-30
-20
-10
0
10
20
30
0 10 20 30 40 50 60 70 80 90
Ga
ze
z-c
oo
rdin
ate
(cm
)
Time (s)
Observed gaze depth (with outliers beyond 2 SD removed):mono, static
gaze depthstimulus depth -30
-20
-10
0
10
20
30
0 10 20 30 40 50 60 70 80 90
Ga
ze
z-c
oo
rdin
ate
(cm
)
Time (s)
Observed gaze depth (with outliers beyond 2 SD removed):stereo, rocking
gaze depthstimulus depth
(a) Raw gaze depth with outliers removed
-30
-20
-10
0
10
20
30
0 10 20 30 40 50 60 70 80 90
Ga
ze
z-c
oo
rdin
ate
(cm
)
Time (s)
Filtered gaze depth (with outliers beyond 2 SD removed):mono, static
gaze depthstimulus depth -30
-20
-10
0
10
20
30
0 10 20 30 40 50 60 70 80 90
Ga
ze
z-c
oo
rdin
ate
(cm
)
Time (s)
Filtered gaze depth (with outliers beyond 2 SD removed):stereo, rocking
gaze depthstimulus depth
(b) Filtered gaze depth
-30
-20
-10
0
10
20
30
0 10 20 30 40 50 60 70 80 90
Ga
ze
z-c
oo
rdin
ate
(cm
)
Time (s)
Filtered shifted gaze depth (with outliers beyond 2 SD removed):mono, static
gaze depthstimulus depth -30
-20
-10
0
10
20
30
0 10 20 30 40 50 60 70 80 90
Ga
ze
z-c
oo
rdin
ate
(cm
)
Time (s)
Filtered fit gaze depth (with outliers beyond 2 SD removed):stereo, rocking
gaze depthstimulus depth
(c) Filtered and either shifted or fit gaze depth
Figure 6: Visualizations of representative gaze depth in response to stimulus (rocking cube) at varying z-coordinates: (a) raw data withoutliers beyond 2 SD removed; (b) data filtered with a 6th order Butterworth filter; and (c) filtered data either shifted (monocular condition)or fit via least squares minimization (stereo condition).

3.6.2 Calibration
A popular approach to 2D eye tracking calibration depends on so-lution of a quadratic polynomial by defining (sx, sy) as the screencoordinates of calibration points, and (x, y) as the vector from somestatic reference point (e.g., corneal reflection of an IR source) to thepupil center (which varies as the eye moves) [Morimoto and Mim-ica 2005]:
sx = a0 + a1x + a2y + a3xy + a4x2 + a5y
2,
sy = b0 + b1x + b2y + b3xy + b4x2 + b5y
2.
The parameters a0–a5 and b0–b5 are the unknowns. Reformulatingin matrix notation leads to:
s1x s1y
s2x s2y
......
snx sny
=
1 x1 y1 x1y1 x2
1 y21
1 x2 y2 x2y2 x22 y2
2
......
...1 xn yn xnyn x2
n y2n
a0 b0
a1 b1
a2 b2
a3 b3
a4 b4
a5 b5
which reduces to S = XB for n calibration points used. Note thattypically a large number of gaze points are sampled at each calibra-tion point. To effect correspondence between matrix dimensions,sampled gaze points can be aggregated in the average producing acentroid so that the error between each sampled gaze point centroidand corresponding calibration point is minimized. Alternatively, ifthe number of gaze points exceeds the number of calibration points(the usual case), each calibration point is repeated in matrix S foreach sampled gaze point in the corresponding gaze point set. Weused the latter approach to fitting the observed gaze depth to targetcube depth (i.e., treating the cubes as calibration targets).
The general solution for estimation of B relies on Lagrange’smethod of least squares, or the multivariate multiple regressionmodel [Lancaster and Salkauskas 1986; Finn 1974]. The generallinear model describing i ∈ [1, n] observations of p random vari-ables sk, k ∈ [1, p], from q predictors xj , j ∈ [1, q] is specifiedby the following p separate univariate equations:
[si1 · · · sip
]=
[1 xi1 · · · xiq
]
α1 α2 · · · αp
β11 β12 · · · β1p
β21 β22 · · · β2p
......
. . ....
βq1 βq2 · · · βqp
+
[εi1 εi2 · · · εip
]
which reduces to S = XB + E, where E is the n × p matrixof sample residuals or errors, and B is the (q + 1) × p matrixof partial regression coefficients for predicting each outcome mea-sure from the p independent variables. To estimate B, the squaredsample residuals of n sampled observations are minimized. Thesum of squared residuals for one outcome measure is one diago-nal element of ET E, and their sum is the trace of ET E, which isminimized by setting the partial derivatives with respect to the ele-ments of B to zero and solving. The resulting normal equations areXT XB = XT S. The system is left-multiplied by (XT X)−1 toobtain the estimate of B = (XT X)−1XT S = G−1XT S, whereG−1 is known as the pseudo-inverse of X.
For gaze depth point fitting, we formulated S = XB by using asecond-order polynomial representation of the observed gaze depthto yield the calibrated depth coordinate sz:
[siz
]=
[1 zi z2
i
] [a0
a1
a2
]
and solved for B as indicated.
4 Results
Results from our full study with 20 subjects, conducted on theWheatstone stereoscope augmented with an eye tracker, are sum-marized in Figure 7.
We note first that the observed average 2D screen space accuracyrange for the 20 participants’ data used in the analysis of the studywas [0.6, 1.1] cm, with maximum worst calibration point observedat 2.8 cm. Data from two participants were not used due to lostdata over extended periods of time (e.g., the eye tracker did notprovide data for a period of over 10 s—because each trial durationwas 80 s, this was deemed too severe a loss of data to contributeto the analysis). Before analysis, all data were filtered using theButterworth filter and then processed to eliminate outliers.
Analysis was carried out to examine the effects of data shiftingand fitting. Shifting was accomplished by first calculating the sig-nal mean over the duration of each trial, and then subtracting thatamount from every record, effectively shifting the entire trial recordto z = 0, as seen in the left column of Figure 6(c). Fitting was ac-complished by applying the quadratic regression method, describedabove, to both shift and scale the data to each depth interval. Thiseffectively simulated depth calibration in a post-hoc fashion. Re-sults are presented in terms of RMS error between processed gazedepth and the depth of the intended (cube) targets.
0
5
10
15
20
25
Monostatic
Monorocking
Stereostatic
Stereorocking
Mean R
MS
err
or
(z-c
oord
inate
; w
ith S
E)
Display
Root mean square error vs. display(stereo × motion parallax)
(a) RMS of shifted data
0
5
10
15
20
25
Monostatic
Monorocking
Stereostatic
Stereorocking
Mean R
MS
err
or
(z-c
oord
inate
; w
ith S
E)
Display
Root mean square error vs. display(stereo × motion parallax)
(b) RMS of fit data
0
5
10
15
20
25
Monostatic
Monorocking
Stereostatic
Stereorocking
Mean R
MS
err
or
(z-c
oord
inate
; w
ith S
E)
Display
Root mean square error vs. display(stereo × motion parallax)
(c) RMS of either fit or shifted data
Figure 7: Root mean square error of gaze depth under the four viewing conditions.

For shifted data, a repeated-measures three-way ANOVA of gazedepth error revealed significance of the main effect of depth(F(4,76) = 59.50, p<0.01), no significance of display (mono vs.stereo) (F(1,19) = 3.29, p<0.09), and no significance of motionparallax (static vs. rocking) (F(1,19) = 1.21, p=0.29, n.s.). No in-teraction effects were observed (see Figure 7(a)).
For fit data, a repeated-measures three-way ANOVA of gaze deptherror revealed significance of the main effects of depth (F(4,76) =323.29, p<0.01) and display (F(1,19) = 126.00, p<0.01), but not ofmotion parallax (F(1,19) = 3.12, p = 0.09, n.s.). Interaction betweendepth and display was significant (F(4,76) = 62.52, p<0.01). Noother significant interactions were detected (see Figure 7(b)).
Because gaze depth under monoscopic viewing conditions is notexpected to vary away from z = 0, the screen depth, it may notmake sense to fit the data to targets that vary in depth. However,it does make sense to shift the data en masse to z = 0. Fig-ure 7(c) shows the comparison between shifted data captured un-der monoscopic conditions and fit data captured under stereoscopicconditions. For this data, a repeated-measures three-way ANOVAof gaze depth error revealed significance of the main effects ofdepth (F(4,76) = 127.14, p<0.01) and display (F(1,19) = 125.55,p<0.01), and marginal significance of motion parallax (F(1,19) =5.63, p<0.05). Interaction between depth and display was signif-icant (F(4,76) = 83.77, p<0.01). No other significant interactionswere detected.
Interaction between depth and display is depicted in Figure 8. Astarget depth either protrudes in front of the screen plane or recedesbehind, gaze depth error increases.
Pairwise t-tests of participants’ subjective evaluations of the stereo-scopic effect, depicted in Figure 9, show a significant difference be-tween the static monocular and rocking stereo conditions (p<0.01,with Bonferroni correction), with a marginally significant differ-ence between the static monocular and static stereo conditions(p<0.05, with Bonferroni correction). No other significant differ-ences were observed. Modal responses to the Likert questionnaireare in general agreement to computed means, with both types ofstereo garnering strong agreement (7 on the Likert scale), rockingmonoscopic receiving agreement (6 on the Likert scale), and staticmonoscopic acquiring some agreement (5 on the Likert scale).
0
1
2
3
4
5
6
7
Monostatic
Monorocking
Stereostatic
Stereorocking
Lik
ert
score
means (
with S
E)
Subjective Mean Responses
Figure 9: Mean responses to each of the four viewing conditions.
5 Discussion and Future Work
Eye vergence movements clearly respond and match the depth com-ponent of a 3D stereo target point. However, measured vergenceresponse is unexpectedly noisy. The source of the noise may bespecific to the eye tracking equipment used in the study, further in-vestigation is needed with other equipment to verify this. Our errorstudy showed that depth error is minimized near the screen depth.In future studies we plan to look at this issue more carefully usinga more fine grained set of stimuli around the screen depth.
The Wheatstone stereoscope requires that binocular eye trackingoptics be split apart so that the tracker functions as a combinationof two monocular eye trackers. However, most modern eye trackersare binocular and thus their applicability to the Wheatstone appa-ratus is at present unknown. We are anxious to verify how a morestandard tracker using an active stereo display would function.
Hardware configuration notwithstanding, we believe that the But-terworth filter is likely to be effective for gaze depth filtering onother platforms. We also feel that the data fitting model that we de-veloped for our experiments will be very useful in forming the basisfor a pre-calibration procedure to improve depth measurement ac-curacy.
Although we expected vergence to respond to stereoscopic display,we were somewhat surprised by participants’ somewhat positivesubjective evaluation of the monoscopic displays, particularly thedisplay without motion parallax. The counterbalanced order ofpresentation of the stimuli suggests that subjective responses maybe skewed depending on which display is seen first: the stereo-scopic effect is quite pronounced when experienced after view-ing the monoscopic display. Conversely, something of an after-effect may be present when the stereoscopic display is experiencedfirst: the monoscopic display is strangely still considered somewhatstereoscopic. This result may not be too surprising since it is knownthat linear perspective provides a strong depth cue, and this is highlyapparent in the arrangement of the cubes in our experimental setup(see Figure 3).
6 Conclusion
We have reported empirical measurements of gaze depth, com-puted from eye vergence, in relation to a target at varying depthdistances shown either monoscopically or stereoscopically. As ex-pected, gaze depth clearly responds and tends towards the targetdepth under stereoscopic conditions. We have also presented com-bined filtering and fitting techniques to simultaneously counteractthe observed high level of noise in the gaze depth signal, as well asthe viewer’s depth under- or over-estimation of the target. The com-bined use of the Butterworth filter along with least squares fittingsuggests an effective means of gaze depth pre-calibration.
Acknowledgments
This material is based upon work supported by the National ScienceFoundation under Grant No. 0915085. Any opinions, findings, andconclusions expressed in this material are those of the author(s) anddo not necessarily reflect the views of the NSF. We are grateful toNVidia for their generous equipment donations.
References
AUGUSTIN, J. S. 2009. Off-the-Shelf Gaze Interaction. PhD thesis,The IT University of Copenhagen, Copenhagen, Denmark. ITUDS: D-2010-63.

0
10
20
30
40
50
60
-18 -6 6 18 30
Me
an
RM
S e
rro
r (z
-co
ord
ina
te;
with
SE
)
Depth (z-coordinate)
Root mean square error vs. depth
Mono, staticMono, rockingStereo, static
Stereo, rocking
(a) RMS of filtered, shifted gaze depth
0
10
20
30
40
50
60
-18 -6 6 18 30
Me
an
RM
S e
rro
r (z
-co
ord
ina
te;
with
SE
)
Depth (z-coordinate)
Root mean square error vs. depth
Mono, staticMono, rockingStereo, static
Stereo, rocking
(b) RMS of filtered, fit gaze depth
Figure 8: Root mean square error of gaze depth over the five viewing depth intervals.
BAIR, A., HOUSE, D., AND WARE, C. 2006. Texturing of Lay-ered Surfaces for Optimal Viewing. IEEE Transactions on Visu-alization and Computer Graphics (Proceedings of IEEE Visual-ization) 12, 5, 1125–1132.
BUTTNER-ENNEVER, J. A., Ed. 1988. Neuroanatomy of the Ocu-lomotor System, vol. II of Reviews of Oculomotor Research. El-sevier Press, Amsterdam, Holland.
CAMPBELL, F., AND GREEN, D. 1965. Monocular versus binoc-ular visual acuity. Nature 209, 191–192.
DAUGHERTY, B. C., DUCHOWSKI, A. T., HOUSE, D. H., ANDRAMASAMY, C. 2010. Measuring Vergence Over StereoscopicVideo with a Remote Eye Tracker. In Eye Tracking Research& Applications (ETRA) (Late Breaking Results), ACM, Austin,TX.
ESSIG, K., POMPLUN, M., AND RITTER, H. 2004. Application ofa Novel Neural Approach to 3D Gaze Tracking: Vergence Eye-Movements in Autostereograms. In Proceedings of the Twenty-Sixth Annual Meeting of the Cognitive Science Society, K. For-bus, D. Gentner, and T. Regier, Eds., Cognitive Science Society,357–362.
FINCHAM, E. F., AND WALTON, J. 1957. The reciprocal actionsof accommodation and vergence. J. Physiol. Lond. 137, 488508.
FINN, J. D. 1974. A General Model for Multivariate Analysis.Holt, Rinehart and Winston, Inc., New York, NY.
HOLLIMAN, N., FRONER, B., AND LIVERSEDGE, S. 2007. AnApplication Driven Comparison of Depth Perception on Desktop3D Displays. In Stereoscopic Displays and Applications XVIII,SPIE.
HOWARD, I. P., AND ROGERS, B. J. 2002. Seeing in Depth,vol. II: Depth Perception. I Porteous, University of TorontoPress, Thornhill, ON, Canada.
HUTCHINSON, T. E., 1989. Eye Movement Detector. US PatentNo. 4,836,670, 6 June.
JULESZ, B. 1964. Binocular Depth Perception without FamiliarityCues. Science 145, 3630 (Jul), 356–362.
KWON, Y.-M., AND SHUL, J. K. 2006. Experimental Researcheson Gaze-Based 3D Interaction to Stereo Image Display. In Edu-tainment, Z. Pan et al., Ed. Springer-Verlag, Berlin, 1112–1120.LNCS 3942.
LANCASTER, P., AND SALKAUSKAS, K. 1986. Curve and SurfaceFitting: An Introduction. Academic Press, San Diego, CA.
LC TECHNOLGIES, INC., 2010. The Eyegaze Analysis System,January.
LIPTON, L. 1982. Foundations of the Stereoscopic Cinema:A Study in Depth. Van Nostrand Reinhold Company Inc.,New York, NY. ISBN O-442-24724-9 , URL: http://www.stereoscopic.org.
MORIMOTO, C. H., AND MIMICA, M. R. M. 2005. Eye GazeTracking Techniques for Interactive Applications. Computer Vi-sion and Image Understanding 98 (April), 4–24.
OPPENHEIM, A., AND SCHAFER, R. 1989. Discrete-Time SignalProcessing. Englewood Cliffs, NJ.
SHAKHNOVICH, A. R. 1977. The Brain and Regulation of EyeMovement. Plenum Press, New York, NY.
WANN, J. P., RUSHTON, S., AND MON-WILLIAMS. 1995. Natu-ral Problems for Stereoscopic Depth Perception in Virtual Envi-ronments. Vision Research 35, 19, 2731–2746.
WARE, C. 2004. Information Visualization: Perception for Design.Morgan Kaufmann.
WARE, C. 2008. Visual Thinking for Design. Morgan Kaufmann.
WHEATSTONE, C. 1838. Contributions to the physiology of vi-sion. part the first. on some remarkable and hitherto unobservedphenomena of binocular vision. Philosophical Transactions ofthe Royal Society 128, 371–394.


