J. Mark Powell US Dairy Forage Research Center
Madison, Wisconsin
Wisconsin Crop Management Conference January 14, 2015
Measures of nitrogen use efficiency and environmental impacts of dairy production systems
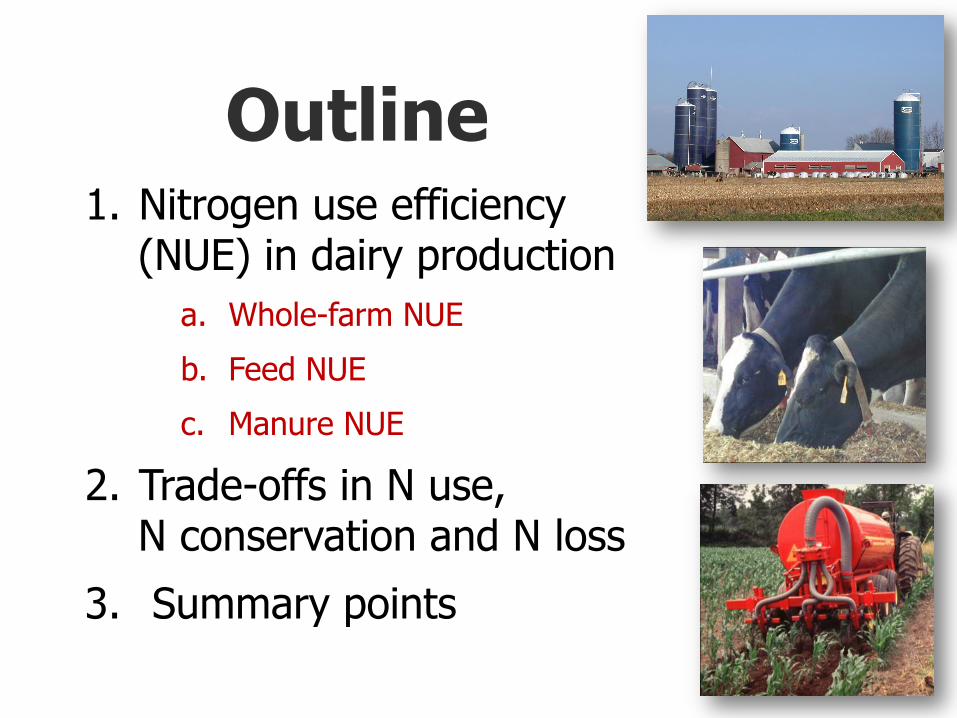
Outline 1. Nitrogen use efficiency (NUE) in dairy production
a. Whole-farm NUE
b. Feed NUE
c. Manure NUE
2. Trade-offs in N use, N conservation and N loss
3. Summary points
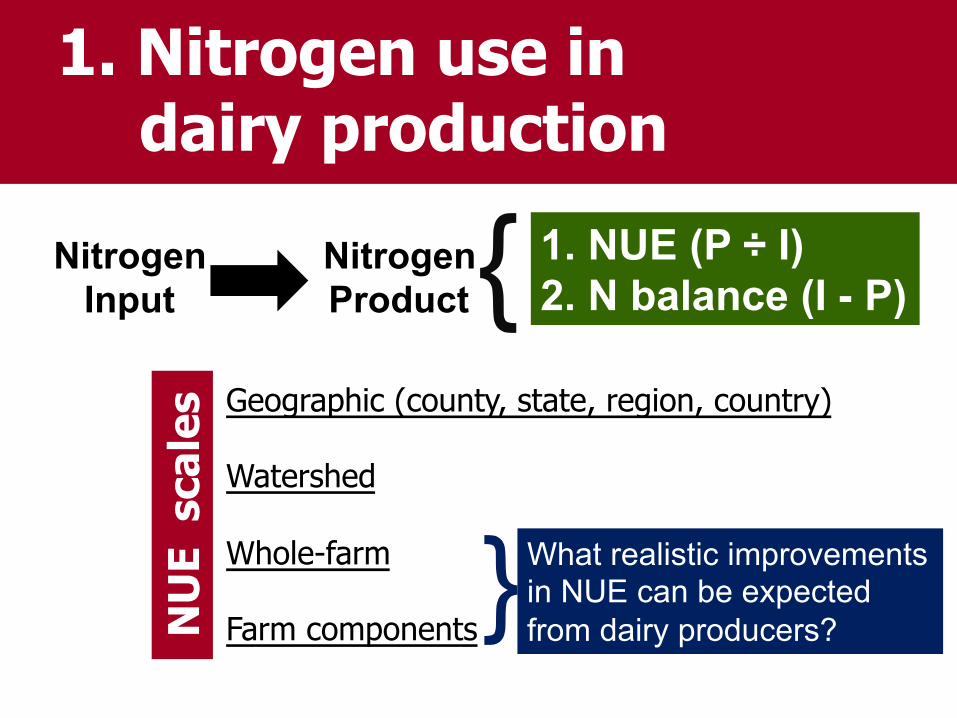
Nitrogen Input
Nitrogen Product
1. Nitrogen use in dairy production
Geographic (county, state, region, country) Watershed Whole-farm Farm components
NU
E s
cale
s
1. NUE (P ÷ I) 2. N balance (I - P) {
What realistic improvements in NUE can be expected from dairy producers?
{
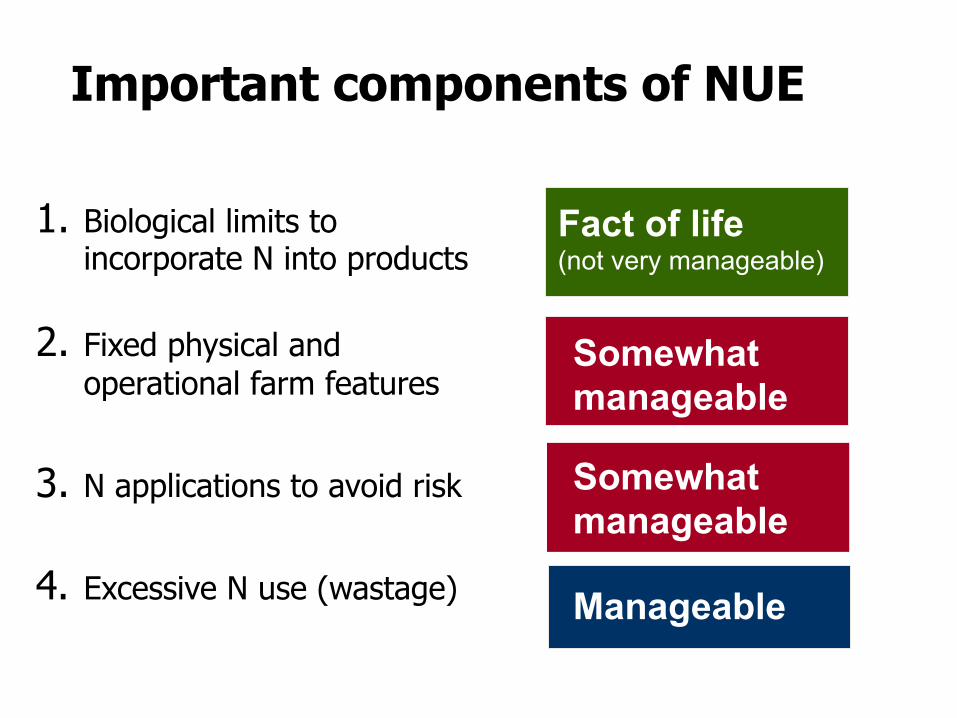
1. Biological limits to incorporate N into products
2. Fixed physical and operational farm features
3. N applications to avoid risk
4. Excessive N use (wastage)
Fact of life (not very manageable)
Somewhat manageable
Manageable
Important components of NUE
Somewhat manageable
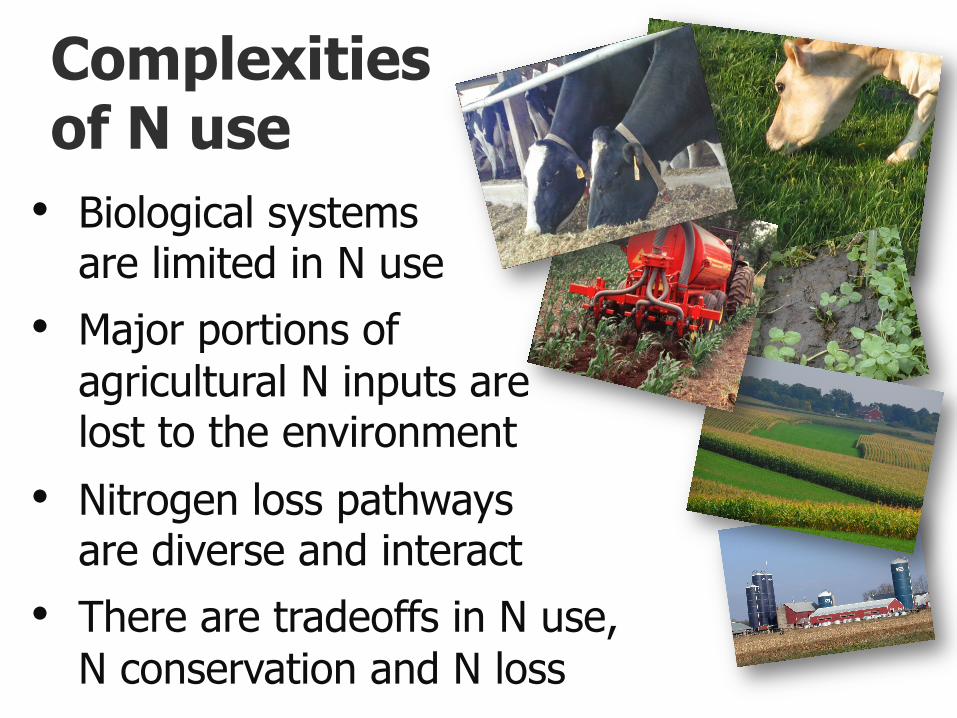
Complexities of N use
• Biological systems are limited in N use
• Major portions of agricultural N inputs are lost to the environment
• Nitrogen loss pathways are diverse and interact
• There are tradeoffs in N use, N conservation and N loss
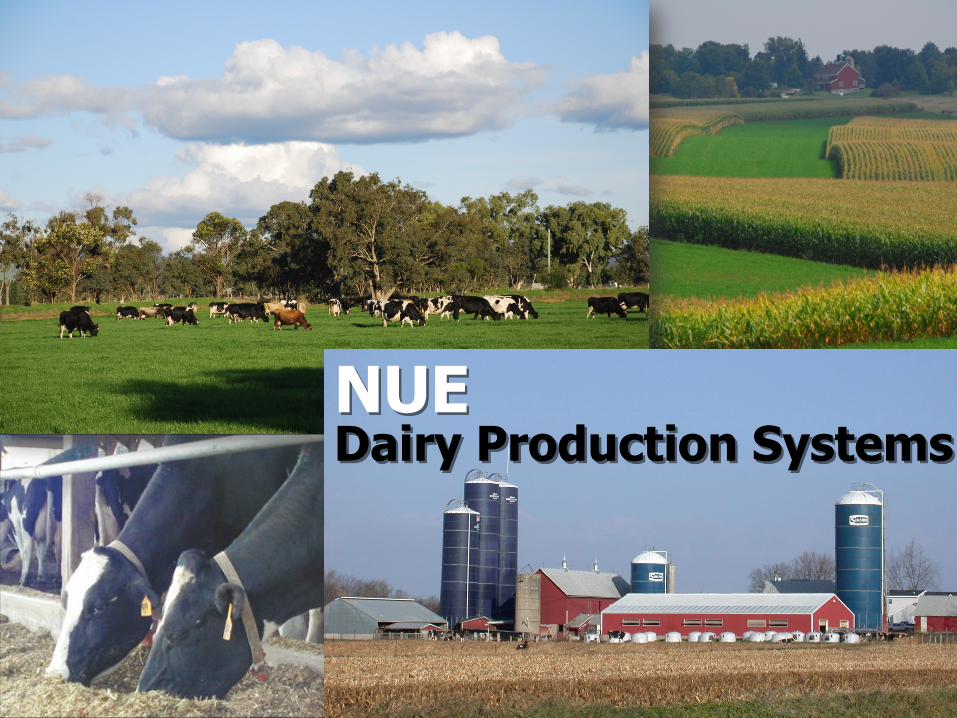
NUE Dairy Production Systems

Whole-farm NUE Land carrying capacity
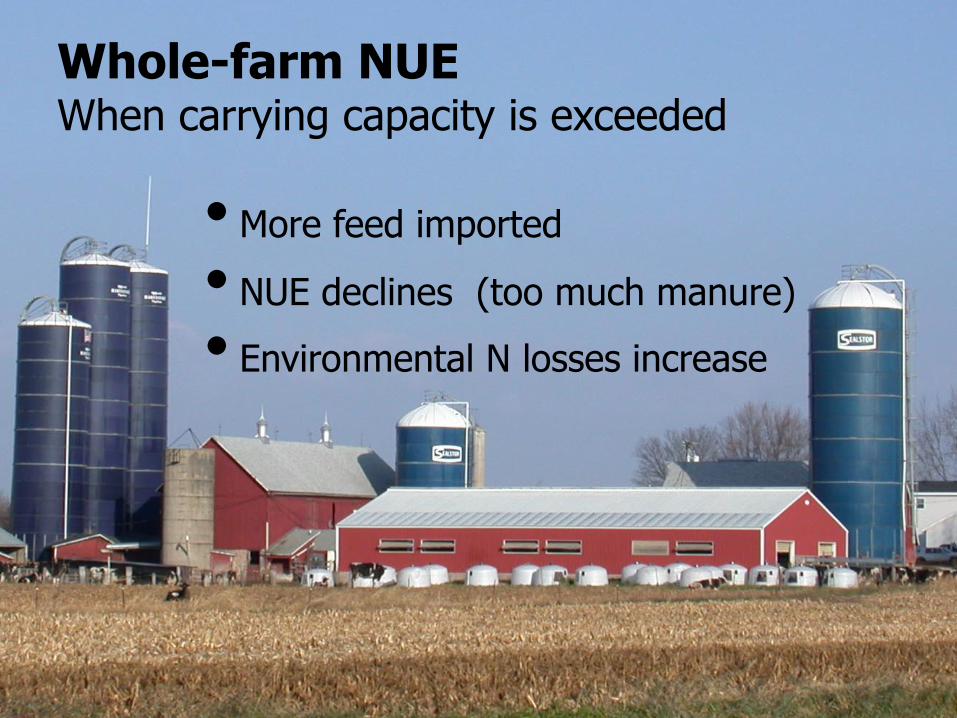
Whole-farm NUE When carrying capacity is exceeded
• More feed imported
• NUE declines (too much manure)
• Environmental N losses increase
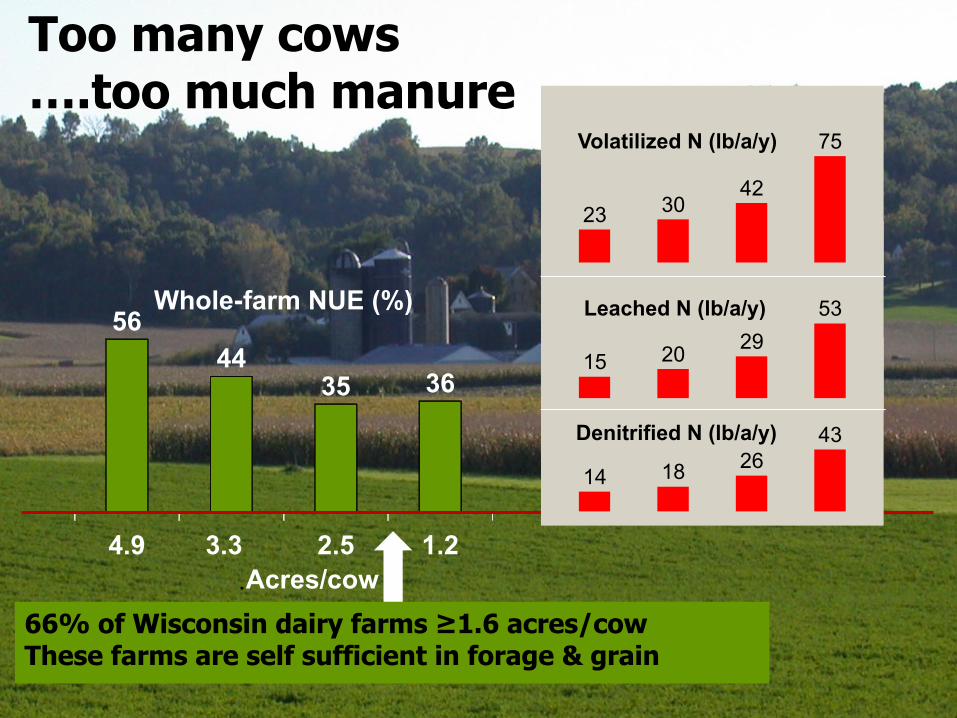
Too many cows ….too much manure
66% of Wisconsin dairy farms ≥1.6 acres/cow These farms are self sufficient in forage & grain
56 44
35 36
4.9 3.3 2.5 1.2
Whole - farm NUE (%)
. Acres/cow
14 18 26 43 Denitrified N (lb/a/y)
15 20 29 53 Leached N (lb/a/y)
23 30 42
75 Volatilized N (lb/a/y)

Ration N transformed into milk or manure
Forage 45 - 65%
Grain 20-30%
Protein Suppl.
20-30%
Minerals & Vitamins
1-2%
Manure 65-80%
Milk 20-35%
Typical lactating cow ration (dry matter basis)
Carry capacity, feed production, N use and N loss
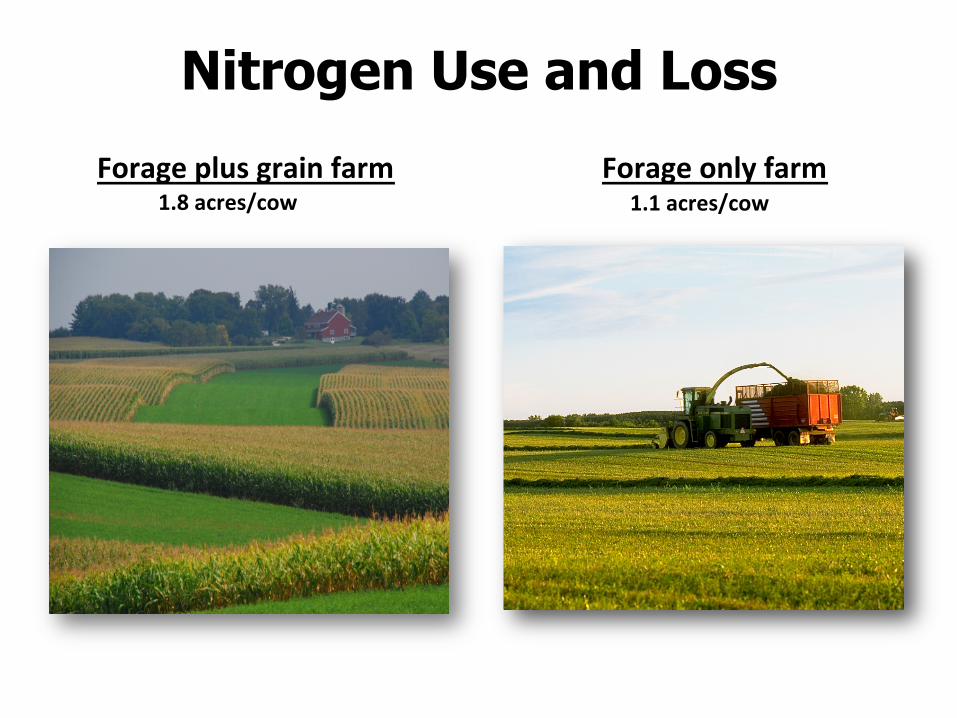
Nitrogen Use and Loss
35% 41%
Forage plus grain farm 1.8 acres/cow
Forage only farm 1.1 acres/cow
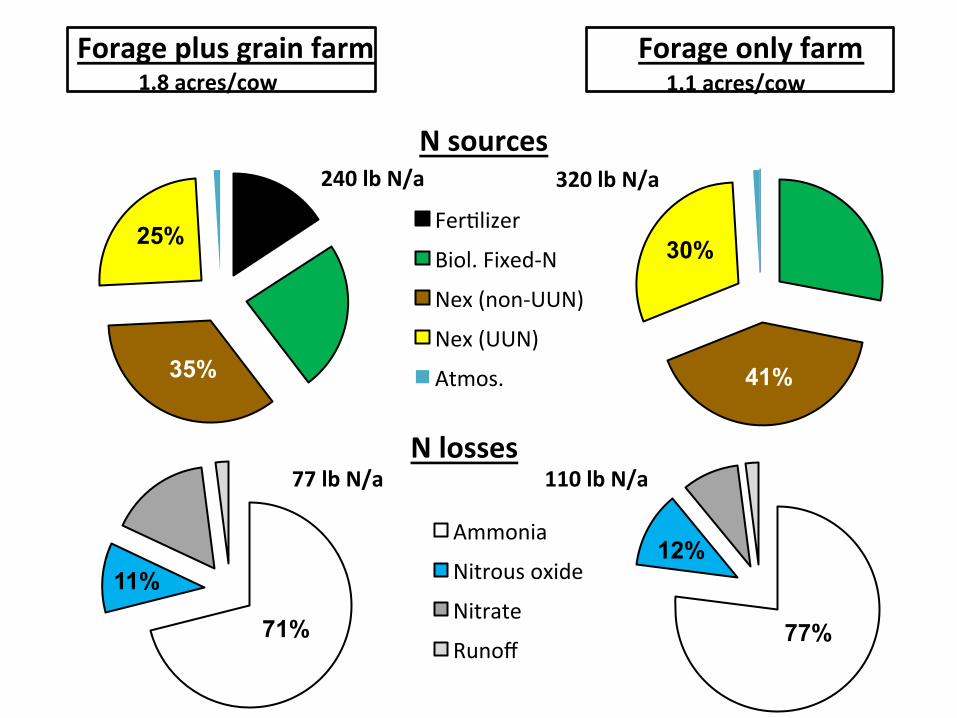
Ammonia
Nitrous oxide
Nitrate
Runoff 77%
12% 11%
71%
N losses 77 lb N/a 110 lb N/a
Forage plus grain farm Forage only farm 1.8 acres/cow 1.1 acres/cow
N sources
Fer3lizer
Biol. Fixed-‐N
Nex (non-‐UUN)
Nex (UUN)
Atmos.
240 lb N/a 320 lb N/a
25% 30%
35% 41%
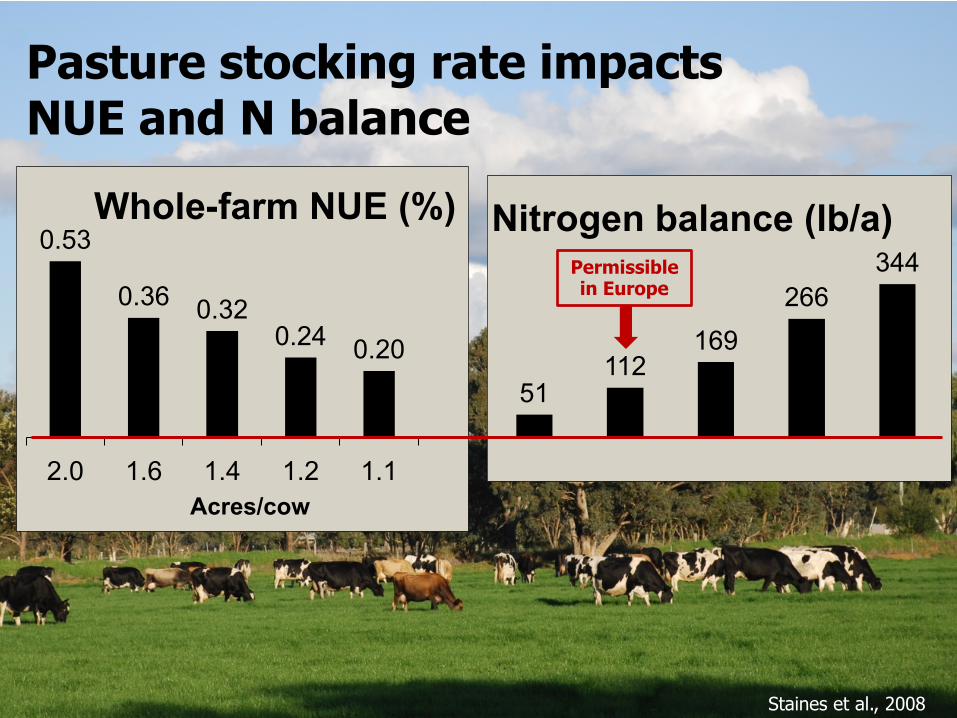
51 112
169 266
344 Nitrogen balance (lb/a)
Acres/cow
0.53
0.36 0.32 0.24 0.20
2.0 1.6 1.4 1.2 1.1
Whole-farm NUE (%)
Staines et al., 2008
Pasture stocking rate impacts NUE and N balance
Permissible in Europe
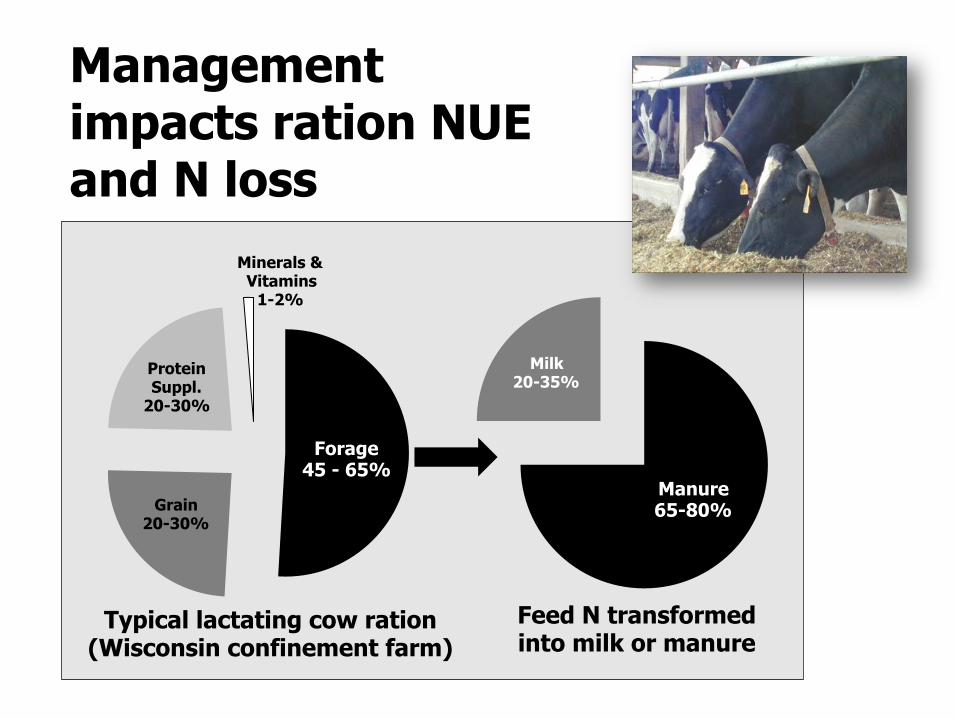
Feed N transformed into milk or manure
Forage 45 - 65%
Grain 20-30%
Protein Suppl.
20-30%
Minerals & Vitamins
1-2%
Manure 65-80%
Milk 20-35%
Typical lactating cow ration (Wisconsin confinement farm)
Management impacts ration NUE and N loss

Management impacts ration NUE
Manure 65-80%
Milk 20-35%
NUE of the ration
Milk 3x/d
Use Posilac
Feed TMR
Balance rations
No Yes Practice (54 Wisconsin dairy farms) increase due
to practice
28%
25%
22%
33%
17 23 29 35 I I I I
11 I
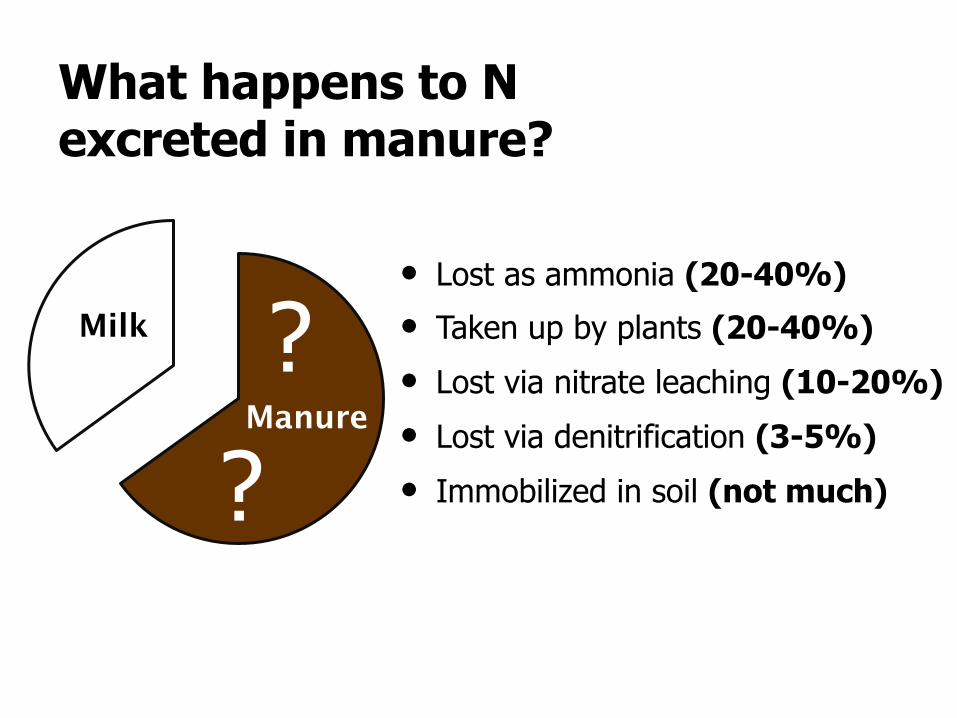
• Lost as ammonia (20-40%)
• Taken up by plants (20-40%)
• Lost via nitrate leaching (10-20%)
• Lost via denitrification (3-5%)
• Immobilized in soil (not much)
What happens to N excreted in manure?
? Manure
?
Milk

Excreted N Crops/Pasture N
Manure collection Storage method
Application method Other N applied
Manure NUE
Manure NUE 20-40% (of excreted N)

Collected
Manure collection (n=54 Wisconsin dairy farms)
66%
Tie-stall barns Free-stall barns
89% Not Collected
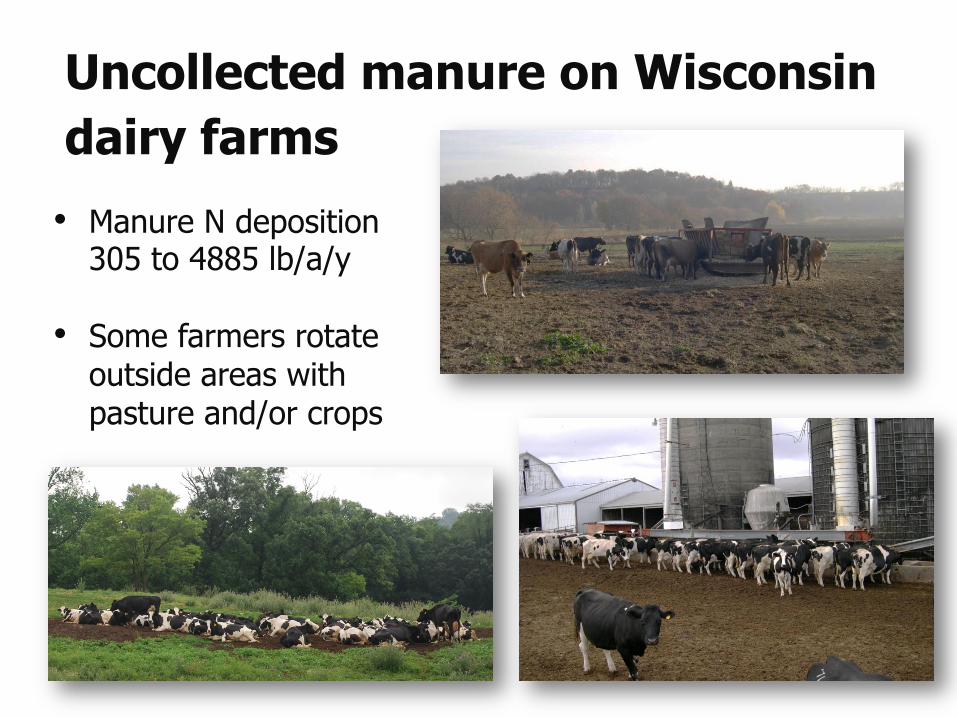
• Manure N deposition 305 to 4885 lb/a/y
• Some farmers rotate outside areas with pasture and/or crops
Uncollected manure on Wisconsin dairy farms
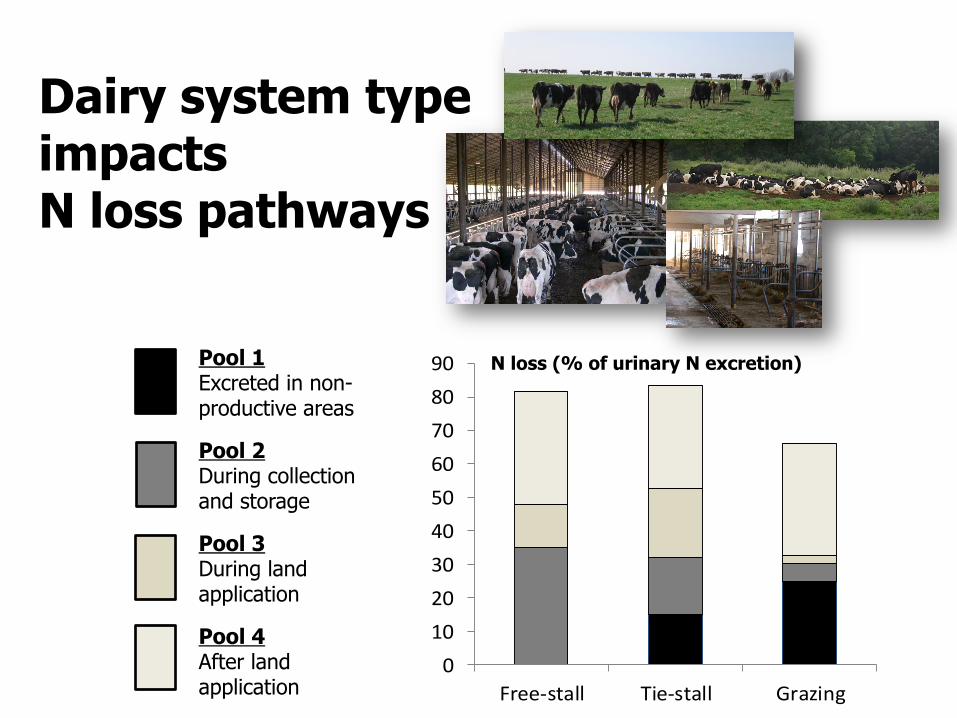
Dairy system type impacts N loss pathways
0102030405060708090
Free-‐stall Tie-‐stall Grazing
N loss (% of urinary N excretion) Pool 1 Excreted in non- productive areas
Pool 2 During collection and storage
Pool 3 During land application
Pool 4 After land application
A
NU
E (%
ExN
in c
rops
)
0-
10-
20-
30-
40-
50-
2 d- 4 d- 2 d- 4 d-
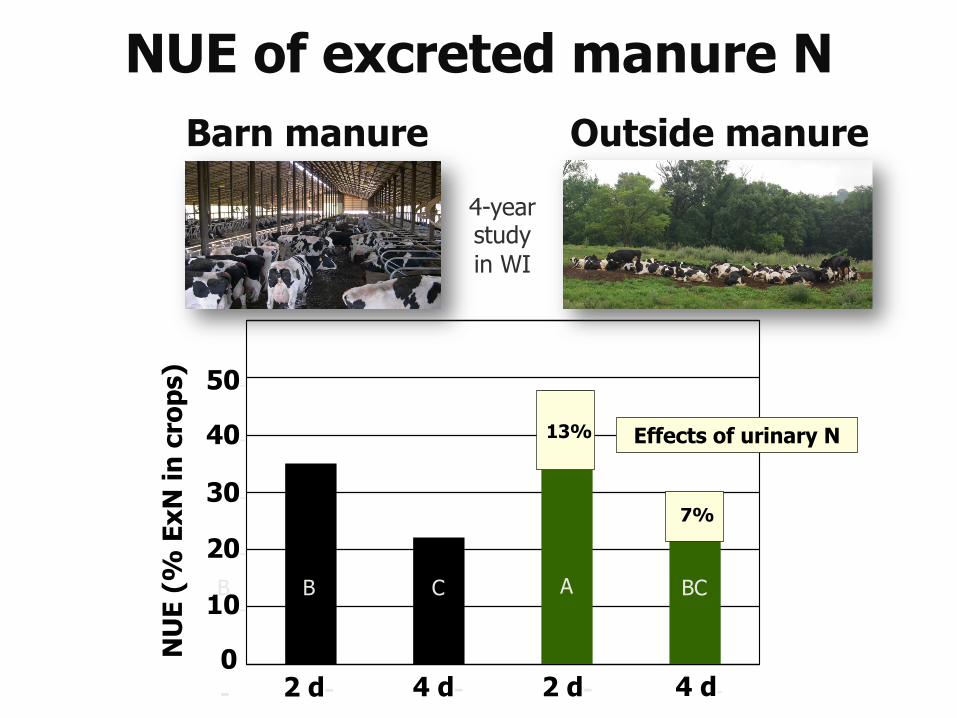
Barn manure Outside manure
Effects of urinary N 13%
7%
4-year study in WI
B B C BC
NUE of excreted manure N
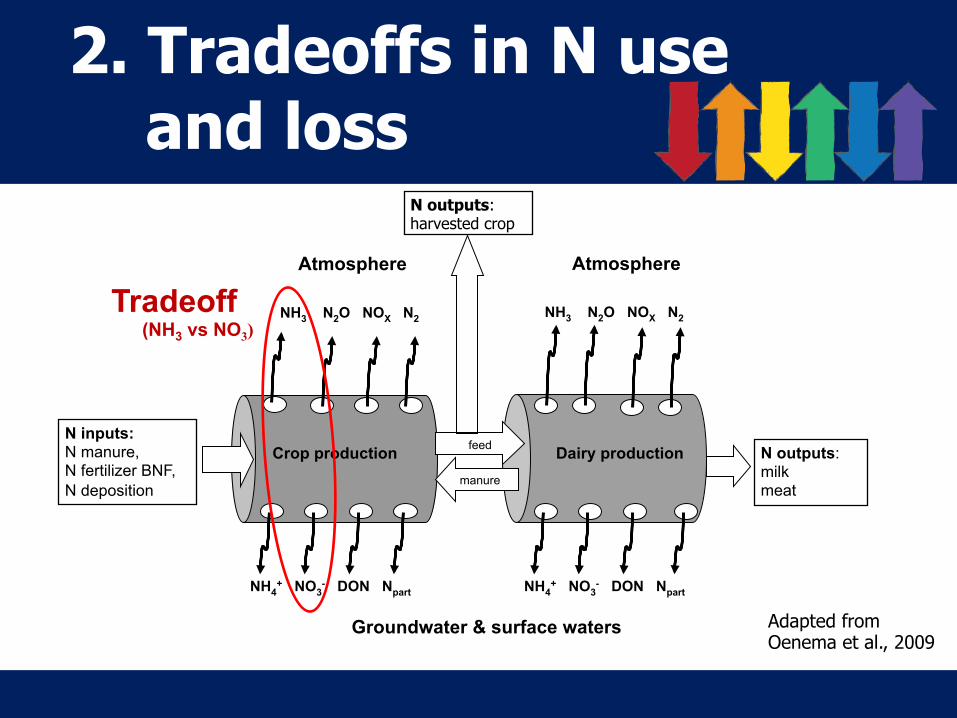
2. Tradeoffs in N use and loss
Crop production N outputs: milk meat
Groundwater & surface waters
N inputs: N manure, N fertilizer BNF, N deposition
Dairy production
N outputs: harvested crop
NH4+ NO3
- DON Npart
NH3 N2O NOX N2
NH4+ NO3
- DON Npart
manure
NH3 N2O NOX N2
feed
Atmosphere
Adapted from Oenema et al., 2009
Atmosphere
Tradeoff (NH3 vs NO3)
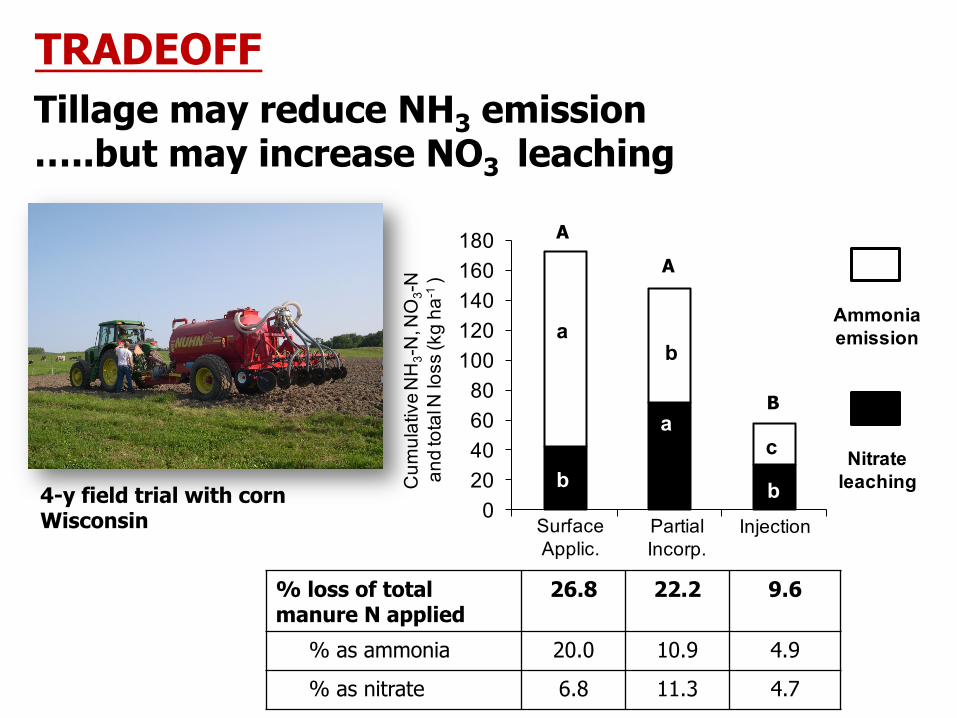
% loss of total manure N applied
26.8 22.2 9.6
% as ammonia 20.0 10.9 4.9
% as nitrate 6.8 11.3 4.7
Tillage may reduce NH3 emission …..but may increase NO3 leaching
020406080
100120140160180
Ammoniaemission
Nitrateleaching
a
c
b
a
b
a
SurfaceApplic.
PartialIncorp.
Injection
b
a
bCum
ulat
ive
NH
3-N
, NO
3-N
an
d to
tal N
loss
(kg
ha-1
)
A
A
B
TRADEOFF
4-y field trial with corn Wisconsin
Improvements in NUE on dairy farms through management of livestock and their excreta • Maintain good stocking rates
• Feed most balanced rations possible
• Collect manure and conserve urine
• Recognize and incorporate N use and N loss tradeoffs into N management planning
Summary
Recognize factors that impact NUE • Biological (N incorporation into products)
• Physical (climate, soils)
• Farm ‘fixed’ operational features (e.g., barns, manure storage)
• Excessive use (risk avoidance, wastage)
Impediments to enhanced NUE on dairy farms
• Establish N use baselines (using NUE, N balance) to monitor progress towards desired change.
• What NUE targets are actually achievable?
• Manage N losses?
What realistic improvements in NUE can be expected from producers?