MEASURES FOR REDUCTION MEASURES FOR REDUCTION OF OF
CARBON FOOT PRINT CARBON FOOT PRINT & &
GREEN HOUSE GAS (GHG) GREEN HOUSE GAS (GHG) EMISSIONS EMISSIONS
FROM SHIPSFROM SHIPSPRESENTED BY: Bh. Nagesh.

WHAT IS CARBON FOOT WHAT IS CARBON FOOT PRINTPRINT
It is “the total set of GHG (Green House Gas) emissions caused directly and indirectly by an individual, organization, event or product”
To determine C-FP from SHIPSTo determine C-FP from SHIPS
04/18/2304/18/23 22
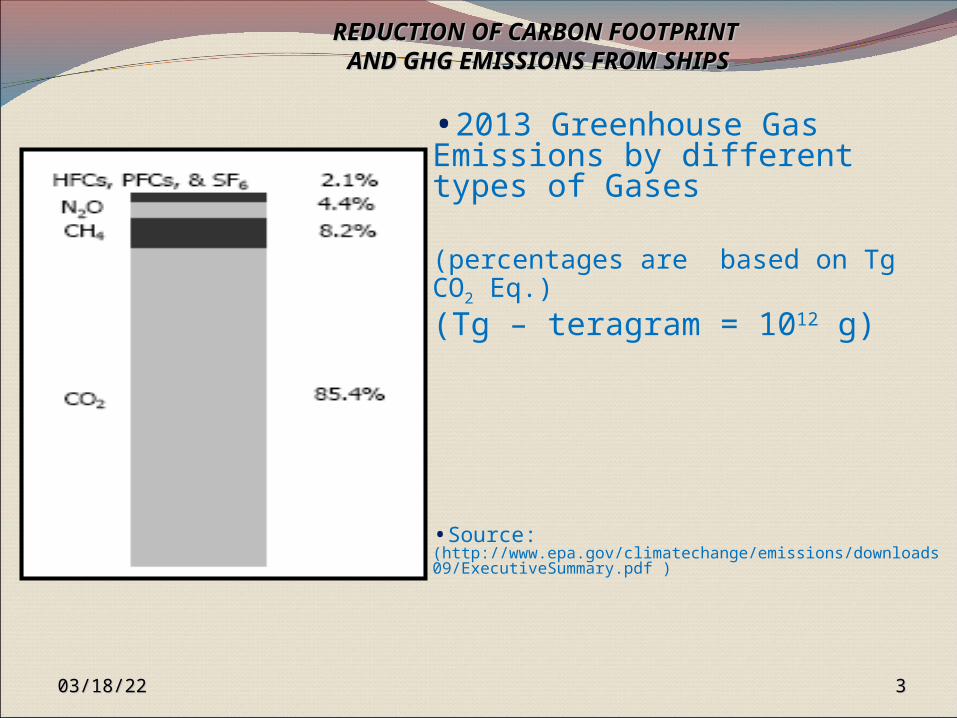
•2013 Greenhouse Gas Emissions by different types of Gases
(percentages are based on Tg CO2 Eq.) (Tg – teragram = 1012 g)
•Source: (http://www.epa.gov/climatechange/emissions/downloads09/ExecutiveSummary.pdf )
04/18/2304/18/23 33
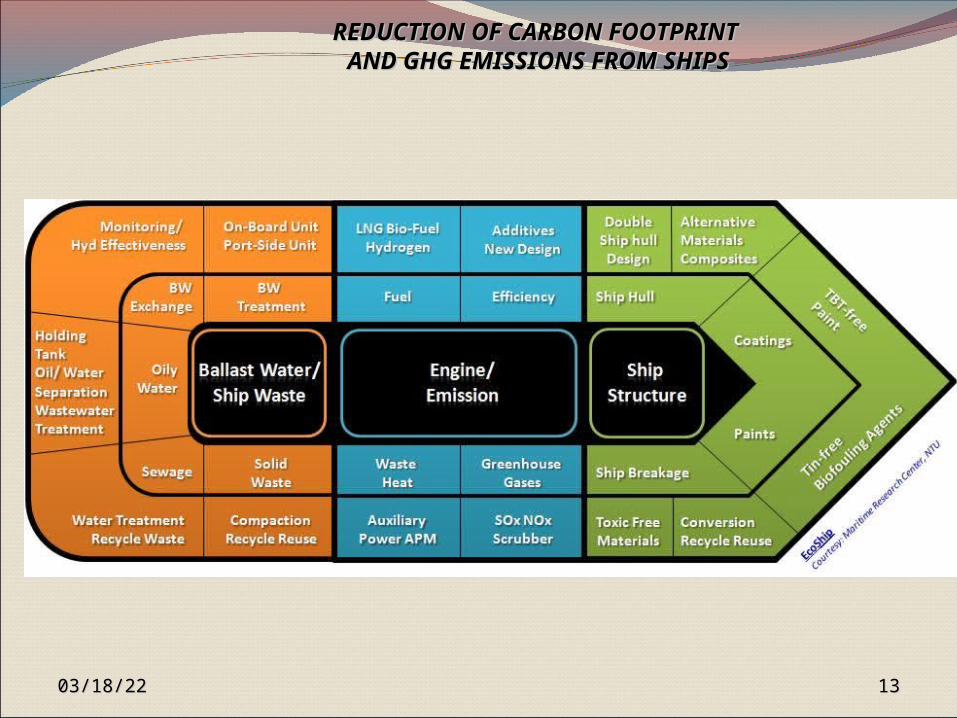
REDUCTION OF CARBON FOOTPRINT REDUCTION OF CARBON FOOTPRINT AND GHG EMISSIONS FROM SHIPSAND GHG EMISSIONS FROM SHIPS
04/18/2304/18/23 44
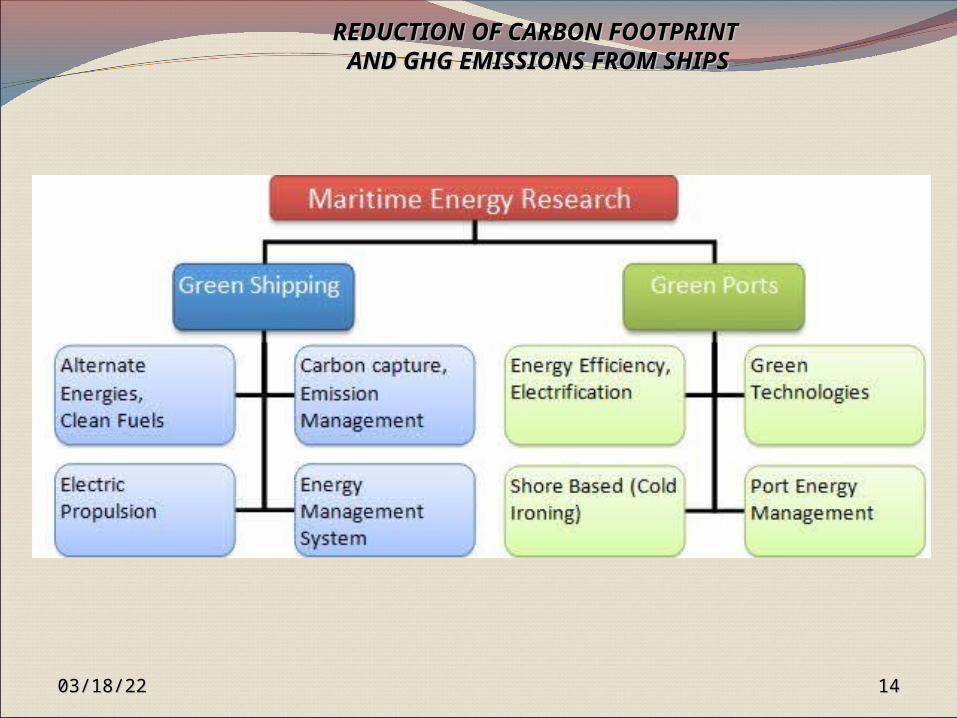
REDUCTION OF CARBON FOOTPRINT REDUCTION OF CARBON FOOTPRINT AND GHG EMISSIONS FROM SHIPSAND GHG EMISSIONS FROM SHIPS
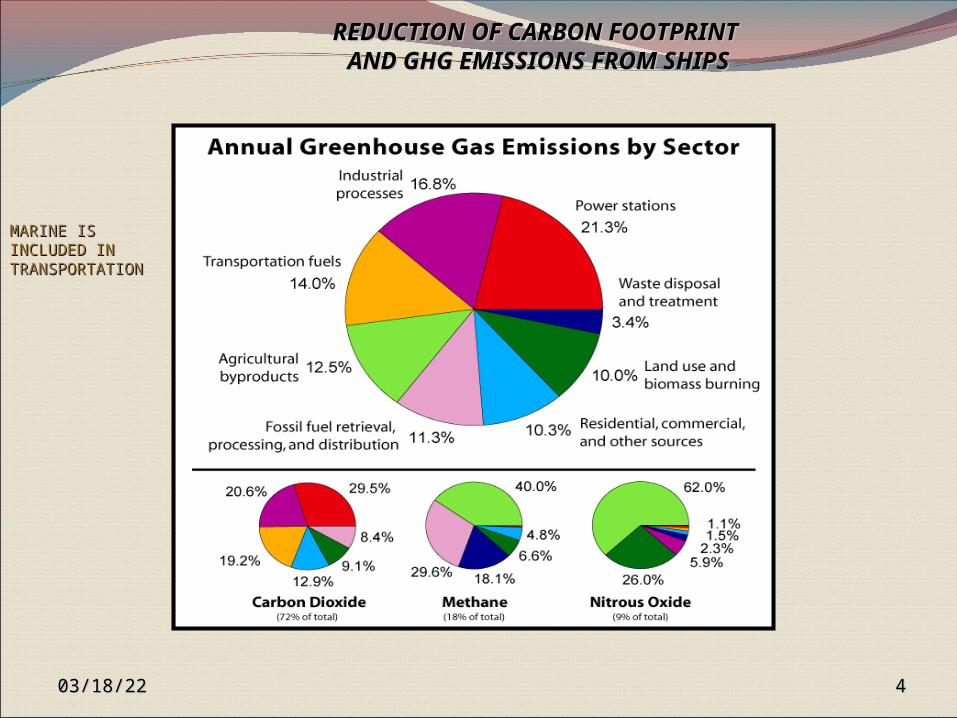
MARINE IS MARINE IS INCLUDED IN INCLUDED IN TRANSPORTATIONTRANSPORTATION

04/18/2304/18/23 55
REDUCTION OF CARBON FOOTPRINT REDUCTION OF CARBON FOOTPRINT AND GHG EMISSIONS FROM SHIPSAND GHG EMISSIONS FROM SHIPS
0.0 10.0 20.0 30.0 40.0 50.0 60.0 70.0
km
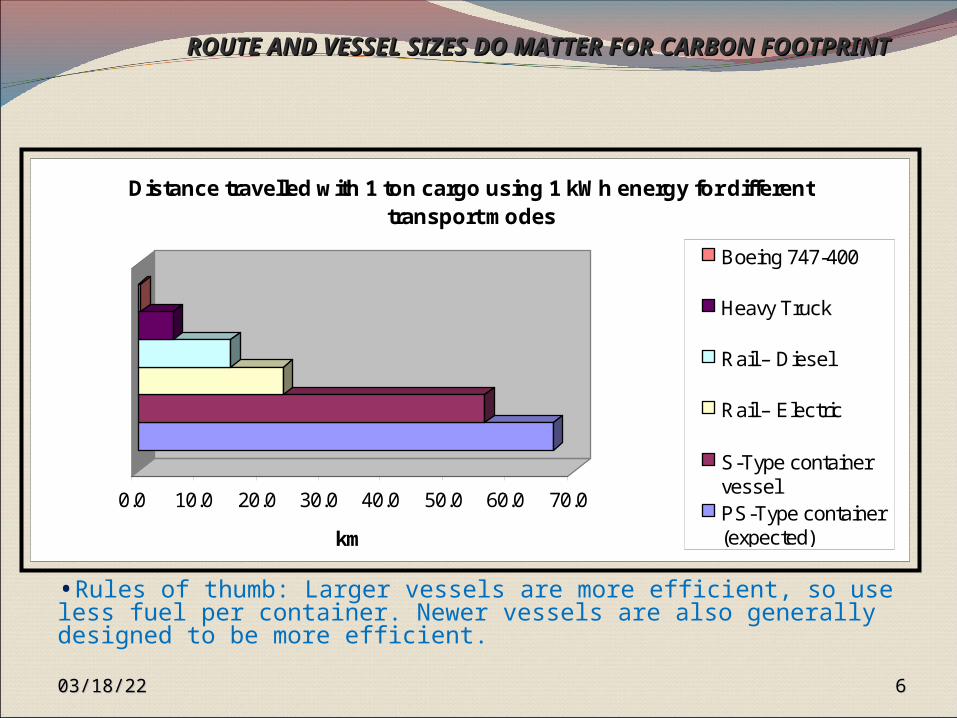
Distance travelled with 1 ton cargo using 1 kWh energy for different transport modes
Boeing 747-400
Heavy Truck
Rail – Diesel
Rail – Electric
S-Type containervesselPS-Type container(expected)
•Rules of thumb: Larger vessels are more efficient, so use less fuel per container. Newer vessels are also generally designed to be more efficient.
04/18/2304/18/23 66
ROUTE AND VESSEL SIZES DO MATTER FOR CARBON ROUTE AND VESSEL SIZES DO MATTER FOR CARBON FOOTPRINTFOOTPRINT

•84
•176
•205
•472
•5,582
•0 •1,000 •2,000 •3,000 •4,000 •5,000 •6,000
•Ocean(Avg. ML-owned vessels)
•Rail electric(Global average)
•Rail diesel
•Truck(Global Average)
•Air > 1,500 km(Boeing 747-400)
•Grams of CO2 emitted per (TEU.km)
Ocean shipping has the lowest environmental impact for long distance transportation. (Air to ship it is 67 times less).
04/18/2304/18/23 77
CO2 Emissions CO2 Emissions by Mode of Transportationby Mode of Transportation
COCO22 emitted is 67 times more for air compared to Ocean emitted is 67 times more for air compared to Ocean VesselsVessels

How do we remove this CO2?
Carbon sink: is a reservoir of carbon that accumulates and stores carbon for an indefinite period. The main sinks are:
Absorption of carbon dioxide by the oceans
Photosynthesis by plants and algae to turn the carbon into plant matter
Injection of CO2 emissions
deep into geological subsurface
04/18/2304/18/23 88
Breakdown
REDUCTION OF CARBON FOOTPRINT REDUCTION OF CARBON FOOTPRINT AND GHG EMISSIONS FROM SHIPSAND GHG EMISSIONS FROM SHIPS
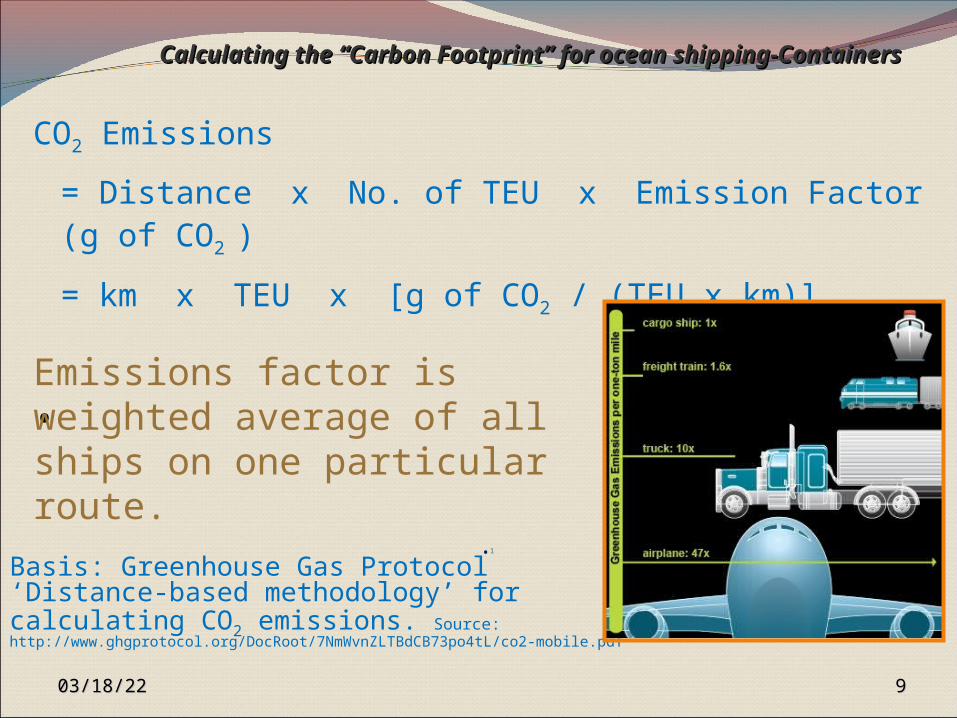
CO2 Emissions
= Distance x No. of TEU x Emission Factor (g of CO2
)
= km x TEU x [g of CO2 / (TEU x km)]
•
•1
Basis: Greenhouse Gas Protocol ‘Distance-based methodology’ for calculating CO2 emissions. Source: http://www.ghgprotocol.org/DocRoot/7NmWvnZLTBdCB73po4tL/co2-mobile.pdf
04/18/2304/18/23 99
Calculating the “Carbon Footprint” for ocean shipping-Calculating the “Carbon Footprint” for ocean shipping-ContainersContainers
Emissions factor is weighted average of all ships on one particular route.
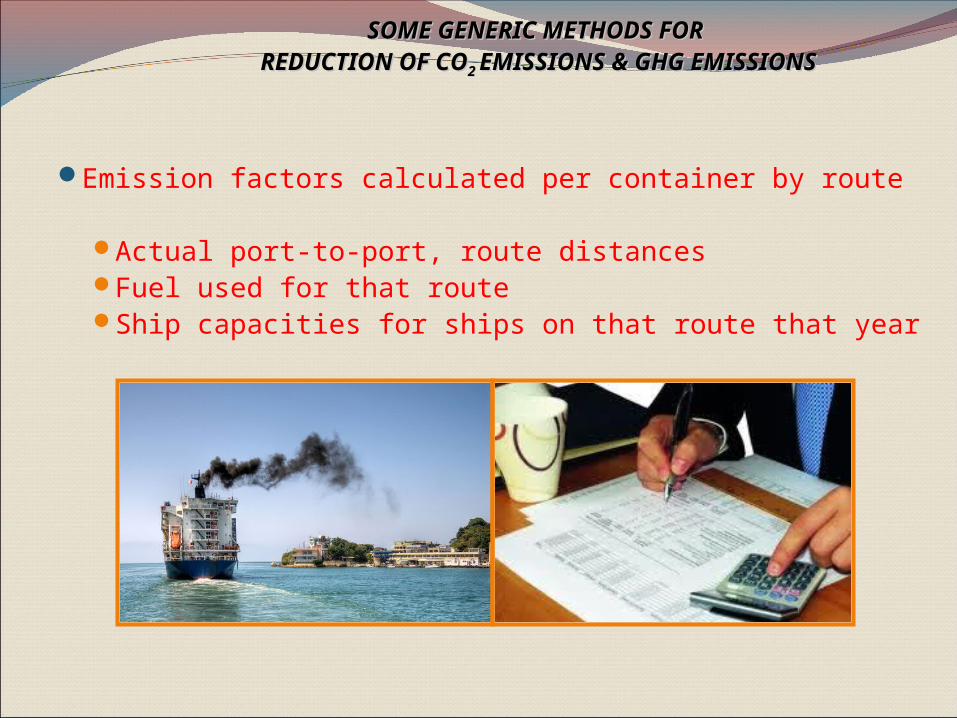
Emission factors calculated per container by route
Actual port-to-port, route distancesFuel used for that routeShip capacities for ships on that route that year
SOME GENERIC METHODS FOR SOME GENERIC METHODS FOR REDUCTION OF COREDUCTION OF CO2 2 EMISSIONS & GHG EMISSIONSEMISSIONS & GHG EMISSIONS
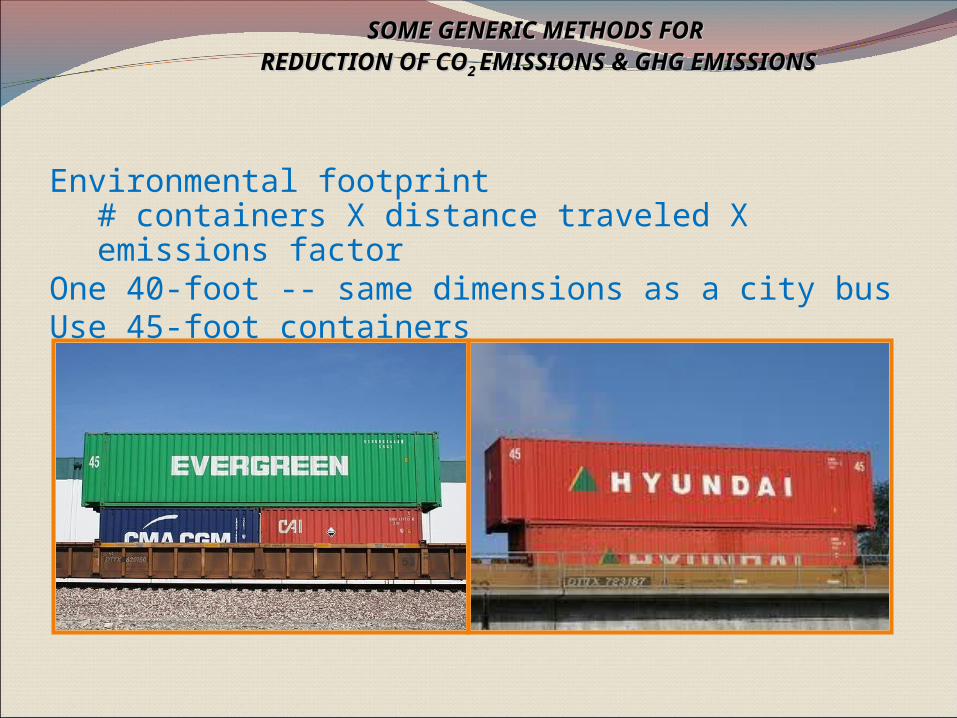
Environmental footprint # containers X distance traveled X emissions factor
One 40-foot -- same dimensions as a city busUse 45-foot containers
SOME GENERIC METHODS FOR SOME GENERIC METHODS FOR REDUCTION OF COREDUCTION OF CO2 2 EMISSIONS & GHG EMISSIONSEMISSIONS & GHG EMISSIONS
CO2 emissions can be reduced through
Understanding the sources of emissions
Choosing lower-impact modes and carriers
- Marine carriers with more environmentally responsible vessels
- Rail
- Inland waterway transportation (barge)
- Smart Way trucks
Increased supply chain efficiency
WHAT WE HAVE DISCUSSED SO FAR ISWHAT WE HAVE DISCUSSED SO FAR ISMEASURES TO REDUCE COMEASURES TO REDUCE CO2 2 EMISSIONS & GHG EMISSIONS & GHG
EMISSIONSEMISSIONS
04/18/2304/18/23 1212
04/18/2304/18/23 1313
REDUCTION OF CARBON FOOTPRINT REDUCTION OF CARBON FOOTPRINT AND GHG EMISSIONS FROM SHIPSAND GHG EMISSIONS FROM SHIPS
04/18/2304/18/23 1414
REDUCTION OF CARBON FOOTPRINT REDUCTION OF CARBON FOOTPRINT AND GHG EMISSIONS FROM SHIPSAND GHG EMISSIONS FROM SHIPS
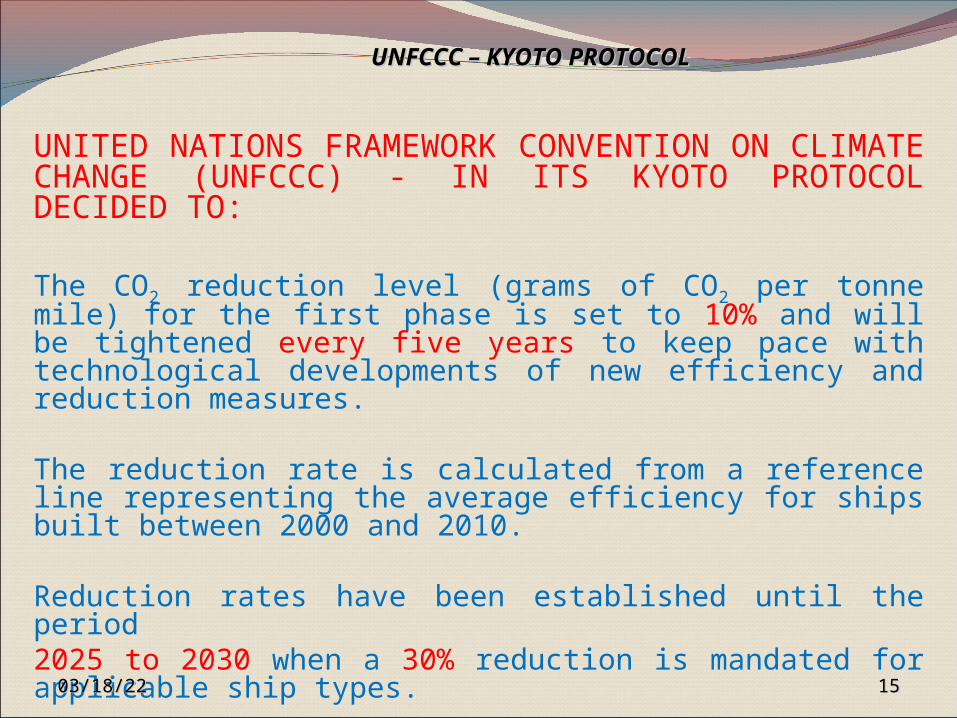
UNITED NATIONS FRAMEWORK CONVENTION ON CLIMATE CHANGE (UNFCCC) - IN ITS KYOTO PROTOCOL DECIDED TO:
The CO2 reduction level (grams of CO2 per tonne mile) for the first phase is set to 10% and will be tightened every five years to keep pace with technological developments of new efficiency and reduction measures.
The reduction rate is calculated from a reference line representing the average efficiency for ships built between 2000 and 2010.
Reduction rates have been established until the period 2025 to 2030 when a 30% reduction is mandated for applicable ship types.
UNFCCC – KYOTO PROTOCOLUNFCCC – KYOTO PROTOCOL
04/18/2304/18/23 1515
ENERGY EFFICIENCY INDEX – MARPOL REQUIREMENTSENERGY EFFICIENCY INDEX – MARPOL REQUIREMENTS
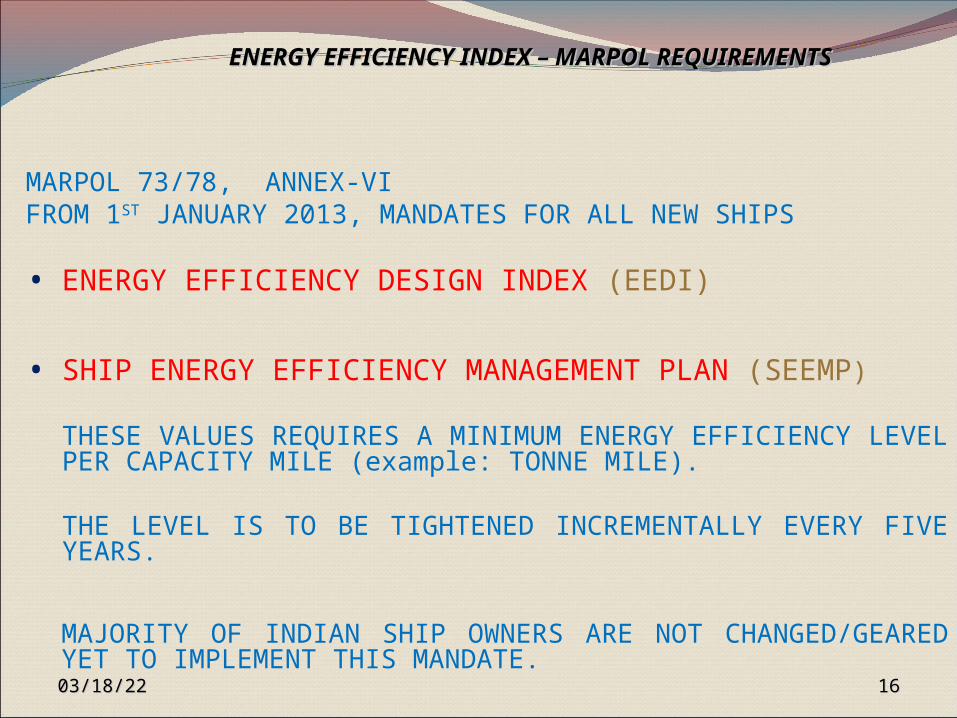
MARPOL 73/78, ANNEX-VIFROM 1ST JANUARY 2013, MANDATES FOR ALL NEW SHIPS
• ENERGY EFFICIENCY DESIGN INDEX (EEDI)
• SHIP ENERGY EFFICIENCY MANAGEMENT PLAN (SEEMP)
THESE VALUES REQUIRES A MINIMUM ENERGY EFFICIENCY LEVEL PER CAPACITY MILE (example: TONNE MILE).
THE LEVEL IS TO BE TIGHTENED INCREMENTALLY EVERY FIVE YEARS.
MAJORITY OF INDIAN SHIP OWNERS ARE NOT CHANGED/GEARED YET TO IMPLEMENT THIS MANDATE.
04/18/2304/18/23 1616
ENERGY EFFICIENCY INDEX – MARPOL REQUIREMENTSENERGY EFFICIENCY INDEX – MARPOL REQUIREMENTS
04/18/2304/18/23 1717
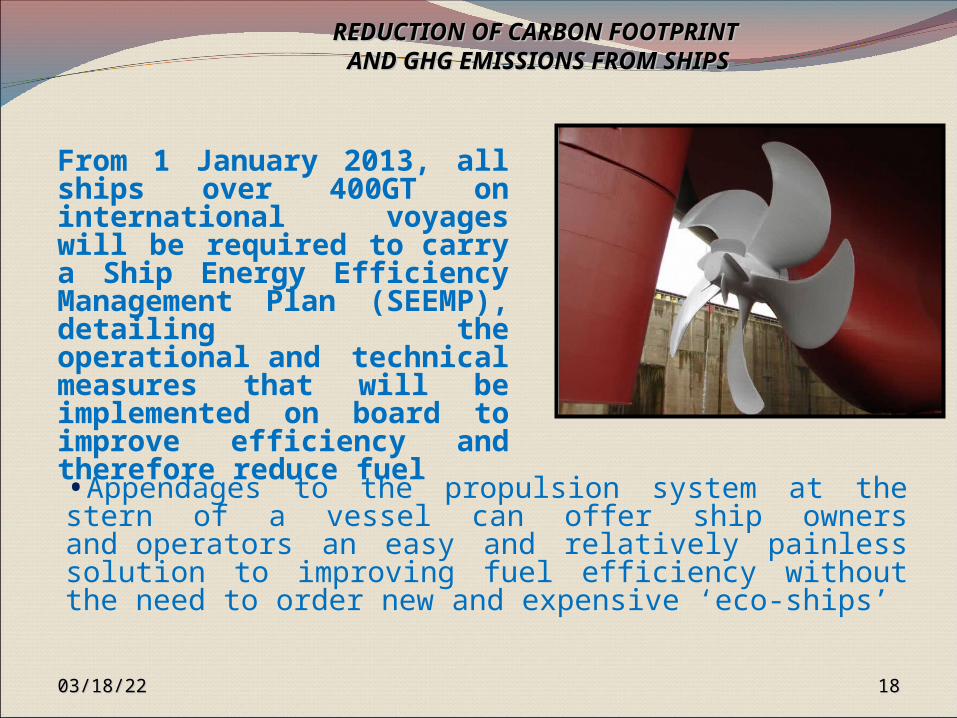
From 1 January 2013, all ships over 400GT on international voyages will be required to carry a Ship Energy Efficiency Management Plan (SEEMP), detailing the operational and technical measures that will be implemented on board to improve efficiency and therefore reduce fuel•Appendages to the propulsion system at the stern of a vessel can offer ship owners and operators an easy and relatively painless solution to improving fuel efficiency without the need to order new and expensive ‘eco-ships’
04/18/2304/18/23 1818
REDUCTION OF CARBON FOOTPRINT REDUCTION OF CARBON FOOTPRINT AND GHG EMISSIONS FROM SHIPSAND GHG EMISSIONS FROM SHIPS
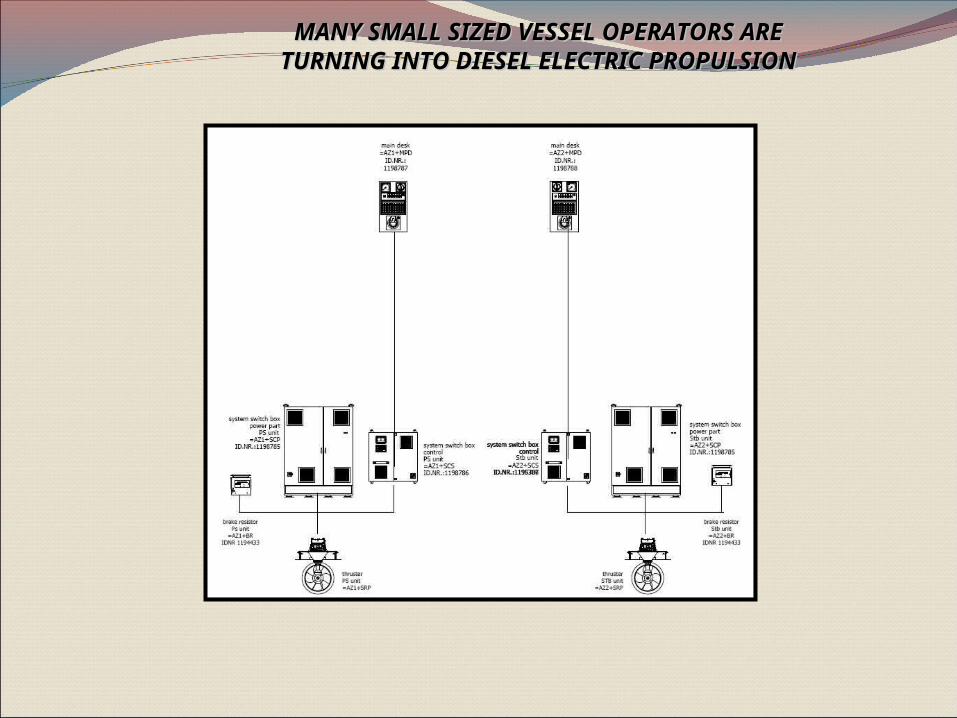
MANY SMALL SIZED VESSEL OPERATORS AREMANY SMALL SIZED VESSEL OPERATORS ARETURNING INTO DIESEL ELECTRIC PROPULSIONTURNING INTO DIESEL ELECTRIC PROPULSION
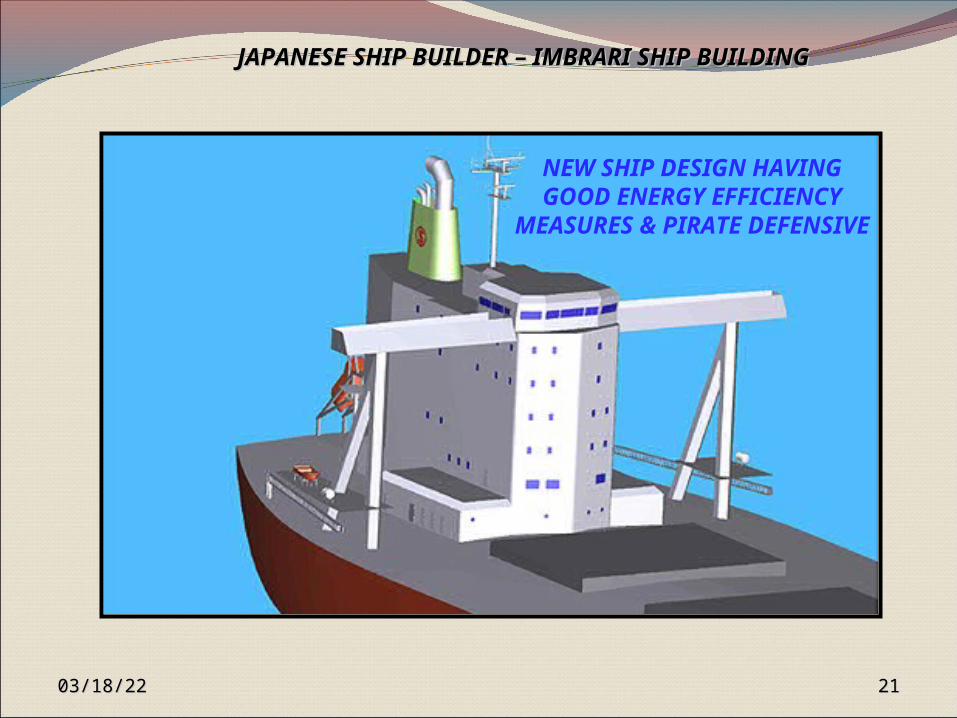
Japanese shipbuilder Imabari Shipbuilding has introduced a unique solution that could help combat two of shippings biggest challenges;
(i) piracy and (ii) energy efficiency.
•The technology, called Aero-Citadel, introduces a streamlined and aerodynamic shape to a ships superstructure and other advances in the vessels accommodation block, engine room , and funnel casing.
•The design also includes a built in citadel along other piracy prevention measures.
04/18/2304/18/23 2020
REDUCTION OF CARBON FOOTPRINT REDUCTION OF CARBON FOOTPRINT EFFORTS FROM THE OTHER NATIONSEFFORTS FROM THE OTHER NATIONS
JAPANESE SHIP BUILDER – IMBRARI SHIP BUILDING JAPANESE SHIP BUILDER – IMBRARI SHIP BUILDING
NEW SHIP DESIGN HAVING GOOD ENERGY
EFFICIENCY MEASURES & PIRATE DEFENSIVE
04/18/2304/18/23 2121

•The exterior design was developed through extensive wind tunnel testing that Imabari says could potentially lead to a reduction in wind pressure and drag by up to 25 or 30%
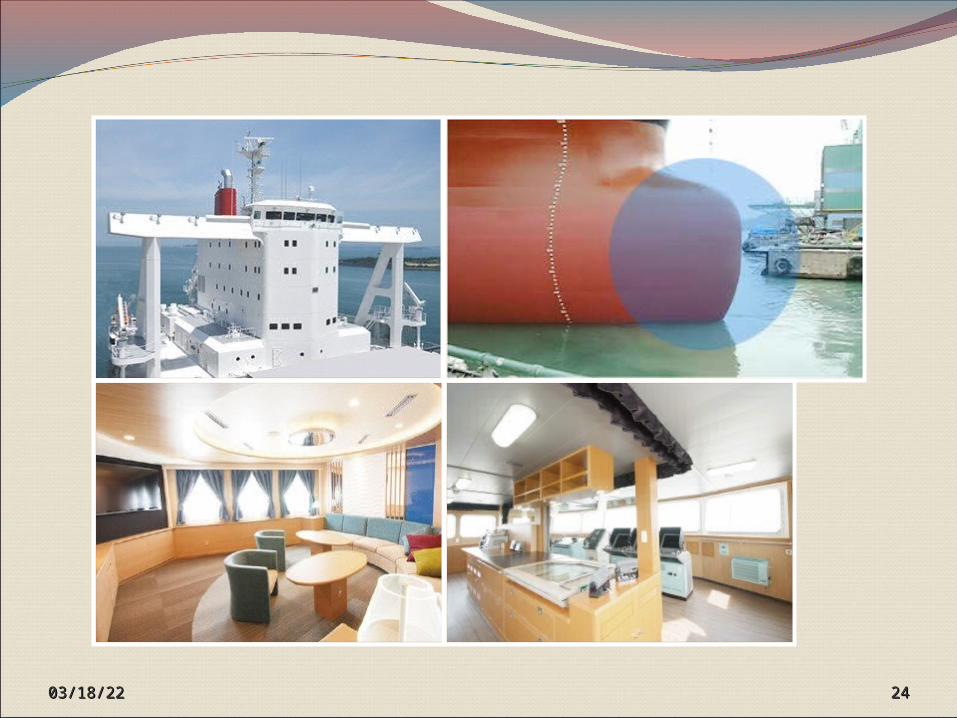
•All stairs leading to the bridge are placed on the inside of the superstructure and the entrance on lower level deck is equipped with thicker, reinforced steel doors to make it more difficult for intruders to enter.
•In addition the stairs and entranceway, the windows are equipped with bulletproof glass, and water cannons are placed on the upper deck to help blast attacking pirates.
04/18/2304/18/23 2222
•REDUCTION OF CARBON FOOTPRINT REDUCTION OF CARBON FOOTPRINT •AND GHG EMISSIONS FROM SHIPSAND GHG EMISSIONS FROM SHIPS
•The superstructure also includes a citadel with enough supplies to accommodate crewmembers for several days, and is protected by double-layer security doors.
•Inside the citadel, the facility features communication equipment running on its own independent power source, ship maneuvering equipment that can shut off the main engine and steering gear, and surveillance equipment allowing access to vessel data, including video, picture and sound.
•In addition to the unique superstructure shape and anti-piracy measures, the accommodation block features energy efficient LED lighting and noise and vibration insulation for enhanced crew comfort, and a wheelhouse with a widened backward view for safer navigation.
04/18/2304/18/23 2323
REDUCTION OF CARBON FOOTPRINT REDUCTION OF CARBON FOOTPRINT AND GHG EMISSIONS FROM SHIPSAND GHG EMISSIONS FROM SHIPS
04/18/2304/18/23 2424

REDUCTION OF CARBON FOOTPRINT REDUCTION OF CARBON FOOTPRINT AND GHG EMISSIONS FROM SHIPSAND GHG EMISSIONS FROM SHIPS
Ship Energy Efficiency Management Plan (SEEMP) and Energy Efficiency Operational Indicator (EEOI)
The Ship Energy Efficiency Management Plan (SEEMP) is an operational measure that establishes a mechanism to improve the energy efficiency of a ship in a cost-effective manner. The SEEMP also provides an approach for shipping companies to manage ship and fleet efficiency performance over time using, for example, the Energy Efficiency Operational Indicator (EEOI) as a monitoring tool.
04/18/2304/18/23 2525

REDUCTION OF CARBON FOOTPRINT REDUCTION OF CARBON FOOTPRINT AND GHG EMISSIONS FROM SHIPSAND GHG EMISSIONS FROM SHIPS
Ship Energy Efficiency Management Plan (SEEMP) and Energy Efficiency Operational Indicator (EEOI)
The guidance on the development of the SEEMP for new and existing ships are given in (MEPC.1/Circ.684).
The SEEMP urges the ship owner and operator at each stage of the plan to consider new technologies and practices when seeking to optimise the performance of a ship.
04/18/2304/18/23 2626

The EEOI enables operators to measure the fuel efficiency of a ship in operation and to gauge the effect of any changes in operation.
Example:
(1)Improved voyage planning (or)
(2)more frequent propeller cleaning, (or)
(3)introduction of technical measures such as
waste heat recovery systems (or)
(4)a new propeller.
04/18/2304/18/23 2727
REDUCTION OF CARBON FOOTPRINT REDUCTION OF CARBON FOOTPRINT AND GHG EMISSIONS FROM SHIPSAND GHG EMISSIONS FROM SHIPS
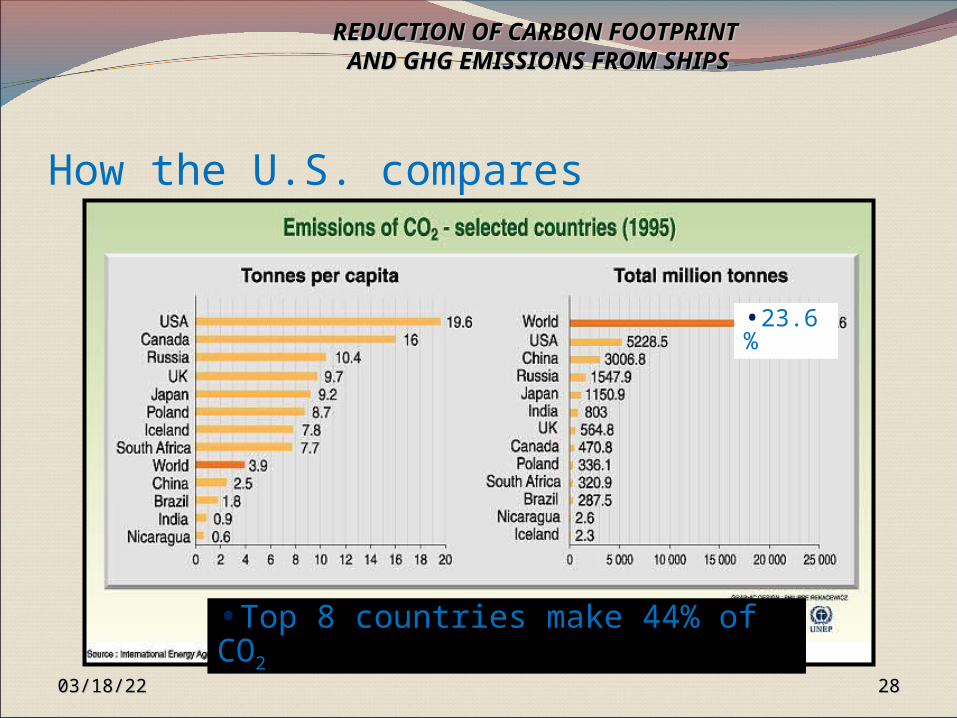
How the U.S. compares
•23.6%
•Top 8 countries make 44% of CO2
04/18/2304/18/23 2828
REDUCTION OF CARBON FOOTPRINT REDUCTION OF CARBON FOOTPRINT AND GHG EMISSIONS FROM SHIPSAND GHG EMISSIONS FROM SHIPS
04/18/2304/18/23 2929
REDUCTION OF CARBON FOOTPRINT REDUCTION OF CARBON FOOTPRINT AND GHG EMISSIONS FROM SHIPSAND GHG EMISSIONS FROM SHIPS

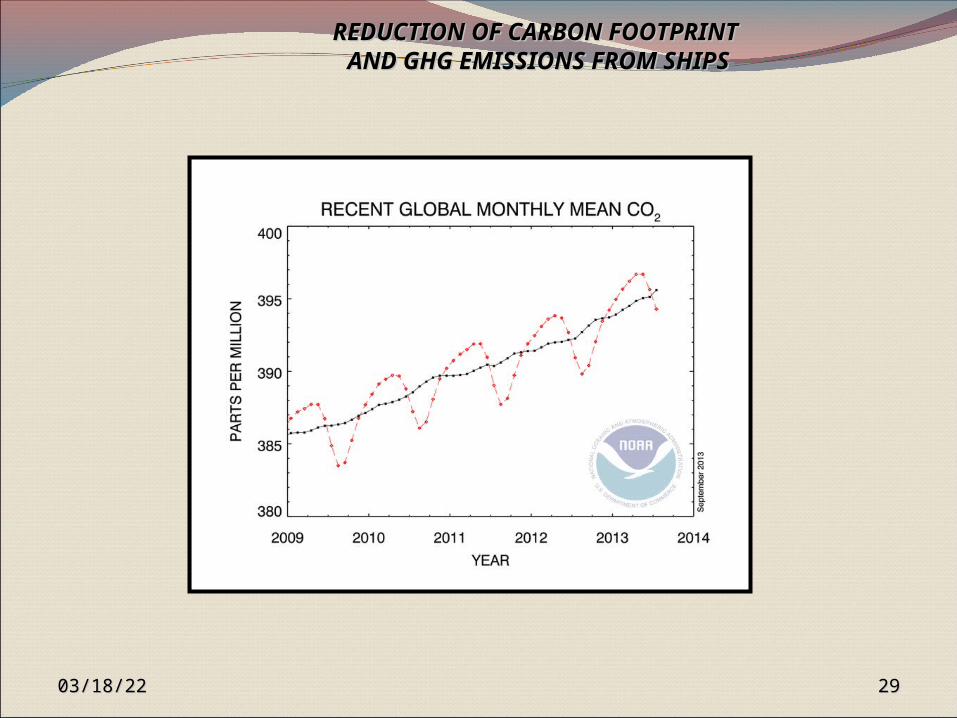
•CO2 concentrations at the Mauna Loa Observatory in Hawaii (Recent)
•Source: http://www.esrl.noaa.gov/gmd/ccgg/trends/co2_data_mlo.html
RECENT MONTHLY MEAN AT MAUNA LOARECENT MONTHLY MEAN AT MAUNA LOA
04/18/2304/18/23 3030
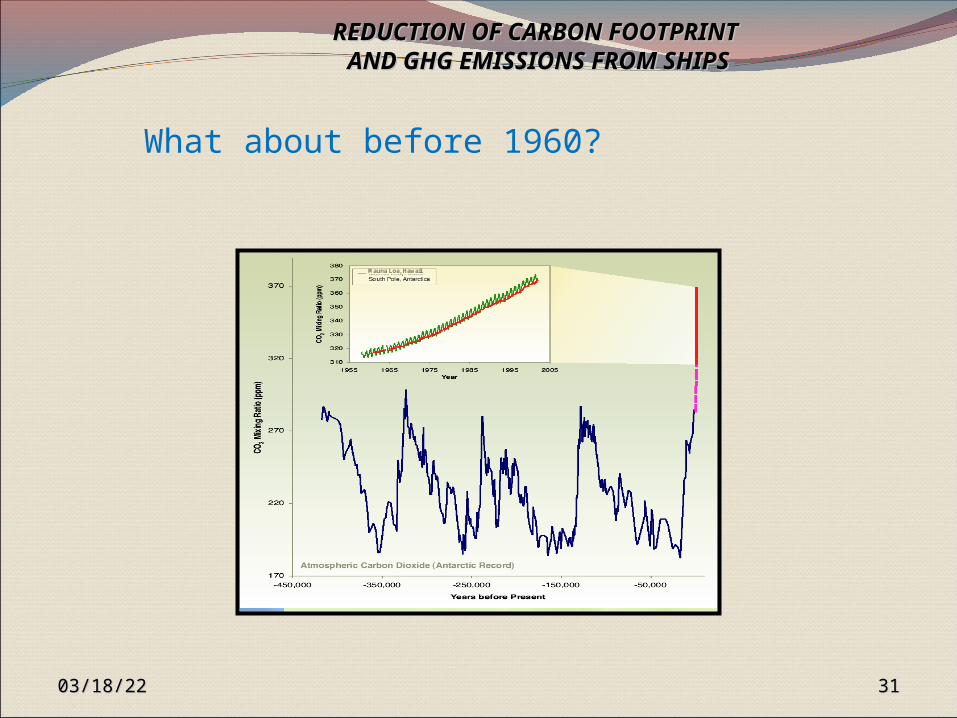
What about before 1960?
Mauna Loa, Hawaii
04/18/2304/18/23 3131
REDUCTION OF CARBON FOOTPRINT REDUCTION OF CARBON FOOTPRINT AND GHG EMISSIONS FROM SHIPSAND GHG EMISSIONS FROM SHIPS

•Changes in the average global temperature relative to the mean temperature during the 20th
century•Source: http://www.epa.gov/climatechange/science/recenttc_triad.html
04/18/2304/18/23 3232
REDUCTION OF CARBON FOOTPRINT REDUCTION OF CARBON FOOTPRINT AND GHG EMISSIONS FROM SHIPSAND GHG EMISSIONS FROM SHIPS

•Part of supply chain •Driver of emissions•Ways to reduce emissions (examples)
•Ocean transportation
•Air transportation
•Port moves
•Domestic distribution
•Warehousing
• Volume moved
• km covered
• kg moved
• km covered
• Number of containers
• Transportation mode (truck vs. rail)
• km covered
• Volume moved
• Number of days in warehouse
• Number of CBM
• Higher container utilisation
• Use of more eco-friendly carriers
• Air to Sea-Air conversion
• Higher container utilisation
• 20’ to 40’ conversion
• CFS-CY conversion
• Higher utilisation of delivery trucks/vans
• Double-decker trailers
• Increased use of rail
• Use of bio-fuel
• Reduce safety stock
• DC bypassing
•Drivers of Carbon Emissions and Reduction PotentialsDrivers of Carbon Emissions and Reduction Potentials
04/18/2304/18/23 3333

SUGGESTIVE MEASURES FOR -REDUCTION OF CARBON SUGGESTIVE MEASURES FOR -REDUCTION OF CARBON FOOTPRINT FOOTPRINT
AND GHG EMISSIONS FROM SHIPSAND GHG EMISSIONS FROM SHIPS
There is a method of marine adaptation and migration of a commercial land based carbon foot print reduction system (used in Power plants and other land based facilities), integrated to the platform of a proven marine fuel saving system.
To leverage proven existing technologies that have been successfully applied to land-based emission sources and integrate it into a proven marine energy conservation system to develop a system that will measure and minimize Carbon Foot Print (CFP) and further increase fuel efficiency.
04/18/2304/18/23 3434
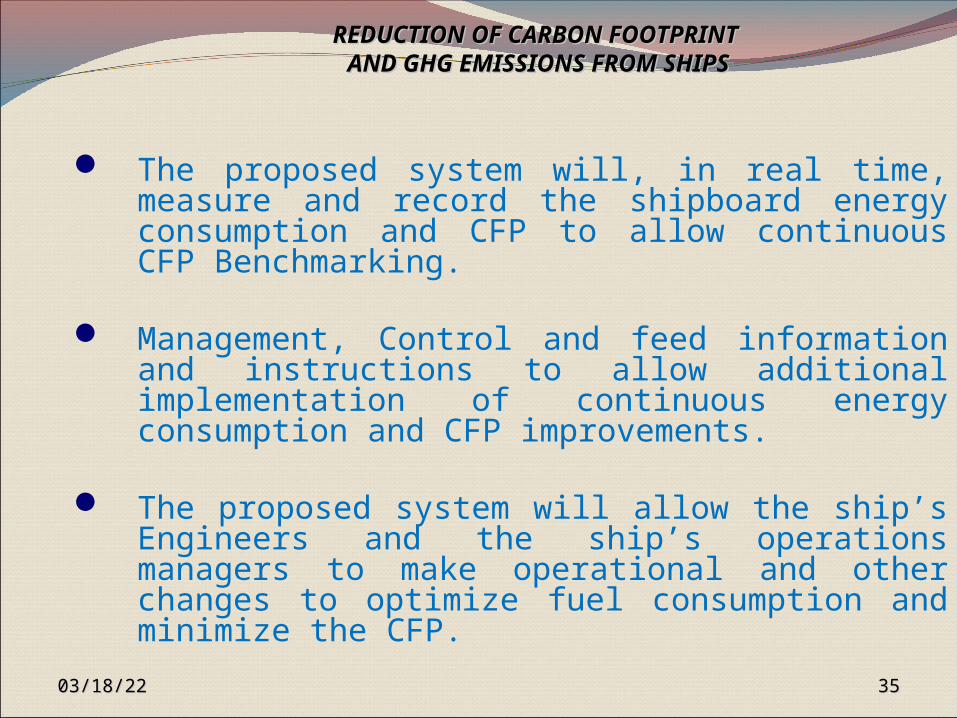
The proposed system will, in real time, measure and record the shipboard energy consumption and CFP to allow continuous CFP Benchmarking.
Management, Control and feed information and instructions to allow additional implementation of continuous energy consumption and CFP improvements.
The proposed system will allow the ship’s Engineers and the ship’s operations managers to make operational and other changes to optimize fuel consumption and minimize the CFP.
REDUCTION OF CARBON FOOTPRINT REDUCTION OF CARBON FOOTPRINT AND GHG EMISSIONS FROM SHIPSAND GHG EMISSIONS FROM SHIPS
04/18/2304/18/23 3535
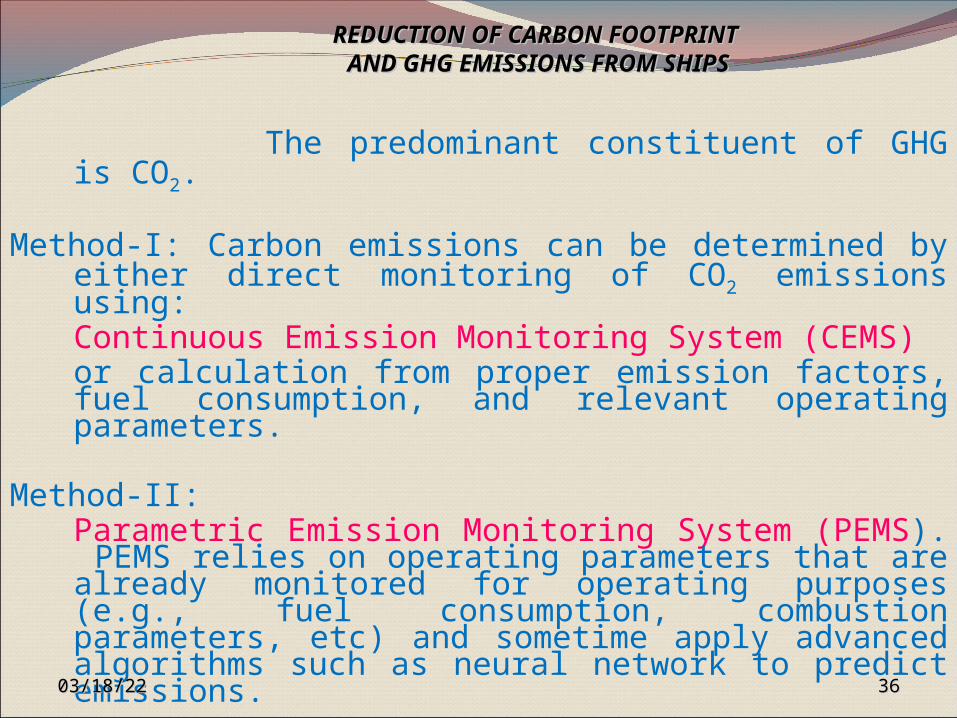
The predominant constituent of GHG is CO2.
Method-I: Carbon emissions can be determined by either direct monitoring of CO2 emissions using: Continuous Emission Monitoring System (CEMS) or calculation from proper emission factors, fuel consumption, and relevant operating parameters.
Method-II:Parametric Emission Monitoring System (PEMS). PEMS relies on operating parameters that are already monitored for operating purposes (e.g., fuel consumption, combustion parameters, etc) and sometime apply advanced algorithms such as neural network to predict emissions.
REDUCTION OF CARBON FOOTPRINT REDUCTION OF CARBON FOOTPRINT AND GHG EMISSIONS FROM SHIPSAND GHG EMISSIONS FROM SHIPS
04/18/2304/18/23 3636
The protocol embedded also addresses the carbon associated with stored energy that is brought on board and consumed. This may include batteries, supplied shore power at port, etc., which reduce the overall carbon footprint as compared to shipboard power.
Using the system the CFP can be determined at individual vessel level or fleet level.
REDUCTION OF CARBON FOOTPRINT REDUCTION OF CARBON FOOTPRINT AND GHG EMISSIONS FROM SHIPSAND GHG EMISSIONS FROM SHIPS
04/18/2304/18/23 3737
04/18/2304/18/23 3838
REDUCTION OF CARBON FOOTPRINT REDUCTION OF CARBON FOOTPRINT AND GHG EMISSIONS FROM SHIPSAND GHG EMISSIONS FROM SHIPS

This system provides a fundamental basis and foundation for the phased effort to provide each ship with a self managed energy conservation and carbon footprint reduction system.
REDUCTION OF CARBON FOOTPRINT REDUCTION OF CARBON FOOTPRINT AND GHG EMISSIONS FROM SHIPSAND GHG EMISSIONS FROM SHIPS
04/18/2304/18/23 3939

REDUCTION OF CARBON FOOTPRINT REDUCTION OF CARBON FOOTPRINT AND GHG EMISSIONS FROM SHIPSAND GHG EMISSIONS FROM SHIPS
• shipboard systems have many more variables and modes of operation.
• A ship is more complex and has many more, smaller systems than say a power generation plant on shore.
• This includes items such as the propulsion plant, power generation system, boilers and on board incinerators.
04/18/2304/18/23 4040

REDUCTION OF CARBON FOOTPRINT REDUCTION OF CARBON FOOTPRINT AND GHG EMISSIONS FROM SHIPSAND GHG EMISSIONS FROM SHIPS
The ship’s Master and Chief Engineer are able to change many variables like;
ship speed, course, loads on the electrical bus, number of generators on
line, Engine RPMs, ship’s ballast condition, hull trim, etc)
and the ship operations manager can change many others (like route, sailings, loading, hull and equipment maintenance status, etc).
04/18/2304/18/23 4141
REDUCTION OF CARBON FOOTPRINT REDUCTION OF CARBON FOOTPRINT AND GHG EMISSIONS FROM SHIPSAND GHG EMISSIONS FROM SHIPS
The system will help the ship owner to document the reductions and use the reductions as emissions credits or for positive public relations efforts.
THUS EEDI (Energy Efficiency Design Index) & EEOI (Energy Efficiency Operative Index) can be achieved and monitored for further reductions as stipulated in MARPOL Annex-VI.
04/18/2304/18/23 4242
REDUCTION OF CARBON FOOTPRINT REDUCTION OF CARBON FOOTPRINT AND GHG EMISSIONS FROM SHIPSAND GHG EMISSIONS FROM SHIPS
The computer based route optimization and weather data display package provides masters with the tools upon which to conduct efficient voyage planning with resultant improved safety and voyage performance.
• Optimum route - either for minimum time or minimum fuel.
• Alternatively the master can set certain weather thresholds which should be avoided along the optimized route as well as define no go areas that are blocked for the optimization.
• The Master can then compare this Optimum track with any number of reasonable alternatives. while reducing fuel consumption.04/18/2304/18/23 4343

As such the features achieved are:
(i)Standard Optimum Ship Routing Service(ii)Forecasting storm strength and effects(iii)Resonance AlertsFleet managers can see in an instant, all in one place, information that could have otherwise taken hours to gather from many sources.Vessels appear on the globe as color-coded icons that can be customized to provide fleet managerswith alerts regarding ship performance, fuel consumption/carbon emissions, weather conditions, ETAs or other factors.
04/18/2304/18/23 4444
REDUCTION OF CARBON FOOTPRINT REDUCTION OF CARBON FOOTPRINT AND GHG EMISSIONS FROM SHIPSAND GHG EMISSIONS FROM SHIPS

Optimizing Operating Parameters: As the emissions are directly related to the consumption of fuel onboard, the various options considered will be evaluated according to influence on fuel consumption.
The ultimate goal is to arrive at the optimum energy used per cargo ton mile for each ship. Even as this baseline is iteratively determined for each existing ship’s current configuration, further efficiency improvements, reduced energy consumption and reduced GHG emissions can be incorporated by implementation of maintenance techniques and configuration changes discussed later.
04/18/2304/18/23 4545
REDUCTION OF CARBON FOOTPRINT REDUCTION OF CARBON FOOTPRINT AND GHG EMISSIONS FROM SHIPSAND GHG EMISSIONS FROM SHIPS
OPTIMIZING OPERATIONAL PARAMETERS TO CONTROL OPTIMIZING OPERATIONAL PARAMETERS TO CONTROL THE FUEL CONSUMPTIONTHE FUEL CONSUMPTION
1.Choice of speed:
For any ship in a given condition, the fuel oil consumption, and thus the green house gas (GHG) emission, will mostly be a function of energy consumed to attain the ship’s speed. Most ship engines, running at reduced speed or slow steaming could have problems. Such problems may be vibrations (critical RPM of the engine shaft) and accelerated soot accumulation due to incomplete combustion in the exhausted gas channel. Thus a favorable balance of speed and GHG emission will need to be reached.
04/18/2304/18/23 4646

2. Speed or Power Variation:
Constant speed or power variations during a voyage, compared to steady running, increase infuel consumption.
3. Weather Routing:
Varying weather, current and depth conditions during a voyage affect the ship’s speed, which can result in an energy savings potential of 3-5%.
04/18/2304/18/23 4747
REDUCTION OF CARBON FOOTPRINT REDUCTION OF CARBON FOOTPRINT AND GHG EMISSIONS FROM SHIPSAND GHG EMISSIONS FROM SHIPS
4. Optimal Trim:
Optimal trim to attain maximum speed at a given mean draft and engine power can result in an energy saving potential between 0.1-1.0%.
5. Optimal Propeller Pitch:
Optimal propeller pitch on CP propellers canprovide an energy saving potential between 0.1-2
%.
04/18/2304/18/23 4848
REDUCTION OF CARBON FOOTPRINT REDUCTION OF CARBON FOOTPRINT AND GHG EMISSIONS FROM SHIPSAND GHG EMISSIONS FROM SHIPS
6. Minimum Ballast:
Decreasing ballast and extra bunker to a minimum could result in an energy saving potential between 0.1-1 %.
7. Improved Fleet Planning:
Better utilization of fleet capacity can often be achieved by improved fleet planning. An increased fleet utilization will result in reduction in energy consumption and hence reduction in the GHG emissions.
04/18/2304/18/23 4949
REDUCTION OF CARBON FOOTPRINT REDUCTION OF CARBON FOOTPRINT AND GHG EMISSIONS FROM SHIPSAND GHG EMISSIONS FROM SHIPS
8. Optimal Rudder: Steady rudder / Minimum Rudder angle variations to keep total fuel consumption at a minimum with autopilot adjustments could provide an energy saving potential between
0.1- 0.3 %.
9. Vessel Capacity Utilization: This will directly influence total GHG emissions.
04/18/2304/18/23 5050
REDUCTION OF CARBON FOOTPRINT REDUCTION OF CARBON FOOTPRINT AND GHG EMISSIONS FROM SHIPSAND GHG EMISSIONS FROM SHIPS

10. Anchoring and Mooring:
Time saved in port or in efficient mooring, berthingand anchoring may be used to reduce ship speed
at sea and thus save fuel. Reductions in GHG emissions up to 1-2 % may be achieved.
04/18/2304/18/23 5151
REDUCTION OF CARBON FOOTPRINT REDUCTION OF CARBON FOOTPRINT AND GHG EMISSIONS FROM SHIPSAND GHG EMISSIONS FROM SHIPS
11. Increasing Hull Efficiency: The impact of hull maintenance on the fuel efficiency and GHG emissions is through the effect of hull roughness on ships resistance. For the service life of a vessel, an increased hull roughness implies increased viscous resistance which results in an increased power demand to maintain speed.
Use of certain paint systems, long periods in harbor, long stays in warm waters, and/or exceeding of the service life of the paint systems will increase roughness greater than 60 NM.
It is not abnormal to expect savings of more than 3-4% through perfect hull maintenance.
04/18/2304/18/23 5252
REDUCTION OF CARBON FOOTPRINT REDUCTION OF CARBON FOOTPRINT AND GHG EMISSIONS FROM SHIPSAND GHG EMISSIONS FROM SHIPS

12. Increasing Propeller Efficiency: Because of the propeller roughness, there will be
increase in propeller blade drag and will consume more power for achieving the same speed.
On some old hulls, reduction of propeller roughness
will tend to improve fuel consumption by engines and thereby energy conservation and CFP reduction will be achieved. The resulting carbon footprint reduction will be measured using the protocol established for this effort.
04/18/2304/18/23 5353
REDUCTION OF CARBON FOOTPRINT REDUCTION OF CARBON FOOTPRINT AND GHG EMISSIONS FROM SHIPSAND GHG EMISSIONS FROM SHIPS

13. Engine Tuning & Overhauls:
The power output of engines decreases periodically due to wear & tear and carbon deposits. Periodic performance tuning of the engines can lead to complete fuel combustion and can result in increased efficiency.
04/18/2304/18/23 5454
REDUCTION OF CARBON FOOTPRINT REDUCTION OF CARBON FOOTPRINT AND GHG EMISSIONS FROM SHIPSAND GHG EMISSIONS FROM SHIPS
Benefits: • This approach is relatively inexpensive, • Highly effective• Technologically low risk and
This is an economical, low risk/high reward method which will yield real life results in energy conservation and CFP reduction without any negative environmental impacts while incorporating these measures.
04/18/2304/18/23 5555
REDUCTION OF CARBON FOOTPRINT REDUCTION OF CARBON FOOTPRINT AND GHG EMISSIONS FROM SHIPSAND GHG EMISSIONS FROM SHIPS

THUS WE CAN SAVE OUR ENVIRONMENT THUS WE CAN SAVE OUR ENVIRONMENT AND OUR MOTHER EARTHAND OUR MOTHER EARTH
04/18/2304/18/23 5656


![Devi Mahatmya [in Markandeya Purana] Vyakhyana_4884-Nagesh Bhatta](https://cdn.vdocuments.mx/doc/165x107/55cf8616550346484b942805/devi-mahatmya-in-markandeya-purana-vyakhyana4884-nagesh-bhatta.jpg)