MEASUREMENT OF SHOULDER JOINT STRENGTH AND MOBILITY IN COMMON
COLLEGIATE AGED OVERHEAD ATHLETES
by
Robert Daniel Ricci
Bachelor of Science in Athletic Training, Slippery Rock University of Pennsylvania, 2003
Submitted to the Graduate Faculty of
School of Health and Rehabilitation Science in partial fulfillment
of the requirements for the degree of Master’s of Science
University of Pittsburgh
2006
ii
UNIVERSITY OF PITTSBURGH
SCHOOL OF HEALTH AND REHABILITATION SCIENCES
This thesis was presented
By:
R. Daniel Ricci
It was defended on
October 30, 2006
and approved by:
John P. Abt PhD, ATC
Craig A. Wassinger MS, PT
Thesis Advisor: Joseph B. Myers PhD, ATC

iii
MEASUREMENT OF SHOULDER JOINT STRENGTH AND MOBILITY IN COMMON COLLEGIATE AGED OVERHEAD ATHLETES
R. Daniel Ricci MS, ATC
University of Pittsburgh, 2006
Introduction: Previous research has stereotyped many overhead athletes as baseball pitchers.
Due to the different physiological stresses in each overhead sport, it may not be appropriate to
group all overhead athletes together. The objective of this study was to show sport specific
physical adaptations in common overhead sports.
Methods: Forty-three healthy, male athletes participated in this cross-sectional study; fifteen
baseball pitchers, fifteen volleyball athletes, thirteen tennis athletes and fifteen control athletes.
Internal rotation (IR) and external rotation (ER) shoulder range of motion (ROM), glenohumeral
internal rotation deficit (GIRD), external rotation gain (ERG), posterior shoulder tightness (PST)
(supine and side-lying methods), shoulder strength and scapular kinematics were assessed in a
neuromuscular research laboratory. ROM was assessed with a goniometer while PST was
assessed with a goniometer (supine) and carpenters’ square (side-lying). Strength was assessed
with an isokinetic dynamometer and scapular kinematics with an electromagnetic tracking
device.
Results: Pitchers had more dominant IR ROM than tennis athletes and less dominant IR ROM
than control athletes. Tennis athletes had the lowest IR ROM of all groups included in this
study. Volleyball athletes had less dominant IR ROM than control athletes. Pitchers and tennis
athletes had more GIRD than control athletes had. Pitchers and tennis athletes had higher
between limb differences with the supine method of assessing PST. With the supine assessment,
tennis athletes had increased dominant PST compared to control athletes; additionally, all
overhead athletes had decreased non-dominant PST. At 90° and 120° humeral elevation,
pitchers had the most scapular elevation, volleyball athletes had more elevation than tennis

iv
athletes did, and tennis athletes had less elevation than control athletes did. There were no
differences in external rotation ROM, total rotation ROM, or strength measures.
Conclusion: Not all overhead athletes had the same physical characteristics. The differences
between sports in each of the variables could be due to the different amount of physiologic stress
on the shoulder in each sport. These results may help to show healthy, sport specific adaptations
to each sport. Clinicians should develop sport specific rehabilitation protocols and return to play
criteria for athletes to return to play earlier and stronger.

v
TABLE OF CONTENTS
1.0 INTRODUCTION........................................................................................................ 1
1.1 SPECIFIC AIMS AND HYPOTHESES ........................................................... 5
1.1.1 Specific Aim and Hypothesis 1..................................................................... 5
1.1.2 Specific Aim and Hypothesis 2..................................................................... 6
1.1.3 Specific Aim and Hypothesis 3..................................................................... 6
1.1.4 Specific Aim and Hypothesis 4..................................................................... 6
2.0 MATERIALS AND METHODS ................................................................................ 8
2.1 SUBJECTS ........................................................................................................... 8
2.2 INSTRUMENTATION ....................................................................................... 9
2.2.1 Goniometer .................................................................................................... 9
2.2.2 MotionMonitor Electromagnetic Tracking Device.................................... 9
2.2.3 Biodex System 3 Isokinetic Dynomometer ............................................... 10
2.3 PROCEDURES.................................................................................................. 11
2.3.1 Range of Motion Assessment ..................................................................... 11
2.3.2 Posterior Shoulder Tightness Assessment (Side –Lying) ........................ 13
2.3.3 Posterior Shoulder Tightness Assessment (Supine Method) .................. 16
2.3.4 Scapular Kinematic Assessment................................................................ 17
2.3.5 Strength Assessment ................................................................................... 22
2.4 DATA REDUCTION AND ANALYSIS.......................................................... 26
3.0 RESULTS ................................................................................................................... 29
3.1 RANGE OF MOTION ASSESSMENT........................................................... 30
3.1.1 Shoulder Internal Rotation Range of Motion .......................................... 30
3.1.2 Shoulder External Rotation Range of Motion.......................................... 32
3.1.3 Total Shoulder Rotation Range of Motion ............................................... 33
vi
3.1.4 Glenohumeral Internal Rotation Deficit (GIRD) and External Rotation
Gain (ERG)................................................................................................................. 33
3.2 POSTERIOR SHOULDER TIGHTNESS ...................................................... 34
3.3 STRENGTH ASSESSMENT............................................................................ 37
3.3.1 Shoulder Internal Rotation/External Rotation Strength Assessment.... 37
3.3.2 Shoulder Protraction/Retraction Strength Assessment .......................... 38
3.4 SCAPULAR KINEMATICS ............................................................................ 39
4.0 DISCUSSION ............................................................................................................. 49
4.1.1 Range of Motion.......................................................................................... 49
4.1.2 GIRD/ERG .................................................................................................. 52
4.1.3 Posterior Shoulder Tightness..................................................................... 53
4.1.4 Internal/External Rotation Strength......................................................... 55
4.1.5 Protraction/Retraction Strength................................................................ 56
4.1.6 Scapular Kinematics................................................................................... 58
4.2 STUDY LIMITATIONS ................................................................................... 61
4.3 FUTURE RESEARCH...................................................................................... 62
4.4 CLINICAL RELEVANCE ............................................................................... 63
5.0 CONCLUSION........................................................................................................... 64
BIBLIOGRAPHY....................................................................................................................... 65
vii
LIST OF TABLES
Table 1 Description of antomical landmarks ................................................................................ 19
Table 2 List of dependant variables .............................................................................................. 26
Table 3 ISG definitions of LCS .................................................................................................... 27
Table 4 Subject Demographics ..................................................................................................... 29
Table 5 Shoulder Rotation Range of Motion................................................................................ 30
Table 6 Mean Differences for Dominant Shoulder Internal Rotation .......................................... 31
Table 7 Mean Differences for Non-Dominant Shoulder Internal Rotation .................................. 31
Table 8 Glenohumeral Internal Rotation Deficit / External Rotation Gain Measurement ........... 33
Table 9 Posterior Shoulder Tightness Measurement .................................................................... 35
Table 10 Mean Differences for Dominant Shoulder, Supine PST Assessment............................ 35
Table 11 Mean Differences for Non-Dominant Shoulder, Supine PST Assessment ................... 36
Table 12 Internal/External Rotation Strength at 60º/sec............................................................... 38
Table 13 Internal/External Rotation Strength Assessment at 300°/sec ........................................ 38
Table 14 Protraction/Retraction Strength Assessment at 12.2 cm/sec ......................................... 39
Table 15 Protraction/Retraction Strength Assessment at 36.6 cm/sec ......................................... 39
Table 16 Dominant Scapular Kinematic Results .......................................................................... 41
Table 17 Non-Dominant Scapular Kinematic Results.................................................................. 42
Table 18 Mean Differences for Dominant Limb Scapular Elevation at 90° Humeral Elevation . 43
Table 19 Mean Differences for Non-Dominant Limb Scapular Elevation at 90° Humeral
Elevation ....................................................................................................................................... 43
Table 20 Mean Differences for Dominant Limb Scapular Elevation at 120° Humeral Elevation44
Table 21 Mean Differences for Non-Dominant Limb Scapular Elevation at 120° Humeral
Elevation ....................................................................................................................................... 44
viii
LIST OF FIGURES
Figure 1 Tester/subject positioning for ER ROM assessment ...................................................... 12
Figure 2 Tester/subject positioning for IR ROM assessment ....................................................... 13
Figure 3 Tester/subject positioning for side-lying PST assessment ............................................. 15
Figure 4 Tester/Subject positioning for Supine PST assessment.................................................. 17
Figure 5 ISG definitions of LCS for anatomical regions.............................................................. 20
Figure 6 Plastic guide tubes to keep elevation in scapular plane.................................................. 21
Figure 7 ISG definitions of scapular motions that were assessed................................................. 22
Figure 8 Biodex setup for shoulder protraction/retraction strength assessment ........................... 23
Figure 9 Biodex setup for shoulder IR/ER strength assessment................................................... 25
Figure 10 Shoulder Internal Rotation Range of Motion ............................................................... 32
Figure 11 Glenohumeral Internal Rotation Deficit ....................................................................... 34
Figure 12 Supine Posterior Shoulder Tightness Assessment....................................................... 37
Figure 13 Between Limb Scapular Elevation at 90° Humeral Elevation ..................................... 45
Figure 14 Between Limb Scapular Elevation at 120° humeral Elevation .................................... 46
Figure 15 Dominant Scapular Elevation....................................................................................... 47
Figure 16 Non-Dominant Scapular Elevation............................................................................... 48
1
1.0 INTRODUCTION
Many prior studies have grouped overhead athletes together as one population1-8.
Baseball pitchers have been studied as the stereotypical overhead athlete1, 4, 6, 8-13. For example,
Wilk et al8 presents rehabilitation techniques for the overhead throwing athletes, but only discuss
baseball. Burkhart et al12 state that the “dead arm” can be present in the overhead athlete, but go
on to only use baseball pitchers as examples in their review paper. The term “dead arm” is
defined as any pathologic shoulder condition in which the thrower is unable to throw with their
pre-injury velocity and control because of a combination of pain and subjective unease in the
shoulder12. Using the description by Burkhart et al12 in regards to the dead arm presenting in the
overhead athlete, there is the possibility that this etiology is capable of being present in non-
throwing overhead athletes as well.
Physical characteristics of the shoulder in overhead athletes may differ among overhead
sports. Shoulder internal rotation velocities may range from 6000o/sec14 to 10,000o/sec15 for
baseball pitchers. During the tennis serve, shoulder internal rotation velocities may reach
1500o/sec16. There is no literature published, to the author’s knowledge, which calculates
angular velocities for volleyball serving or spiking. The different degree of internal rotation
velocity is an example of the different demands placed on the shoulder between each sport.
Research has suggested that the forceful, eccentric contractions as well as distraction
forces may cause microtrauma to the external rotators during the follow through/deceleration
phase in baseball, tennis and volleyball5, 8, 10, 15, 17-20. This may lead to a decrease in posterior
shoulder mobility and induce a loss of range of motion5, 9, 17-19, 21-24. This assumption may
explain the demonstrated differences in internal rotation loss between the different sports5, 9, 18, 19,
24, 25. Ellenbecker et al17 hypothesize that adaptations of the posterior capsule as well as
musculoskeletal adaptations may serve to maintain the overall stability of the glenohumeral joint
versus a predisposing injury in elite junior tennis players. Some research suggests that an osseous
2
adaptation of humeral retroversion coupled with posterior rotator cuff tightness are the culprits
for the arc of motion shift8, 26.
Internal rotation range of motion of the shoulder has been shown to be less in the
dominant limb of baseball, tennis and volleyball players when compared to the non-dominant
limb (Glenohumeral Internal Rotation Deficit or GIRD)9, 18, 24, 27, 28. This loss of internal rotation
varied with baseball typically having the most decrease in motion followed by tennis and
volleyball athletes. When compared bilaterally, athletes in overhead sports had an increase in
external rotation (External Rotation Gain or ERG) and a decrease in internal rotation in the
dominant limb9, 19, 24. Some research has shown that pitchers had a greater difference between
dominant and non-dominant limbs for external rotation range of motion, with no differences in
internal rotation, compared to position players5. These results suggest that external rotation gain
is a further adaptation from the regular overhead throw to the pitching motion. These differences
in range of motion are a good example of Wolff’s Law that states that the tissues adapt to the
stresses that are placed on them29. There is literature available that presents a “total motion
concept” in that the total arc of shoulder rotation (external rotation + internal rotation) motion is
the same when compared bilaterally8.
Ellenbecker and colleagues28 point out that although the GIRD between tennis and
baseball players was roughly the same, there was a significant decrease in the total rotation range
of motion in the dominant limb of tennis players but not in the non-dominant limb or in baseball
players. In similar studies, results show a decrease in dominant arm internal rotation, and total
rotational range of motion as well17, 18. It remains debatable in the literature if there is a decrease
in internal rotation with accompanying increases in external rotation (total motion concept), or a
loss of total rotational range of motion. Perhaps the differences can be associated with the
adaptations that are dependant on the stresses placed on the involved structures (Wolff’s Law).
The shoulder must have enough laxity to allow excessive external rotation in throwers, but also
maintain enough stability to prevent symptomatic humeral head subluxations8. This “throwers
paradox” could apply to other overhead motions as well. Each of the overhead sports included in
this study could have their own paradox since the demands of each on the shoulder are unique.
There is no research, to the author’s knowledge, that compares internal rotation to posterior
shoulder mobility in asymptomatic athletes competing in tennis and volleyball.
3
Research suggest that a tightened posterior shoulder may be a precursor to injury12, 19, 24,
30, 31. Burkhart et al12 suggest that a tight posterior capsule initiates the pathologic cascade that
leads to a SLAP lesion. They predict that if it is possible to prevent the posterior capsule from
tightening, the “dead arm” could be prevented. In order to prevent the dead arm, all throwing
athletes should habitually stretch the posterior/inferior capsule10. Research shows that the
humeral head tends to migrate in an anterior and superior direction from the tightened posterior
capsule 32. This altered kinematic pattern of the glenohumeral joint may lead to a decreased
subacromial space, leading to subacromial impingement32. Fleisig et al20 concluded from their
study that a decrease in flexibility may inhibit proper throwing mechanics in baseball pitchers.
By altering the throwing mechanics, further adaptations to the throwing motion may develop and
lead to injury. This principle may apply to other overhead motions as well. The adaptations
would vary depending on the sport. If it is possible to reduce the amount of posterior shoulder
tightness, perhaps the SLAP lesion and other pathologies are avoidable.
Tyler et al23 proposed a new method to reliably quantify posterior shoulder tightness
(PST). This clinical measurement allows a quick and valid method to assess posterior shoulder
mobility. With a larger database and more research to quantify posterior shoulder mobility in
overhead athletes, clinicians and researchers may have a better understanding of the importance
of this clinical measurement.
Scapula position and orientation in asymptomatic, throwing athletes has recently been
investigated by Myers and associates13. The study showed that the throwing athletes (baseball
players) have significantly increased upward rotation, internal rotation, and retraction of the
scapula during humeral elevation compared to control subjects. These changes in scapular
kinematics were speculated to be a chronic adaptation to a repetitive athletic task13. When
interpreting the results, perhaps all overhead sports have a chronic adaptation to their respective
athletic task. Due to the different degrees of biomechanical stresses previously mentioned, each
sport may have different degrees of adaptations (Wolff’s Law). If the scapular stabilizers are not
able to perform optimally, pathologies may arise33. It is hard for research to show whether
adaptations lead to pathologies or pathologies cause the adaptations. Since the current study
population will be asymptomatic and cover several overhead sports, it is possible to gain a better
understanding of how each overhead athlete adapts to their sport. This data, teamed with
4
previous data, should help researchers gain insight on ways to possibly prevent pathologies that
may be related to altered scapular kinematics 13, 33, 34.
Strength imbalance between the internal and external rotators may exist in overhead
athletes due to the associated movements used for overhead sports34-37. In general, the tendency
is that baseball athletes have the highest degree of imbalance (increased internal rotation with
decreased external rotation strength) between internal rotation and external rotation followed by
tennis and then volleyball8, 9, 19, 24, 25, 34, 37, 38. This research shows that throwers have an increase
in internal rotation and a decrease in external rotation strength in the dominant limb when
compared to the non-dominate limb. A balance between agonist/antagonist (external
rotation/internal rotation) muscle groups in athletes with posterior cuff abnormalities of 65%-
72% should provide dynamic shoulder joint stabilization8, 38. Excessive strength imbalance has
also been suggested to be related to shoulder pathology35, 36. If the external rotators are not
strong enough to control the forces that the internal rotators produce, the athlete may be
predisposed to a shoulder injury37. When the external rotators fatigue, this could produce the
same effects as an imbalance, potentially including glenohumeral instability and impingement 25.
It is difficult to compare exact strength ratios from study to study due to methodological
differences. The proposed study will allow comparisons between the different sports populations
included.
Another important aspect of shoulder strength to evaluate is the protraction and retraction
strength ratio. Like internal and external rotator strength imbalances, a strength imbalance in the
shoulder protractors and retractors could possibly be a predisposing factor for injury. Research
has demonstrated that shoulders with impingement syndrome had a decrease in protraction force
(decreased strength ratio) output when compared to the dominant shoulder of the healthy control
group; as well as the contra-lateral side of the patient group1, 7. Data also show side to side
differences in the healthy control group for the protraction/retraction strength ratios as well
(dominant side had lower protraction values than non-dominant)7. If the serratus anterior and
trapezius are not able to perform optimally, the possibility of altered scapular kinematics and
associated pathologies arises7, 33.
This idea of assessing the protraction/retraction strength ratio is a relatively new concept.
Therefore, few studies use a validated method to gather the data. None of the previous studies
has included the sport populations included in the current study. The data from this study, in
5
addition to previous data, will help to determine the importance of not only the internal/external
rotation strength ratios, but the protraction/retraction strength ratio as well.
All of the variables previously mentioned in this chapter (shoulder range of motion,
posterior shoulder mobility, scapular kinematics, and strength assessment) could be adaptations
to each sport. The current study employed asymptomatic athletes. This helped to demonstrate
what adaptations might be present in healthy overhead athletes and help to develop a knowledge
base for the healthy adaptations to each sport. The current research study will help to define the
non-throwing, overhead athlete. Data from this study may help to develop prevention programs
to focus strengthening exercises on certain muscles as well as define some of the healthy
adaptations that the human body makes to repetitive, athletic overhead motions.
1.1 SPECIFIC AIMS AND HYPOTHESES
The purpose of this research project is to compare shoulder range of motion, posterior
shoulder mobility, strength and scapular kinematics of collegiate aged athletes participating in
common overhead sports. There are four specific aims to meet this purpose. The specific aims
and hypotheses for the current research project include:
1.1.1 Specific Aim and Hypothesis 1
Specific Aim 1: Evaluate glenohumeral internal rotation and external rotation range of
motion in asymptomatic overhead athletes (15 baseball pitchers, 15 tennis athletes and 15
volleyball athletes) and a control group (15 track and/or soccer athletes) with a standard
goniometer.
Hypothesis 1: Baseball, tennis, and volleyball athletes will have a decrease in
glenohumeral internal rotation range of motion of their dominant shoulder when compared
bilaterally (GIRD). Pitchers will have the most GIRD followed by tennis athletes, volleyball
athletes and the control group. Baseball, tennis and volleyball athletes will have a subsequent
external rotation gain (ERG) with respect to the control group.
6
1.1.2 Specific Aim and Hypothesis 2
Specific Aim 2: Using the protocol set forth by Tyler et al23, evaluate posterior shoulder
tightness of 15 baseball pitchers, 15 tennis athletes, 15 volleyball athletes and 15 control subjects
(track and/or soccer athletes).
Hypothesis 2: Baseball pitchers, tennis athletes and volleyball athletes will have
increased posterior shoulder tightness of their dominant limb with respect to the contralateral
limb and control group. Pitchers will have the most tightness followed by tennis athletes,
volleyball athletes, and the control group.
1.1.3 Specific Aim and Hypothesis 3
Specific Aim 3: Using an electromagnetic tracking device, evaluate scapular kinematics
of 15 baseball pitchers, 15 tennis athletes, 15 volleyball athletes, and 15 control subjects (track
and/or soccer athletes) during a single elevation task.
Hypothesis 3: Baseball, tennis and volleyball athletes will have a unilateral change in
scapular kinematics on the dominant side presenting as increased upward scapular rotation,
increased internal rotation, and increased retraction when compared to the contra-lateral side and
the control group.
1.1.4 Specific Aim and Hypothesis 4
Specific Aim 4: Evaluate shoulder internal/external rotation and protraction/retraction
strength on an isokinetic dynamometer in 15 baseball pitchers, 15 tennis athletes, 15 volleyball
athletes and 15 control subjects (track and/or soccer athletes).
Hypothesis 4a: All overhead athletes will have increased internal rotation strength with
respect to controls to varying degrees; Baseball pitchers will have greatest internal rotation
strength followed by tennis athletes, volleyball athletes and the control group. All overhead
athletes will not have significantly increased external rotation strength but will be higher than the
7
control groups. The internal rotation/external rotation strength ratio will be highest in the
baseball pitchers, followed by tennis athletes, volleyball athletes and the control group.
Hypothesis 4b: All overhead athletes will have decreased protraction strength, increased
retraction strength and associated lower protraction/retraction strength ratio when compared
bilaterally. Baseball pitchers will have the lowest strength ratio followed by tennis athletes,
volleyball athletes and the control group.
8
2.0 MATERIALS AND METHODS
2.1 SUBJECTS
Forty-five male overhead athletes (15 baseball, 13 tennis, and 15 volleyball) and 15
control athletes (male, soccer and/or track athletes) participated in the study. The control group
of male soccer and/or track athletes as well as baseball athletes were from the same university.
Since there are no men’s tennis or volleyball varsity teams at this university, 15 volleyball and
13 tennis athletes who practice/compete 3-4 times a week for 1-2 hours at a time were enrolled
from local tennis and volleyball clubs.
Exclusion criteria for all participants included history of fracture, sprain/strain,
dislocation/subluxation of any soft tissue or bony tissue of the upper extremity; history of labral
injury; and history of shoulder surgery of any kind. Further exclusion criteria included any
injury to the spinal column, ribs, or upper arm. The control athletes were not eligible to
participate in the study if they had a significant history of participation in any overhead sports
(participation will be defined as 1-2 hours per practice, 3-4 times per week). The inclusion
criteria included the demand that all subjects were male, had participated in their respective sport
for at least the previous 5 years to the time they are tested (control subjects will have no
significant history of overhead sports participation). Using an all male overhead athlete
population for this study helped to control variability between genders.
A power analysis for the sample size revealed that through the use of previous literature13
(mean 26.90+7.08 baseball players and 18.01+9.36 control subjects at 90o humeral elevation for
upward/downward scapular rotation) as well as estimation, an effect size of 1.11 with an alpha
level of .05 (two tailed hypothesis test) will require 15 subjects per group to show a power of .80.
This enabled possible differences to be seen between each respective sport and the control group.
9
2.2 INSTRUMENTATION
2.2.1 Goniometer
Shoulder internal and external rotation range of motion was measured with a standard
goniometer. A small bubble level attached to the stationary arm ensured a horizontal reference.
Unpublished data conducted in the Neuromuscular Research Laboratory compared range of
motion (ROM) measurements using a goniometer to an electromagnetic tracking device39. These
two devices correlated moderately for ER (ICC=0.728 SEM=0.90) and good for IR (ICC=0.854
SEM=1.02). Intrasession reliability and precession were high for both ER (ICC=0.942
SEM=1.72) and IR (ICC=0.985 SEM=1.51) using the goniometer39. The tester can expect
approximately 3o of error for both ER and IR range of motion when using a standard
goniometer39.
2.2.2 MotionMonitor Electromagnetic Tracking Device
Humeral and scapular kinematics were recorded with the MotionMonitor (Innovative
Sports Training, Chicago, IL) 6 degrees of freedom electromagnetic motion analysis
system. The MotionMonitor system consists of a transmitter that creates an electromagnetic
field. Subjects wore receivers that detect this electromagnetic field. Program software
calculated the position and orientation of the receivers (Local Coordinate System, LCS) with
respect to the electromagnetic transmitter and the X,Y, and Z axes of the Global Coordinate
System (GCS) in the transmitter. Using the anatomical landmarks described in Table 1 and the
digitization process described later, calculations to determine the orientation of one body
segment with respect to another are possible. The accuracy in determining position and
orientation is expected to have a root mean square error of .007 meters / 0.27o respectively40.
Measurement of the mean intrasession in-vivo scapular kinematics has been reported to have
10
high reliability (ICC=0.97+0.03) and high precision (0.99+ 0.36o)40. The hardware used for this
study consists of an extended range direct current transmitter and 6 receivers. Data collection
occurs at 100Hz.
2.2.3 Biodex System 3 Isokinetic Dynomometer
Shoulder protraction/retraction and humeral internal/external rotation strength was
measured on a Biodex System 3 isokinetic dynamometer (Biodex Medical, Shirley, NY). The
Biodex dynamometer contains strain gauges and potentiometers that are capable of measuring
torque from many positions13. This isokinetic system has been demonstrated to have high
reliability and validity (ICC=0.99~1.00) for torque and position measurements up to 300o/sec41.
Test-retest reproducibility of shoulder protraction/retraction strength assessment was reported to
be good to excellent (ICC=0.88-0.96) for the protocol used for the current research proposal7.
11
2.3 PROCEDURES
All testing for this research project occurred in the Neuromuscular Research Laboratory
(NMRL) at the University of Pittsburgh. Testing took approximately one hour to complete.
Subjects signed the informed consent form before any testing procedures began. The subjects
wore shorts and removed their shirts during testing procedures.
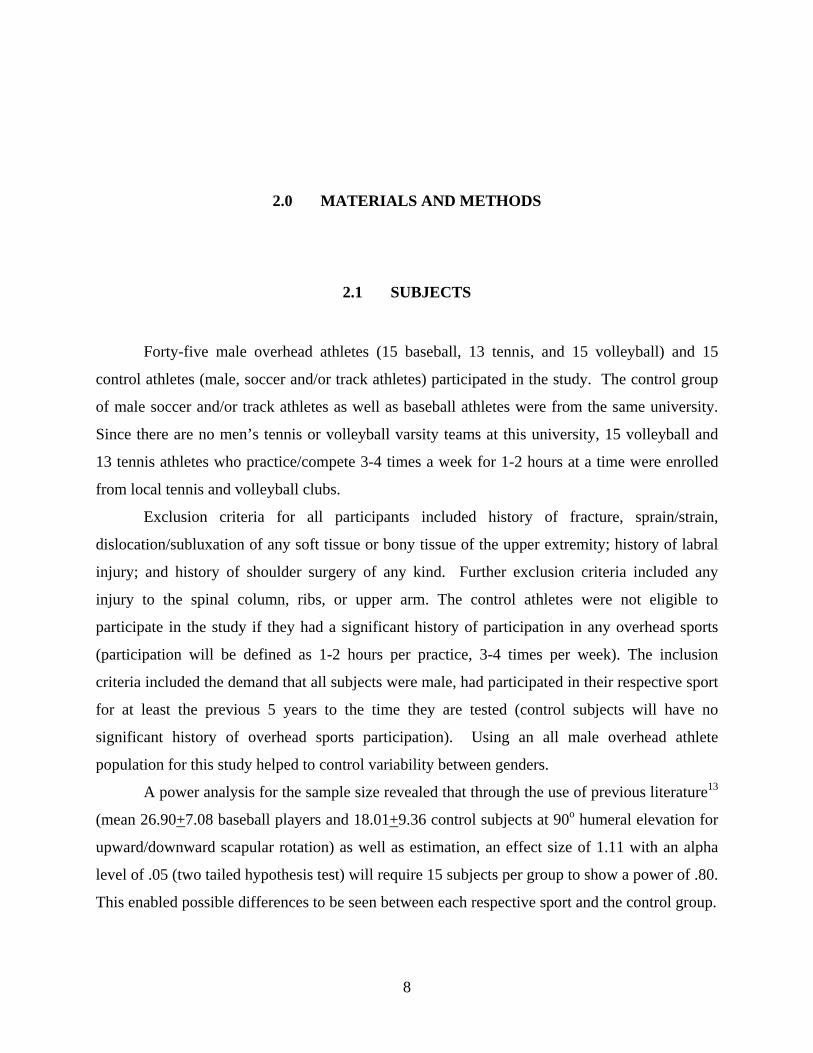
2.3.1 Range of Motion Assessment
Glenohumeral rotation range of motion (ROM) was measured with a standard
goniometer42. The subject laid supine on a treatment table. The tester placed their shoulder in
90o abduction with the elbow slightly off the edge of the table. The first tester provided a
posterior directed, stabilizing force on the anterior aspect of the shoulder (coracoid and distal
clavicle) for both internal rotation and external rotation throughout the ROM while moving the
limb through the range of motion. This stabilization limited scapular motion to only allow
glenohumeral motion43. The second tester measured the range of motion with the goniometer.
The movement arm was aligned with the ulnar styloid. The axis of rotation for the goniometer
was the middle of the olecranon process of the ulna. A small bubble level was affixed to the
stationary arm of the goniometer to ensure a horizontal reference. A towel placed under the
humerus ensured that both the humerus and scapula were in the same plane. All measurements
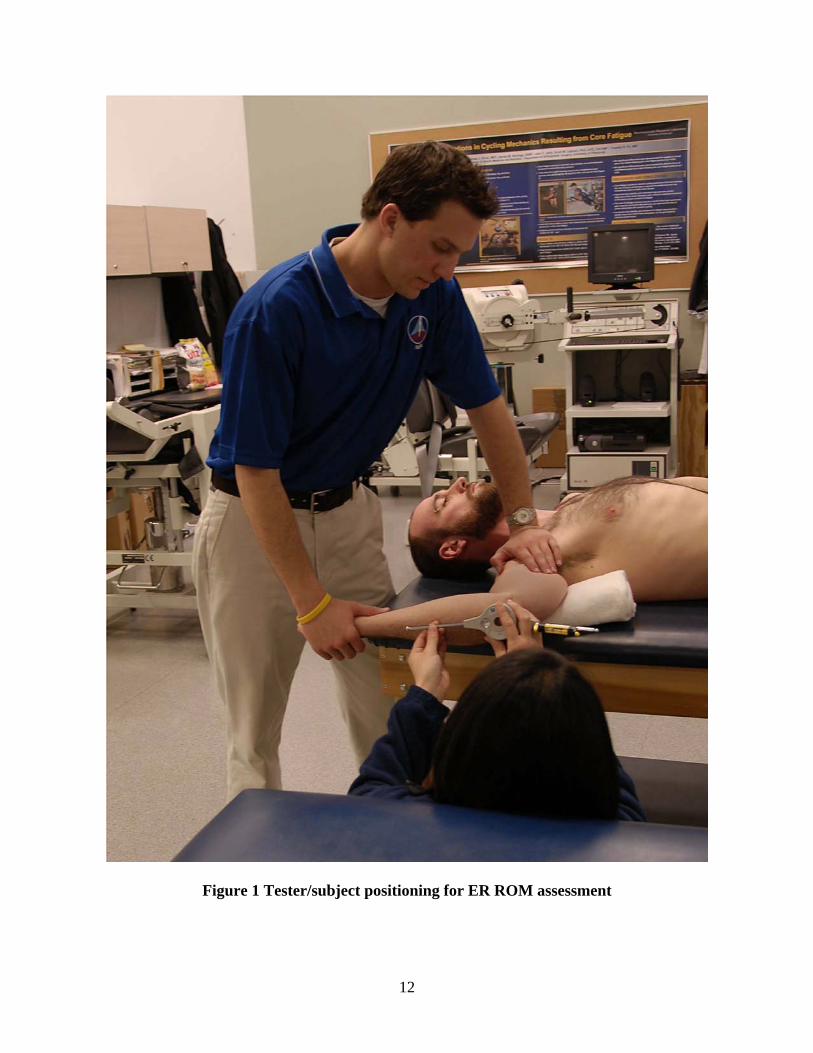
started with the forearm perpendicular to the floor. The first tester provided passive external
rotation (ER) while maintaining stabilization (Figure 1). End range of motion occurs when
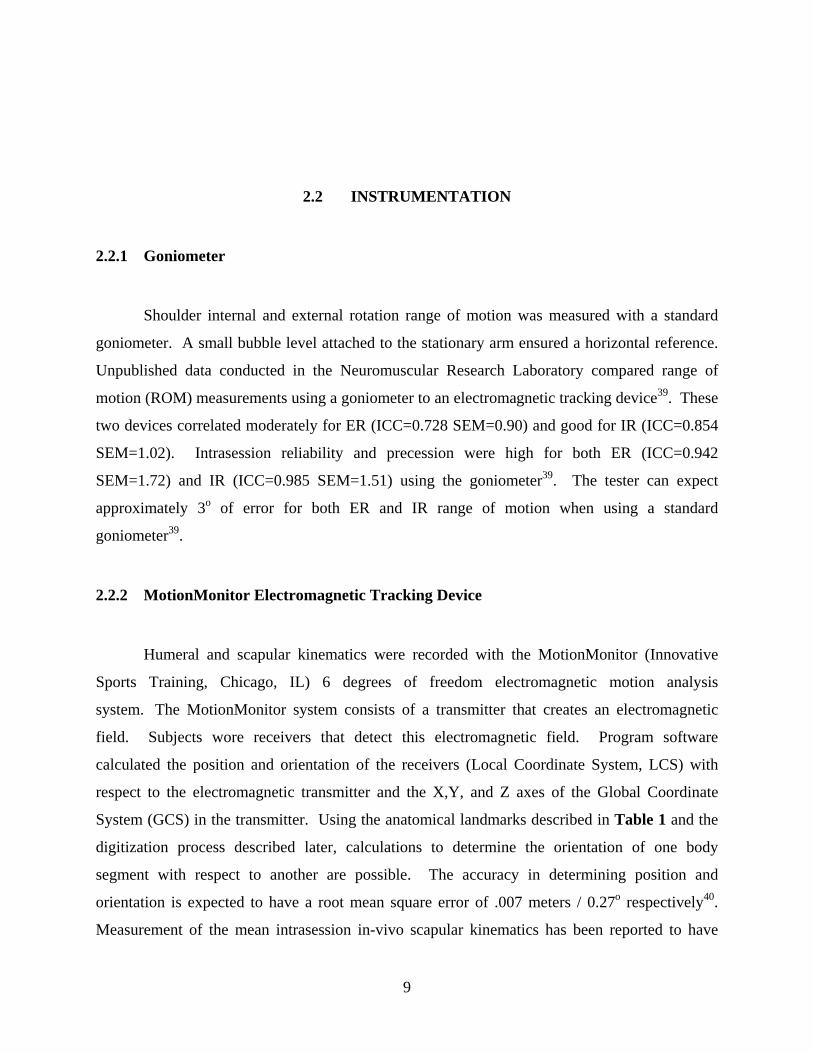
shoulder rotation ceases or scapular motion can no longer be restricted. The same goniometer
landmarks and stabilization techniques as external rotation were used for shoulder internal
rotation data collection. However, passive internal rotation (IR) range of motion was assessed
(Figure 2). The mean of three measurements for each limb was saved for statistical analysis.
Bilateral measurements allow ERG and GIRD to be calculated.
12
Figure 1 Tester/subject positioning for ER ROM assessment

13
Figure 2 Tester/subject positioning for IR ROM assessment
2.3.2 Posterior Shoulder Tightness Assessment (Side –Lying)
Posterior shoulder tightness (PST) was measured following the protocol set forth by
Tyler et al23. The tester used a skin pen to mark the subjects’ medial ulnar epicodyles bilaterally.

14
The subjects lay on the contra-lateral side to that being measured. The subjects were positioned
on the treatment table with their hips and knees at approximately 90o angles to ensure maximum
stability. The tester aligned the subject so that both of the subject’s acromion processes formed a
line perpendicular to the table. For subject comfort, the non-testing arm (arm that is in contact
with the tabletop) was positioned under their head (Figure 3). This subject position helped to
promote neutral flexion, extension and rotation of the spine23.
The tester stood facing the subject. With the subject’s arm in 90o of abduction with
neutral shoulder rotation and elbow relaxed, the tester provided manual scapular stabilization in a
fully retracted position by holding the lateral border of the subjects’ scapula. The tester
performed as many practice measurements as needed in order to maintain the scapula as close as
possible to the retracted, starting position. Once adequate stabilization occurs, the tester brought
the subject’s arm into straight horizontal adduction without allowing humeral rotation. It was
imperative that the subject be able to totally relax and let the researcher have complete control of
the extremity throughout the duration of this assessment. If the subject was not able to relax or
adequate scapular stabilization was not provided throughout the duration of horizontal adduction,
that specific trial was rejected. If neutral rotation of the arm and shoulder was not maintained,
the trial was rejected as well. An additional trial replaced any rejected trials. The second tester
measured the distance from the medial epicondyle of the arm being tested to the tabletop. A
perpendicular measurement to the table was ensured by the use of a metal carpenters’ square.
The shorter side of the square remained against the table (Figure 3). This distance represented
the amount of posterior shoulder mobility. The mean of 3 measurements from each shoulder
allowed the PST difference between dominant and non-dominant limbs to be calculated.

15
Figure 3 Tester/subject positioning for side-lying PST assessment
16
2.3.3 Posterior Shoulder Tightness Assessment (Supine Method)
Posterior shoulder tightness was assessed with the subject lying supine on the treatment
table. The tester used a skin-marking pen to mark the lateral most border of the acromion. This
mark represented the joint center during horizontal adduction of the upper limb. The subject was
instructed to lie on his back comfortably and relax. The first tester placed a standard goniometer
over the superior aspect of the shoulder (superior in relation to anatomical position) with the axis
of rotation centered over the mark on the lateral aspect of the acromion. The second tester
stabilized the subject’s scapula. In order to do this, the subject was asked to raise his shoulder
off the table so the tester could grasp his scapula. Once the tester was able to grasp the scapula,
the tester instructed the subject to relax his shoulder and relax once again on the table. With the
subject totally relaxed, the tester then passively pushed the subject’s scapula into a position of
maximum retraction. Once the scapula was sufficiently stabilized in this retracted position, the
subject’s limb was placed in a position of neutral horizontal adduction/abduction (parallel to the
table and floor). This was the starting position for the range of motion assessment. While the
first tester followed the limb with the movement arm of the goniometer, the second tester
passively horizontally adducted the subject’s limb while maintaining sufficient scapular
stabilization. Slight over pressure was applied to the limb once an end range of motion was
reached. This helped to ensure that this was the anatomical end range of motion and not as result
of the subject contracting their muscles to prevent further motion. This arc of horizontal
adduction range of motion represented the posterior shoulder mobility. It was imperative that the
subject be able to totally relax and let the researcher have complete control of the extremity
throughout the duration of this assessment. If the subject was not able to relax or adequate
scapular stabilization was not provided throughout the duration of horizontal adduction, that
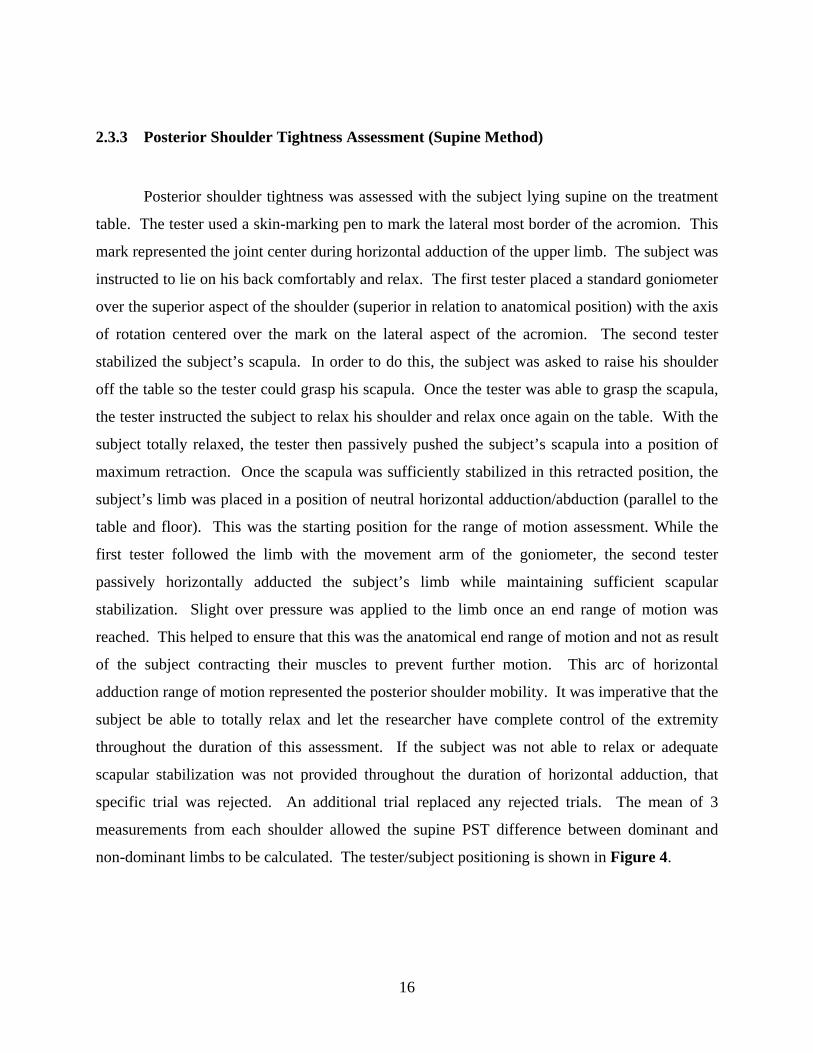
specific trial was rejected. An additional trial replaced any rejected trials. The mean of 3
measurements from each shoulder allowed the supine PST difference between dominant and
non-dominant limbs to be calculated. The tester/subject positioning is shown in Figure 4.
17
Figure 4 Tester/Subject positioning for Supine PST assessment
2.3.4 Scapular Kinematic Assessment
Subjects were fitted with electromagnetic tracking receivers used in conjunction with the
Motion Monitor system to track scapular kinematics. The subjects removed their shirts to make
marker placement more accurate and secure. Electromagnetic receivers were placed on the
seventh cervical vertebrae (C7), bilateral acromia, and one on the mid-shaft of each humerus.
Hypoallergenic tape (The Kendall Co. Mansfield, MA) as well as double-sided adhesive disks
(3M Health Care, St. Paul, Minn.) secured all receivers. The acromion receivers were affixed to
the flat portion of the superior, scapular spine between the acromion angle (AA) and
acromioclavicular joint (AC). The thoracic receiver was placed on the spinous process of the
seventh cervical vertebrae. Humeral receivers were attached by means of a neoprene cuff around
the upper arm at the mid-point of the humerus. The last receiver was attached to a plastic stylus
18
to digitize bony landmarks on the thorax, scapula and humerus. This digitization process allowed
transformation of the receiver data from a global coordinate system (GCS) to an anatomically
based, local coordinate system (LCS)44.
In order to develop a LCS with respect to the GCS of the research lab, each bone/region
involved for the assessment (scapula, humerus, and thorax) must have at least three anatomical
points included in the digitization process. There are only two anatomical landmarks on the
humerus, the medial and lateral epicondyle. In order to produce an orthogonal LCS for the
humerus, the glenohumeral joint center is determined by a least square algorithm for the point of
the humeral head with the least movement during several short arc movements of the humerus45.
Twenty short arc movements were adequate for this calculation. The glenohumeral joint center is
the third anatomical landmark on the humerus and allowed calculations to create a LCS for the
humerus. The anatomical points are presented and in Table 1. The anatomical landmarks that
were used for digitization are the ones suggested by the International Shoulder Group of the
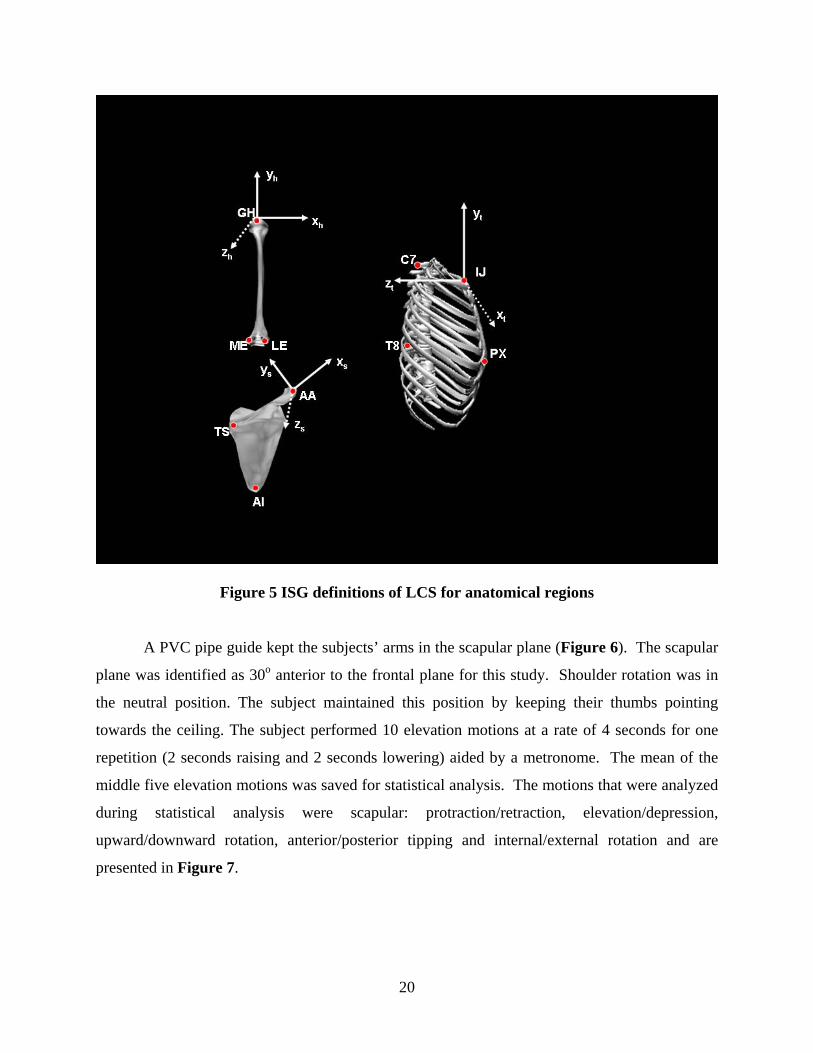
International Society of Biomechanics46. Figure 5 demonstrates the LCS for each respective
body segment. For each anatomical landmark, the point was palpated and then digitized by the
examiner.
19
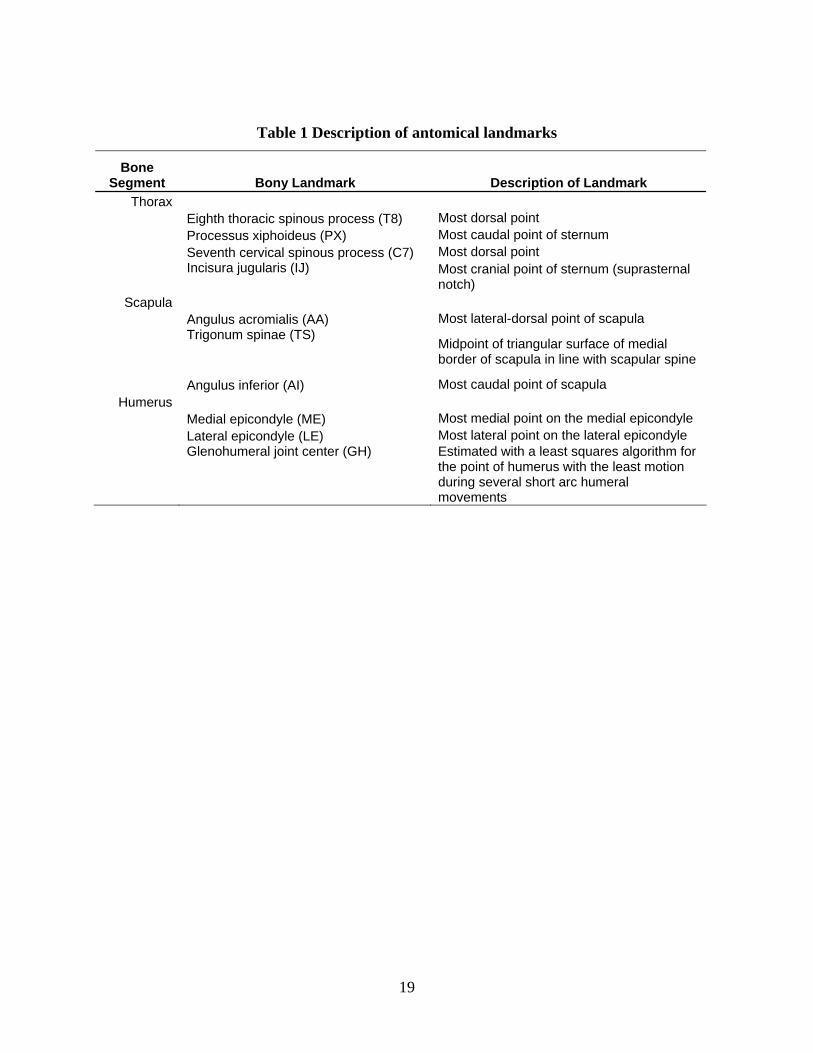
Table 1 Description of antomical landmarks
Bone Segment Bony Landmark Description of Landmark
Thorax Eighth thoracic spinous process (T8) Most dorsal point Processus xiphoideus (PX) Most caudal point of sternum Seventh cervical spinous process (C7) Most dorsal point
Incisura jugularis (IJ) Most cranial point of sternum (suprasternal
notch) Scapula
Angulus acromialis (AA) Most lateral-dorsal point of scapula
Trigonum spinae (TS) Midpoint of triangular surface of medial border of scapula in line with scapular spine
Angulus inferior (AI) Most caudal point of scapula Humerus
Medial epicondyle (ME) Most medial point on the medial epicondyle Lateral epicondyle (LE) Most lateral point on the lateral epicondyle
Glenohumeral joint center (GH) Estimated with a least squares algorithm for the point of humerus with the least motion during several short arc humeral movements
20
Figure 5 ISG definitions of LCS for anatomical regions
A PVC pipe guide kept the subjects’ arms in the scapular plane (Figure 6). The scapular
plane was identified as 30o anterior to the frontal plane for this study. Shoulder rotation was in
the neutral position. The subject maintained this position by keeping their thumbs pointing
towards the ceiling. The subject performed 10 elevation motions at a rate of 4 seconds for one
repetition (2 seconds raising and 2 seconds lowering) aided by a metronome. The mean of the
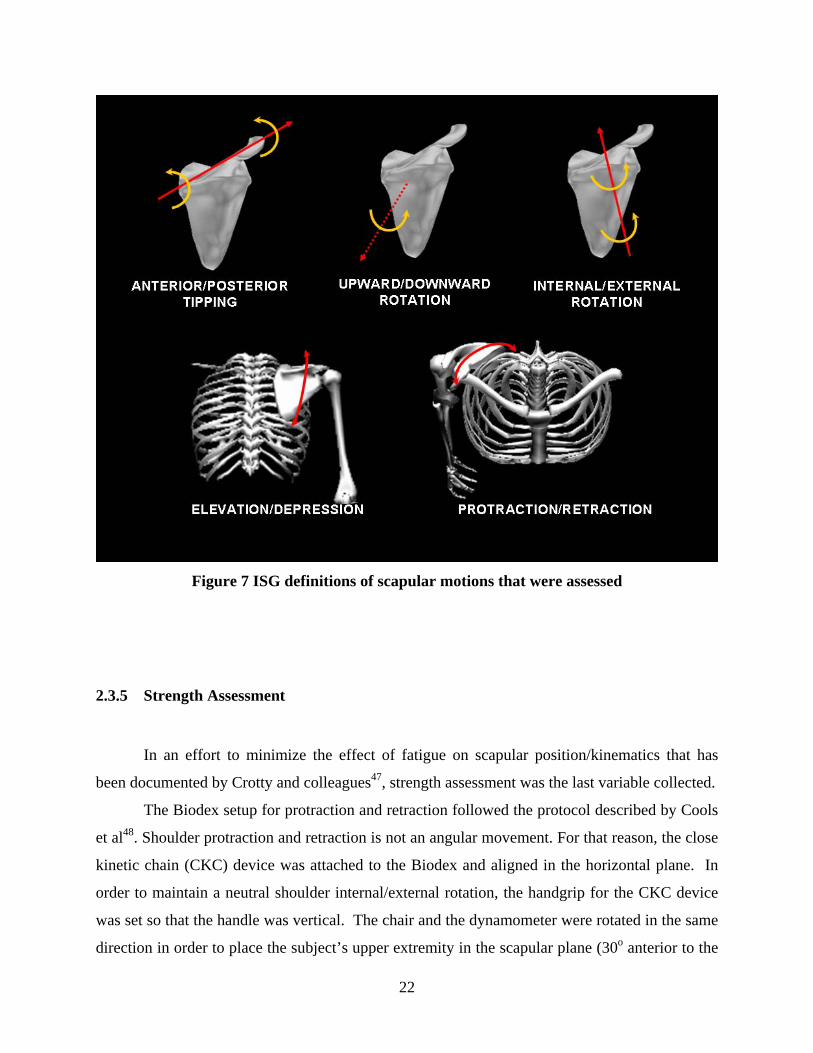
middle five elevation motions was saved for statistical analysis. The motions that were analyzed
during statistical analysis were scapular: protraction/retraction, elevation/depression,
upward/downward rotation, anterior/posterior tipping and internal/external rotation and are
presented in Figure 7.

21
Figure 6 Plastic guide tubes to keep elevation in scapular plane
22
Figure 7 ISG definitions of scapular motions that were assessed
2.3.5 Strength Assessment
In an effort to minimize the effect of fatigue on scapular position/kinematics that has
been documented by Crotty and colleagues47, strength assessment was the last variable collected.
The Biodex setup for protraction and retraction followed the protocol described by Cools
et al48. Shoulder protraction and retraction is not an angular movement. For that reason, the close
kinetic chain (CKC) device was attached to the Biodex and aligned in the horizontal plane. In
order to maintain a neutral shoulder internal/external rotation, the handgrip for the CKC device
was set so that the handle was vertical. The chair and the dynamometer were rotated in the same
direction in order to place the subject’s upper extremity in the scapular plane (30o anterior to the

23
frontal plane). The chair was rotated to 15o and the dynamometer to 45o. Chest and waist straps
helped to secure the subject in the chair. A handle was also available for the subject to hold onto
with the non-testing hand for added stability (Figure 8). The first test speed was set at 12.2 cm/s
(60o/s), followed by the faster speed of 36.6 cm/s (180o/sec). The test range of motion was set by
having the subject perform a protraction and retraction motion throughout his maximum range of
motion. Gravity correction was not calculated because this test will occur in the horizontal plane
and is a linear motion. Since scapular protraction and retraction are not common motions, the
tester instructed the subject on the movements. Five repetitions at minimal effort followed by
three repetitions at the test speed allowed a familiarization period at each test speed.
Figure 8 Biodex setup for shoulder protraction/retraction strength assessment
The subject performed five repetitions at 12.2 cm/s followed by ten repetitions at
36.6cm/s. There was a ten second rest period between the test speeds. There was no verbal
24
encouragement during the data collection. For the purposes of this study, only concentric data
was collected and analyzed for protraction and retraction strength. Data collection occurred
bilaterally. The protraction/retraction strength ratio at each speed and average peak torque
normalized to bodyweight for protraction and retraction at each speed was saved for statistical
analysis.
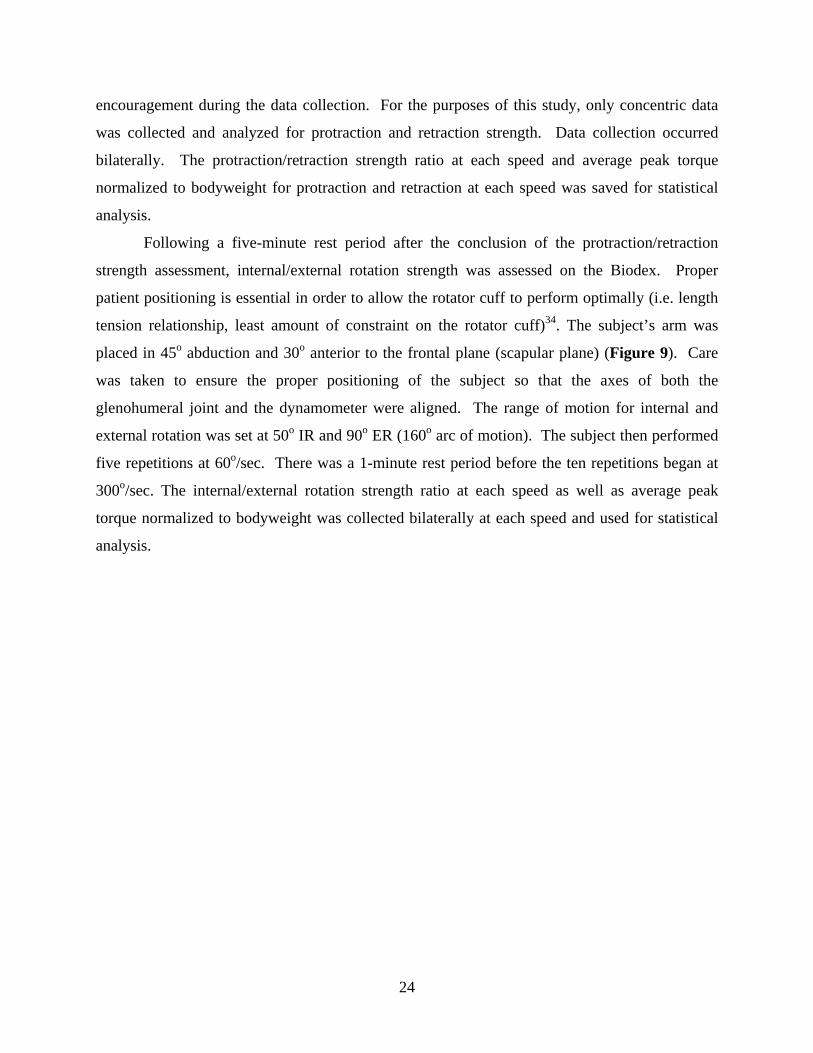
Following a five-minute rest period after the conclusion of the protraction/retraction
strength assessment, internal/external rotation strength was assessed on the Biodex. Proper
patient positioning is essential in order to allow the rotator cuff to perform optimally (i.e. length
tension relationship, least amount of constraint on the rotator cuff)34. The subject’s arm was
placed in 45o abduction and 30o anterior to the frontal plane (scapular plane) (Figure 9). Care
was taken to ensure the proper positioning of the subject so that the axes of both the
glenohumeral joint and the dynamometer were aligned. The range of motion for internal and
external rotation was set at 50o IR and 90o ER (160o arc of motion). The subject then performed
five repetitions at 60o/sec. There was a 1-minute rest period before the ten repetitions began at
300o/sec. The internal/external rotation strength ratio at each speed as well as average peak
torque normalized to bodyweight was collected bilaterally at each speed and used for statistical
analysis.

25
Figure 9 Biodex setup for shoulder IR/ER strength assessment
26
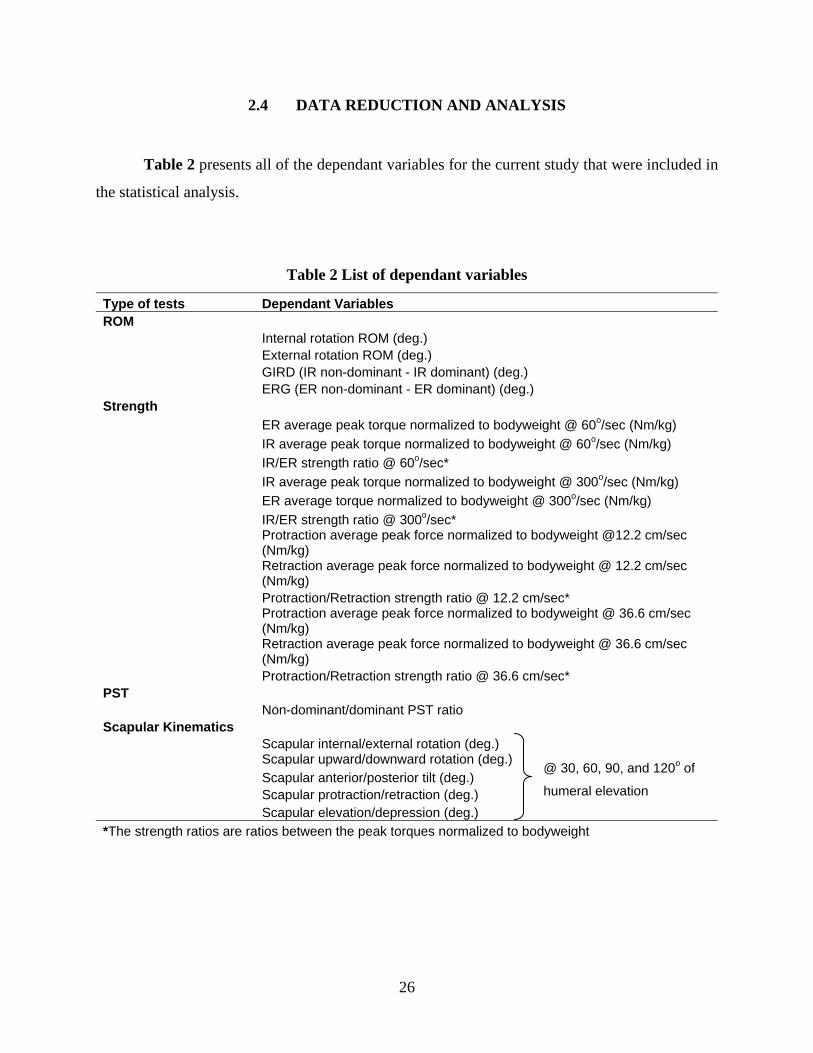
2.4 DATA REDUCTION AND ANALYSIS
Table 2 presents all of the dependant variables for the current study that were included in
the statistical analysis.
Table 2 List of dependant variables
Type of tests Dependant Variables ROM Internal rotation ROM (deg.) External rotation ROM (deg.) GIRD (IR non-dominant - IR dominant) (deg.) ERG (ER non-dominant - ER dominant) (deg.) Strength ER average peak torque normalized to bodyweight @ 60o/sec (Nm/kg) IR average peak torque normalized to bodyweight @ 60o/sec (Nm/kg) IR/ER strength ratio @ 60o/sec* IR average peak torque normalized to bodyweight @ 300o/sec (Nm/kg) ER average torque normalized to bodyweight @ 300o/sec (Nm/kg) IR/ER strength ratio @ 300o/sec*
Protraction average peak force normalized to bodyweight @12.2 cm/sec (Nm/kg)
Retraction average peak force normalized to bodyweight @ 12.2 cm/sec (Nm/kg)
Protraction/Retraction strength ratio @ 12.2 cm/sec*
Protraction average peak force normalized to bodyweight @ 36.6 cm/sec (Nm/kg)
Retraction average peak force normalized to bodyweight @ 36.6 cm/sec (Nm/kg)
Protraction/Retraction strength ratio @ 36.6 cm/sec* PST Non-dominant/dominant PST ratio Scapular Kinematics Scapular internal/external rotation (deg.) Scapular upward/downward rotation (deg.) Scapular anterior/posterior tilt (deg.) Scapular protraction/retraction (deg.) Scapular elevation/depression (deg.) *The strength ratios are ratios between the peak torques normalized to bodyweight
@ 30, 60, 90, and 120o of
humeral elevation
27
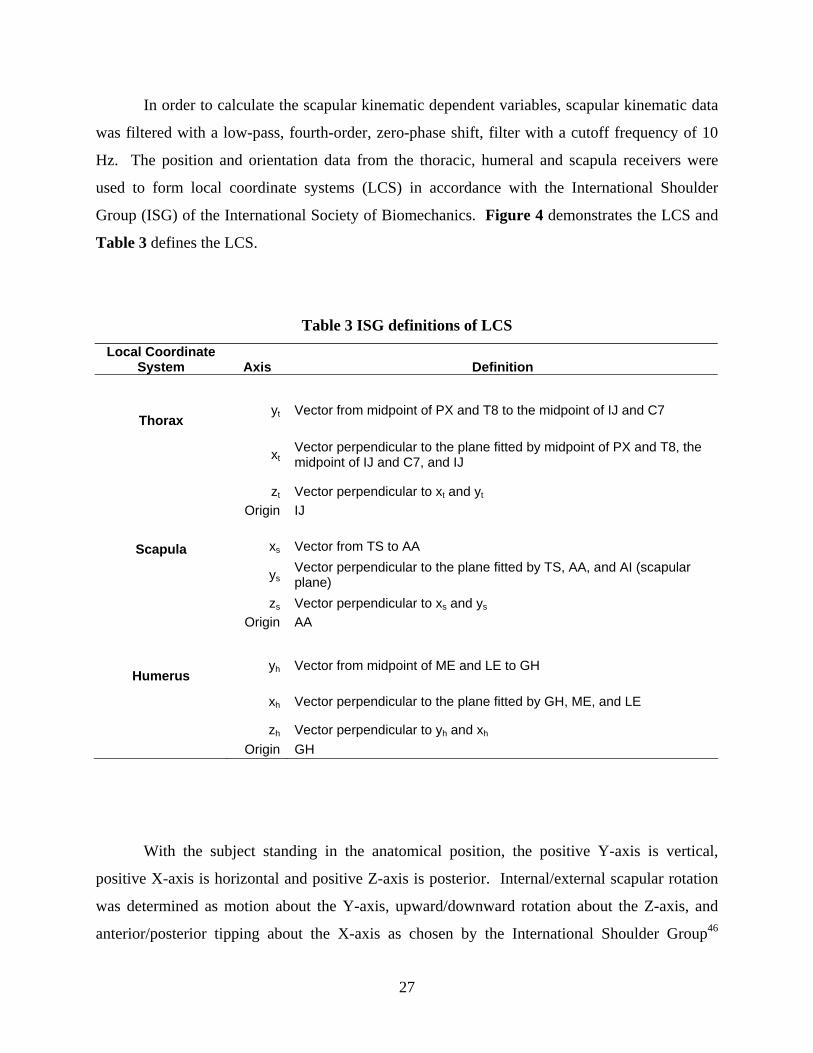
In order to calculate the scapular kinematic dependent variables, scapular kinematic data
was filtered with a low-pass, fourth-order, zero-phase shift, filter with a cutoff frequency of 10
Hz. The position and orientation data from the thoracic, humeral and scapula receivers were
used to form local coordinate systems (LCS) in accordance with the International Shoulder
Group (ISG) of the International Society of Biomechanics. Figure 4 demonstrates the LCS and
Table 3 defines the LCS.
Table 3 ISG definitions of LCS Local Coordinate
System Axis Definition
Thorax yt Vector from midpoint of PX and T8 to the midpoint of IJ and C7
xt
Vector perpendicular to the plane fitted by midpoint of PX and T8, the midpoint of IJ and C7, and IJ
zt Vector perpendicular to xt and yt Origin IJ
Scapula xs Vector from TS to AA
ys
Vector perpendicular to the plane fitted by TS, AA, and AI (scapular plane)
zs Vector perpendicular to xs and ys Origin AA
Humerus yh Vector from midpoint of ME and LE to GH
xh Vector perpendicular to the plane fitted by GH, ME, and LE
zh Vector perpendicular to yh and xh Origin GH
With the subject standing in the anatomical position, the positive Y-axis is vertical,
positive X-axis is horizontal and positive Z-axis is posterior. Internal/external scapular rotation
was determined as motion about the Y-axis, upward/downward rotation about the Z-axis, and
anterior/posterior tipping about the X-axis as chosen by the International Shoulder Group46
28
(Figure 5). Scapula and humeral orientation with respect to the thorax was determined by Euler
angle decompositions. Rotation sequences of Euler angles were chosen based on standards set
by the International Shoulder Group46. The clavicle attaches the scapula to the thorax. Thus, the
position of the scapula can be described as the orientation of the vector from the jugular notch
(IJ) to the acromion (AA) with respect to the thorax LCS since the clavicle is a rigid body with a
fixed length. This vector closely relates to the anatomical orientation of the clavicle. Scapular
protraction and retraction angles were calculated as the angle between the clavicular vector (IJ to
AA) and the frontal plane; scapular elevation/depression angles used the same vector with
respect to the transverse plane of the thorax. Scapular position and orientation at the different
humeral elevation angles (0o, 30o, 60o, 90o, 120o) were recorded. Research has shown that above
120o humeral elevation, data tends to be inaccurate49. Scapular kinematic variables were
calculated and processed using Matlab 12 (The MathWorks, Inc., Natick, Mass.). The mean for
the variables that Matlab produced was entered into SPSS 13.0 (SPSS Inc, Chicago, Ill.) for
statistical analysis.
Subject demographics, PST difference, and the amount of GIRD and ERG were analyzed
for between group differences with a one-way ANOVA. A one-within, one-between analysis of
variance (two-way ANOVA) was performed on range of motion, total rotation range of motion,
supine and side-lying PST assessment data with a between factor of group and within factor of
limb. Strength variables were analyzed with a one-within, one-between ANOVA at each speed
to compare between group and limb for both the slow speed (60°/sec for internal/external
rotation and 12.2 cm/sec for protraction and retraction) and fast speed (300°/sec for
internal/external rotation and 36.6 cm/sec for protraction and retraction). A one-within, one-
between (two-way) ANOVA was run on scapular kinematic data at each angle for each variable
(separate ANOVA for upward/downward rotation at 0°, separate ANOVA for upward/downward
rotation at 30°, etc.) to compare between group and limb at each humeral elevation angle.
Scapular kinematic data and strength variables had a between factor of group and within factor
of limb. A Bonferroni minimally significant difference (MSD) showed where any significant
differences arose for the one-within, one between ANOVA. All statistical analyses were
performed in SPSS Version 13.0 (SPSS Science Inc, Chicago, Ill.). The level of significance was
set at an alpha level of 0.05 a priori.

29
3.0 RESULTS
The demographics for the subjects are presented in TABLE 4. Fifty-eight athletes
participated in the current study (fifteen baseball pitchers, fifteen volleyball athletes, fifteen
control athletes (track and/or soccer athletes), and thirteen tennis athletes). All subjects were
college-aged, male athletes who were symptom free from any shoulder pathology with no prior
history of a diagnosed pathology in the shoulder or upper extremity. Statistical analysis showed
that there was a significant interaction between sport and height (p < 0.001). Volleyball athletes
were taller than baseball pitchers (p = 0.016), tennis athletes (p < 0.001), and control athletes
(p < 0.001). There was also a significant interaction between sport and weight (p < 0.001).
Control athletes were lighter than baseball pitchers (p = 0.001) and volleyball athletes (p =
0.006).
Table 4 Subject Demographics
Baseball Tennis Volleyball Control (n=15) (n=13) (n=15) (n=15) Mean ± SD Mean ± SD Mean ± SD Mean ± SD
Height (cm) 181.54 7.08 177.38 5.04 188.40 2.76 177.67 5.30Mass (kg) 88.05 14.78 75.75 6.64 82.58 4.58 72.43 8.57
Age (years) 20.00 1.73 21.20 1.10 21.33 1.51 20.71 1.25
30
3.1 RANGE OF MOTION ASSESSMENT
3.1.1 Shoulder Internal Rotation Range of Motion
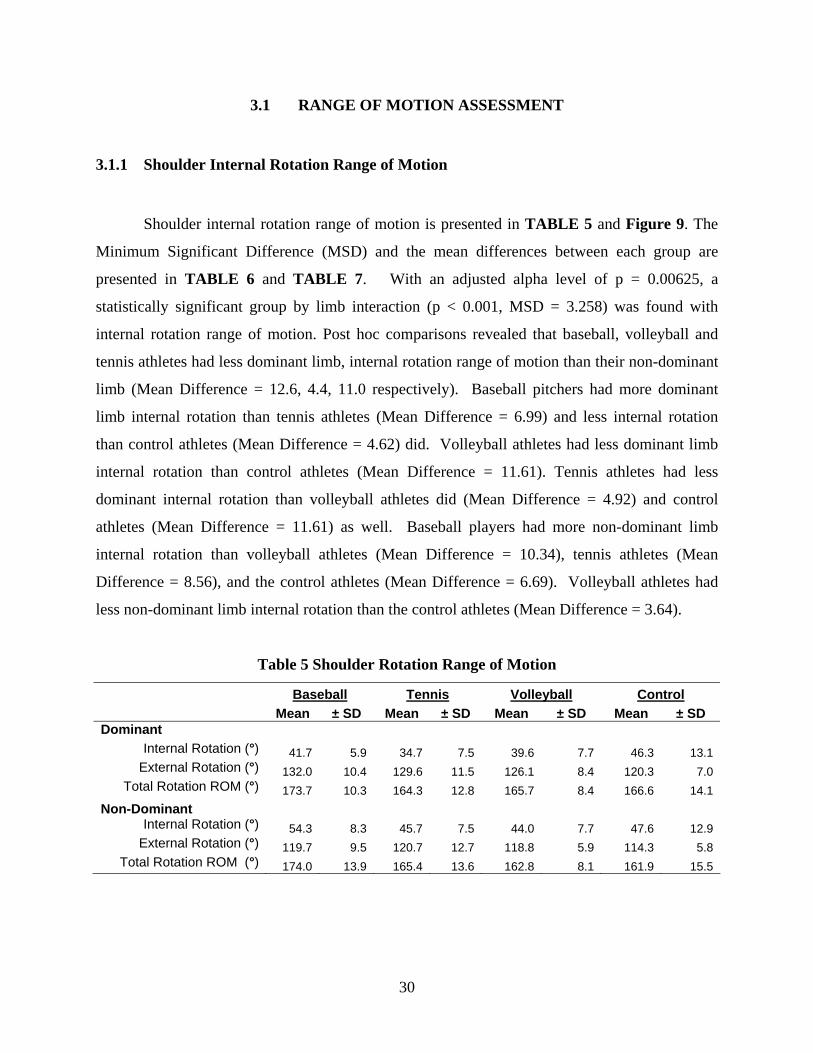
Shoulder internal rotation range of motion is presented in TABLE 5 and Figure 9. The
Minimum Significant Difference (MSD) and the mean differences between each group are
presented in TABLE 6 and TABLE 7. With an adjusted alpha level of p = 0.00625, a
statistically significant group by limb interaction (p < 0.001, MSD = 3.258) was found with
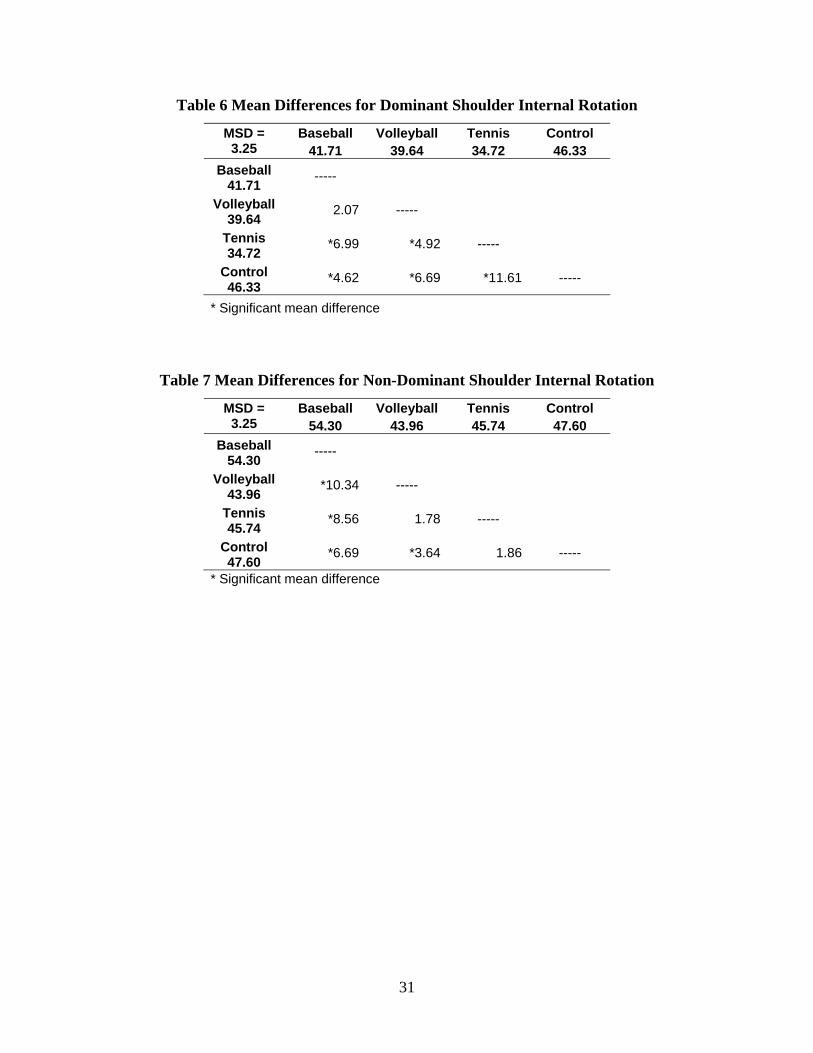
internal rotation range of motion. Post hoc comparisons revealed that baseball, volleyball and
tennis athletes had less dominant limb, internal rotation range of motion than their non-dominant
limb (Mean Difference = 12.6, 4.4, 11.0 respectively). Baseball pitchers had more dominant
limb internal rotation than tennis athletes (Mean Difference = 6.99) and less internal rotation
than control athletes (Mean Difference = 4.62) did. Volleyball athletes had less dominant limb
internal rotation than control athletes (Mean Difference = 11.61). Tennis athletes had less
dominant internal rotation than volleyball athletes did (Mean Difference = 4.92) and control
athletes (Mean Difference = 11.61) as well. Baseball players had more non-dominant limb
internal rotation than volleyball athletes (Mean Difference = 10.34), tennis athletes (Mean
Difference = 8.56), and the control athletes (Mean Difference = 6.69). Volleyball athletes had
less non-dominant limb internal rotation than the control athletes (Mean Difference = 3.64).
Table 5 Shoulder Rotation Range of Motion
Baseball Tennis Volleyball Control Mean ± SD Mean ± SD Mean ± SD Mean ± SD Dominant
Internal Rotation (°) 41.7 5.9 34.7 7.5 39.6 7.7 46.3 13.1 External Rotation (°) 132.0 10.4 129.6 11.5 126.1 8.4 120.3 7.0
Total Rotation ROM (°) 173.7 10.3 164.3 12.8 165.7 8.4 166.6 14.1 Non-Dominant
Internal Rotation (°) 54.3 8.3 45.7 7.5 44.0 7.7 47.6 12.9 External Rotation (°) 119.7 9.5 120.7 12.7 118.8 5.9 114.3 5.8
Total Rotation ROM (°) 174.0 13.9 165.4 13.6 162.8 8.1 161.9 15.5
31
Table 6 Mean Differences for Dominant Shoulder Internal Rotation
Baseball Volleyball Tennis Control MSD = 3.25 41.71 39.64 34.72 46.33
Baseball 41.71
-----
Volleyball 39.64
2.07 -----
Tennis 34.72
*6.99 *4.92 -----
Control 46.33
*4.62 *6.69 *11.61 -----
* Significant mean difference
Table 7 Mean Differences for Non-Dominant Shoulder Internal Rotation
Baseball Volleyball Tennis Control MSD = 3.25 54.30 43.96 45.74 47.60
Baseball 54.30
-----
Volleyball 43.96
*10.34 -----
Tennis 45.74
*8.56 1.78 -----
Control 47.60
*6.69 *3.64 1.86 -----
* Significant mean difference

32
30.0
35.0
40.0
45.0
50.0
55.0
60.0
65.0
Baseball Tennis Volleyball Control
Inte
rnal
Rot
atio
n R
ange
of M
otio
n (d
egre
es)
DominantNon-Dominant
Figure 10 Shoulder Internal Rotation Range of Motion
3.1.2 Shoulder External Rotation Range of Motion
External rotation range of motion results are presented in TABLE 5. No statically
significant group by limb interaction was found (p = 0.103) for external rotation range of motion.
33
3.1.3 Total Shoulder Rotation Range of Motion
The results for total rotation range of motion are presented in TABLE 5. No statistically
significant differences were present with group by limb interactions (p = 0.250) for total
rotational range of motion.
3.1.4 Glenohumeral Internal Rotation Deficit (GIRD) and External Rotation Gain (ERG)
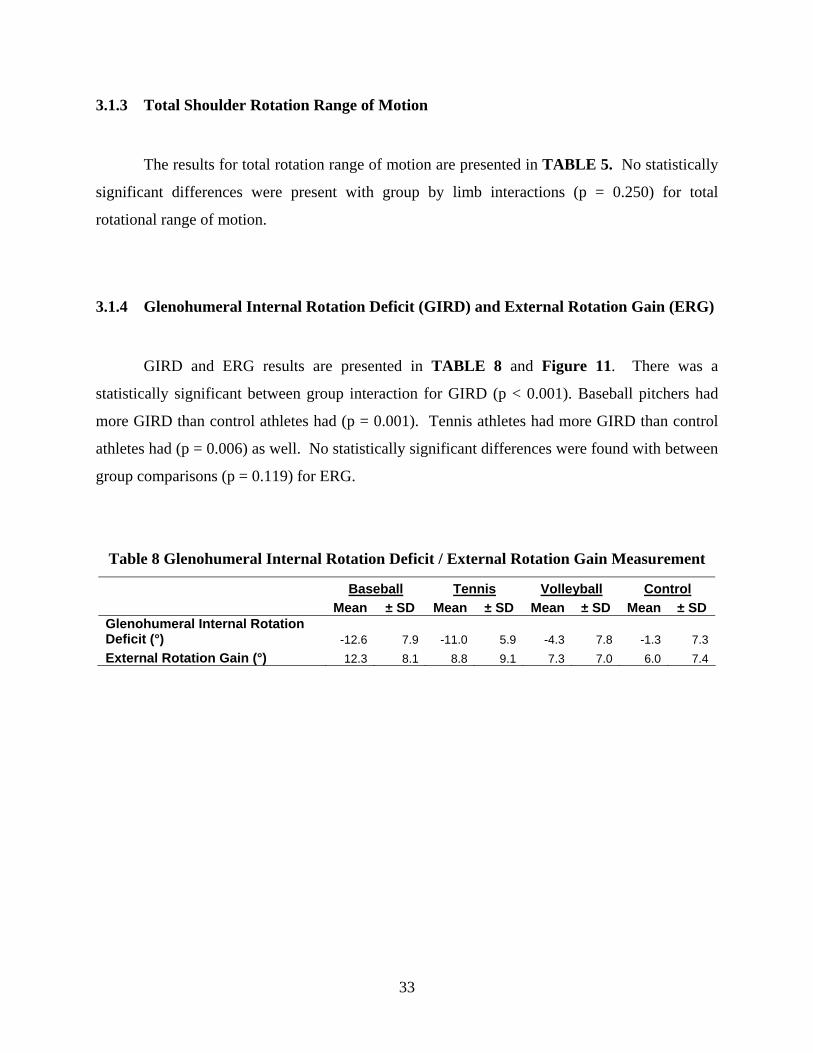
GIRD and ERG results are presented in TABLE 8 and Figure 11. There was a
statistically significant between group interaction for GIRD (p < 0.001). Baseball pitchers had
more GIRD than control athletes had (p = 0.001). Tennis athletes had more GIRD than control
athletes had (p = 0.006) as well. No statistically significant differences were found with between
group comparisons (p = 0.119) for ERG.
Table 8 Glenohumeral Internal Rotation Deficit / External Rotation Gain Measurement
Baseball Tennis Volleyball Control Mean ± SD Mean ± SD Mean ± SD Mean ± SD Glenohumeral Internal Rotation Deficit (°) -12.6 7.9 -11.0 5.9 -4.3 7.8 -1.3 7.3 External Rotation Gain (°) 12.3 8.1 8.8 9.1 7.3 7.0 6.0 7.4

34
VolleyballTennisBaseball Control
-25.0
-20.0
-15.0
-10.0
-5.0
0.0
Gle
nohh
umer
al In
tern
al R
otat
ion
Def
icit
(deg
rees
)
p = 0.001
p = 0.006
Figure 11 Glenohumeral Internal Rotation Deficit
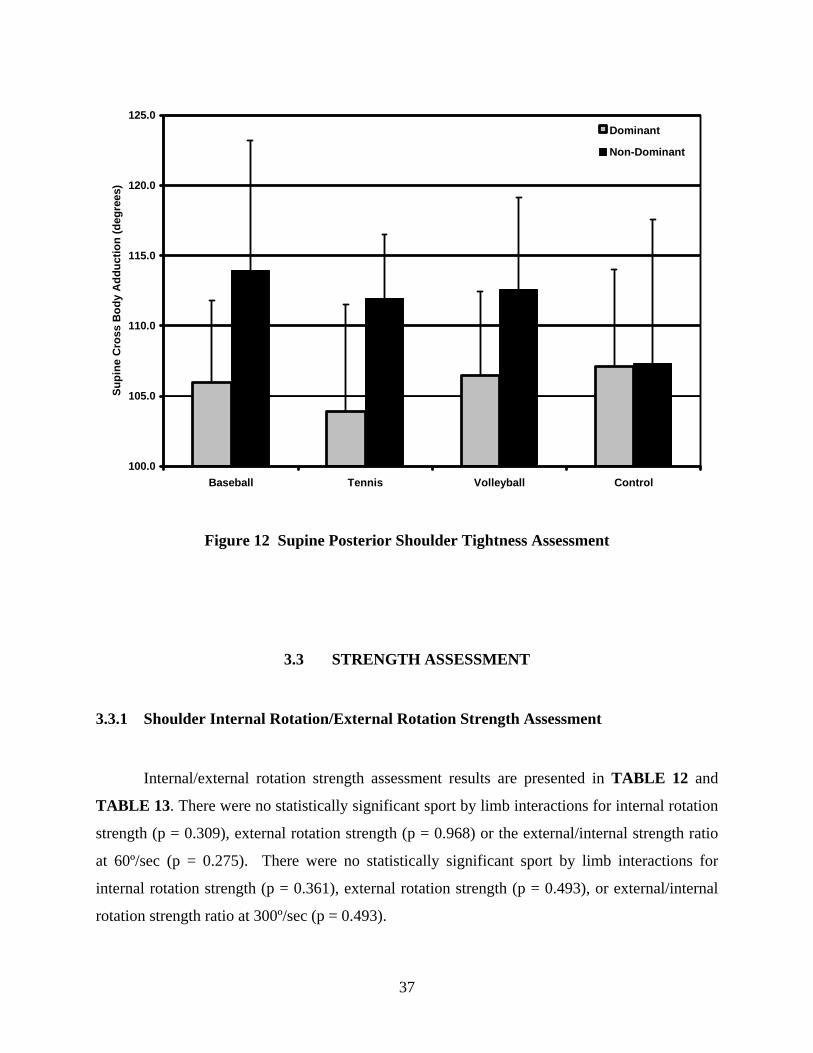
3.2 POSTERIOR SHOULDER TIGHTNESS
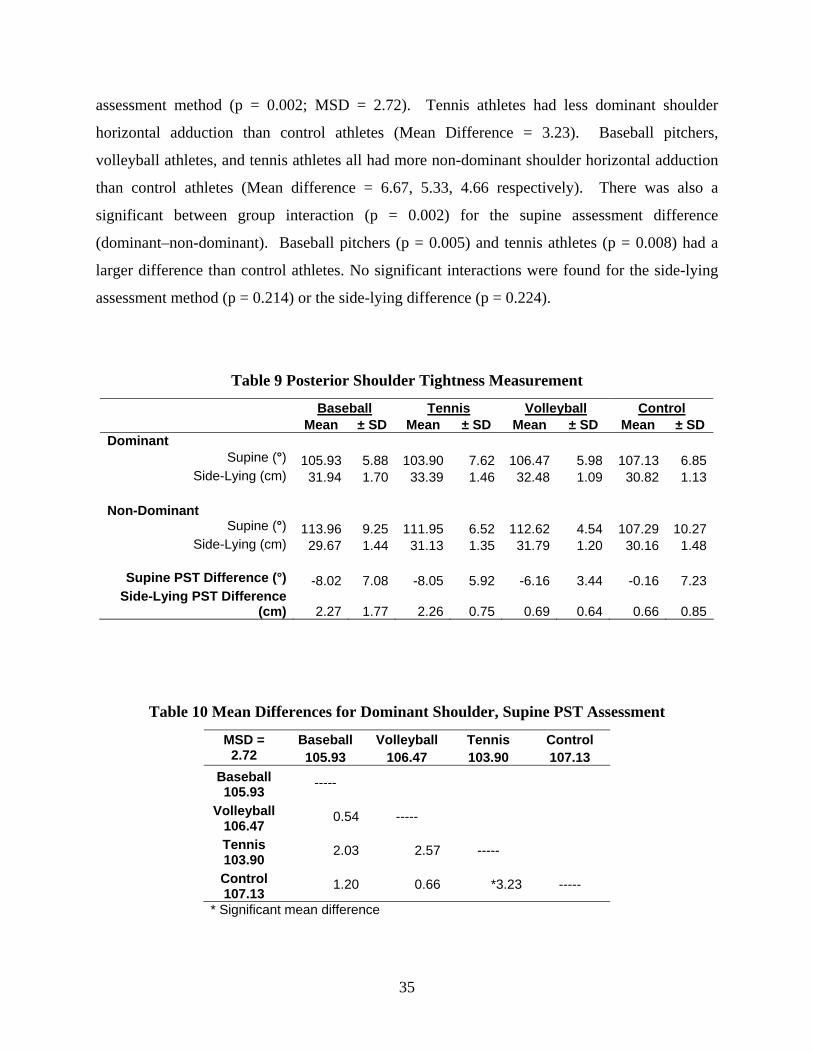
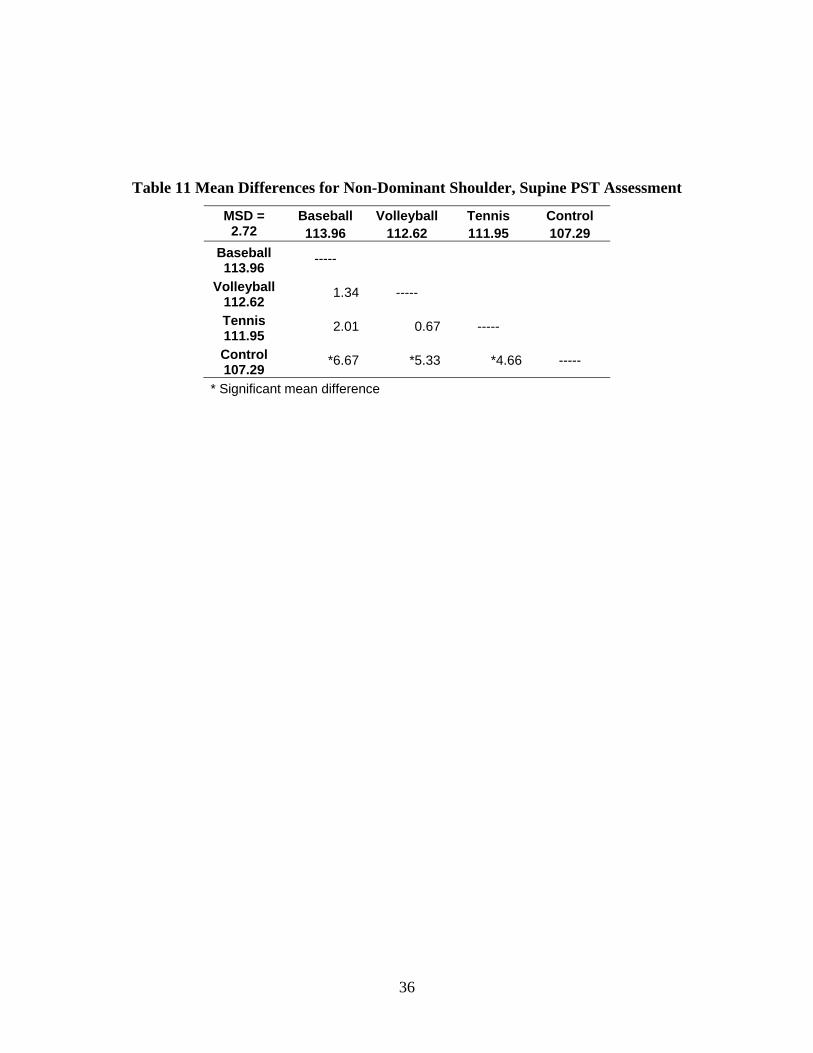
Posterior shoulder tightness (PST) results are presented in TABLES 9, 10, 11, Figure 12.
The mean differences for dominant and non-dominant PST assessment with the supine method
are presented in TABLE 10 and TABLE 11. Post Hoc comparisons revealed that baseball
pitchers, volleyball athletes, and tennis athletes all had more between limb difference in
horizontal adduction than control athletes with the supine method of assessment (Mean
Difference = 8.03, 6.15, 8.05 respectively). With an adjusted alpha level of p = 0.00625, a
significant group by limb interaction was found for posterior shoulder tightness with the supine
35
assessment method (p = 0.002; MSD = 2.72). Tennis athletes had less dominant shoulder
horizontal adduction than control athletes (Mean Difference = 3.23). Baseball pitchers,
volleyball athletes, and tennis athletes all had more non-dominant shoulder horizontal adduction
than control athletes (Mean difference = 6.67, 5.33, 4.66 respectively). There was also a
significant between group interaction (p = 0.002) for the supine assessment difference
(dominant–non-dominant). Baseball pitchers (p = 0.005) and tennis athletes (p = 0.008) had a
larger difference than control athletes. No significant interactions were found for the side-lying
assessment method (p = 0.214) or the side-lying difference (p = 0.224).
Table 9 Posterior Shoulder Tightness Measurement
Baseball Tennis Volleyball Control Mean ± SD Mean ± SD Mean ± SD Mean ± SD Dominant
Supine (°) 105.93 5.88 103.90 7.62 106.47 5.98 107.13 6.85Side-Lying (cm) 31.94 1.70 33.39 1.46 32.48 1.09 30.82 1.13
Non-Dominant
Supine (°) 113.96 9.25 111.95 6.52 112.62 4.54 107.29 10.27Side-Lying (cm) 29.67 1.44 31.13 1.35 31.79 1.20 30.16 1.48
Supine PST Difference (°) -8.02 7.08 -8.05 5.92 -6.16 3.44 -0.16 7.23
Side-Lying PST Difference (cm) 2.27 1.77 2.26 0.75 0.69 0.64 0.66 0.85
Table 10 Mean Differences for Dominant Shoulder, Supine PST Assessment
Baseball Volleyball Tennis Control MSD = 2.72 105.93 106.47 103.90 107.13
Baseball 105.93
-----
Volleyball 106.47
0.54 -----
Tennis 103.90
2.03 2.57 -----
Control 107.13
1.20 0.66 *3.23 -----
* Significant mean difference
36
Table 11 Mean Differences for Non-Dominant Shoulder, Supine PST Assessment
Baseball Volleyball Tennis Control MSD = 2.72 113.96 112.62 111.95 107.29
Baseball 113.96
-----
Volleyball 112.62
1.34 -----
Tennis 111.95
2.01 0.67 -----
Control 107.29
*6.67 *5.33 *4.66 -----
* Significant mean difference
37
100.0
105.0
110.0
115.0
120.0
125.0
Baseball Tennis Volleyball Control
Supi
ne C
ross
Bod
y A
dduc
tion
(deg
rees
)Dominant
Non-Dominant
Figure 12 Supine Posterior Shoulder Tightness Assessment
3.3 STRENGTH ASSESSMENT
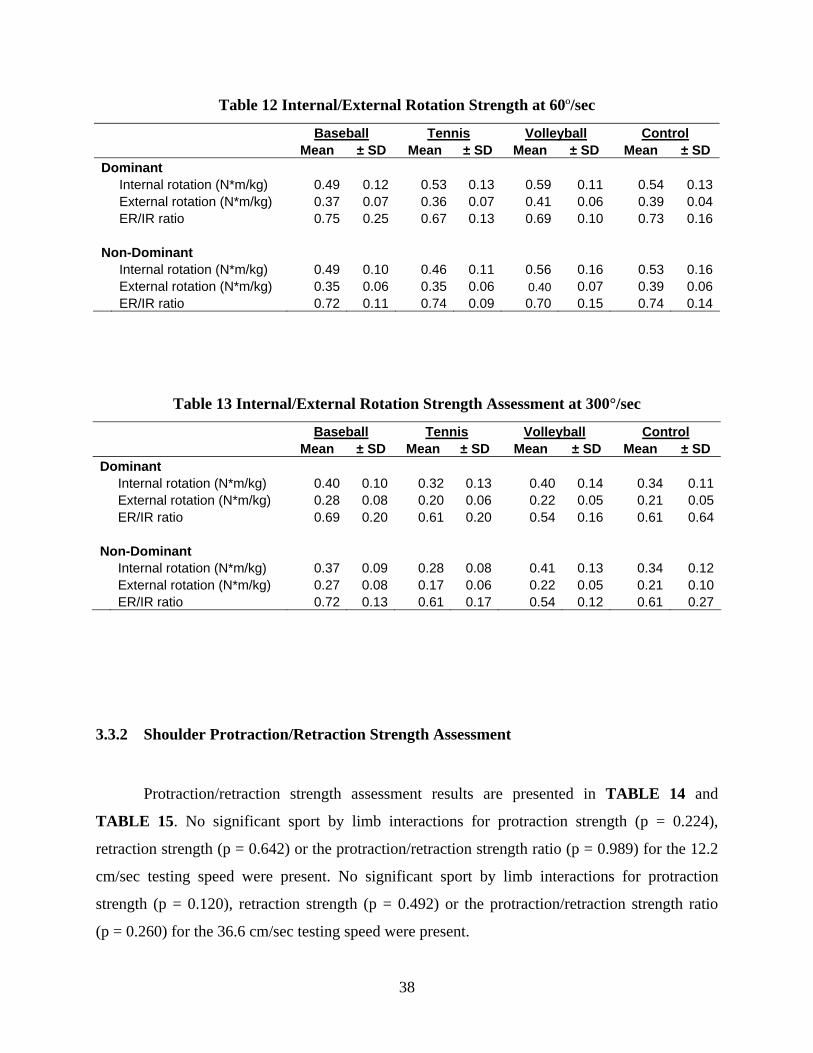
3.3.1 Shoulder Internal Rotation/External Rotation Strength Assessment
Internal/external rotation strength assessment results are presented in TABLE 12 and
TABLE 13. There were no statistically significant sport by limb interactions for internal rotation
strength (p = 0.309), external rotation strength (p = 0.968) or the external/internal strength ratio
at 60º/sec (p = 0.275). There were no statistically significant sport by limb interactions for
internal rotation strength (p = 0.361), external rotation strength (p = 0.493), or external/internal
rotation strength ratio at 300º/sec (p = 0.493).
38
Table 12 Internal/External Rotation Strength at 60º/sec
Baseball Tennis Volleyball Control Mean ± SD Mean ± SD Mean ± SD Mean ± SD Dominant Internal rotation (N*m/kg) 0.49 0.12 0.53 0.13 0.59 0.11 0.54 0.13 External rotation (N*m/kg) 0.37 0.07 0.36 0.07 0.41 0.06 0.39 0.04 ER/IR ratio 0.75 0.25 0.67 0.13 0.69 0.10 0.73 0.16 Non-Dominant Internal rotation (N*m/kg) 0.49 0.10 0.46 0.11 0.56 0.16 0.53 0.16 External rotation (N*m/kg) 0.35 0.06 0.35 0.06 0.40 0.07 0.39 0.06 ER/IR ratio 0.72 0.11 0.74 0.09 0.70 0.15 0.74 0.14
Table 13 Internal/External Rotation Strength Assessment at 300°/sec
Baseball Tennis Volleyball Control Mean ± SD Mean ± SD Mean ± SD Mean ± SD Dominant Internal rotation (N*m/kg) 0.40 0.10 0.32 0.13 0.40 0.14 0.34 0.11 External rotation (N*m/kg) 0.28 0.08 0.20 0.06 0.22 0.05 0.21 0.05 ER/IR ratio 0.69 0.20 0.61 0.20 0.54 0.16 0.61 0.64 Non-Dominant Internal rotation (N*m/kg) 0.37 0.09 0.28 0.08 0.41 0.13 0.34 0.12 External rotation (N*m/kg) 0.27 0.08 0.17 0.06 0.22 0.05 0.21 0.10 ER/IR ratio 0.72 0.13 0.61 0.17 0.54 0.12 0.61 0.27
3.3.2 Shoulder Protraction/Retraction Strength Assessment
Protraction/retraction strength assessment results are presented in TABLE 14 and
TABLE 15. No significant sport by limb interactions for protraction strength (p = 0.224),
retraction strength (p = 0.642) or the protraction/retraction strength ratio (p = 0.989) for the 12.2
cm/sec testing speed were present. No significant sport by limb interactions for protraction
strength (p = 0.120), retraction strength (p = 0.492) or the protraction/retraction strength ratio
(p = 0.260) for the 36.6 cm/sec testing speed were present.

39
Table 14 Protraction/Retraction Strength Assessment at 12.2 cm/sec
Baseball Tennis Volleyball Control Mean ± SD Mean ± SD Mean ± SD Mean ± SD Dominant Protraction (N/kg) 2.46 1.06 2.09 0.63 2.30 1.05 2.40 1.00 Retraction (N/kg) 2.24 0.87 2.05 0.73 2.56 1.16 2.47 1.05 Pro/Re Ratio 1.10 0.30 1.02 0.34 0.90 0.30 0.97 0.36 Non-Dominant Protraction (N/kg) 2.34 0.99 2.36 0.56 2.72 1.00 2.29 1.06 Retraction (N/kg) 2.10 0.91 2.19 0.73 2.68 0.77 2.35 1.22 Pro/Re Ratio 1.12 0.20 1.08 0.20 1.01 0.23 0.98 0.41
Table 15 Protraction/Retraction Strength Assessment at 36.6 cm/sec
Baseball Tennis Volleyball Control Mean ± SD Mean ± SD Mean ± SD Mean ± SD Dominant Protraction (N/kg) 1.93 0.79 1.48 0.51 1.51 0.69 1.80 0.82 Retraction (N/kg) 1.98 0.95 1.59 0.51 1.98 1.02 2.01 0.85 Pro/Re Ratio 0.98 0.35 0.93 0.20 0.76 0.20 0.90 0.41 Non-Dominant Protraction (N/kg) 1.70 0.68 1.69 0.65 1.80 0.64 1.73 0.58 Retraction (N/kg) 1.73 0.72 1.56 0.52 2.07 0.91 1.97 0.86 Pro/Re Ratio 0.98 0.18 1.08 0.18 0.87 0.26 0.88 0.16
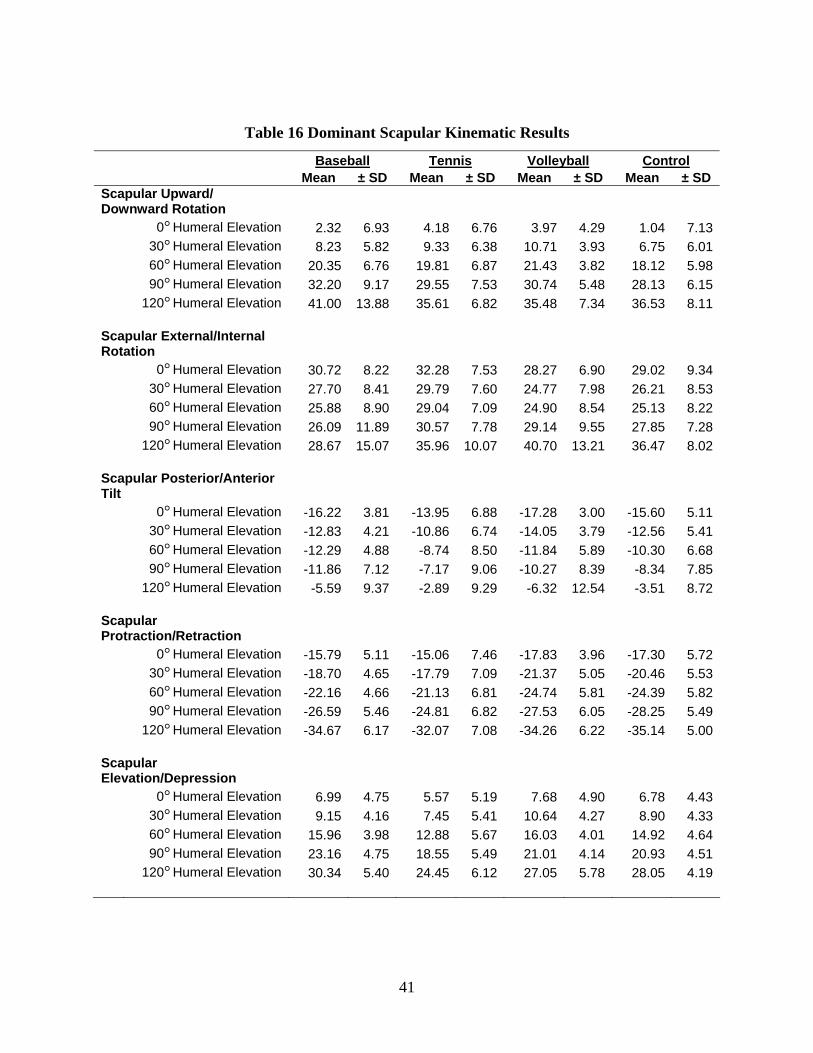
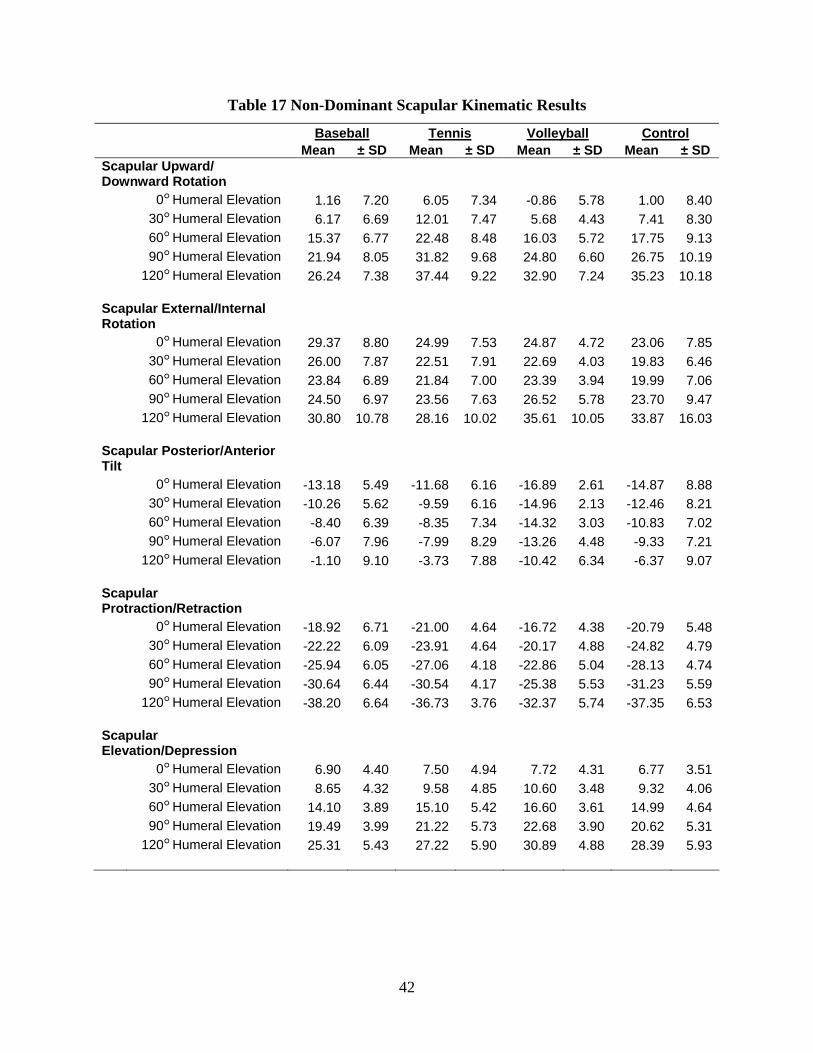
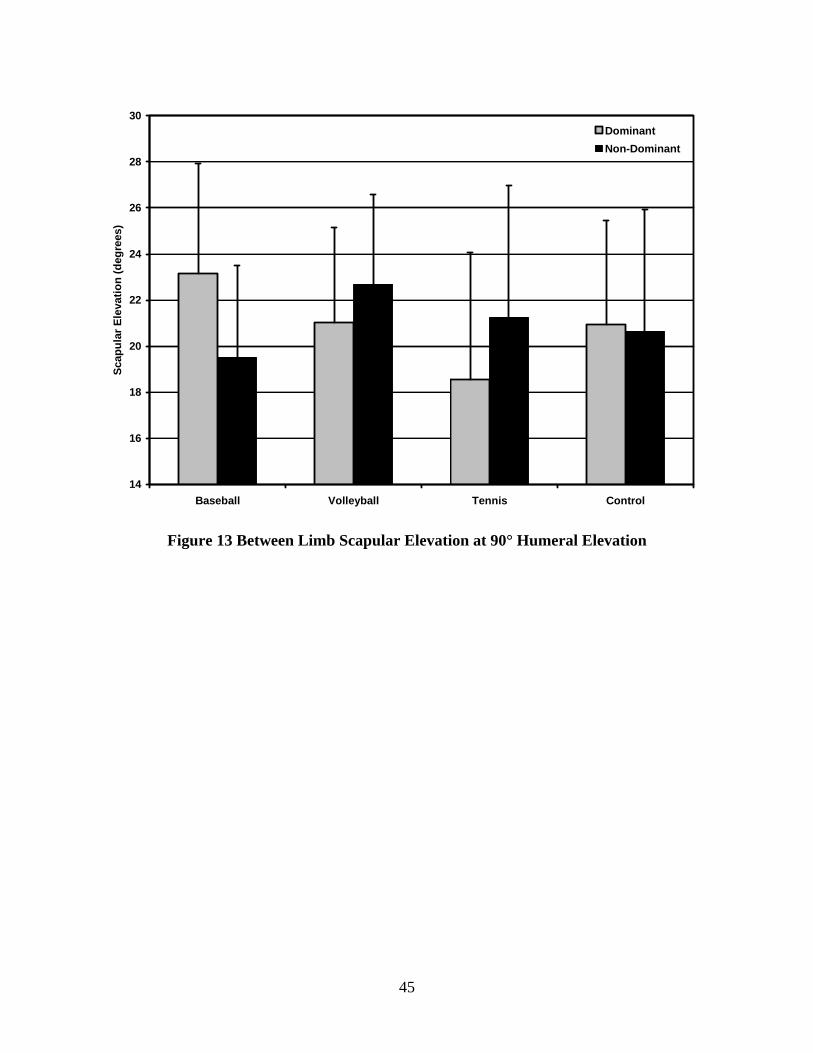
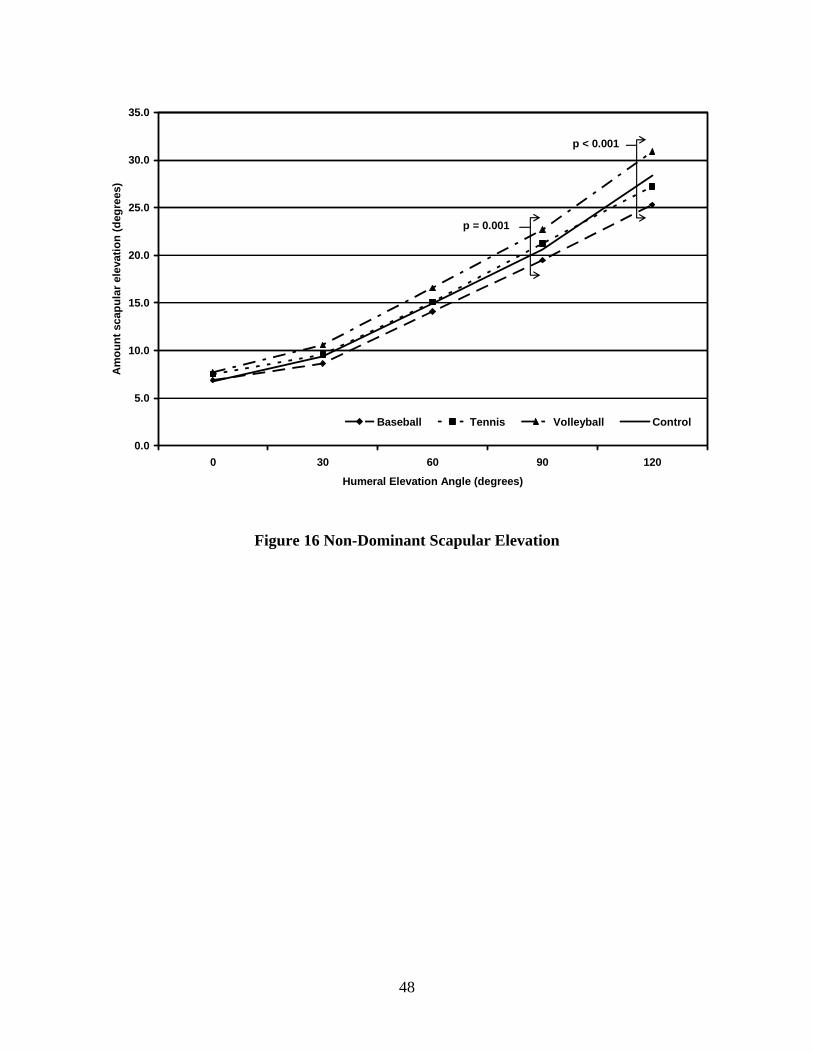
3.4 SCAPULAR KINEMATICS
Dominant scapular kinematics are presented in TABLE 16 and non-dominant scapular
kinematics are presented in TABLE 17. The mean differences for scapular elevation/depression
are presented in TABLES 18-21. Scapular elevation data are presented in FIGURES 13-16.
With an adjusted alpha level of p = 0.00625, there was a significant limb by sport interaction
with scapular elevation/depression at 90° (p = 0.001; MSD = 1.92) and 120° (p < 0.001; MSD =
2.25). At 90°, baseball pitchers showed more dominant limb elevation than volleyball, tennis
and control athletes (mean difference = 2.15, 4.61, 2.23 respectively), volleyball athletes showed
40
more elevation than tennis athletes did (mean difference = 2.46), and tennis athletes had less
elevation than the control athletes did (mean difference = 2.31). Volleyball athletes had more
non-dominant scapular elevation than baseball pitchers and control athletes (mean difference =
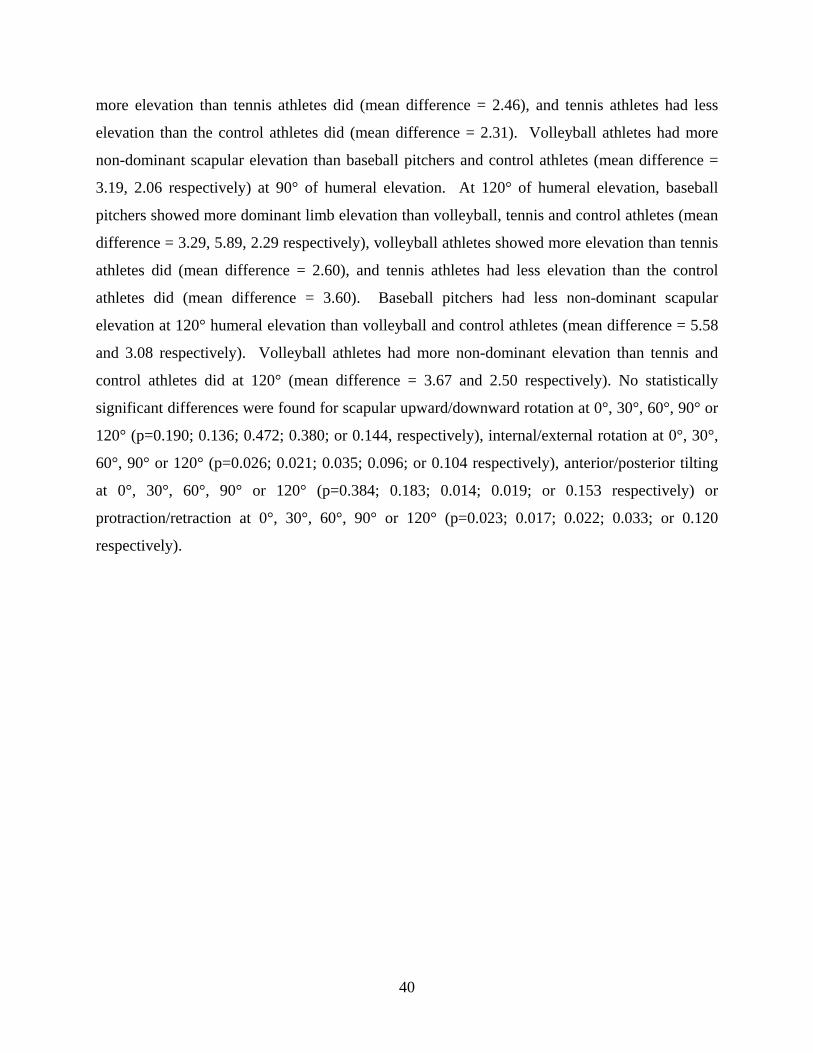
3.19, 2.06 respectively) at 90° of humeral elevation. At 120° of humeral elevation, baseball
pitchers showed more dominant limb elevation than volleyball, tennis and control athletes (mean
difference = 3.29, 5.89, 2.29 respectively), volleyball athletes showed more elevation than tennis
athletes did (mean difference = 2.60), and tennis athletes had less elevation than the control
athletes did (mean difference = 3.60). Baseball pitchers had less non-dominant scapular
elevation at 120° humeral elevation than volleyball and control athletes (mean difference = 5.58
and 3.08 respectively). Volleyball athletes had more non-dominant elevation than tennis and
control athletes did at 120° (mean difference = 3.67 and 2.50 respectively). No statistically
significant differences were found for scapular upward/downward rotation at 0°, 30°, 60°, 90° or
120° (p=0.190; 0.136; 0.472; 0.380; or 0.144, respectively), internal/external rotation at 0°, 30°,
60°, 90° or 120° (p=0.026; 0.021; 0.035; 0.096; or 0.104 respectively), anterior/posterior tilting
at 0°, 30°, 60°, 90° or 120° (p=0.384; 0.183; 0.014; 0.019; or 0.153 respectively) or
protraction/retraction at 0°, 30°, 60°, 90° or 120° (p=0.023; 0.017; 0.022; 0.033; or 0.120
respectively).
41
Table 16 Dominant Scapular Kinematic Results
Baseball Tennis Volleyball Control Mean ± SD Mean ± SD Mean ± SD Mean ± SD Scapular Upward/ Downward Rotation
0° Humeral Elevation 2.32 6.93 4.18 6.76 3.97 4.29 1.04 7.13 30° Humeral Elevation 8.23 5.82 9.33 6.38 10.71 3.93 6.75 6.01 60° Humeral Elevation 20.35 6.76 19.81 6.87 21.43 3.82 18.12 5.98 90° Humeral Elevation 32.20 9.17 29.55 7.53 30.74 5.48 28.13 6.15 120° Humeral Elevation 41.00 13.88 35.61 6.82 35.48 7.34 36.53 8.11
Scapular External/Internal Rotation
0° Humeral Elevation 30.72 8.22 32.28 7.53 28.27 6.90 29.02 9.34 30° Humeral Elevation 27.70 8.41 29.79 7.60 24.77 7.98 26.21 8.53 60° Humeral Elevation 25.88 8.90 29.04 7.09 24.90 8.54 25.13 8.22 90° Humeral Elevation 26.09 11.89 30.57 7.78 29.14 9.55 27.85 7.28 120° Humeral Elevation 28.67 15.07 35.96 10.07 40.70 13.21 36.47 8.02
Scapular Posterior/Anterior Tilt
0° Humeral Elevation -16.22 3.81 -13.95 6.88 -17.28 3.00 -15.60 5.11 30° Humeral Elevation -12.83 4.21 -10.86 6.74 -14.05 3.79 -12.56 5.41 60° Humeral Elevation -12.29 4.88 -8.74 8.50 -11.84 5.89 -10.30 6.68 90° Humeral Elevation -11.86 7.12 -7.17 9.06 -10.27 8.39 -8.34 7.85 120° Humeral Elevation -5.59 9.37 -2.89 9.29 -6.32 12.54 -3.51 8.72
Scapular Protraction/Retraction
0° Humeral Elevation -15.79 5.11 -15.06 7.46 -17.83 3.96 -17.30 5.72 30° Humeral Elevation -18.70 4.65 -17.79 7.09 -21.37 5.05 -20.46 5.53 60° Humeral Elevation -22.16 4.66 -21.13 6.81 -24.74 5.81 -24.39 5.82 90° Humeral Elevation -26.59 5.46 -24.81 6.82 -27.53 6.05 -28.25 5.49 120° Humeral Elevation -34.67 6.17 -32.07 7.08 -34.26 6.22 -35.14 5.00
Scapular Elevation/Depression
0° Humeral Elevation 6.99 4.75 5.57 5.19 7.68 4.90 6.78 4.43 30° Humeral Elevation 9.15 4.16 7.45 5.41 10.64 4.27 8.90 4.33 60° Humeral Elevation 15.96 3.98 12.88 5.67 16.03 4.01 14.92 4.64 90° Humeral Elevation 23.16 4.75 18.55 5.49 21.01 4.14 20.93 4.51 120° Humeral Elevation 30.34 5.40 24.45 6.12 27.05 5.78 28.05 4.19
42
Table 17 Non-Dominant Scapular Kinematic Results
Baseball Tennis Volleyball Control Mean ± SD Mean ± SD Mean ± SD Mean ± SD Scapular Upward/ Downward Rotation
0° Humeral Elevation 1.16 7.20 6.05 7.34 -0.86 5.78 1.00 8.40 30° Humeral Elevation 6.17 6.69 12.01 7.47 5.68 4.43 7.41 8.30 60° Humeral Elevation 15.37 6.77 22.48 8.48 16.03 5.72 17.75 9.13 90° Humeral Elevation 21.94 8.05 31.82 9.68 24.80 6.60 26.75 10.19 120° Humeral Elevation 26.24 7.38 37.44 9.22 32.90 7.24 35.23 10.18
Scapular External/Internal Rotation
0° Humeral Elevation 29.37 8.80 24.99 7.53 24.87 4.72 23.06 7.85 30° Humeral Elevation 26.00 7.87 22.51 7.91 22.69 4.03 19.83 6.46 60° Humeral Elevation 23.84 6.89 21.84 7.00 23.39 3.94 19.99 7.06 90° Humeral Elevation 24.50 6.97 23.56 7.63 26.52 5.78 23.70 9.47 120° Humeral Elevation 30.80 10.78 28.16 10.02 35.61 10.05 33.87 16.03
Scapular Posterior/Anterior Tilt
0° Humeral Elevation -13.18 5.49 -11.68 6.16 -16.89 2.61 -14.87 8.88 30° Humeral Elevation -10.26 5.62 -9.59 6.16 -14.96 2.13 -12.46 8.21 60° Humeral Elevation -8.40 6.39 -8.35 7.34 -14.32 3.03 -10.83 7.02 90° Humeral Elevation -6.07 7.96 -7.99 8.29 -13.26 4.48 -9.33 7.21 120° Humeral Elevation -1.10 9.10 -3.73 7.88 -10.42 6.34 -6.37 9.07
Scapular Protraction/Retraction
0° Humeral Elevation -18.92 6.71 -21.00 4.64 -16.72 4.38 -20.79 5.48 30° Humeral Elevation -22.22 6.09 -23.91 4.64 -20.17 4.88 -24.82 4.79 60° Humeral Elevation -25.94 6.05 -27.06 4.18 -22.86 5.04 -28.13 4.74 90° Humeral Elevation -30.64 6.44 -30.54 4.17 -25.38 5.53 -31.23 5.59 120° Humeral Elevation -38.20 6.64 -36.73 3.76 -32.37 5.74 -37.35 6.53
Scapular Elevation/Depression
0° Humeral Elevation 6.90 4.40 7.50 4.94 7.72 4.31 6.77 3.51 30° Humeral Elevation 8.65 4.32 9.58 4.85 10.60 3.48 9.32 4.06 60° Humeral Elevation 14.10 3.89 15.10 5.42 16.60 3.61 14.99 4.64 90° Humeral Elevation 19.49 3.99 21.22 5.73 22.68 3.90 20.62 5.31 120° Humeral Elevation 25.31 5.43 27.22 5.90 30.89 4.88 28.39 5.93

43
Table 18 Mean Differences for Dominant Limb Scapular Elevation at 90° Humeral
Elevation
Baseball Volleyball Tennis Control MSD = 1.92 23.16 21.01 18.55 20.93
Baseball 23.16
-----
Volleyball 21.01
*2.15 -----
Tennis 18.55
*4.61 *2.46 -----
Control 20.93
*2.23 0.08 *2.38 -----
* Significant mean difference
Table 19 Mean Differences for Non-Dominant Limb Scapular Elevation at 90° Humeral
Elevation
Baseball Volleyball Tennis Control MSD = 1.92 19.49 22.68 21.22 20.62
Baseball 19.49
-----
Volleyball 22.68
*3.19 -----
Tennis 21.22
1.73 1.46 -----
Control 20.62
1.13 *2.06 0.06 -----
* Significant mean difference

44
Table 20 Mean Differences for Dominant Limb Scapular Elevation at 120° Humeral
Elevation
Baseball Volleyball Tennis Control MSD = 2.25 30.34 27.05 24.45 28.05
Baseball 30.34
-----
Volleyball 27.05
*3.29 -----
Tennis 24.45
*5.89 *2.60 -----
Control 28.05
*2.29 1.00 *3.60 -----
* Significant mean difference
Table 21 Mean Differences for Non-Dominant Limb Scapular Elevation at 120° Humeral
Elevation
Baseball Volleyball Tennis Control MSD = 2.25 25.31 30.89 27.22 28.39
Baseball 25.31
-----
Volleyball 30.89
*5.58 -----
Tennis 27.22
1.91 *3.67 -----
Control 28.39
*3.08 *2.50 1.17 -----
* Significant mean difference
45
14
16
18
20
22
24
26
28
30
Baseball Volleyball Tennis Control
Scap
ular
Ele
vatio
n (d
egre
es)
DominantNon-Dominant
Figure 13 Between Limb Scapular Elevation at 90° Humeral Elevation

46
20.0
22.0
24.0
26.0
28.0
30.0
32.0
34.0
36.0
Baseball Volleyball Tennis Control
Scap
ular
Ele
vatio
n (d
egre
es)
DominantNon-Dominant
Figure 14 Between Limb Scapular Elevation at 120° humeral Elevation

47
0.0
5.0
10.0
15.0
20.0
25.0
30.0
35.0
0 30 60 90 120
Humeral Elevation Angle (degrees)
Am
ount
of S
capu
lar E
leva
tion
(deg
rees
)
Baseball Tennis Volleyball Control
p = 0.001
p < 0.001
Figure 15 Dominant Scapular Elevation
48
0.0
5.0
10.0
15.0
20.0
25.0
30.0
35.0
0 30 60 90 120
Humeral Elevation Angle (degrees)
Am
ount
sca
pula
r ele
vatio
n (d
egre
es)
Baseball Tennis Volleyball Control
p = 0.001
p < 0.001
Figure 16 Non-Dominant Scapular Elevation

49
4.0 DISCUSSION
4.1.1 Range of Motion
All athletes participating in overhead sports in the current study exhibited less dominant
internal rotation ROM than non-dominant internal rotation ROM. This result has been reported
by many previous studies on overhead athletes5, 17-19, 24, 26-28, 50-52. Although the exact mechanism
is unknown, the loss of internal rotation may be caused by tightening in the posterior aspect of
the shoulder5, 8, 10, 15, 17-20 or an osseous adaptation of the humerus17, 19, 27, 53, 54.
A significant decrease in internal rotation was present in overhead athletes, while there
was no significant difference for total rotation range of motion in all groups. However, there
were slight variations in the difference between GIRD and ERG. Tennis athletes had 2.2° more
GIRD than ERG. Volleyball and control athletes had more ERG than GIRD (3.0° and 4.7°
respectively), while baseball pitchers had an equal amount of GIRD and ERG (0.3° difference).
This result may suggest that different sports have a decrease in internal rotation ROM for
different reasons (contribution of bony versus soft tissue adaptations).
When the total arc of motion is roughly the same bilaterally, an osseous adaptation most
likely is the cause for any altered ROM8, 26, 28, 53-55. Humeral retroversion is an osseous
adaptation of the humerus17, 19, 27. Humeral retroversion can be defined as the angle between the
axis of the elbow joint and the axis through the center of the humeral head53. This angle
demonstrates the degree to which the humeral head is shifted more inward and backward53.
Compared to the contralateral limb, having a higher degree of humeral retroversion will allow
more external rotation ROM with the same amount of humeral head motion. The cost of having
increased external rotation is a decrease in internal rotation ROM with the same amount of
glenohumeral rotation as the contralateral limb. Since humeral retroversion is an osseous
adaptation, the total arc of motion (internal ROM + external ROM) should remain equal when

50
compared bilaterally. Since there were no significant differences in total shoulder rotation ROM
between any sports, osseous adaptations may be the cause for the decrease in internal rotation.
Borsa et al26 suggest that pitchers develop this retroversion at a young age from the high humeral
torques that occurs with pitching. The possibility remains that humeral retroversion occurs at a
young age due to the adaptation of the body to the stresses of overhead motion. Researchers have
suggested that bony adaptation occurs before the athlete is skeletally mature53, 55, 56. This shift in
humeral orientation should help to reduce the stress at the glenohumeral joint while allowing the
athlete to achieve the relatively high amount of external rotation needed during the late cocking
phase of the throwing motion26, 53, 57. This adaptation may spare the anterior capsule from
increased stresses and possible failure.
On the other hand, research has suggested the forceful eccentric contractions of the
shoulder external rotator muscles during follow through cause tightening in the posterior aspect
of the shoulder5, 8, 10, 15, 17-20. This increased posterior shoulder tightness may cause an associated
decrease in internal rotation ROM5, 9, 17-19, 21-24. The results of this study support this theory.
Baseball pitchers and tennis athletes have been shown to have this associated decrease in internal
rotation ROM from a tightened posterior shoulder not only the current study, but previous
studies as well23, 51. Tennis athletes have been shown to have increased dominant internal
rotation ROM deficits as their years of play increase58. In the study, Kibler et al58 did not
address the age at which their population began participating in tennis, only the total number of
years played. As other researchers19, 27, 56 have hypothesized, both bony and soft tissue
adaptations may occur and contribute to the decrease in internal rotation ROM. As it is difficult
to pinpoint a specific structure that tightens in the posterior shoulder, it is probably difficult to
state whether an internal rotation ROM loss is strictly bony adaptation or soft tissue adaptation.
Due to the nature of the throwing motion, both mechanisms likely play a role. The contribution
of one theory relative to the other may be highly sport specific and warrants further research.
When a volleyball athlete strikes the ball midway through the hitting motion, the majority
of the internal rotation torque that is produced during the acceleration phase could be transferred
to the ball. Although transferring energy to an object is the goal of the overhead throwing
motion, the amount transferred in volleyball may be larger than other sports. The transfer of
energy might help to slow the limb to the point that there is little overload to the posterior
shoulder structures, and therefore, limited tightening of those structures occur. According to
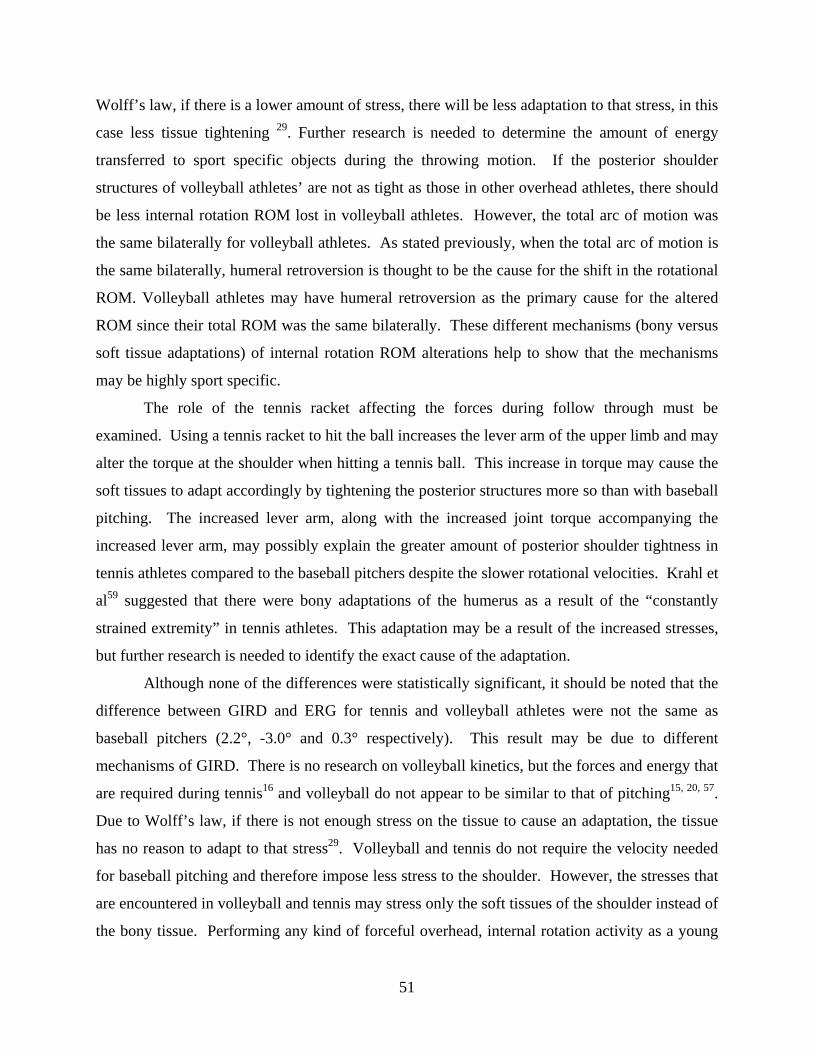
51
Wolff’s law, if there is a lower amount of stress, there will be less adaptation to that stress, in this
case less tissue tightening 29. Further research is needed to determine the amount of energy
transferred to sport specific objects during the throwing motion. If the posterior shoulder
structures of volleyball athletes’ are not as tight as those in other overhead athletes, there should
be less internal rotation ROM lost in volleyball athletes. However, the total arc of motion was
the same bilaterally for volleyball athletes. As stated previously, when the total arc of motion is
the same bilaterally, humeral retroversion is thought to be the cause for the shift in the rotational
ROM. Volleyball athletes may have humeral retroversion as the primary cause for the altered
ROM since their total ROM was the same bilaterally. These different mechanisms (bony versus
soft tissue adaptations) of internal rotation ROM alterations help to show that the mechanisms
may be highly sport specific.
The role of the tennis racket affecting the forces during follow through must be
examined. Using a tennis racket to hit the ball increases the lever arm of the upper limb and may
alter the torque at the shoulder when hitting a tennis ball. This increase in torque may cause the
soft tissues to adapt accordingly by tightening the posterior structures more so than with baseball
pitching. The increased lever arm, along with the increased joint torque accompanying the
increased lever arm, may possibly explain the greater amount of posterior shoulder tightness in
tennis athletes compared to the baseball pitchers despite the slower rotational velocities. Krahl et
al59 suggested that there were bony adaptations of the humerus as a result of the “constantly
strained extremity” in tennis athletes. This adaptation may be a result of the increased stresses,
but further research is needed to identify the exact cause of the adaptation.
Although none of the differences were statistically significant, it should be noted that the
difference between GIRD and ERG for tennis and volleyball athletes were not the same as
baseball pitchers (2.2°, -3.0° and 0.3° respectively). This result may be due to different
mechanisms of GIRD. There is no research on volleyball kinetics, but the forces and energy that
are required during tennis16 and volleyball do not appear to be similar to that of pitching15, 20, 57.
Due to Wolff’s law, if there is not enough stress on the tissue to cause an adaptation, the tissue
has no reason to adapt to that stress29. Volleyball and tennis do not require the velocity needed
for baseball pitching and therefore impose less stress to the shoulder. However, the stresses that
are encountered in volleyball and tennis may stress only the soft tissues of the shoulder instead of
the bony tissue. Performing any kind of forceful overhead, internal rotation activity as a young
52
child and through development may allow the humerus to adapt slowly over time to the
increased stresses. As previously pointed out, researchers suggest that this bony adaptation
occur before the athlete is skeletally mature53, 55, 56. Since there was only a significant difference
with GIRD and not with ERG for tennis and volleyball athletes, the cause of the internal rotation
ROM loss is most likely a result of a more tightened posterior shoulder rather than humeral
retroversion. Future research should analyze the contributions of both humeral retroversion and
a tight posterior shoulder to ROM alterations and see if there are differences between overhead
sports.
4.1.2 GIRD/ERG
The results for the GIRD measurements show that baseball and tennis had a larger deficit
than the control group. These results are in agreement with many prior studies that show the
same results5, 17, 18, 26-28, 51. In a study of professional baseball athletes there was a significant
difference in internal rotation ROM between dominant and non-dominant limbs5. Other research
reports GIRD values of between 9.7°26 and 12.0°27 for baseball pitchers. The current study’s
GIRD measurement of 12.6º in baseball pitchers is similar to previously reported data.
Ellenbecker and colleagues28 compared professional baseball pitchers to elite junior tennis
players and found tennis players to have higher values of GIRD than the pitchers (11.8º vs.
10.9º). Others18 have looked at professional tennis players and showed a mean GIRD value of
17º. The current study found that tennis athletes have a mean GIRD value of 11º, which is
slightly lower than previous reports. However, the results for tennis athletes and baseball
pitchers in the current study tend to agree with previous literature28. More research should be
performed in order to collect normative data for GIRD values in tennis athletes, and possibly
determine the contribution of bony and soft tissue adaptations to the range of motion alteration in
tennis athletes.
The current results tend to support the idea of a total arc of motion concept around the
glenohumeral joint as proposed by other researchers17, 18, 26-28. Baseball pitchers tend to have the
same amount of total arc of motion when compared bilaterally26, 27, 50, 51, 54, whereas tennis
athletes are usually reported to have a decreased total arc of motion on their dominant limb of
about 10° compared bilaterally17, 18, 28. There was no significance with total rotation ROM in the

53
current study between any of the groups. However, there was a slightly smaller arc of motion for
tennis athletes than baseball pitchers. The subject population may explain why there was no
significance with total rotation ROM. The majority of previous research has been conducted on
either semi-professional or elite tennis athletes. The current study used competitive college
athletes. The decreased internal rotation ROM may not have had a chance to manifest in the
college athletes as opposed to the higher-level athletes. The demands of a higher level of
competition require an athlete to hit harder and serve faster. In order to achieve this, the athlete
needs to develop a higher amount of torque to swing the racket harder and faster. The external
rotators must still decelerate this increased torque. The increased demand on the external
rotators may cause an increased amount of posterior shoulder tightness; therefore decreasing the
internal rotation ROM and subsequently the total rotation ROM. Soft tissue adaptations in the
posterior shoulder may explain why tennis athletes had a higher degree of GIRD as well as lower
total rotation ROM in the shoulder. Further research should help to determine why the GIRD in
tennis players tends to be higher than in other overhead throwing sports as well as whether the
decreased rotational ROM is due to bony or soft tissue adaptations.
4.1.3 Posterior Shoulder Tightness
Posterior shoulder tightness has received a lot of attention lately in research. Many
previous studies suggest that having increased posterior shoulder tightness leads to shoulder
pathologies12, 19, 24, 31, 32, 51, 52, 60. Research states that with a tightened posterior shoulder capsule,
the humeral head tends to migrate in an anterior/superior direction32. This altered position will
decrease the subacromial space and possibly lead to injury. Once the posterior structures tighten
and alter the humeral head position, a pathological cascade begins that ultimately may lead to a
SLAP lesion12. Many researchers believe that during the follow through phase of throwing, the
eccentric contractions of the external rotators overload the tissue and cause an adaptive
tightening of the tissue5, 8, 10, 15, 17-20, 51. This tightening has been shown to correlate well with a
decrease in internal rotation ROM23, 51, 61, and it is suggested that it alters scapular upward
rotation62, 63.
A pilot study to the current study has suggested that assessment of the posterior shoulder
tightness can be performed with higher accuracy and precision when the assessment is done with

54
the subject lying supine64, instead of side-lying as described previously by Tyler et al23.
However, there is a question about where to stabilize the scapula. Laudner et al65 suggest
stabilizing the scapula in the resting position when the athlete lays supine. Myers et al64 suggest
using a retracted scapula as the starting point. Although both methods are new and should be
researched further, beginning the measurement in a retracted position may allow for a more
repeatable measurement as this will help to normalize a starting point.
Baseball pitchers, volleyball athletes, and tennis athletes had less dominant horizontal
adduction than the control group. This was not surprising as they are all overhead sports and all
have a follow through phase in their respective sporting activities. Baseball pitchers and tennis
athletes had about the same bilateral difference while volleyball athletes had a slightly lower
value, which indicated that there was less of a decrease on the dominant limb compared to the
non-dominant limb. The fact that the results are not all the same can relate to their sport specific
activities as well. Baseball pitchers have very high joint velocities during pitching. Although
tennis athletes do not perform their respective motion as fast, they perform with a racket, which
may increase the momentum of the arm and increase the amount of torque that the external
rotators must decelerate. According to Wolff’s law, if there is increased stress, the tissues must
adapt to that stress29. If there is more stress present during the follow through in tennis than in
baseball, tennis athletes should be expected to have a greater amount of dominant posterior
shoulder tightness compared to baseball pitchers. The fact that tennis athletes had significantly
less horizontal adduction than control athletes did, should not be a surprise then. This result
should help to back up the idea that tennis athletes have more stress to the dominant posterior
shoulder than baseball pitchers, possibly due to the fact that tennis players use a racket in their
overhead motion. This increased stress may cause a decreased amount of horizontal adduction
Volleyball athletes had the least amount of between-limb difference (with the exception
of control athletes) for posterior shoulder tightness. This may be due to their sport specific
activity. As discussed previously, hitting a volleyball in the middle of the hitting motion may
decrease the amount of momentum and torque of the limb and thus decrease the amount of stress
to the external rotators during follow through. Volleyball athletes are not allowed to hit the net
while hitting the volleyball. Although this may increase the stress on the external rotators to
decelerate the limb faster, the distraction forces at the glenohumeral joint may not be as high as
they are with baseball pitching since the volleyball athletes do not perform as much of a follow

55
through as pitchers do. There is no research that quantifies the kinetics or kinematics in the
shoulder while hitting a volleyball. This idea, along with the idea of performing this activity in
the air versus on the ground, should be analyzed further in future research. When an athlete
jump serves or hits the ball in the air, he does not have a stable base to push off of to generate
more energy. This may affect the amount of energy that the athlete can exert during the hitting
motion and possibly decrease the amount of torque and momentum in the limb to decelerate.
This would decrease the amount of stress on the shoulder compared to tennis athletes and
baseball pitchers and possibly not cause as much tightening in the posterior structures.
An interesting result of this study is that of the non-dominant posterior shoulder tightness.
Baseball pitchers, tennis athletes and volleyball athletes all had more horizontal adduction than
control athletes did. This has not been reported in previous literature. Each of the overhead
motions needs to be performed with as much torque as possible in an effort to throw faster or hit
harder. Biomechanically, if an athlete were to use their entire body to increase the momentum
they could exert on the ball, they would be able to increase the shoulder torque and hopefully
increase their pitching speed or hit the ball harder. Each of the motions in these sports begins
roughly the same way, with a wind up. During that wind up, the non-dominant shoulder moves
from a horizontally adducted position and then begins to horizontally abduct in an effort to start
the athlete’s momentum moving towards where they are throwing or hitting. This repetitive
horizontal adduction of the non-dominant shoulder may maintain or possibly increase posterior
shoulder mobility. Compounding that fact, since the non-dominant limb usually does not
perform a forceful internal rotation motion, there is no stress to the external rotators to adapt to.
Research should continue to look at both dominant and non-dominant posterior shoulder
tightness values in the supine position in order to develop normative data of posterior shoulder
tightness values.
4.1.4 Internal/External Rotation Strength
No statistically significant differences were found for internal rotation strength, external
rotation strength or external/internal rotation strength ratio. Compared to previous literature, this
result was not expected. The majority of the research available states that overhead athletes
(baseball, tennis, volleyball and handball) tend to have lower external rotation strength and

56
increased internal rotation strength when compared bilaterally19, 24, 25, 34, 37, 38. Most overhead
sports require forceful internal rotation in order to accelerate their arm to throw a ball, spike a
ball or swing a racket to hit a ball. Previous research that shows external rotator strength lower
than internal rotation strength for overhead athletes usually state that the decrease is due to
tensile failures and possible pathologies related to repetitive, eccentric contractions of the
external rotators during the follow through stage24, 25, 34, 37, 66. Further, some of that research
states that when isokinetically assessing external rotator strength concentrically, differences may
not arise24, 37, 38. Since the external rotator muscles perform mostly eccentrically during the
overhead motion, if eccentric external rotator strength was assessed, significant differences
might have presented.
Due to many methodological differences between studies, direct comparisons of results
are difficult to make for each strength variable. Some studies include male and female subjects
as one group19, 37. Some studies use older athletes18, 24, 38, 58 while others use younger athletes17,
19. This study is the first study that included only male subjects in baseball, tennis and volleyball
and compared them to a control group. For that reason, direct comparisons could have been
made between sports. Unfortunately, no statistically significant differences were found with the
average peak torque normalized to bodyweight variable. Perhaps other strength variables would
have been more sensitive to differences showing agreement with previous studies.
4.1.5 Protraction/Retraction Strength
Assessing isokinetic scapular protraction and retraction strength is a relatively new
assessment with little research available to compare. Cools et al1, 7 have studied this variable on
healthy subjects as well as pathologic subjects. For healthy overhead athletes, their research
shows decreased protraction/retraction ratios on the dominant side versus non-dominant side at
both 12.2 cm/sec and 36.6 cm/sec7. Caution must be taken when interpreting their results
because their subject population consisted of males and females as well as a mix of overhead
athletes as one group (volleyball, tennis and other). When looking at the protraction/retraction
strength ratio at both testing speeds, both of Cools et al1, 7 study’s as well as the current study’s
strength ratios were lower on the dominant limb at both testing speeds (although not significant
in the current study). Wilk et al8 assessed isometric scapular protraction and retraction strength
57
with a hand held dynamometer. Their results show roughly the same values as the current study.
Both studies show that the dominant limb tends to have a lower strength ratio than the non-
dominant limb. Since both the between group and between limb differences were statistically
insignificant, it is hard to compare all studies (Cools et al, Wilk et al and current study).
Dominant ratios are lower than the non-dominant ratios across all studies, however.
These strength ratio results make sense when considering the stresses that are applied to
the shoulder during the overhead throwing motion. During the follow through phase, the
external rotators and scapular retractors must contract eccentrically to control the deceleration of
the scapula and the throwing limb. The external rotator muscles must slow the humerus from the
extremely high internal rotation torque. The scapular retractor muscles must decelerate the
scapula from protracting during follow through. There may be more stress on the external
rotator muscles due to the larger lever arm of the entire limb as opposed to only the scapula
during protraction and retraction. This difference may affect the amount of force on the muscle
during follow through. The force on the external rotator muscles, coupled with the high amount
of overhead activity, may overtrain the tissue and cause atrophy if there is not an adequate
recovery period67. Decelerating the scapula from protraction during follow through may not
cause the high amounts of stress to the scapular retractor muscles and thus would not approach
the physiologic limits. If the retractor muscles are not overtrained, they can adapt to the overload
stress that is placed on them to decelerate the scapula. Since the baseball pitchers tend to perform
the most overhead activities in this study’s sample population, it makes sense that the ratios are
the lowest (higher retraction strength) in the dominant limb of pitchers. Wilk et al68 showed
baseball pitchers and catchers to have a larger between limb difference (larger values on
dominant than non-dominant) in protraction strength than position players. The authors did not
speculate as to this cause of these differences; however, the volume of throws per game as well
as the velocity of those throws could be a possible cause for the differences between pitchers and
catchers and all other field players. As previously speculated, hitting a volleyball may decrease
the shoulder torque, and thus, decrease the stress on the posterior aspect of the shoulder as well
as the scapular retractors. If the limb has less torque, the retractors would not have to contract as
forcefully to control scapular protraction. The muscle would not adapt as much as it would
during the pitching motion.
58
4.1.6 Scapular Kinematics
Researchers have suggested that an overhead athlete may need more scapular upward
rotation than other people in an effort to maintain the subacromial space at higher levels of
humeral elevation13, 62, 69. Myers et al13 have shown that asymptomatic throwing athletes have
significantly more upward rotation, internal rotation and retraction of the scapula with humeral
elevation. Since there were no differences found in the current overhead athlete population, it is
difficult to apply that theory to this study. In the study by Myers et al13, the subjects raised a
predetermined amount of weight for their humeral elevation task. Having the subject lift weight
may require different muscle recruitment and possibly change scapular kinematics. Prior
research has suggested that fatigue in the external rotators may alter scapular upward rotation as
well63, 70, 71. More research is needed to establish normative data for scapular upward rotation in
overhead athletes.
Following statistical analysis, the only scapular kinematic variable with a significant
interaction was elevation. Although there is little research on scapular kinematics in healthy
overhead athletes, none of the previous literature has reported this result. As stated previously,
athletes did not raise any weight in this study. This may have changed the kinematics and caused
the different result as compared to Myers et al13. Between limb differences were significant for
baseball pitchers at 90º and 120º of humeral elevation and volleyball athletes at 120º of humeral
elevation. Baseball pitchers showed more scapular elevation on the dominant side than non-
dominant at both 90º and 120º while volleyball had less dominant scapular elevation than non-
dominant at 120º. This may related to the motions that each of the respective athletes perform
for each sport. Baseball athletes must hold their humerus near 90º of humeral elevation
throughout the majority of the pitching motion. Perhaps the increased scapular elevation is due
to increased muscle tone/activity of the deltoid, trapezius and levator scapulae muscles in order
to maintain the limb (scapula and humerus) at roughly a 90º abduction angle throughout the
pitch. Wilk et al68 present data that show baseball pitchers and catchers to have significantly
more scapular elevation strength than position players. Perhaps their subjects had increased
strength because they must maintain the subacromial space by elevating the scapula throughout

59
the throwing motion. Volleyball athletes must get their hand over their shoulder in order to
make quick corrections before they hit the ball. This way they can place different spins on the
ball, similar to the different pitches in baseball. Baseball pitchers can use their wrist and fingers
to alter the spin on the ball. Since a volleyball is larger than a baseball, the volleyball athlete
must use their entire hand and upper limb to alter the spin on a volleyball. Performing the hitting
motion at the extremes of humeral elevation may cause the body to make adaptations
accordingly and elevate the scapula to maintain the subacromial space.
At 90º and 120º of humeral elevation, baseball pitchers had significantly greater elevation
than all other groups. It is also worth pointing out that tennis and volleyball athletes actually had
more non-dominant scapular elevation than dominant. Perhaps the baseball pitchers have
increased muscle development of the deltoid, trapezius and levator scapulae on the dominant side
and that is why they possess more dominant limb scapular elevation. Since all subjects were
healthy, further research should be performed to confirm the fact that tennis and volleyball
athletes actually had less humeral elevation than baseball pitchers. Having less dominant
elevation must be an adaptation to sport as none of the tennis or volleyball athletes had an injury
or complained of pain. Another possibility relates to external rotation gain and scapular
elevation. In sports that have an increased amount of external rotation gain compared to control
athletes, perhaps there is an increased demand to maintain the subacromial space. Maintaining
this space could help to prevent damage to the structures (supraspinatous/rotator cuff, and
subacromial bursa) that pass through that space as well as prevent the greater and lesser tubercles
of the humerus from contacting the acromion. Compression in the subacromial space could
damage the subacromial bursa and cause injury to the rotator cuff. When the posterior shoulder
structures are tightened, the humeral head tends to migrate posteriosuperiorly with abduction and
external rotation due to the cam effect12. Wilk et al68 showed that baseball pitchers have
significantly more scapular elevation strength than position players. With excessive external
rotation, perhaps the body adapts to this altered humeral position by having the scapular elevator
muscles (upper trapezius, levator scapulae) contract to elevate the acromion and maintain the
subacromial space. This adaptation could be a preventative measure for subacromial
impingement during external rotation at 90° of humeral elevation.
The fact that there were differences between overhead sports for some of the variables
included in this study was a goal of the study. If all overhead athletes were the same, as the
60
majority of the research tends to stereotype, then there should not have been any difference
between the overhead groups. There has only been limited research that has compared variables
between overhead sports. Differences in shoulder kinetics and kinematics during tennis strokes/
serves and pitching should be explored as a possible reason for some of the differences between
overhead athletes and tennis athletes found in the current study. The possibility that striking a
volleyball during the hitting/serving motion should be explored as well as a possible explanation
for some of the differences between volleyball athletes and other overhead athletes. Variability
in the kinematics, lever arm length, humeral rotation velocity, weight of the sport specific
equipment may have resulted in different stress at the shoulder joint, which lead to the difference
in physical characteristics between groups.
Another possible explanation for the differences between volleyball athletes and the other
overhead athletes may relate to the fact that the majority of the spiking motion is performed
entirely in the air. At the higher levels of participation, even the serving motion is performed
with a jump serve. Perhaps this detail could explain some of the differences between overhead
sports. Once the athlete is in the air, they cannot push against the ground unlike pitching a
baseball or hitting a tennis ball. If the athlete is in the air, they can only use the energy in their
body to place on the ball. According to Kibler72, when the athlete is on the ground, the athlete
funnels the energy from the ground, through the body and out through the ball. Further research
should look at the difference between performing the volleyball spike/serve on the ground as
opposed to performing it in the air.
This study is the first to compare baseball, tennis, and volleyball athletes to a control
group all in the same study using the same methods. Although there has been at least some
research on each of these overhead sports, few studies have been completed using the same
methodology to allow direct comparisons. There has been no research, to the author’s
knowledge, performed on scapular kinematics for tennis or volleyball athletes. For that reason,
there are many questions that arise from this research study. Performing the forceful, overhead,
internal rotation motion with different loads to the limb (swinging a tennis racket versus pitching
a baseball versus striking a volleyball) may prove to have differing effects on physical
characteristics of the shoulder. Further research should be performed on these overhead sports to
determine the kinetics at the shoulder joint during the respective overhead motion of each sport.
61
This information may shed light on some of the differences between baseball pitching and other
overhead sporting activities.
4.2 STUDY LIMITATIONS
The methods used to measure posterior shoulder tightness are relatively new when
compared to other ROM measurements (i.e. shoulder internal/external rotation ROM). Holding
the scapula in a firm position throughout the entire measurement is subjective. However, pilot
work shows low clinician error64. Those results also show that stabilization of the scapula is
possible in a retracted starting position64. Some controversy exists as to whether a fully retracted
measurement starting position or a “neutral” starting position (stabilizing wherever the scapula is
when the subject lies supine) produces a more meaningful measurement. A retracted position
was used as the starting point in the current study as the reliability of the measurement had
already been established64.
The position of internal and external rotation strength assessment was not in a functional
position. Although the testing protocol for the current study is an accepted one, perhaps the
results would have been different if the testing position was in an overhead position. The
protraction and retraction strength assessment was an uncommon position and motion for the
athlete. Many subjects had trouble learning the movement for the test. Even after sufficient
practice repetitions with minimal resistance, subjects often needed instruction during testing. It
should be noted that overhead athletes appeared to learn this motion faster than the control
group. Some of the limitations with this motion relate to arm position. During the testing
protocol, the subjects must keep their arm straight. Sometimes the subject would slightly flex
the elbow as an accessory movement to help pull the dynamometer into the retraction position.
Perhaps future studies that employ this strength protocol could use an elbow brace locked at full
extension to help eliminate the contribution of the elbow flexors during the retraction strength
measurement
Karduna and collegues49 show that scapular kinematic data collected above 120º of
humeral elevation has been shown to have decreased accuracy. Although their research states

62
that the most accurate measurements occur below 120º, their research shows that as humeral
elevation angles increase, the root mean square values increase as well. The authors also point
out that increased errors may be due to different skin movement patterns in different subjects49.
The current method of assessing scapular kinematics is generally accepted and has been used in
previous research13, 44, 49, 64, 73. As with the strength assessment, the scapular kinematic
assessment was not completed during a functional motion. Furthermore, the subjects were not
holding their respective sport specific equipment (i.e. baseball or tennis racket). Incorporating
both of these aspects may produce different results.
4.3 FUTURE RESEARCH
Future research should begin with including more overhead sports. Many sports that are
not traditionally thought of as “overhead” include overhead motions. Throwing the javelin,
many motions in water polo and throwing a football are a few examples of overhead motions that
should be taken into consideration for future research. Although this study used a generally
accepted protocol to assess shoulder strength, perhaps performing the internal and external
rotation strength assessment in a functional position (90º humeral abduction) may produce
different results. Including a pathologic group to the study might shed some light on some of the
adaptations that the body makes when pain or pathologies are present in the overhead athlete’s
shoulder.
Research that looks at the distraction forces at the shoulder during sport specific activities
(baseball pitching vs. volleyball spiking/hitting vs. tennis serving/spiking) might help to explain
the between group differences found for GIRD. It might also help to explain why volleyball
athletes do not exhibit this deficit even though they perform roughly the same motion.
Determining the distraction forces may help to explain some of the scapular kinematic
adaptations as well since there is some research that suggests that tightened posterior shoulder
structures may alter scapular kinematics62, 63, 74. Research performed in these sports should also
analyze the respective sport specific motions while the subjects are using their respective
equipment, i.e. throwing a baseball, swinging tennis racket and spiking a volleyball.
63
Future research should also determine if there is a difference in kinetics and kinematics of
the volleyball spike between standing and jumping. As discussed earlier, when the subject is on
the court hitting, they can push against the ground to generate more torque. On the other hand,
when they perform a spike in the air or a jump serve, the athletes can only use whatever energy is
in their body to hit the ball. This may reduce the amount of force they can produce against the
ball and therefore alter shoulder characteristics. Further research is necessary to determine if this
decrease in torque occurs between standing and jumping.
Research shows that there is increased upward rotation in the scapular plane compared to
the sagittal plane in healthy shoulders during an elevation task62. The limb does not usually
perform strictly in the scapular plane in overhead motions. It may be a better assessment to
measure in the sagittal, frontal and scapular plane (or a combination of) and compare between
them to somewhat replicate the throwing motion. By the time the throwing limb is in the
scapular plane, the external rotators are eccentrically contracting to decelerate the limb during
follow through. The possibility that muscle adaptations in the scapular plane may alter scapular
kinematics compared to other planes should be researched in the future.
4.4 CLINICAL RELEVANCE
The current research study shows a difference between overhead sports. Baseball
pitchers tend to exhibit different characteristics than tennis, volleyball and the control group,
although some of those differences were not significant. In the future, overhead athletes should
not be stereotyped as one “overhead athlete” group; instead, they should be subdivided into their
respective sports. This subdivision will allow the sports medicine clinician to administer and
prescribe a better treatment and rehabilitation plan. Rehabilitation protocols should be tailored to
the specific demands of each sport. A sport specific return to play criteria will possibly allow a
healthier and faster return to sport.
64
5.0 CONCLUSION
The current study of 58 subjects (15 baseball pitchers, 15 volleyball athletes, 13 tennis
athletes, and 15 control athletes) measured shoulder rotation ROM, posterior shoulder tightness,
internal/external rotation strength, protraction/retraction strength, and scapular kinematics during
an elevation task. The results show that not all overhead athletes posses the same shoulder
characteristics. The exact explanation for some of these results is not possible as there is little
research available on tennis and volleyball athletes’ shoulder characteristics. However, the
majority of these differences may be due to the stresses that are placed on the structures and how
the body adapts to those stresses (Wolff’s Law).
The main goal of this study was to compare the characteristics of common overhead
sports. The results show that the overhead sports in this study are not the same in healthy,
college aged, male athletes. Many previous research studies have stereotyped the overhead
athlete as a baseball pitcher/player. The results of this study suggest this may not to be the case.
When reviewing the results, baseball, tennis, and volleyball athletes do not have the same
characteristics for all variables. For this reason, sport specific rehabilitation programs should be
developed in order to not only return the athlete to sport as soon as possible, but to regain the
necessary physical characteristics specific to the respective sport. In the future, researchers
should not group all overhead athletes together as one stereotypical “overhead athlete” group, but
subdivide that group into the respective sports. Only with more research in this area will these
subgroups be able to be thoroughly understood and defined.
65
BIBLIOGRAPHY
1. Cools AM, Witvrouw EE, Declercq GA, Vanderstraeten GG, Cambier DC. Evaluation of isokinetic force production and associated muscle activity in the scapular rotators during a protraction-retraction movement in overhead athletes with impingement symptoms. Br J Sports Med. Feb 2004;38(1):64-68.
2. Ruotolo C, Penna J, Namkoong S, Meinhard BP. Shoulder pain and the overhand athlete. Am J Orthop. May 2003;32(5):248-258.
3. Burkhart SS, Parten PM. Dead Arm Syndrome: Torsional SLAP lesions versus internal impingement. Techniques in Shoulder & Elbow Surgery. 2001;2(2):74-84.
4. Armfield DR, Stickle RL, Robertson DD, Towers JD, Debski RE. Biomechanical basis of common shoulder problems. Semin Musculoskelet Radiol. Mar 2003;7(1):5-18.
5. Bigliani LU, Codd TP, Connor PM, Levine WN, Littlefield MA, Hershon SJ. Shoulder motion and laxity in the professional baseball player. Am J Sports Med. Sep-Oct 1997;25(5):609-613.
6. Meister K. Injuries to the shoulder in the throwing athlete. Part one: Biomechanics/pathophysiology/classification of injury. Am J Sports Med. Mar-Apr 2000;28(2):265-275.
7. Cools AM, Witvrouw EE, Mahieu NN, Danneels LA. Isokinetic Scapular Muscle Performance in Overhead Athletes With and Without Impingement Symptoms. J Athl Train. Jun 2005;40(2):104-110.
8. Wilk KE, Meister K, Andrews JR. Current concepts in the rehabilitation of the overhead throwing athlete. Am J Sports Med. Jan-Feb 2002;30(1):136-151.
9. Baltaci G, Tunay VB. Isokinetic performance at diagonal pattern and shoulder mobility in elite overhead athletes. Scand J Med Sci Sports. Aug 2004;14(4):231-238.
10. Burkhart SS, Morgan CD, Kibler WB. The disabled throwing shoulder: spectrum of pathology. Part II: evaluation and treatment of SLAP lesions in throwers. Arthroscopy. May-Jun 2003;19(5):531-539.

66
11. Burkhart SS, Morgan CD, Kibler WB. The disabled throwing shoulder: spectrum of pathology Part III: The SICK scapula, scapular dyskinesis, the kinetic chain, and rehabilitation. Arthroscopy. Jul-Aug 2003;19(6):641-661.
12. Burkhart SS, Morgan CD, Kibler WB. The disabled throwing shoulder: spectrum of pathology Part I: pathoanatomy and biomechanics. Arthroscopy. May 2003;19(4):404-420.
13. Myers J, Launder K, Pasquuale M, Bradley J, Lephart S. Scapular position and orientation in throwing athletes. Am J Sports Med. 2005;33(2):263-271.
14. Rizio L, Uribe J. Overuse injuries of the upper extremity in baseball. Clin Sports Med. 2001;20(3):453-468.
15. Werner SL, Gill TJ, Murray TA, Cook TD, Hawkins RJ. Relationships between throwing mechanics and shoulder distraction in professional baseball pitchers. Am J Sports Med. May-Jun 2001;29(3):354-358.
16. Kibler WB. Biomechanical analysis of the shoulder during tennis activities. Clin Sports Med. Jan 1995;14(1):79-85.
17. Ellenbecker TS, Roetert EP, Piorkowski PA, Schulz DA. Glenohumeral joint internal and external rotation range of motion in elite junior tennis players. J Orthop Sports Phys Ther. Dec 1996;24(6):336-341.
18. Schmidt-Wiethoff R, Rapp W, Mauch F, Schneider T, Appell HJ. Shoulder rotation characteristics in professional tennis players. Int J Sports Med. Feb 2004;25(2):154-158.
19. Wang HK, Juang LG, Lin JJ, Wang TG, Jan MH. Isokinetic performance and shoulder mobility in Taiwanese elite junior volleyball players. Isokinetics and Exercise Science. 2004 2004;12:135-141.
20. Fleisig GS, Andrews JR, Dillman CJ, Escamilla RF. Kinetics of baseball pitching with implications about injury mechanisms. Am J Sports Med. Mar-Apr 1995;23(2):233-239.
21. Rundquist PJ, Ludewig PM. Patterns of motion loss in subjects with idiopathic loss of shoulder range of motion. Clin Biomech (Bristol, Avon). Oct 2004;19(8):810-818.
22. Warner JJ, Allen AA, Marks PH, Wong P. Arthroscopic release of postoperative capsular contracture of the shoulder. J Bone Joint Surg Am. Aug 1997;79(8):1151-1158.
23. Tyler TF, Roy T, Nicholas SJ, Gleim GW. Reliability and validity of a new method of measuring posterior shoulder tightness. J Orthop Sports Phys Ther. Jun 1999;29(5):262-269; discussion 270-264.
24. Wang HK, Macfarlane A, Cochrane T. Isokinetic performance and shoulder mobility in elite volleyball athletes from the United Kingdom. Br J Sports Med. Feb 2000;34(1):39-43.

67
25. Ellenbecker TS, Roetert EP. Testing isokinetic muscular fatigue of shoulder internal and external rotation in elite junior tennis players. J Orthop Sports Phys Ther. May 1999;29(5):275-281.
26. Borsa PA, Wilk KE, Jacobson JA, et al. Correlation of range of motion and glenohumeral translation in professional baseball pitchers. Am J Sports Med. Sep 2005;33(9):1392-1399.
27. Downar JM, Sauers EL. Clinical Measures of Shoulder Mobility in the Professional Baseball Player. J Athl Train. Mar 2005;40(1):23-29.
28. Ellenbecker TS, Roetert EP, Bailie DS, Davies GJ, Brown SW. Glenohumeral joint total rotation range of motion in elite tennis players and baseball pitchers. Med Sci Sports Exerc. Dec 2002;34(12):2052-2056.
29. McCaw S. Qualitative biomechanical analysis to understand injury development. In: McGinnis P, ed. Biomechanics of Sport & Exercise. Champaign, Ill: Human Kinetics; 1999:350-351.
30. Khan AM, Guillet MA, Fanton GS. Volleyball: Rehabilitation & Training Tips. Sports Medicine & Arthroscopy Review. 2001;9:137-146.
31. Pappas AM, Zawacki RM, McCarthy CF. Rehabilitation of the pitching shoulder. Am J Sports Med. Jul-Aug 1985;13(4):223-235.
32. Harryman DT, 2nd, Sidles JA, Clark JM, McQuade KJ, Gibb TD, Matsen FA, 3rd. Translation of the humeral head on the glenoid with passive glenohumeral motion. Journal of Bone & Joint Surgery - American Volume. Oct 1990;72(9):1334-1343.
33. Kibler WB, McMullen J. Scapular dyskinesis and its relation to shoulder pain. J Am Acad Orthop Surg. Mar-Apr 2003;11(2):142-151.
34. Codine P, Bernard PL, Pocholle M, Benaim C, Brun V. Influence of sports discipline on shoulder rotator cuff balance. Med Sci Sports Exerc. Nov 1997;29(11):1400-1405.
35. McMaster WC, Long SC, Caiozzo VJ. Isokinetic torque imbalances in the rotator cuff of the elite water polo player. Am J Sports Med. Jan-Feb 1991;19(1):72-75.
36. McMaster WC, Long SC, Caiozzo VJ. Shoulder torque changes in the swimming athlete. Am J Sports Med. May-Jun 1992;20(3):323-327.
37. Chandler TJ, Kibler WB, Stracener EC, Ziegler AK, Pace B. Shoulder strength, power, and endurance in college tennis players. Am J Sports Med. Jul-Aug 1992;20(4):455-458.
38. Wilk KE, Andrews JR, Arrigo CA, Keirns MA, Erber DJ. The strength characteristics of internal and external rotator muscles in professional baseball pitchers. Am J Sports Med. Jan-Feb 1993;21(1):61-66.
68
39. Wassinger C, Myers J, Oyama S, Ricci R, Jolly J, Lephart S. Reliability and precision of measuring humeral rotation range of motion with a goniometer. unpublished data. 2005.
40. Myers J, Nagai T, Jolly J, Lephart S. Reliability and Precision of in-vivo scapular kinematic measurements using an electromagnetic tracking device. unpublished data: University of Pittsburgh; 2005.
41. Drouin JM, Valovich-mcLeod TC, Shultz SJ, Gansneder BM, Perrin DH. Reliability and validity of the Biodex system 3 pro isokinetic dynamometer velocity, torque and position measurements. Eur J Appl Physiol. Jan 2004;91(1):22-29.
42. Norkin C, White D. Measurement of Joint Motion: A guide to Goniemetry. 2 ed. Philadelphia, PA.: F.A. Davis Company; 1995.
43. Boon AJ, Smith J. Manual scapular stabilization: its effect on shoulder rotational range of motion. Arch Phys Med Rehabil. Jul 2000;81(7):978-983.
44. Meskers CG, Fraterman H, van der Helm FC, Vermeulen HM, Rozing PM. Calibration of the "Flock of Birds" electromagnetic tracking device and its application in shoulder motion studies. J Biomech. Jun 1999;32(6):629-633.
45. Stokdijk M, Nagels J, Rozing PM. The glenohumeral joint rotation centre in vivo. J Biomech. Dec 2000;33(12):1629-1636.
46. van der Helm FC. A Standardized Protocol for the Description of Shoulder Motions. International Shoulder Group of the International Society of Biomecanics. 2002.
47. Crotty NM, Smith J. Alterations in scapular position with fatigue: a study in swimmers. Clin J Sport Med. Oct 2000;10(4):251-258.
48. Cools AM, Witvrouw EE, Danneels LA, Vanderstraeten GG, Cambier DC. Test-retest reproducibility of concentric strength values for shoulder girdle protraction and retraction using the Biodex isokinetic dynamometer. Isokinetics and Exercise Science. 2002;10:129-136.
49. Karduna AR, McClure PW, Michener LA, Sennett B. Dynamic measurements of three-dimensional scapular kinematics: a validation study. J Biomech Eng. May 2001;123(2):184-190.
50. Borsa PA, Dover GC, Wilk KE, Reinold MM. Glenohumeral range of motion and stiffness in professional baseball pitchers. Med Sci Sports Exerc. Jan 2006;38(1):21-26.
51. Myers JB, Laudner KG, Pasquale MR, Bradley JP, Lephart SM. Glenohumeral range of motion deficits and posterior shoulder tightness in throwers with pathologic internal impingement. Am J Sports Med. Mar 2006;34(3):385-391.
52. Forthomme B, Croisier JL, Ciccarone G, Crielaard JM, Cloes M. Factors Correlated With Volleyball Spike Velocity. Am J Sports Med. Jul 11 2005.
69
53. Pieper H. Humeral torsion in the throwing arm of handball players. Am J Sports Med. 1998;26(2):247-253.
54. Reagan KM, Meister K, Horodyski MB, Werner DW, Carruthers C, Wilk K. Humeral retroversion and its relationship to glenohumeral rotation in the shoulder of college baseball players. Am J Sports Med. 2002;30(3):354-360.
55. Crockett HC, Gross LB, Wilk KE, et al. Osseous adaptation and range of motion at the glenohumeral joint in professional baseball pitchers. Am J Sports Med. 2002;30(1):20-26.
56. Osbahr DC, Cannon DL, Speer KP. Retroversion of the humerus in the throwing shoulder of college baseball pitchers. Am J Sports Med. 2002;30(3):347-353.
57. Pappas AM, Zawacki RM, Sullivan TJ. Biomechanics of baseball pitching. A preliminary report. Am J Sports Med. Jul-Aug 1985;13(4):216-222.
58. Kibler W, Chandler T, Livingston B, Roetert E. Shoulder range of motion in elite tennis players. Effect of age and years of tournament play. Am J Sports Med. 1996;24(3):279-285.
59. Krahl H, Michaelis U, Pieper H, Quack G, Montag M. Stimulation of bone growth through sports. A radiologice investigation of the upper extremities in preofessional tennis players. Am J Sports Med. 1994;22:751-757.
60. Khan AM, A. GM, S. FG. Volleyball: rehabilitation and training tips. Sports medicine and arthroscopy. Apr/June 2001;9:137-146.
61. Tyler TF, Nicholas SJ, Roy T, Gleim GW. Quantification of posterior capsule tightness and motion loss in patients with shoulder impingement. Am J Sports Med. Sep-Oct 2000;28(5):668-673.
62. Borsa PA, Timmons MK, Sauers EL. Scapular-Positioning Patterns During Humeral Elevation in Unimpaired Shoulders. J Athl Train. Mar 2003;38(1):12-17.
63. Sagano J, Magee D, Katayose M. The effect of glenohumeral rotation on scapular upward rotation in different positions of scapular-plane elevation. J Sport Rehabil. 2006;15:144-155.
64. Myers JB, Wassinger C, Oyama S, Jolly JT, Ricci RD, Lephart SM. Accuracy of and reliability of two common clinical posterior shoulder tightness assessments. Paper presented at: National Athletic Trainers' Association Annual Meeting, 2006; Atlanta, GA.
65. Laudner KG, Stanek JM, Meister K. A clinical measure for assessing posterior shoulder tightness. Paper presented at: National Athletic Trainers' Association Annual Meeting, 2006; Atlanta, GA.
66. Wilk KE, Meister K, Andrews JR. Current Concepts in teh rehabilitation of the overhead throwing athlete. Am J Sports Med. 2002;30(1):136-151.

70
67. Brooks G, Fahey T, White T, Baldwin K. Muscle Strength, Power, and Flexibility. Exercise Physiology: Human Bioenergetics and Its Applications. Third ed. New York, NY: McGraw-Hill; 2000:424-457.
68. Wilk KE, Suarez K, Chioccariello CJ, Reed J, Andrews JR. Scapular muscular strength values in professional baseball pitchers.(conference abstract). Physical Therapy. 1999;79(5):S81.
69. Ludewig PM, Cook TM. Translations of the humerus in persons with shoulder impingement symptoms. J Orthop Sports Phys Ther. Jul 2002;32(6):248-259.
70. Tsai NT, McClure PW, Karduna AR. Effects of muscle fatigue on 3-dimensional scapular kinematics. Arch Phys Med Rehabil. Jul 2003;84(7):1000-1005.
71. Ebaugh DD, McClure PW, Karduna AR. Scapulothoracic and glenohumeral kinematics following an external rotation fatigue protocol. J Orthop Sports Phys Ther. 2006;36(8):557-571.
72. Kibler WB. The role of the scapula in athletic shoulder function. Am J Sports Med. Mar-Apr 1998;26(2):325-337.
73. Meskers CG, Vermeulen HM, de Groot JH, van Der Helm FC, Rozing PM. 3D shoulder position measurements using a six-degree-of-freedom electromagnetic tracking device. Clin Biomech (Bristol, Avon). Jun 1998;13(4-5):280-292.
74. Laudner KG, Myers JB, Pasquale MR, Bradley JP, Lephart SM. Scapular dysfunction in throwers with pathologic internal impingement. J Orthop Sports Phys Ther. 2006;36(7):485-494.


