
Full Terms & Conditions of access and use can be found athttp://www.tandfonline.com/action/journalInformation?journalCode=tboc20
Download by: [University of Kiel] Date: 29 September 2016, At: 22:39
Biological Oceanography
ISSN: 0196-5581 (Print) (Online) Journal homepage: http://www.tandfonline.com/loi/tboc20
Quantitative Assessment of Oceanic Squid byMeans of Jigging Surveys
M. Murata
To cite this article: M. Murata (1983) Quantitative Assessment of Oceanic Squid by Means ofJigging Surveys, Biological Oceanography, 2:2-4, 433-456
To link to this article: http://dx.doi.org/10.1080/01965581.1983.10749469
Published online: 01 Oct 2013.
Submit your article to this journal
Article views: 26
View related articles
Citing articles: 1 View citing articles

Quantitative Assessment of Oceanic Squid by Means of Jigging Surveys*
M. Murata
Hokkaido Regional Fisheries Research Laboratory Katsurakoi 116, Kushiro, Hokkaido, Japan
Abstract There are many kinds of squid and cuttlefish in the oceans of the world, and the stock sizes of some are presumed to be large. However, few attempts have been made to quantitatively assess standing stocks. In Japan, the commercial yield ranges from 400,000 to 900,000 metric tons annually, accounting for about 50 to 80% of the total cephalopod catch in the world.
Jigging surveys have been conducted since 1971 in the Sea of Japan and since 1973 in the Pacific Ocean off Japan. Their purpose has been to assess the abundance of oceanic squid. The stock size index (N) and the density index (F) for Todarodes pacificus, Ommastrephes bartrami, and Onychoteuthis borealijaponica were calculated for the Pacific from 1968 to 1979 and for the Sea of Japan from 1971 to 1979. N and F correspond reasonably well to periodic changes in the annual yield ( Y) of T. pacificus in the Pacific and the Sea of Japan. Since Y is presumed to correspond well to abundance, the results of these surveys give rough estimates of T. pacificus abundance. Changes in N and F for 0. bartrami and 0. borealijaponica do not show good correspondence with Y, probably because the study area covers only a part of the range of the two species.
*Contribution of Hokkaido Regional Fisheries Research Laboratory C. 362.
Biological Oceanography, Volume 2, Number 2-3-4 0196-5581/83/010433-00$02.00/0 Copyright© 1983 Crane, Russak & Company, Inc.
433

434 M. Murata
The equation relating F and Y for T pacificus and 0. bartrami combined is
Y(tons) = 10,500 F + 16,300 (r = 0.972).
This relationship might be used as a first approximation for expected yield, but to make a precise assessment of the abundance of these oceanic squids it will be necessary to accumulate more biological data on their distribution and migration and to adjust the grid surveys accordingly.
Introduction
About 500 nominal species in 30 families of squid and cuttlefish exist in the oceans of the world (Okutani, 1977). They are diverse in form and nature. Some are active, strong animals while others live a more or less drifting life. They are a major prey item for nektonic fish, marine mammals, and birds, and they play important roles in the marine biotic community. However, many important details of their biology have not been clarified. Overall stock sizes are believed to be very large (Clarke, 1966; Gulland, 1970; Voss, 1973).
In Japan, cephalopods are an important fishery resource. Annual yield varied from 400,000 to 880,000 metric tons between 1960 and 1964. The Japanese common squid, Todarodes pacificus, accounts for about 70% of the total cephalopod catch.
There have been large fluctuations in the annual yield of T. pacificus. Catches were below 200,000 tons before 1946, but since then there has been a rapid increase, reaching a peak of 670,000 tons in 1968 with a gradual decrease since then (Fig. 1). Most T. pacificus are caught by jigging (Araya, 1967; Okutani, 1977). The squid fishing fleet is large, consisting of 31,877 boats of less than 30 gross tons, 1,831 medium boats of 30 to 99 tons, and 186large boats of 100 to 499 tons (1973 to 1977). Most of the yield is caught by the latter two size groups.
Scientific studies of T. pacificus began about 1950. Much information has accumulated since then about its population structure, distribution, migration, growth and lifespan, and reproduction (Soeda, 1956; Hamabe, 1961; Watanabe, 1965; Araya, 1967, 1976;

y ,l
O~oN
Fig
ure
1. A
nnua
l yi
eld
(Yin
met
ric
tons
) of
the
com
mon
squ
id T
. pac
ific
us in
Jap
an.
T, t
otal
; W
, w
inte
r po
pula
tion
; A
, au
tum
n po
pula
tion
; P
, in
the
wat
ers
off th
e Pa
cifi
c co
ast
of n
orth
east
ern
Japa
n.
~
~ ~ ~ .... <Q., r ;::;·
VJ
~ ~ ;:: v,

436 M. Murata
Ito, 1972; Murata et al., 1973; Kasahara, 1978). Based on this information, fisheries research laboratories and prefectural fisheries experimental stations began to issue fisheries forecasts for this species in 1965. They now forecast stock size, total yield, location of fishing grounds, etc., and release these data to the public. In 1974, fishermen began to catch 0. bartrami on a large scale and the annual yield is increasing rapidly.
The purpose of this paper is to assess the abundance of oceanic squid such as T. pacificus and 0. bartrami in the waters around Japan, based on the results of jigging surveys by several research vessels.
Methods and Procedure of Grid Survey The grid survey project was begun in 1971 for the Sea of Japan and in 1973 for the Pacific. Surveys were carried out twice a year, in spring and in autumn. The study areas were east of 130oE and between 36° and 45°N in the Sea of Japan (Kasahara, 1978), and west of 152oE and between 37o and 45°N in the Pacific (Murata et al., 1976). The purpose was to determine the stock size, the migration patterns, the formation of fishing grounds for T. pacificus, and to contribute to accurate fisheries forecasting. The Japan Sea Regional Fisheries Research Laboratory (Nisuiken) is responsible for the program in the Sea of Japan, while the Hokkaido Regional Fisheries Research Laboratory (Hokusuiken) covers the Pacific (in cooperation with prefectural fisheries experimental stations and fisheries high schools).
Test squid jigging was carried out by 6-12 research vessels, for 2-10 hours at each grid point, during a period of 5-10 days. All of the sampling was performed by automatic jigging machines (Igarashi et al., 1968) at night using fish lamps. Squid jigs were lowered primarily to depths between 50 and 70 m. It was assumed that the abundance of squid was proportional to the number caught per jigging machine per hour, despite differences in lamp power and in the number of jigging machines per ship. Stock size index (N) and density index (F) of squid were calculated, based on the results of these grid surveys and the method in Table 1 (Murata et al., 1976; Kasahara, 1978).

Assessment of Oceanic Squid 437
Table 1 Stock size index (N) and density index (F) of three oceanic squids based on the
grid survey in the waters off the Pacific coast of northeastern Japan in August-September of 1973 (From Murata et al., 1976).
T. pacificus 0. bartrami 0. borealijaponica
Class of CPUE A; N; A; N; A; N,
0 750 0 528 0 886 0 0-0.9 158 79 50 25 74 37
l.O ~ 4.9 153 459 121 363 83 249 5.0 ~ 9.9 16 120 74 555 29 218
10.0 ~ 29.9 6 120 103 2.060 ll 220 30.0 ~ 49.9 0 0 125 5.000 0 0 50.0 ~ 99.9 0 0 77 5.775 0 0
100.0 - 149.9 0 0 5 625 0 0
~;,"2-N; 1,083 778 1,083 14,403 1,083 724 F 0.72 13.30 0.67
A; = number of 10' X 10' squares of latitude and longitude within each contoured level of CPUE (number of squid per jigging machine per hour).
N; = A, X mid-class value of CPUE A = ~; N = "2-N; F = N/A (example: for T. pacificus, the number of squares with a CPUE between 10.0 and 29.9 is 6(=A;). The mid-class value is 20; thus N, = 6 X 20 = 120.)
Results
T. pacificus in the Waters Around Japan
According to Araya (1967), Ito (1972), and others, the population structure, the migration, and the lifespan of T. pacificus are summarized as follows:
There are three subpopulations of T. pacificus, each with different patterns of growth, maturity, migration, and breeding period. They are called winter, autumn, and summer populations. Their main spawning ground is the waters southwest of Japan. They migrate northward in spring and summer, and southward in autumn and winter. Adults are about 25 em in mantle length, and about 300 gin body weight. Their lifespan is about one year.
Of these three subpopulations, the winter population has the widest distribution. It migrates as far north as the southern Kuril

438 M. Murata
Islands on the Pacific side, and north to 50° or 51 oN in the Sea of Japan. This population is densely distributed in coastal waters and accounted for the greatest part of the total T. pacificus yield until about 1970 (Fig. 1). The autumn population has its highest density from the central waters offshore to the coast of the Asian continent in the Sea of Japan. With a rapid increase in yield due to the development of offshore fishing grounds in the Sea of Japan since 1970, the autumn population has become the main object of T. pacificus fishing in Japan (Fig. 1). The summer population is a local one, with the narrowest distribution of the three and a relatively low stock size.
T. pacificus in the Pacific
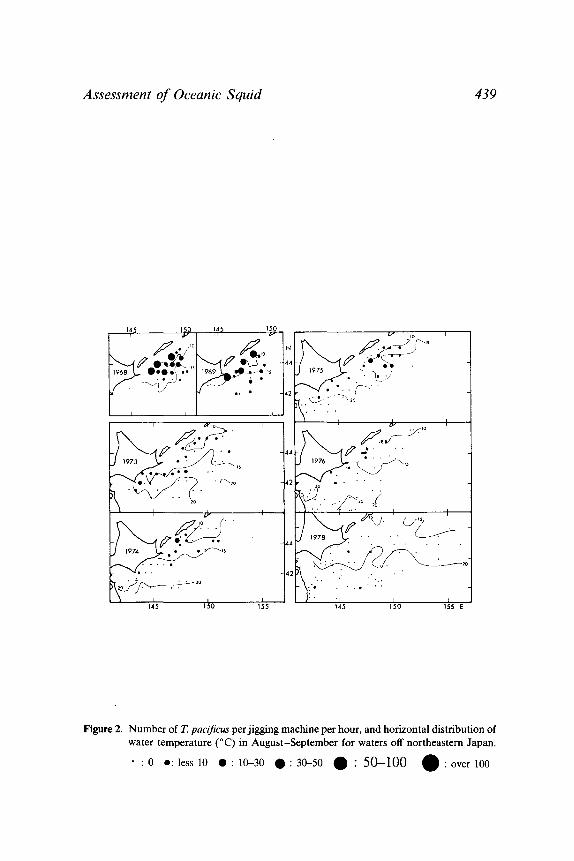
Fig. 2 shows the results of the grid surveys carried out in August and September between 1968 and 1978, when the distribution of T. pacificus spreads to the extreme north. The surveys in 1968 and 1969 were made by a single research vessel and the area covered was accordingly smaller than in other years. The data indicate a high density of T. pacificus from east of Hokkaido to the coast of the southern Kuril Islands, with a decrease in the offshore area. The abundance was highest in 1968 and 1969, but has decreased remarkably since 1973. Fig. 3 is a contour map obtained by connecting equal points of CPUE (number of squid caught per jigging machine per hour). Following the method shown in Table 1, I calculated the stock index (N) and the density index (F) forT. pacificus in each of eight years. N was highest in 1968 and was remarkably small in the years between 1973 and 1979, and the same is true for F (Table 2). N and F correspond reasonably well to the periodic change in the annual yield of T. pacificus ( Y in metric tons) in the northern fishing ground (Fig. 4). These results give the following relationship:
Y = 44.7 N + 3,250 (r=0.996) Y = 121,000 F + 19,900 (r=0.995)
Two limitations regarding these relations must be mentioned. First, since the area covered in 1968 and 1969 was about 20% of
Assessment of Oceanic Squid 439
Figure 2. Number ofT. pacificus per jigging machine per hour, and horizontal distribution of water temperature ("C) in August-September for waters off northeastern Japan.
• : 0 •: less 10 e : 10--30 e : 30--50 • : 50-100 • : over 100

N
44
~ ~
0 ~
150
E
~ Fi
gure
3.
Den
siti
es o
f dis
trib
utio
n fo
r fo
ur o
cean
ic s
quid
s pe
r jig
ging
mac
hine
per
hou
r in
Aug
ust-
Sep
tem
ber
of 1
973
off n
orth
east
ern
Japa
n. T
. p.
, ~
Tod
arod
es p
acif
icus
; O
m.
b.,
Om
mas
trep
hes
bart
ram
i; O
n. b
., O
nych
oteu
this
bor
ea/i
japo
nica
; G
. b.
, G
onat
opsi
s bo
real
is.
iS"

Assessment of Oceanic Squid 441
Table 2 Annual changes of stock size index (N) and density index (F) of three oceanic
squids based on the grid survey in the waters off the Pacific coast of northeastern Japan in August-September of 1968-1979 (from Murata et al.,
1976, and data of Hokusuiken).
Year
Species Index 1%8 1969 1973 1974 1975 1976 1978 1979
T pacificus N X 10' 104.5 80.5 7.8 5.1 21.1 1.0 0.5 0.3 F 38.06 28.06 0.72 0.61 3.06 0.12 0.04 0.02
0. bartrami N X 10' 5.6 3.7 144.0 47.6 75.9 139.1 199.7 151.7 F 2.05 1.29 13.30 5.72 11.01 16.51 15.23 10.84
0. borea/ijaponica N X 10' 8.9 3.4 7.2 40.9 28.5 47.95 6.7 6.7 F 3.23 1.17 0.67 4.91 4.12 5.69 0.51 0.48
Surveyed area (A) 275 287 1,033 832 690 842 1,311 1,400
that covered in 1973 to 1979, theN for the first two years is probably underestimated. Second, the Sea of Okhotsk, where the abundance of the squid is high, was not included. Yield is based on squid caught by many boats during the months from June to December in the Pacific including the Sea of Okhotsk.
T. pacificus in the Sea of Japan
Fig. 5 illustrates the results of the grid surveys carried out in May and June in 1973, which correspond to the early part of the northward migration period, and in August and September of the same year, which correspond to the early period of southward migration. These data demonstrate that the main distribution of T. pacificus is in the center of the Sea of Japan in May and June, and along the coast of Asia in August and September.
N and F values were also calculated, based on the grid surveys carried out during May-June and August-September in 1971 to 1979. (Table 3). The relationship between Y and N is shown in Fig. 6. Since the surveys in waters near the coast of the continent were limited, the stock size indices are shown in two ways. N (NB N2)
refers to the index including these waters and N' (N;, N;,) is the case where they are excluded. N' accounts for 40-80% of N in May-June, and 20-50% in August-September. These ratios sug-

4 Y
110
TO
N
50
40
y Q '
N \
\
' '
' ' \ 'o
~
·~.
-!::.. ~
__ Q
',
~
----
-----
..,.,
-~
1~ ~
~
n ~
~
~
~Y~R
~ Fi
gure
4.
Ann
ual c
hang
es o
f st
ock
inde
x (N
), d
ensi
ty in
dex
(F),
and
yie
ld (
Y)
ofT
. pac
ific
us in
the
wat
ers
off n
orth
east
ern
Japa
n (N
, F
fro
m T
able
2; ~
Y f
rom
Tab
le 4
).

N
Mo
y2
9-J
un
e 6
19
73
0 un
know
n ==
::===
rath
er d
ense
very
sca
tter
ed
-de
nse
scat
tere
d
Aug
. 2
8-
Sep
. 8
19
73
Fig
ure
5.
Dis
trib
utio
n of
T p
acif
icus
by
the
grid
sur
vey
in t
he S
ea o
f Ja
pan
in 1
973
(fro
m N
isui
ken
Res
earc
h D
ata,
73-
01,
73-0
2, 1
973)
.

444 M. Murata
Table 3 Annual changes of stock size index (N) and density index (F) of T. pacificus
based on the grid survey in the Japan Sea in 1971-1979.
May-June August-September
Survey Area I. Survey Area 2. Survey Area 3. Survey Area 4.
Year N, X 10' F, N; X 10' F' 1 N, X IO' F, N; X 10' F' 2
I97I I00.9 58.0 40.5 36.8 67.2 28.6 32.4 25.2 I972 61.0 36.7 31.4 28.5 66.6 28.4 29.0 22.5 I973 38.7 22.7 22.9 20.8 71.9 30.6 I4.7 I 1.4 I974 32.7 23.6 27.9 25.4 57.3 24.4 26.4 20.5 I975 40.3 26.9 25.2 22.9 49.3 21.0 I5.3 I 1.9 I976 29.6 I9.3 20.6 I9.6 29.3 I4.6 10.8 II.l I977 I 1.4 I2.3 I2.9 10.0 I978 I4.3 I3.0 I4.8 I 1.6 I979 20.8 I6.4 I8.4 I6.7 36.0 I5.4 I2.9 10.0
(From Kasahara, I978, and Nisuiken Research Data, 79-0I, 79-02, I979.) Survey area: (I) south of 42°N, (2) south of 4rN exclusive of the 200-miie limits of the USSR and North Korea, (3) south of 45o30'N, (4) south of 45°30'N exclusive of the 200-mile limits of the USSR and North Korea.
gest that the distribution of T. pacificus shifts from central waters towards the continental coast during June and September. N values of the May-June and August-September periods correspond roughly to the periodic change of Y after 1972 (Fig. 6). The following relationship was obtained:
May-June, Y = 2.77 N + 140,000 (r=0.869) August-September, Y = 2.06 N + 137,060 (r=0.797)
0. bartrami and 0. borealijaponica in the Pacific
With the decrease in the stock of T. pacificus, fishing for oceanic squid such as 0. bartrami has increased (Table 4). It is known that 0. bartrami is widely distributed in warm waters all over the world (Okutani, 1973). Remarkable increases have occurred in the number of fishing boats and in the extension of fishing grounds since squid boats began to catch this species in 1974. Until1977, 0. bartrami was caught by jigging between August and November. However, since 1978 drift gillnets have also come into use. This

4 Y
110T
ON
----
----
o....__
___ _____ 0
_0 __ 0"
" ~0
~o-o
,_
,_//----·~
~
·~:
I ·----~~
N,•
-...
• ~I
I '•,,,.
-"------
.......
N,•-
----
---.:
:-...
---
-:-•-.
_ ·--
---...
. ',
-....
. -''
........
......
•
T--
'•
----
---.
·T--
--
--
.. •I
· ---
---
-I--
----
-•
----
-.... -
---~-
----
T
74
~
1::;
~ ~ ~ - ~ 0 ~ ;::;· ~ ~
Fig
ure
6. A
nnua
l ch
ange
s of
sto
ck s
ize
inde
x (N
), d
ensi
ty i
ndex
(F
) an
d y
ield
(Y
ofT
. pa
cifi
cus
in t
he S
ea o
f Ja
pan.
N,,
N;;
in
May
-Ju
ne
(fro
m
-1::...
Tab
le 3
); N
, N
;; i
n A
ugus
t-S
epte
mbe
r (f
rom
Tab
le 3
). t;

Tab
le 4
A
nnua
l yi
elds
of
T. p
acifi
cus,
0.
bart
ram
i, an
d 0
. bo
rea/
ijapo
nica
in
the
wat
ers
off
the
Pac
ific
coa
st o
f no
rthe
aste
rn J
apan
.
Yea
r
Spe
cies
19
68
1969
19
70
1971
19
72
1973
19
74
1975
19
76
1977
19
78
T. p
acif
icus
49
2,97
3 33
7,13
2 17
8,99
4 11
1,97
1 17
2,20
6 38
,317
48
,416
77
,249
9,
507
6,54
3 4,
460
0.
bart
ram
i 0
0 0
0 0
0 17
,000
41
,000
84
,000
12
1,80
0 15
1,30
0 0
. bo
real
ijapo
nica
0
0 0
0 75
0 60
5,
000
0 2,
581
12
67
Un
its
are
tons
.
~ ~
0\ ~ f ~

Assessment of Oceanic Squid 447
species grows from 30 to 50 em in mantle length, and from 1 to 4 kg in body weight (Murata and Ishii, 1977; Naito et al., 1977a). They feed mainly on small fish such as myctophids (Naito et al., 1977b).
0. borealijaponica has not been a main objective of fishing because of its relatively low market price, but it has been landed along with the other two species. Information on the ecology of 0. borealijaponica is poor. They may grow to about 30 em in mantle length, and about 500 gin body weight (Murata and Ishii, 1977; Naito et al., 1977a). They feed on euphausiids, amphipods, and small fish (Naito et al., 1977b ).
These two species were also caught in the Pacific grid survey. 0. bartrami was widely distributed in the area studied, mainly in waters warmer than 15 oc (Fig. 7). 0. borealijaponica was densely distributed in waters from 10° to 15oC (Fig. 8). From these results, the stock size (N) and the density (F) indices were calculated (Table 2). Fig. 9 shows the relationship between N and F for the species and their annual yields (Yin metric tons). The periodic changes in N and Fare closely related to each other, but they do not always show good correspondence with the yield. This can be explained by the fact that the research area covers only part of the main distribution of the two species and that the yield does not always reflect the overall abundance. However, Nand F for 0. bartrami correspond well with Yin 1974 and 1975, and in 1978 and 1979 when the range of the fishing grounds was almost the same.
Discussion Assessment of the stock sizes of underexploited species of squid is a first step in developing them as resources. The methods of fishing for cephalopods are very diverse (Voss, 1973). However, I think that jigging is the best method for quantitatively fishing for oceanic squid.
The fishing grounds of T. pacificus cover most of the main distributional areas and fishing effort has been extremely large in recent years (Okutani, 1977; Doi and Kawakami, 1979; Murata and Araya, 1977). Annual yields of T. pacificus in the Pacific correspond well to both the change in abundance in this area and to the stock sizes of the winter population in the waters around Japan (Murata

448
.. •• -.-.-
145 150 155
F t/' .. . . . .
·. ~· ..
•
~· • • .,.--
•• . ... . .. 145 150
M. Murata
• • •
155 E
Figure 7. Number of 0 bartrami per jigging machine per hour, and horizontal distribution of water temperature ("C) in August -September for waters off northeastern Japan. See Fig. 2 for legend.

Assessment of Oceanic Squid 449
·~
155 E
Figure 8. Number of 0. borealijaponica per jigging machine per hour, and horizontal distribution of water temperature ("C) in August-September for waters off northeastern Japan. See Fig. 2 for legend.

4 Y
l10
TO
N
16
103
Nl
F
ypo-
1d
61-
Nl F
5~ 1
0
4 2
0MM
AST
RE
PHE
S B
AR
TRA
MI :,~~
.~
. .o-
·'
0NY
CH
OT
EU
TH
IS
BO
RE
AU
APO
NIC
A
./:\
/.
l~
1/~--i_:~o
\ _
,,'
. \
:'
~· \
: ~
\ '
\L,'
,'
75
76
Yo_
·a
N•~.
F~~ ~~
• •
78
79 Y
EAR
Figu
re 9
. A
nnua
l ch
ange
s o
f st
ock
size
inde
x (N
), d
ensi
ty in
dex
(F),
an
d y
ield
s (Y
) o
f tw
o oc
eani
c sq
uids
in th
e w
ater
s of
f nor
thea
ster
n Ja
pan
(N,
F
from
Tab
le 2
; Y
fro
m T
able
4).
~ ~ ~ ~ ;s-

Assessment of Oceanic Squid 451
and Araya, 1977). Stock sizes of the winter population have been at extremely low levels since 1973. Doi and Kawakami (1979) suggest that the stock of the winter population has decreased by about 85% in the past 10 years. This view is in agreement with the changes of N and F shown in Fig. 4. Most of the yield since 1971 in the Sea of Japan is thought to be from the autumn population. Since yield per fishing day per boat has decreased as fishing effort increased since 1971-1972, the autumn population has declined in size in recent years (Okutani, 1977). This trend corresponds roughly to the changes of N and F shown in Fig. 6.
Both the number of fishing days and the yield of 0. bartrami during 1976 and 1978 have increased, but yield per fishing day per boat has decreased (Table 5). The number of squid caught per fishing day per boat reached a high in 1977 and decreased in 1978 to a level lower than in 1976. The yield and yield per fishing day per boat in 1979 were below those in 1978. These data suggest that the stock size of 0. bartrami in 1979 has decreased to a level lower than in 1978, as shown by Nand Fin Fig. 9. Judging from these results, I believe that it is possible to assess the abundance of T. pacificus and 0. bartrami in the waters around Japan based on the results of jigging surveys by several research vessels.
The relationship between the density indices (F) of T. pacificus and 0. bartrami, as obtained in the grid surveys in the Sea of Japan and the Pacific, and their respective yield ( Y) is shown in Fig. 10. In the case of T. pacificus, Y varied from 170,000 to 490,000 metric tons when F ranged between 16 and 38, and Y was 4,000 to 80,000 tons when F was between 0 and 3. Here, Ys were based on the yield obtained through considerable fishing efforts in the main area of distribution during the period May-December. Y for 0. bartrami ranged from 20,000 to 150,000 tons for values ofF between 6 and 17. The following relationship between F and Y (in tons) for both species was obtained:
Y = 10,500 F + 16,300 (r = 0.972)
It is noteworthy that such a high positive correlation was found between F and Y calculated from different species in different waters. While more study is necessary to determine the general appli-

Tab
le 5
F
ishi
ng d
ays,
yie
lds,
and
cat
ches
per
fis
hing
day
per
boa
t fo
r 0
. ba
rtra
mi
by f
ishi
ng b
oats
ove
r 30
ton
s fr
om A
omor
i P
refe
ctur
e in
Jul
y-O
ctob
er.
Cat
ches
M
ean
body
wei
ght
Yie
lds
(Kg)
per
Y
ear
Fis
hing
day
s Y
ield
s (t
on)
(106
indi
vidu
al)
of s
quid
(g)
fi
shin
g da
y
1976
13
,133
28
,958
33
.8
857
2.20
5 19
77
33,0
95
58,7
25
101.
5 57
9 1.
774
1978
48
,855
64
,301
11
4.6
561
1,31
6
(Fro
m d
ata
of A
omor
i P
refe
ctur
al F
ishe
ries
Exp
erim
enta
l S
tati
on.)
Cat
ches
in
num
ber
per
fish
ing
day
2.57
4 3.
067
2,34
6
~ ~ ~ ~ ti

4 10
TO
N
0
X
X
• X
X
10
0
X
20
0 0
0
•
•
0
30
F
4
0
Fig
ure
10.
Rel
atio
nshi
p be
twee
n de
nsit
y in
dex
(F)
and
yiel
d (Y
) of
two
ocea
nic
squi
ds. o
T. p
acif
icus
in
the
Sea
of J
apan
in 1
972-
1979
(F,
ave
rage
of
May
-Ju
ne
and
Aug
ust-
Sep
tem
ber
from
Tab
le 3
). •T
. pac
ific
us i
n th
e w
ater
s of
f the
Pac
ific
coa
st o
f no
rthe
aste
rn J
apan
in 1
968-
1979
(F
fro
m T
able
2;
Yfr
om T
able
4).
X 0
. ba
rtra
mi i
n th
e w
ater
s of
f the
Pac
ific
coa
st o
f nor
thea
ster
n Ja
pan
in 1
974-
1979
(F
fro
m T
able
2;
Y f
rom
Tab
le 4
).
~
~
~ ~ ('1
) ;::: .... ~
0 (":> ~ ;::: ;::;·
V:l
~ iS:
~ t::

454 M. Murata
cation of this correlation, I hope it can be used to assess the stock size or potential yield of unexploited oceanic squid. F should be calculated for all the main distribution areas of the species in question so that Y will correspond to the largest possible yield obtainable through maximum fishing effort.
Squid and cuttlefish generally are attracted to small objects moving in the water. This behavior is used to advantage in squid jigging, but it is likely that it varies among species and among different stages of growth within the same species. For example, T. pacificus caught by jigging are mostly 12 to 25 em in dorsal mantle length, from immature to adult stage (Araya, 1967); however, it is difficult to catch either juvenile squid below 11 em or mature females in large numbers by jigging. While the yield of 0. bartrami by jigging generally shows a rapid decrease after November, a large yield was obtained by drift gillnets in almost the same fishing ground at this time of the year in 1978. One reason for this may be a change of feeding habits then. Squid jigs used for 0. bart rami are larger in size than those for T. pacificus. Thus, the effectiveness of jigging should be studied on squid from immature to the adult stages and at different stages of feeding activity. Furthermore, biological characteristics of the species in question must also be considered in order to determine the best size for jigs and the best method of jigging.
References
(The titles in Japanese, without English original titles, have been arbitrarily translated.) Araya, H. (1967). Resources of surume-ika (Todarodes pacificus). Suisan-Kenkyu
Sosho, Tokyo, 16, 1-60 (in Japanese). Araya, H. (1976). Migration and fishing ground of winter subpopulation of the
squid, (Todarodes pacificus) Steenstrup, in the northern waters of Japan. Bull. Hokkaido Fish. Res. Lab., (41), 119-129.
Clarke, M. R. (1966). A review of the systematics and ecology of oceanic squids. Adv. Mar. Bioi., (4), 91-300.
Doi, T., and T. Kawakami (1979). Biomass of Japanese common squid Todarodes pacificus Steenstrup and the management of its fishery. Bull. Tokai Reg. Fish. Res. Lab., (99), 65-83 (in Japanese with English title and summary).
Gulland, J. A. (ed.) (1970). The fish resources of the ocean. FAO Fish. Tech. Pap., (97), 425 pp.
Hamabe, M. (1961). Experimental studies on breeding habit and development of the squid, Ommastrephes sloani pacificus Steenstrup. IV. Larval structure par-

Assessment of Oceanic Squid 455
ticularly at rhynchoteuthion stage. Zoo!. Mag., 70 (12), 421-424 (in Japanese with English title and summary).
Igarashi, S., T. Mikami, and K. Kobayashi (1968). Studies on fishing gear. II. Automatic squid angling machine. 1. Motion of the fish-hook. Bull. Fac. Fish. Hokkaido Univ. 18 (4), 357-364 (in Japanese with English title and summary).
I to, S. ( 1972). Studies on mechanisms underlying the fluctuations in the catch, with reference to promotion of forecasting of fishing conditions of Japanese common squid, Todarodes pacificus Steenstrup. Technical Conference, Agriculture, Forestry and Fisheries (Norinsuisan Gijutsu Kaigi), Res. Rep., (57), 243 pp. (in Japanese).
Kasahara, S. (1978). Descriptions of offshore squid angling in the Sea of Japan, with special reference to the distribution of common squid (Todarodes pacificus Steenstrup ); and on the techniques for forecasting fishing conditions. Bull. Jap. Sea Reg. Fish. Res. Lab., (29), 179-199.
Murata, M., Y. Onoda, M. Tashiro, Y. Yamagishi, and T. Suzuuchi (1973). Ecological studies on the squid, Todarodes pacificus Steenstrup, in the northern waters of the Japan Sea in 1971. Bull. Hokkaido Reg. Fish. Res. Lab., (39), 1-25 (in Japanese with English title and summary).
Murata, M., M. Ishii, and H. Araya (1976). The distribution of the oceanic squid, Ommastrephes bartrami (Lesueur), Onychoteuthis borealijaponica Okada, Gonatopsis borealis Sasaki and Todarodes pacificus Steenstrup, in the Pacific Ocean off northeastern Japan. Bull. Hokkaido Reg. Fish. Res. Lab., (41), 1-29 (in Japanese with English title and summary).
Murata, M., and M. Ishii (1977). Some information on the ecology of the oceanic squid, Ommastrephes bartrami (Lesueur), and Onychoteuthis borealijaponica Okada in the Pacific Ocean off northeastern Japan. Bull. Hokkaido Reg. Fish. Res. Lab., (42), 1-24 (in Japanese with English title and summary).
Murata, M., and H. Araya (1977). Some problems on winter population stock of common squid, Todarodes pacificus. Research Collections in Japan Sea Block, (1), Jap. Sea Reg. Fish. Res. Lab., 1-13 (in Japanese).
Naito, M., K. Murakami, T. Kobayashi, N. Nakayama, and J. Ogasawara (1977a). Distribution and migration of oceanic squid Ommastrephes bartrami, Onychoteuthis borealijaponicus, Berryteuthis magister and Gonatopsis borealis) in the western subarctic Pacific region. Res. Inst. of North Pacific Fish., Fac. of Fish. Hokkaido Univ., Special Vol., 321-337 (in Japanese with English title and summary).
Naito, M., K. Murakami, and T. Kobayashi (1977b). Growth and food habit of oceanic squid Ommastrephes bartrami, Onychoteuthis borealijaponicus, Berryteuthis magister and Gonatopsis borealis) in the western subarctic Pacific region. Res. Inst. of North Pacific Fish., Fac. of Fish. Hokkaido Univ., Special Vol., 339-351 (in Japanese with English title and summary).
Nisuiken (Japan Sea Regional Fisheries Research Laboratory) (1973). Data on the fisheries and oceanic conditions of common squid in the Japan Sea in 1973.I,II. Research Data on Jap. Sea Reg. Res. Lab. 73-01 and 02 (in Japanese).
456 M. Murata
Okutani, T. (1973). Guide and keys to squid in Japan. Bull Tokai Reg. Fish. Res. Lab., (74), 83-111 (in Japanese with English title and summary).
Okutani, T. (1977). Stock assessment of cephalopod resources fished by Japan. FAO Fish. Tech. Pap., (173), 62 pp.
Soeda, J. (1956). Studies on the ecology and the breeding habits of the squid. Ommastrephes sloani pacificus (Steenstrup). Bull. Hokkaido Reg. Fish. Res. Lab., (14), l-24 (in Japanese with English title and summary).
Voss, G. L. (1973). Cephalopod resources of the world. FAO Fish. Circ., (149), 75 pp.
Watanabe, T. (1965). Ecological distribution of rhynchoteuthion larvae of common squid, Todarodes pacificus Steenstrup, in the southwestern waters off Japan during the winters, 1959-1962. Bull. Tokai Reg. Fish. Res. Lab., (43), 1-12 (in Japanese with English title and summary).


